 Maik Klie
 Stephan Schie
 Marcus Linde
 Thomas Debener
- 1Department of Molecular Plant Breeding, Institute for Plant Genetics, Leibniz Universität Hannover, Hannover, Germany
- 2Kleinwanzlebener Saatzucht AG formerly Rabbethge and Giesecke, Einbeck, Germany
- 3Saaten-Union Biotec GmbH, Leopoldshöhe, Germany
Polyploidy is a widespread phenomenon among higher plants and a major factor shaping the structure and evolution of plant genomes. The important ornamental chrysanthemum (Chrysanthemum indicum hybrid) possesses a hexaploid genome with 54 chromosomes and was classified based on its evolutionary origin and cytological methods as an allopolyploid. However, it is questionable whether cytological methods are sufficient to determine the type of ploidy, and there are more informative methods available based on molecular marker analyses. Therefore, we collected segregation data for 406 dominant molecular marker alleles [327 amplified fragment length polymorphism (AFLPs), 65 single-strand conformation polymorphism (SSCPs) and 14 microsatellites (EST-SSRs)] in a biparental F1 population of 160 individuals. We analyzed these data for the characteristics that differ between allopolyploids and autopolyploids, including the segregation ratio of each marker, the ratio of single-dose (SD) to multi-dose (MD) markers, the ratio of SD markers in coupling to those in repulsion and the banding patterns of the SSRs. Whereas the analysis of the segregation ratio of each polymorphic marker indicated disomic (13 markers) as well as hexasomic (eight markers) inheritance, the ratio of SD markers in coupling to those in repulsion was 1:0, which is characteristic of autopolyploids. The observed ratio of SD to MD markers was 0.67:0.33 which is significantly different to the expected segregation for auto- and allohexaploids. Furthermore, the three EST-SSR alleles were inherited in all possible combinations and were not independent of each other, as expected for fixed heterozygosity in allopolyploids. Combining our results with published cytological data indicates that cultivated chrysanthemums should be classified as segmental allohexaploids.
Introduction
Chrysanthemums (Chrysanthemum indicum hybrid, C. x grandiflorum or C. morifolium) are among the most economically important ornamental plants worldwide and are produced as cut flowers and as potted or garden plants. Chrysanthemums belong to the large plant family Asteraceae and are native to the Northern Hemisphere, primarily Europe and Asia (Dowrick, 1952). Cultivated chrysanthemums are generally believed to be the result of natural hybridization involving several different species, such as C. indicum L., C. morifolium, C. vestitum, and C. lavandulifolium (Vogelmann, 1969; Dai et al., 1998; Yang et al., 2006). These crosses led to the formation of a hexaploid hybrid complex with 54 chromosomes (Dowrick, 1953).
Because cultivated chrysanthemums resulted from hybridization events between different species, and because the occurrence of bivalent chromosomes is detected in meiosis in all four investigated polyploid Chrysanthemum accessions (Watanabe, 1977; Li et al., 2011), the cultivated forms are currently classified as allohexaploids. However, polyploid genomes can be highly dynamic, and Stebbins (1947) proposed that it might be difficult to unambiguously classify the type of ploidy of an organism. This was also indicated by Watanabe (1983) for the hexaploid C. japonense, which is not believed to be a progenitor of the C. indicum hybrid, reporting a very limited formation of multivalents (3.8%) using microscopic methods. In contrast, Watanabe (1977) and Li et al. (2011) state a clear autopolyploid behavior in cytological studies of Chrysanthemum species closely related to the ornamental types. Therefore, it is necessary to combine cytological and molecular methods to clarify the type of ploidy.
Polyploids are classified into the two major categories of auto- and allopolyploids. Allopolyploids are characterized by preferential pairing of chromosomes or fixed heterozygosity, which results from the combination of divergent parental genomes, bivalent chromosome formation in meiosis and disomic inheritance at each locus. In contrast, for autopolyploids the formation of multivalent chromosomes and polysomic inheritance is generally assumed (Stebbins, 1947; Soltis and Soltis, 2000). However, in addition to these extremes, intermediary forms have also been described (Stebbins, 1947; Sybenga, 1969).
In addition to cytological methods, Wu et al. (1992) described the usefulness of single-dose (SD) molecular markers to distinguish allopolyploidy from autopolyploidy. SD markers are characterized by only one dominant marker allele at a single locus and can be distinguished from MD markers by determining the means of the corresponding recombination frequencies (Mather, 1957). Silva et al. (1993) determined the theoretical ratios of SD to MD markers for allo- and autopolyploids, which might indicate the ploidy type of an organism. A SD marker present in only one parent (uniparental marker) has a theoretical segregation ratio of 1:1 (presence: absence) in an F1 progeny of both autopolyploids and allopolyploids. Likewise, biparental markers will segregate in a 3:1 (presence:absence) ratio in both auto- and allopolyploids. In contrast, MD markers have more complex segregation ratios that differ between autopolyploids and allopolyploids. The expected ratios for SD to MD markers is 0.625:0.375 in allopolyploids and 0.75:0.25 in autopolyploids (Silva and Sorrells, 1996) so that the type of ploidy can be inferred if a larger number of markers is tested for SD versus MD segregation.
Furthermore, Wu et al. (1992) used SD markers for 75 individuals and showed a linkage in the coupling phase for allo- and autopolyploids, whereas a linkage in the repulsion phase can be detected only in allopolyploids. By calculating the ratio of markers in coupling to those in repulsion, it is possible to distinguish allopolyploidy (ratio of 1:1) from autopolyploidy (ratio of 1:0 for polyploids above tetraploidy). Additionally, the banding patterns of sequence specific markers, such as SSRs, reflect the distributions of the homologous and homeologous chromosomes within the progeny. Thus, this type of marker is informative in determining the pairing of the chromosomes, as it indicates the occurrence of fixed heterozygosity and therefore also the type of ploidy.
By using molecular markers, we sought to determine whether the classification of chrysanthemum as allo-hexaploid, based on cytological methods, is conclusive. Knowledge about the type of ploidy is of interest from an exploratory and a breeder’s point of view because desirable alleles cannot be freely combined in allo-hexaploid genotypes. Therefore, we describe the use of amplified fragment length (AFLP), single-strand conformation polymorphism (SSCP) and microsatellite (SSR) markers in a segregating biparental F1 population to investigate the type of ploidy of cultivated chrysanthemums. Additionally, we compare our results with previously published cytological data.
Materials and Methods
Plant Material
We established a segregating biparental F1 population (MK11/3) of 160 individuals by crossing the female parent C. indicum hybrid “Kitam” (541) with the paternal parent “Relinda” (VZR), which is a registered C. indicum hybrid variety. Three cuttings of each genotype were cultivated with 48 plants per m2 in plots of 12.5 cm × 12.5 cm. The plants were grown in a fertilized substrate (a mixture of peat moss and chalked compost soil) in a greenhouse under a 16 h light/8 h dark cycle at a constant temperature of 22°C.
DNA Extraction
For the DNA extraction, 70 mg of unfolded, young leaves was used. The plant material was dried overnight at 37°C, frozen in liquid nitrogen and ground using a bead mill. The extraction was performed using the NucleoSpin Plant II Kit from Macherey and Nagel (Düren, D) following the manufacturer’s instructions, with minor modifications. The concentration of genomic DNA was assessed spectrophotometrically at 260 nm and was evaluated for purity by determining the OD 260 nm/280 nm and the OD 260 nm/230 nm ratios. The DNA quality was assessed by agarose gel electrophoresis.
Marker Analysis
AFLP analysis
The AFLP analysis was performed as described previously (Vos et al., 1995), with minor modifications according to Klie et al. (2013). For each sample, 100 ng of DNA was digested with 9 U HindIII (Fisher Scientific – Germany GmbH, Schwerte, D) and 3.5 U MseI (Fisher Scientific - Germany GmbH, Schwerte, D). The preamplification reactions were performed with specific primers that had an A as a selective base at the 3′ end [HindIII (5′-AGACTGCGTACCAGCTT-A-3′) and MseI (5′-GACGATGAGTCCTGAGTAA-A-3′)]. HindIII (5′-AGACTGCGTACCAGCTT-ANN-3′) primers with two extra selective bases and MseI (5′-GACGATGAGTCCTGAGTAA-ANNN-3′) primers with three extra selective bases were used for the final amplification. The HindIII primers were end-labeled with an infrared dye (either IRD 700 or IRD 800; Eurofins MWG, Ebersberg, D). In a single PCR reaction, labeled primers were used either as single primers or in combinations of two differently labeled primers (IRD 700 and IRD 800). In total, 21 selective primer combinations were analyzed (Table 1). The fragments were separated on 6 % polyacrylamide gels (Sequagel XR, Hessle, UK) using a DNA analyzer (LI-COR, Lincoln, Nebraska, USA) and automatically processed using the e-Seq-Software (V3.0, LI-COR, Lincoln, Nebraska, USA).
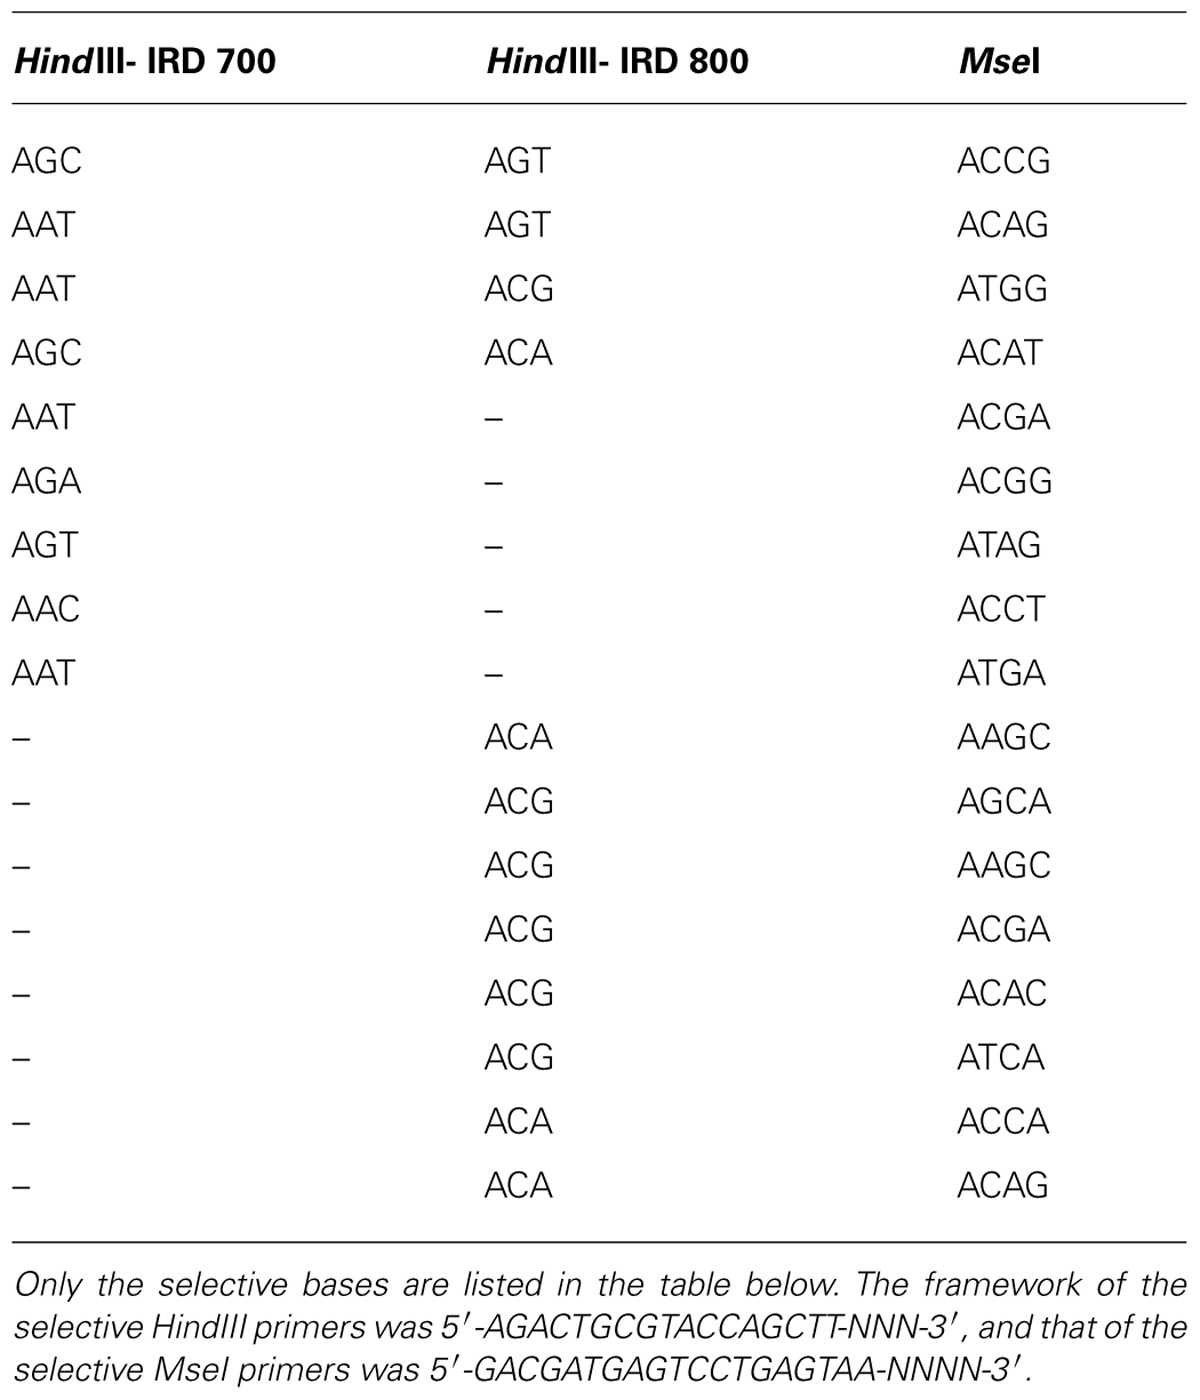
TABLE 1. The primer combinations used for the amplified fragment length polymorphism (AFLP) analysis.
SSCP markers for candidate genes
Mutant screens in Arabidopsis and other plants identified several genes that control shoot branching and are involved in strigolactone biosynthesis and perception. Some of these genes, such as CCD8 (Liang et al., 2010), MAX2 (Dong et al., 2013) and BRC1 (Chen et al., 2013), have also been characterized in chrysanthemum. In addition, we isolated a CCD7 homolog from chrysanthemum (unpublished) and screened this sequence and those of the other genes containing polymorphisms using SSCP analysis. Several primer pairs were used that covered various fragments of each candidate gene (Table 2). Most of the PCR products were IRD-labeled using the universal M13 sequences (5′-GTAAAACGACGGCCAGT-3′ for the forward primer and 5′-CAGGAAACAGCTATGAC-3′ for the reverse primer) at the 5′ end (Schuelke, 2000). The PCR conditions were as follows: 0.2 μM of each unlabeled primer, 0.07 μM of each labeled primer and 0.07 μM of a M13 primer end-labeled with either the IRD 700 dye or the IRD 800 dye (Eurofins MWG, Ebersberg, D) in a final 25 μL reaction volume [2x Williams Buffer, 0.16 mM dNTPs, 0.7 U DCS-Taq polymerase (Enzymatics, Beverly, MA, USA) and 30 ng template DNA]. The conditions of the PCR amplification were as follows: 95°C (3 min), then 25 cycles at 94°C (30 s)/58°C (30 s)/72°C (45 s), followed by eight cycles at 94°C (30 s)/52°C (45 s)/72°C (60 s), and a final extension at 72°C for 10 min. All other PCR products, which were visualized by silver staining according to the protocol of Sanguinetti et al. (1994), were amplified by a standard PCR reaction in a final reaction volume of 20 μl containing 1x Williams Buffer, 0.2 mM dNTPs, 0.5 μM primers, 0.5 U DCS Taq polymerase and 30 ng template DNA. The conditions of the PCR amplification were as follows: 95°C (3 min), then 30 cycles at 94°C (30 s)/60°C (60 s)/72°C (60 s), followed by a final extension at 72°C for 10 min. An equal volume of SSCP dye (95 % formamide, 0.01 M NaOH, 0.05% xylene cyanol, and 0.05% bromophenol blue) was added to each PCR reaction, and this step was followed by denaturing the samples for 3 min at 95°C. The denatured samples were immediately placed on ice prior to loading onto cooled (10°C) 0.5x MDE gels [0.5x MDE® gel solution (Lonza Group Ltd., Basel, SUI), 0.6x long run TBE (80.4 mM Tris, 7.5 mM boric acid, and 1.5 mM EDTA), 8.3% glycerine, 0.05% APS, 10 μl TEMED and ad 15 ml water]. IRD-labeled single strands were detected with the Odyssey® Infrared Imaging System (LI-COR, Lincoln, Nebraska, USA) and automatically documented using Odyssey Software (V3.0, LI-COR, Lincoln, Nebraska, USA). The non-IRD-labeled single strands were visualized by silver staining according to the protocol of Sanguinetti et al. (1994).
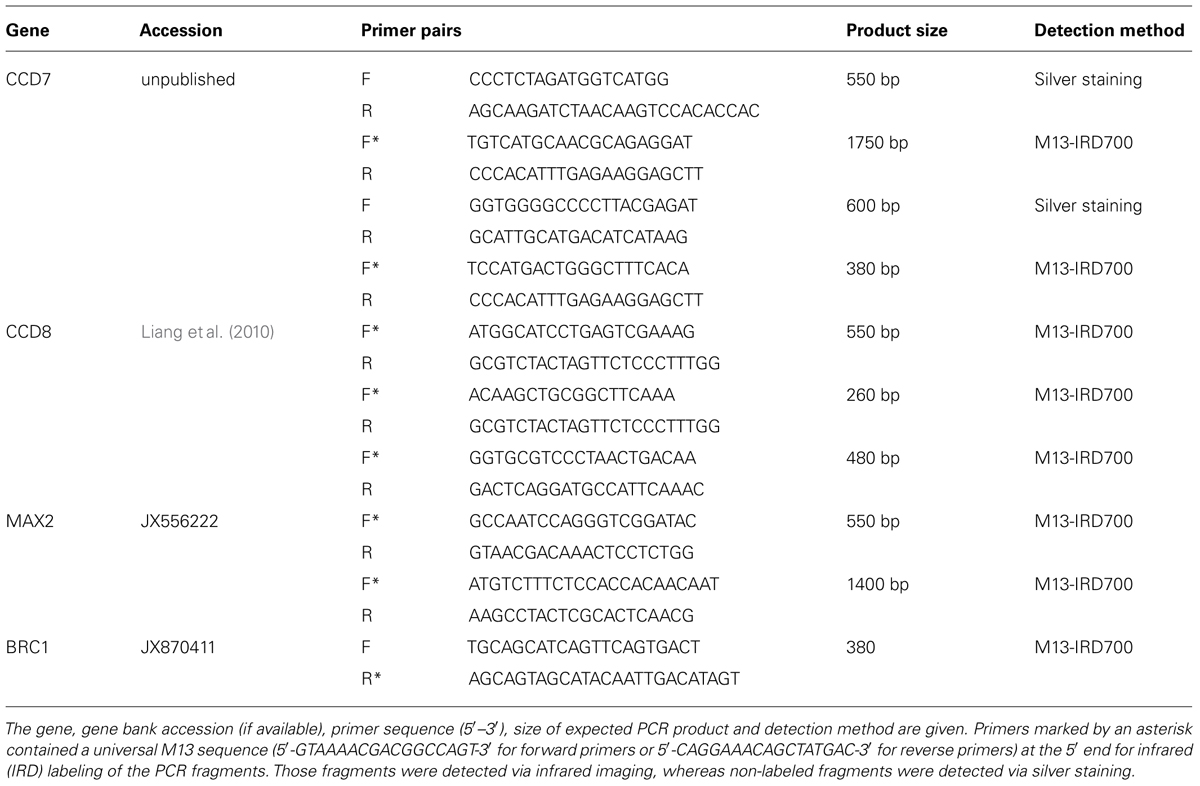
TABLE 2. A list of the primer pairs for the candidate genes CCD7, CCD8, MAX2, and BRC1 used in the single-strand conformation polymorphism (SSCP) analysis.
EST-SSR markers
Sequence information for 7009 ESTs from Chrysanthemum morifolium was downloaded from NCBI (November 2010). These ESTs were screened for mono-, di-, tri-, tetra-, penta-, hexa-, and hepta-nucleotide motifs of microsatellites with a copy number of at least four repeats using the tandem repeat finder (Benson, 1999). For the 21 SSR-containing ESTs, primer pairs were designed using the Primer3Plus software (Untergasser et al., 2007) with the default settings. Each forward primer was extended by a universal M13 sequence tag (5′-GTAAAACGACGGCCAGT-3′) at the 5′ end for IRD-labeling of the PCR fragments (Schuelke, 2000). The three EST-SSR markers (Table 3) were used on the entire population using the PCR conditions as described previously. The PCR products were separated on 6% polyacrylamide gels (Sequagel XR, Hessle, UK) using a DNA Analyzer (LI-COR, Lincoln, NE, USA) and automatically documented using e-Seq-Software (V3.0, LI-COR, Lincoln, Nebraska, USA).
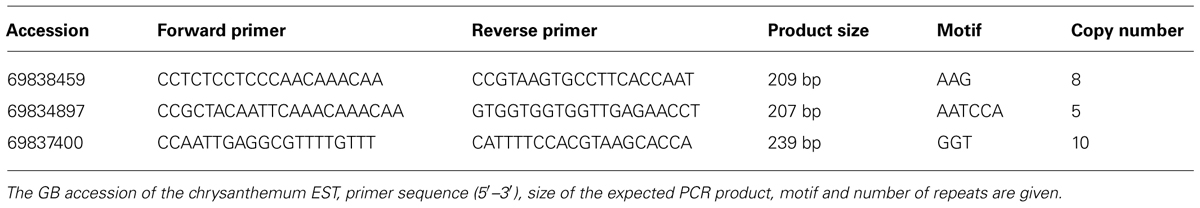
TABLE 3. List of the three polymorphic EST-SSR markers used on the chrysanthemum MK11/3 population.
Data Analysis
The marker banding patterns for each genotype were visually scored as present (1), absent (0), or ambiguous (?).
According to Mather (1957), the uniparental and biparental markers were classified as SD or MD markers using the geometric means between the two segregation distributions. For the uniparental markers, the geometric mean was calculated between the 1:1 and the 3:1 distribution by the formula  = 1.73 as the point for selection, whereas for the biparental markers, the mean between the 3:1 and 15:1 distribution was determined by the equation
  = 6.71 for selection (Grivet et al., 1996). For each marker, the segregation ratio was estimated and compared to the corresponding selection point. Markers with ratios below this point were classified as SD markers, and those with ratios above the threshold were classified as MD markers. Silva et al. (1993) estimated the theoretical proportion of SD to MD markers as 0.625–0.375 for allopolyploidy and and 0.75 to 0.25 for autopolyploidy in hexaploids. We compared our calculated ratios to these ratios using the chi-square test in the R software (version 2.15.2, R Core Team, 2012).
By determining the ratio of SD markers in coupling to those in repulsion in a population of 75 individuals, Wu et al. (1992) distinguished allopolyploidy (ratio of 1:1) from autopolyploidy (ratio of 1:0). We estimated this ratio using the previously selected uniparental SD markers of the MK11/3 population for each parent. We generated linkage maps with a maximal recombination frequency of 0.35 for 75 randomly selected offspring in the backcross-1 (BC1) mode of JoinMap version 4 (Van Ooijen, 2006). The markers were placed into linkage groups based on their independent LOD values, which ranged from 4 to 10. The marker distances in centimorgans were calculated using Kosambi’s mapping function. Subsequently, the values of the marker data matrix were inverted so that the present bands were coded as absent and the absent bands were coded as present. These inverted markers were integrated into the previously calculated maps. The markers that were linked in the original dataset were designated to be in coupling, and the markers that showed linkage between the original and the inverted datasets were designated to be linked in repulsion (Ukoskit and Thompson, 1997; Kriegner et al., 2003). The resulting ratio of markers in the coupling to the repulsion phase was compared to the assumed ratios (Wu et al., 1992) for allopolyploidy (1:1) and autopolyploidy (1:0 for polyploids above tetraploidy) using the chi-square test in the R software (version 2.15.2, R Core Team, 2012).
Results
Molecular Marker Data for the MK11/3 Population
Allo- and autohexaploids differ in their segregation ratios, their ratios of marker dosage and their ratios for markers in coupling to those in repulsion. Therefore, we used various molecular markers, such as AFLP, SSCP, and SSR markers, to investigate the inheritance patterns in chrysanthemum.
All of the segregating marker fragments were analyzed dominantly because of the complex banding patterns for even single-locus markers, such as SSR or SSCP markers, in a hexaploid genome. In total, 406 polymorphic markers were scored in the MK11/3 population. The vast majority were AFLP markers with 327 fragments derived from 21 primer combinations, followed by 65 SSCP marker fragments for the candidate genes CCD7 (29 fragments), CCD8 (16 fragments), MAX2 (8 fragments), and BRC1 (12 fragments) and 14 DNA fragments derived from the three EST-SSRs.
Marker segregation types of 1:0 or 7:1 are expected for an allopolyploid organism, and types of 4:1 or 9:1 are expected for an autopolyploid organism. Accordingly, all of the polymorphic markers were tested to determine whether their segregation ratios were consistent with autopolyploidy or allopolyploidy by the chi-square test (Table 4). For 204 of the total 406 markers significant possible segregation types were assigned by the statistical test. Not all markers could be assigned because a large number of individuals is needed to clearly distinguish between different segregation types (e.g., a hexasomic 15:1 or a disomic 24:1 segregation). The 1:1 segregation pattern does not distinguish between the types of ploidy and is therefore not informative. A large proportion of the markers (34) displayed a skewed segregation and did not fit to any of the ratios diagnostic for allo- or autopolyploidy. In total, 13 markers segregated in a disomic manner, with four, four and two of them linked to each other, whereas eight markers showed a 4:1 ratio that is characteristic of hexasomic inheritance. Therefore, there are more markers indicating a disomic inheritance, as expected for an allo-hexapolyploid genome.
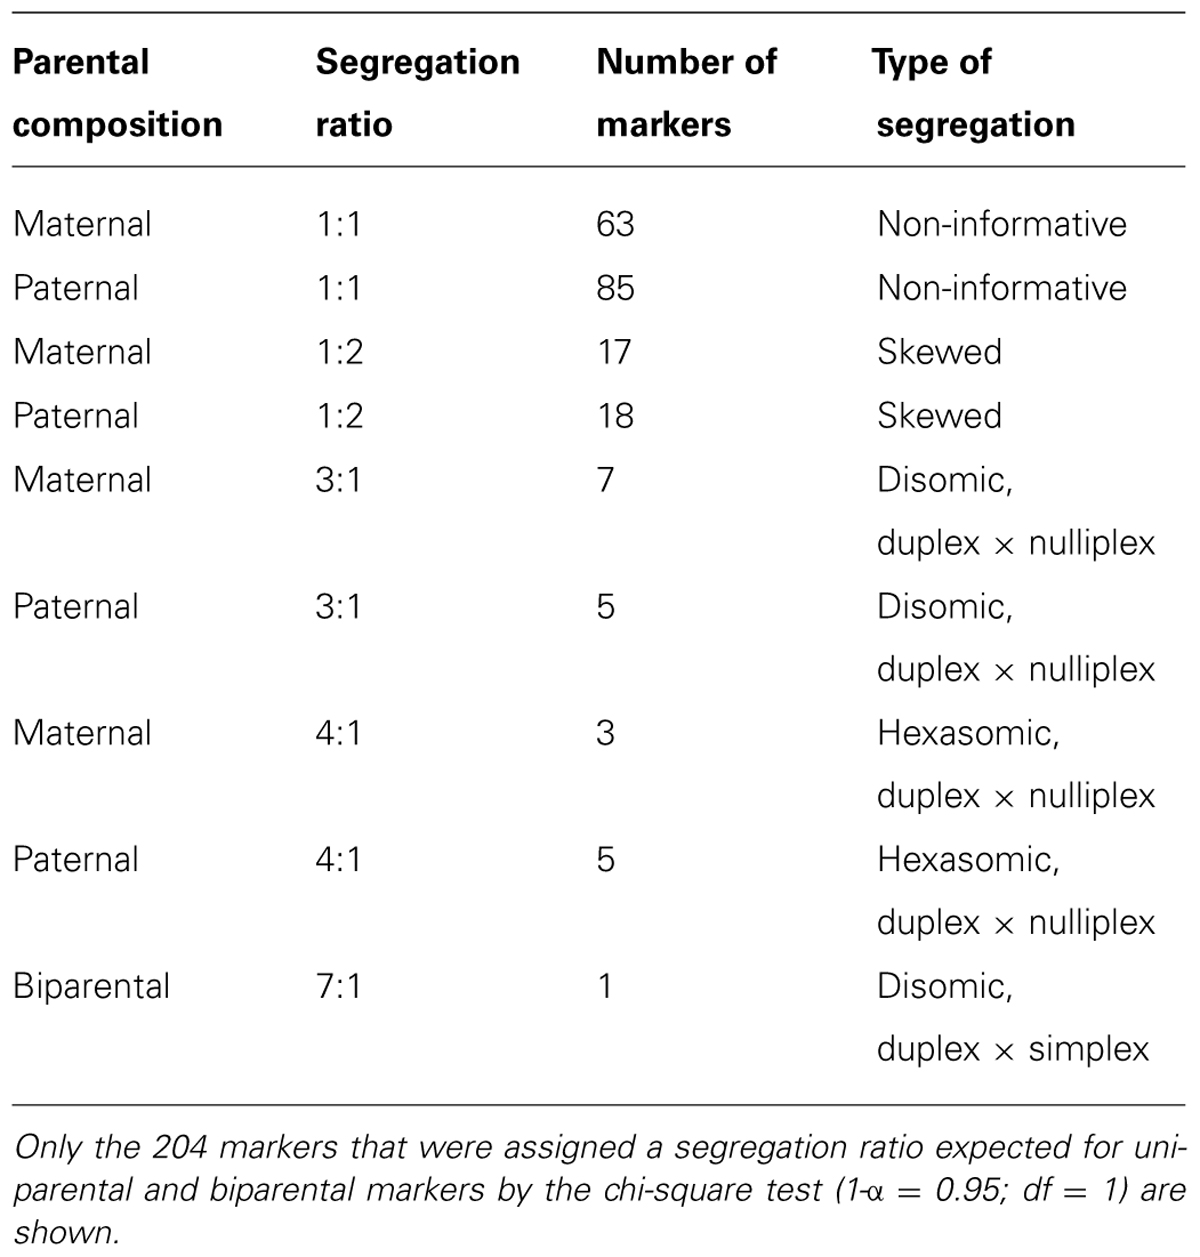
TABLE 4. The marker segregation types for the MK11/3 population.
The Segregation Patterns of SSR Marker Fragments
The three SSR markers amplified four (marker 69838459) or five (markers 69834897 and 69837400) fragments. An example of the segregation pattern of the EST-SSR marker 69834897 is given in Figure 1. This marker amplified five alleles in the progeny MK11/3, of which four (A–D) were polymorphic between the maternal (541) and paternal parents (VZR). For all three EST-SSRs, an independent assortment of the amplified alleles was observed, as expected for polysomic inheritance. No cosegregation of specific alleles was observed, nor was any allele combination found to exclude another, as would be expected in the case of disomic inheritance with fixed heterozygosity in allopolyploids.
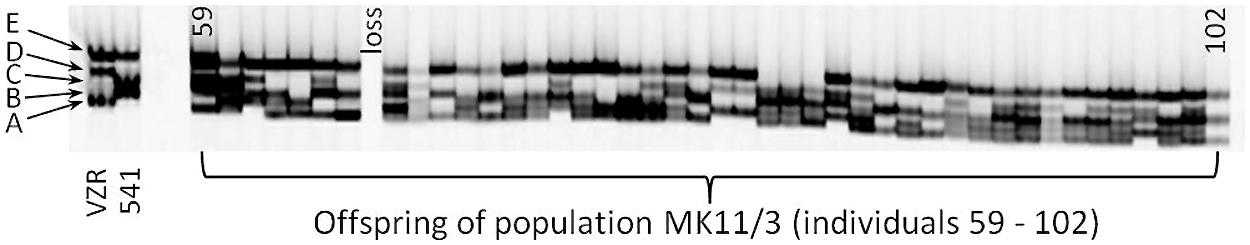
FIGURE 1. The segregation pattern of EST-SSR 69834897 for selected individuals from the MK11/3 population. Different genotypes are represented by individual lanes. The maternal parent 541 and the paternal parent VZR are shown on the left side of the gel. The three alleles of each parent are indicated as A to E, with E being present in both genotypes.
Marker Dosage Ratios
Of the 406 segregating uni- and biparental markers, 273 were classified as SD markers and 133 were classified as MD markers according to their segregation ratios (Mather, 1957). The ratio of SD to MD markers was estimated to be 0.67–0.33 and was compared to the theoretical proportion of SD to MD markers indicative of auto- and allopolyploidy (Silva et al., 1993; Silva and Sorrells, 1996; Ukoskit and Thompson, 1997) using the chi-square test (Table 5). The ratio was significantly different from the expected ratio for allopolyploidy and for autopolyploidy, although the ratio was closer to the values expected for allohexaploids.
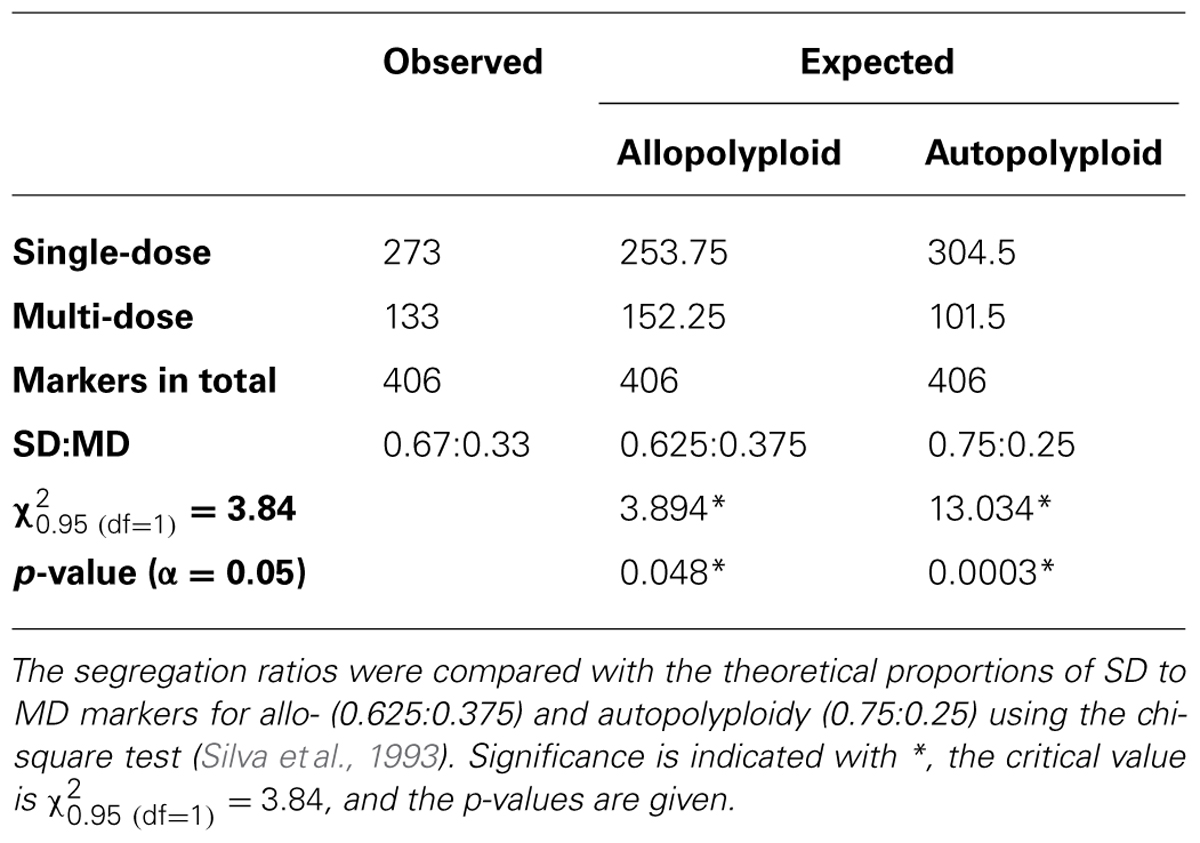
TABLE 5. The ratios of single-dose (SD) to multi-dose (MD) markers in the MK11/3 population.
An Analysis of Marker Linkage
Of the previously selected 245 SD markers, 80 markers were biparental and 165 were uniparental. These uniparental SD markers (81 for the maternal parent 541 and 84 for the paternal parent VZR) we used to identify markers in the coupling and the repulsion phases by a mapping approach. For 71 (32 for 541 and 39 for VZR) of the 165 markers, we showed linkage in coupling, whereas no markers were linked in repulsion and had LOD scores greater than 1.0. Therefore, the ratio of markers in coupling to those in repulsion was 1:0 (Table 6), as expected for an autopolyploid organism with a ploidy degree above tetraploidy.
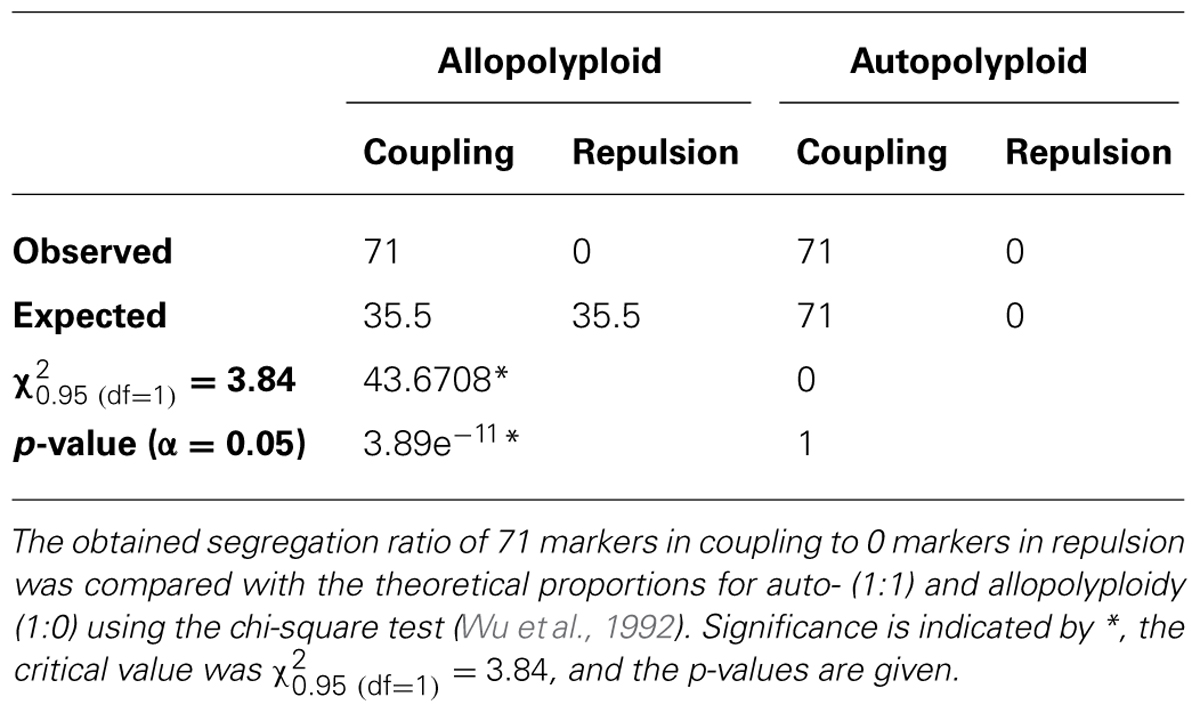
TABLE 6. The ratios of the uniparental SD markers linked in coupling to those in repulsion for the MK11/3 population.
Discussion
Based on their evolutionary origin and published cytological analyses, cultivated chrysanthemums have been mainly classified as allopolyploid plants (Watanabe, 1977, 1983; Li et al., 2011). However, several studies raised questions regarding whether the behavior of meiotic chromosomes is an appropriate indicator of the type of ploidy and therefore if the formation of bivalents or multivalents is a reliable indicator of whether a species is genetically an autopolyploid with tetrasomic inheritance or an allopolyploid with disomic segregation (Soltis and Rieseberg, 1986; Krebs and Hancock, 1989; Sybenga, 1996; Qu et al., 1998). With the advent of molecular markers as an informative genomic tool, Wu et al. (1992) and Silva et al. (1993) described effective methods based on SD markers to distinguish allopolyploids from autopolyploids. Therefore, we used molecular markers (AFLP, SSCP, and SSR,) to investigate the type of ploidy of cultivated chrysanthemums.
In total, we scored 406 polymorphic markers in the F1 MK11/3 population. Characteristic segregation ratios for allo- (e.g., 1:0 or 7:1) and autopolyploids (e.g., 4:1 or 9:1) have been established based on the type of ploidy of a genome. By using the chi-square test, the ratios of all of the segregating markers were compared to the theoretically expected segregation ratios. The vast majority of the markers (148) were not informative because they segregated in a ratio of 1:1, which is expected for a uniparental SD marker for allo- as well as autopolyploids. Additionally, 35 markers displayed skewed segregation ratios, which is a common phenomenon in plants (Mccouch et al., 1988; Gardiner et al., 1993; Wang et al., 1998) and has been reported for chrysanthemum (Zhang et al., 2010). Of the other markers, 13 segregated in a disomic manner (uniparental 3:1, 7:1 with some of them in linkage), which would be expected for an allopolyploid, whereas eight markers displayed a 4:1 ratio, which suggests a hexasomic inheritance between a duplex and a simplex marker. Indeed, it is difficult to reliably distinguish among several similar segregation ratios, as this requires a large number of individuals. Langton (1989) also described the hexasomic inheritance of the carotenoid pigmentation in chrysanthemums, but even this study was not considered as conclusive by the author himself because of conflicting results of Jordan and Reimann-Philipp (1983) on the inheritance of anthocyanin pigmentation. Also the analysis of the marker dosages, which revealed a 0.67 to 0.33 ratio of SD to MD markers, showed significant differences to the ratios expected for both, disomic (0.625:0.375) and hexasomic (0.75:0.25) inheritance (Silva et al., 1993; Silva and Sorrells, 1996; Ukoskit and Thompson, 1997).
Therefore, we analyzed the segregation patterns of three EST-SSRs in addition to the AFLP markers. For each marker, the alleles were inherited in all possible combinations and not independent of each other, as would be expected for fixed heterozygosity. This result indicates polysomic inheritance, as expected for autopolyploids. Therefore, it is very likely that the progenitors of cultivated chrysanthemums were phylogenetically closely related (Dai et al., 1998; Wang et al., 2002).
Furthermore, we did not detect any markers linked in repulsion in our mapping approach. This result also supports our hypothesis that chrysanthemums display polysomic inheritance. Two other published mapping approaches in chrysanthemums provide no information about the type of linkage of the mapped markers (Zhang et al., 2010, 2011). By increasing the number of markers, the mapping resolution could be improved, but this does not explain the lack of markers linked in repulsion in our study.
To summarize our marker results, two methods (segregation patterns of SSRs and the ratios for markers in coupling to those in repulsion) clearly showed a polysomic inheritance in chrysanthemums, as is characteristic of an autopolyploid. Nevertheless, some markers segregated in a disomic manner and the ratio of marker dosages was close to the expected ratio for disomic inheritance, but not significant. Therefore, the inheritance in chrysanthemum seems to be mainly polysomic with a random assortment of homologs, but there are a few loci with disomic inheritance as well due to a partial preferential pairing of chromosomes. This mixed inheritance has already been detected in cytological studies in chrysanthemum that reported the predominant formation of bivalent chromosomes and the occurrence of multivalent chromosomes, though only in a small proportion (Dowrick, 1953; Chen et al., 2009; Li et al., 2011). Such intermediates have also been described in strawberries (Lerceteau-Kohler et al., 2003), rapeseed (Udall et al., 2005), and yellow cress (Stift et al., 2008). Thus, we propose to classify cultivated chrysanthemums as segmental allopolyploids according to Stebbins (1947).
This change in classification is important for the breeding progress of chrysanthemums. If chrysanthemums were strict allopolyploids, the free combination of desirable alleles would not occur. In our study, we showed that most molecular markers were inherited in a polysomic manner. Therefore, the desirable alleles can be enriched in the gene pool independently of their subgenomic origins. Finally, the complex inheritance of ornamental traits in a segmental allo-hexaploid plant limits the effectiveness of marker-assisted selection, and phenotypic selection should be prioritized.
As Stebbins noted decades ago, it might be difficult to unambiguously determine the type of ploidy of an organism. In addition to cytological methods, molecular markers are useful tools with which to investigate the type of ploidy, and the combination of both approaches might be necessary to reveal the true type of ploidy. Based on the results of cytological studies, which report the predominant occurrence of bivalent chromosomes, a disomic inheritance was postulated for chrysanthemums. In contrast to these data, our analyses of molecular markers indicate a polysomic inheritance. Therefore, we suggest changing the classification of chrysanthemums from allopolyploid to segmental allopolyploid.
Conflict of Interest Statement
The authors declare that the research was conducted in the absence of any commercial or financial relationships that could be construed as a potential conflict of interest.
Acknowledgments
The authors thank the company Hubert Brandkamp for cultivating the plant material. This project was supported by funds from the Federal Ministry of Food, Agriculture and Consumer Protection (BMELV) based on a decision of the Parliament of the Federal Republic of Germany via the Federal Office for Agriculture and Food (BLE) under the innovation support program. We acknowledge support by Deutsche Forschungsgemeinschaft and Open Access Publishing Fund of Leibniz Universität Hannover. The authors would like to thank the reviewers for their valuable comments and suggestions to improve the manuscript.
References
Benson, G. (1999). Tandem repeats finder: a program to analyze DNA sequences. Nucleic Acids Res. 27, 573–580. doi: 10.1093/nar/27.2.573
Chen, F.-D., Li, F.-T., Chen, S.-M., Guan, Z.-Y., and Fang, W.-M. (2009). Meiosis and pollen germinability in small-flowered anemone type Chrysanthemum cultivars. Plant Syst. Evol. 280, 143–151. doi: 10.1007/s00606-009-0173-9
Chen, X., Zhou, X., Xi, L., Li, J., Zhao, R., Ma, N.,et al. (2013). Roles of DgBRC1 in regulation of lateral branching in Chrysanthemum (Dendranthema xgrandiflora cv. Jinba). PLoS ONE 8:e61717. doi: 10.1371/journal.pone.0061717
Dai, S.-L., Chen, J.-Y., and Li, W.-B. (1998). Application of RAPD analysis in the study on the origin of chinese cultivated Chrysanthemum. Acta Bot. Sin. 40, 1053–1059.
Dong, L., Ishak, A., Yu, J., Zhao, R., and Zhao, L. (2013). Identification and functional analysis of three MAX2 orthologs in Chrysanthemum. J. Integr. Plant Biol. 55, 434–442. doi: 10.1111/jipb.12028
Dowrick, G. J. (1952). The chromosomes of chrysanthemum, 1. The species. Heredity 6, 365–375. doi: 10.1038/hdy.1952.45
Dowrick, G. J. (1953). The chromosomes of chrysanthemum, 2. Garden varieties. Heredity 7, 59–72. doi: 10.1038/hdy.1953.5
Gardiner, J. M., Coe, E. H., Melia-Hancock, S., Hoisington, D. A., and Chao, S. (1993). Development of a core RFLP map in maize using an immortalized-F2 population. Genetics 134, 917–930.
Grivet, L., Dhont, A., Roques, D., Feldmann, P., Lanaud, C., and Glaszmann, J. C. (1996). RFLP mapping in cultivated sugarcane (Saccharum spp), genome organization in a highly polyploid and aneuploid interspecific hybrid. Genetics 142, 987–1000.
Jordan, C., and Reimann-Philipp, R. (1983). Untersuchungen über Typ und Grad der Polyploidie von Chrysanthemum morfolium Ramat. durch Erbanalysen von zwei Blütenfarbmerkmalen. Zeitschrift für Pflanzenzüchtung, 91, 111–122.
Klie, M., Menz, I., Linde, M., and Debener, T. (2013). Lack of structure in the gene pool of the highly polyploid ornamental chrysanthemum. Mol. Breed. 32, 339–348. doi: 10.1007/s11032-013-9874-4
Krebs, S. L., and Hancock, J. F. (1989). Tetrasomic inheritance of isoenzyme markers in the highbush blueberry, Vaccinium corymbosum L.1. Heredity 63, 11–18. doi: 10.1038/hdy.1989.70
Kriegner, A., Cervantes, J. C., Burg, K., Mwanga, R. O., and Zhang, D. P. (2003). A genetic linkage map of sweetpotato [Ipomoea batatas (L.) Lam.] based on AFLP markers. Mol. Breed. 11, 169–185. doi: 10.1023/A:1022870917230
Langton, F. A. (1989). Inheritance in Chrysanthemum morifolium Ramat. Heredity 62, 419–423. doi: 10.1038/hdy.1989.57
Lerceteau-Kohler, E., Guerin, G., Laigret, F., and Denoyes-Rothan, B. (2003). Characterization of mixed disomic and polysomic inheritance in the octoploid strawberry (Fragaria x ananassa) using AFLP mapping. Theor. Appl. Genet. 107, 619–628. doi: 10.1007/s00122-003-1300-6
Li, C., Chen, S., Chen, F., Li, J., and Fang, W. (2011). Cytogenetic study of three edible Chrysanthemum cultivars. Genetika 47, 199–205. doi: 10.1134/S1022795411010054
Liang, J., Zhao, L., Challis, R., and Leyser, O. (2010). Strigolactone regulation of shoot branching in Chrysanthemum (Dendranthema grandiflorum). J. Exp. Bot. 61, 3069–3078. doi: 10.1093/jxb/erq133
Mccouch, S. R., Kochert, G., Yu, Z. H., Wang, Z. Y., Khush, G. S., Coffmann, W. R.,et al. (1988). Molecular mapping of rice chromosomes. Theor. Appl. Genet. 76, 815–829. doi: 10.1007/BF00273666
Qu, L., Hancock, J. F., and Whallon. J. H. (1998). Evolution in an autopolyploid group displaying predominantly bivalent pairing at meiosis: genomic similarity of diploid Vaccinium darrowi and autotetraploid v. Corymbosum1 (Ericaceae). Am. J. Bot. 85, 698–703. doi: 10.2307/2446540
R Core Team (2012). R: A Language and Environment for Statistical Computing. Vienna: R Foundation for Statistical Computing.
Sanguinetti C. J., Dias Neto E., Simpson A. J. (1994). Rapid silver staining and recovery of PCR products separated on polyacrylamide gels. Biotechniques 17, 914–921.
Schuelke, M. (2000). An economic method for the fluorescent labeling of PCR fragments. Nat. Biotechnol. 18, 233–234. doi: 10.1038/72708
Silva, J. A., and Sorrells, M. E. (1996). “Linkage analysis in polyploids using molecular markers,” in Methods of Genome Analysis in Plants, ed. P. Jauhar (Boca Raton, FL: CRC Press), 211–228.
Silva, J. A., Sorrells, M. E., Burnquist, W. L., and Tanksley, S. D. (1993). RFLP linkage map and genome analysis of Saccharum spontaneum. Genome 36, 782–791. doi: 10.1139/g93-103
Soltis, D. E., and Rieseberg, L. H. (1986). Autopolyploidy in Tolmiea menziesii (Saxifragaceae), genetic insights from enzyme electrophoresis. Am. J. Bot. 73, 310–318. doi: 10.2307/2444186
Soltis, P. S., and Soltis, D. E. (2000). The role of genetic and genomic attributes in the success of polyploids. Proc. Natl. Acad. Sci. U.S.A. 97, 7051–7057. doi: 10.1073/pnas.97.13.7051
Stebbins, G. L. (1947). Types of polyploids; their classification and significance. Adv. Genet. 1, 403–429. doi: 10.1016/S0065-2660(08)60490-3
Stift, M., Berenos, C., Kuperus, P., and van Tienderen, P. H. (2008). Segregation models for disomic, tetrasomic and intermediate inheritance in tetraploids: a general procedure applied to Rorippa (Yellow Cress) microsatellite data. Genetics 179, 2113–2123. doi: 10.1534/genetics.107.085027
Sybenga, J. (1969). Allopolyploidization of autopolyploids I. Possibilities and limitations. Euphytica 18, 355–371. doi: 10.1007/BF00397783
Sybenga, J. (1996). Chromosome pairing affinity and quadrivalent formation in polyploids: do segmental allopolyploids exist? Genome 39, 1176–1184. doi: 10.1139/g96-148
Udall, J. A., Quijada, P. A., and Osborn, T. C. (2005). Detection of chromosomal rearrangements derived from homeologous recombination in four mapping populations of Brassica napus L. Genetics 169, 967–979. doi: 10.1534/genetics.104.033209
Ukoskit, K., and Thompson, P. G. (1997). Autopolyploidy versus allopolyploidy and low-density randomly amplified polymorphic DNA linkage maps of sweetpotato. J. Am. Soc. Hortic. Sci. 122, 822–828.
Untergasser, A., Nijveen, H., Rao, X., Bisseling, T., Geurts, R., and Leunissen, J. A. M. (2007). Primer3Plus, an enhanced web interface to primer3. Nucleic Acids Res. 35 (Web Server issue), W71–W74. doi: 10.1093/nar/gkm306
Van Ooijen J. W. (2006). JoinMap® 4, Software for the Calculation of Genetic Linkage Maps in Experimental Populations. Wageningen: Kyazma B. V.
Vos, P., Hogers, R., Bleeker, M., Reijans, M., van de Lee, T., Hornes, M.,et al. (1995). AFLP: a new technique for DNA fingerprinting. Nucleic Acids Res. 23, 4407–4414. doi: 10.1093/nar/23.21.4407
Wang, D., Karle, R., Brettin, T. S., and Iezzoni, A. F. (1998). Genetic linkage map in sour cherry using RFLP markers. Theor. Appl. Genet. 97, 1217–1224. doi: 10.1007/s001220051013
Wang, W., Dai, S., and Li, M. (2002). Physical mapping of rDNA in Dendranthema nankingense and its close related species by fluorescent in situ hybridization. Cell. Mol. Biol. Lett. 7, 911–917.
Watanabe, K. (1977). Successfuls ovary culture and production of F1-hybrids and androgenic haploids in Japanese Chrysanthemum species. J. Heredity 68,317–320.
Watanabe, K. (1983). Studies on the control of diploid-like meiosis in polyploid taxa of Chrysanthemum. Theor. Appl. Genet. 66, 9–14. doi: 10.1007/BF00281840
Wu, K. K., Burnquist, W., Sorrells, M. E., Tew, T. L., and Moore, P. H. (1992). The detection and estimation of linkage in polyploids using single-dose restriction fragments. Theor. Appl. Genet. 83, 294–300. doi: 10.1007/BF00224274
Yang, W., Glover, B. J., Rao, G.-Y., and Yang, J. (2006). Molecular evidence for multiple polyploidization and lineage recombination in the Chrysanthemum indicum polyploid complex (Asteraceae). New Phytol. 171, 875–886. doi: 10.1111/j.1469-8137.2006.01779.x
Zhang, F., Chen, S., Chen, F., Fang, W., Chen, Y., and Li, F. (2011). SRAP-based mapping and QTL detection for inflorescence-related traits in Chrysanthemum (Dendranthema morifolium). Mol. Breed. 27, 11–23. doi: 10.1007/s11032-010-9409-1
Keywords: allopolyploidy, autopolyploidy, molecular marker, polysomic inheritance, single dose markers, linkage in repulsion
Citation: Klie M, Schie S, Linde M and Debener T (2014) The type of ploidy of chrysanthemum is not black or white: a comparison of a molecular approach to published cytological methods. Front. Plant Sci. 5:479. doi: 10.3389/fpls.2014.00479
Received: 21 February 2014; Accepted: 30 August 2014;
Published online: 23 September 2014.
Edited by:
Christian Wilhelm Bodo Bachem, Wageningen UR, NetherlandsReviewed by:
Soren K. Rasmussen, University of Copenhagen, DenmarkPaul Arens, Wageningen UR, Netherlands
Copyright © 2014 Klie, Schie, Linde and Debener. This is an open-access article distributed under the terms of the Creative Commons Attribution License (CC BY). The use, distribution or reproduction in other forums is permitted, provided the original author(s) or licensor are credited and that the original publication in this journal is cited, in accordance with accepted academic practice. No use, distribution or reproduction is permitted which does not comply with these terms.
*Correspondence: Marcus Linde and Thomas Debener, Department of Molecular Plant Breeding, Institute for Plant Genetics, Leibniz Universität Hannover, Herrenhäuser Street 2, Hannover 30419, Germany e-mail:bGluZGVAZ2VuZXRpay51bmktaGFubm92ZXIuZGU=;ZGViZW5lckBnZW5ldGlrLnVuaS1oYW5ub3Zlci5kZQ==