 Jian Liu
 Wei Zhou
 Xun Gong
- 1Key Laboratory for Plant Diversity and Biogeography of East Asia, Kunming Institute of Botany, Chinese Academy of Sciences, Kunming, China
- 2Key Laboratory of Economic Plants and Biotechnology, Kunming Institute of Botany, Chinese Academy of Sciences, Kunming, China
- 3University of Chinese Academy of Sciences, Beijing, China
- 4Yunnan Key Laboratory for Wild Plant Resources, Kunming, China
Delimitating species boundaries could be of critical importance when evaluating the species' evolving process and providing guidelines for conservation genetics. Here, species delimitation was carried out on three endemic and endangered Cycas species with resembling morphology and overlapped distribution range along the Red River (Yuanjiang) in China: Cycas diananensis Z. T. Guan et G. D. Tao, Cycas parvula S. L. Yang and Cycas multiovula D. Y. Wang. A total of 137 individuals from 15 populations were genotyped by using three chloroplastic (psbA-trnH, atpI-atpH, and trnL-rps4) and two single copy nuclear (RPB1 and SmHP) DNA sequences. Basing on the carefully morphological comparison and cladistic haplotype aggregation (CHA) analysis, we propose all the populations as one species, with the rest two incorporated into C. diannanensis. Genetic diversity and structure analysis of the conflated C. diannanensis revealed this species possessed a relative lower genetic diversity than estimates of other Cycas species. The higher genetic diversity among populations and relative lower genetic diversity within populations, as well as obvious genetic differentiation among populations inferred from chloroplastic DNA (cpDNA) suggested a recent genetic loss within this protected species. Additionally, a clear genetic structure of C. diannanensis corresponding with geography was detected based on cpDNA, dividing its population ranges into “Yuanjiang-Nanhun” basin and “Ejia-Jiepai” basin groups. Demographical history analyses based on combined cpDNA and one nuclear DNA (nDNA) SmHP both showed the population size of C. diannanensis began to decrease in Quaternary glaciation with no subsequent expansion, while another nDNA RPB1 revealed a more recent sudden expansion after long-term population size contraction, suggesting its probable bottleneck events in history. Our findings offer grounded views for clarifying species boundaries of C. diannanensis when determining the conservation objectives. For operational guidelines, the downstream populations which occupy high and peculiar haplotypes should be given prior in-situ conservation. In addition, ex-situ conservation and reintroduction measures for decades of generations are supplemented for improving the population size and genetic diversity of the endemic and endangered species.
Introduction
The conceptualization and boundary of species are critically important and of great significance for taxonomists, ecologists and conservation biologists when identifying objective taxa and determining the protection units. However, the issue “what a species is” that has long been debated since Darwin's time is still controversial (Dobzhansky and Dobzhansky, 1937; Mayr, 1942; Mallet, 1995; de Queiroz, 2005; De Queiroz, 2007), with none such a unified definition being generally accepted. As the raising concerns on the topic of speciation (Turelli et al., 2001; Wu, 2001; Coyne and Orr, 2004; Lexer and Widmer, 2008; Butlin et al., 2012) in recent decades, species delimitation again attracts evolution biologists' attention (Wiens and Penkrot, 2002; Wiens, 2007; Petit and Excoffier, 2009; Carstens and Dewey, 2010; Fujita et al., 2012) and specific models and methodologies were put forward by employing morphological characters (Wiens and Penkrot, 2002), genetic datasets (O'meara, 2009; Yang and Rannala, 2010; Barrett and Freudenstein, 2011; Ence and Carstens, 2011; Harrington and Near, 2012; Niemiller et al., 2012), or geographical data (Rissler and Apodaca, 2007) to clarify the lineage's speciation process and to delimit species. Cycas L. (Cycadaceae), which is considered as the basal lineage of the Cycadales, and also the sister group to the other gymnosperms (Burleigh et al., 2012; Lu et al., 2014; Wang and Ran, 2014), contains approximately 105 extant species around the world (Haynes, 2011), mainly distributed in the tropic and sub-tropic areas around the Pacific. As an endangered but quite recent (mid-Miocene) radiant gymnosperm genus (Nagalingum et al., 2011), phenotype variations can not necessarily assort Cycas into discrete categories. As a result, some morphology-resembled or character-equivocal species due to interspecific hybridization were often put forward by a blended name of “complex” or “group” (see Hill, 1994a,b; Yang and Meerow, 1996; Liu, 2004; Xiao and Gong, 2006), making the definition of a species impeded to botanical studies of speciation.
The Red River origins in northwest Yunnan of China, and is named as “Yuanjiang” in the basin of Yunnan, then flows through southwest Yunnan and northern Vietnam and out to the Gulf of Tonkin. The basin of the Red River corresponds to a geological fault zone (Red River fault zone, RRFZ) that is resulted from the uplifting of Himalaya and the basin expansion of South China Sea (Harison et al., 1992; Leloup et al., 1995). The RRFZ stretches for more than 1000 km on land which stands out a discontinuity in the geology of Yunnan (Tapponnier et al., 1990), and harbors an abundant Cycas diversity with more than 14 species, in which 10 are endemic to this region (Hill, 2008). Within these species, C. diannanensis, C. parvula, and C. multiovula are three sympatric and morphological related species which are all classified into the Section Stangeriodes by sharing glabrous ovules, soft microsporangiate sporophylls and yellow seeds. The three species also display similar un-subterraneous stem habit and long cataphylls which made it difficult to identify them when no reproductive organ exists. The morphological differences between C. diannanensis and C. parvula are in the shape of megasporophyll terminal lamina, with the former one possessing broader terminal lamina while the terminal lamina of C. parvula is pinnately parted. For C. diannanensis and C. multiovula, they only differ in the number of ovules and the size of megasporophyll, with the later normally owning more ovules and larger megasporophyll.
The classification of Cycas in China is confused especially after numerous disputable new species being described since the 1990s (Wang et al., 1996; Wu and Raven, 1999; Hill, 2008). None of the above three species is listed in Flora of China (Wu and Raven, 1999), in which they are treated as synonyms of other species, and only C. diannanensis is accepted by the world list of cycads (Haynes, 2011). Previous studies held different opinions when dealing with the issue whether the three similar but controversial species could be good species. Jiang (2004) considered the other two species should be incorporated into C. diannanensis based on his wild survey and morphological comparisons with specimens. However, Nong et al. (2011) thought C. parvula should be independent species according to their RAPD results, although in their study C. parvula was clustered with C. diannanensis. Some other results based on palynology (Wang, 2000) and ISSR data (Xiao and Gong, 2006) also considered C. parvula should be a good species, whereas in their studies the sympatric C. diannanensis and C. multiovula were absent of sampling for comparison. Moreover, the samples and genetic markers in these studies were limited, since these factors have great impacts on the results when delimiting species (Knowles and Carstens, 2007). Therefore, subsequent taxonomical revision and phylogenetic analysis are required to clarify whether these three species could be good species respectively. Meanwhile, under the circumstance of wild populations' severe situation of the Cycas species through the investigations along the Red River, as well as the urgent threatening status of Cycas species in China, it should be impending to determine the actual species boundaries and evaluate the genetic diversity basing on comprehensive sampling and different molecular approaches to carry out reasonable protection strategies for them.
The geographical distribution of plant species had been profoundly influenced by the climatic oscillations in the Quaternary (Hewitt, 2000), and species colonization or contraction triggered by such climate fluctuations may lead to unexpected genetic subdivision and mixture of populations (Comes and Kadereit, 1998; Hewitt, 2004). The genetic structure of existing populations can be imprinted by historical processes (e.g., ice age), especially for those long-evolved and sessile organisms (Feng et al., 2014). Genetic data can provide insights into adaptive potential for particular species in postglacial colonization refugia as well as valuable information and suggestions for the species delimitation, demographic history and conservation categories (Gong et al., 2011; Zhao and Gong, 2012; Jia et al., 2014). In this study, we sequenced three maternally inherited cpDNA and two biparentally inherited nDNA markers of 15 populations from C. diannanensis, C. parvula, and C. multiovula, which shared an overlapped distribution in the Red River basin, and examined the genetic relationships between them. In doing so, we aim to demarcate the boundaries among these sympatric species, then evaluate the genetic diversity, genetic structure and demographic history of the existing populations, and ultimately provide valid conservation guidelines for the ancient and endangered species.
Materials and Methods
Taxon Sampling
A total of 137 individuals were selected for subsequent analysis from the 15 populations collected along the Red River region in China, including 10 populations of C. diannanensis, three populations of C. parvula and two populations of C. multiovula (sampling 10 individuals for each population and all individuals for populations less than 10). Among them, materials of C. parvula and C. multiovula were obtained from cultivated individuals in the village after the verification that they were from the same population. The C. diannanensis population ZSM and C. multiovula population ZSD were sampled from the same place (Zhongshan, Chuxiong). Information of sampling sites and the number of individuals from each population used in this study are presented in Table 1.
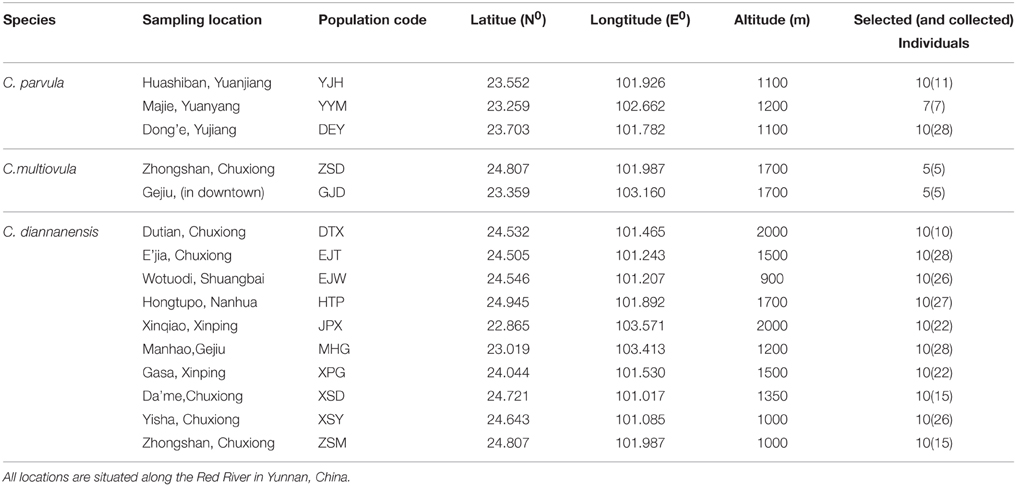
Table 1. Details of sampling of the Cycas populations investigated in this study.
DNA Extraction, PCR Amplification, Sequencing and Cloning
Materials for DNA extraction were from young and healthy leaves which were collected and dried immediately in silica gel. Genomic DNA was extracted from dried leaves using the modified CTAB method (Doyle, 1991). Approximately 2–3 individuals from each population were selected for preliminary screening from universal chloroplastic and nuclear primers. A total of five markers were selected and sequenced within the total 137 individuals, including three cpDNA intergenic spacers: psbA-trnH, rps4-trnL, and atpI-atpH (Shaw et al., 2005), and two single copy nuclear genes: Cycas revoluta RNA polymerase II largest subunit, RPB1 and Selaginella moellendorffi hypothetical protein, SmHP (Chiang, Y. C., unpublished) for complete analysis (for primer information, see Table 2). PCR amplification was carried out in 40 μL volume reactions. For cpDNA, the PCR reactions contained 20 ng DNA, 2.0 μL MgCl2(25 mM), 2.0 μL dNTPs (10 mM), 4.0 μL 10 × PCR buffer, 0.6 μL of each primer, 0.6 μL Taq DNA polymerase (5 U/μL) (Takara, Shiga, Japan) and 26 μL double-distilled water. For nDNA, the PCR reactions contained 40 ng DNA, 2.4 μL MgCl2 (25 mM), 2.0 μL dNTPs (10 mM), 2.0 μL DMSO, 4.0 μL 10 × PCR buffer, 0.7 μL of each primer, 0.7 μL Taq DNA polymerase (5 U/μL) (Takara, Shiga, Japan) and 24.6 μL double-distilled water. PCR amplifications were performed in a thermocycler under the following conditions: an initial 5 min denaturation at 80°C, followed by 34 cycles of 1 min at 95°C, 1 min annealing at 50°C, and a 1.5 min extension at 65°C, and a final extension for 10 min at 65°C for cpDNA intergenic spacers. For nDNA sequences, an procedure of initial 4 min denaturation at 94°C, which was followed by 34 cycles of 50 s at 94°C, 1 min annealing at 50°C (for SmHP) or 55°C (for RPB1), and a 1.5 min extension at 72°C, and a final extension for 10 min at 72°C was used. All PCR products were sequenced in both directions with the same primers for the amplification reactions, using an ABI 3770 automated sequencer at Shanghai Sangon Biological Engineering Technology & Services Company Ltd. The individuals with nDNA sequences which had one or more heterozygous sites in the first sequencing round were subsequently cloned. PCR products were purified using the TIANgel Midi Purification Kit (Tiangen). Purified products were linked to pMD18-T Vector and then inserted to E. coli DH5α strains. Six to ten clones were randomly picked and sequenced until the heterozygous site split into two alleles. The data sets of the DNA sequencing in this study were deposited in GenBank (accession numbers from KT334601–KT334653).
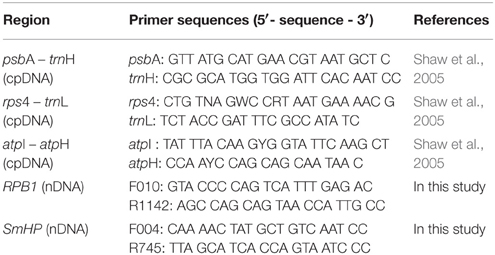
Table 2. cpDNA and nDNA fragments and primer sequences used in this study.
Data Analysis
The cpDNA and nDNA sequences were edited and generated by SeqMan (Swindell and Plasterer, 1997). Multiple alignments of the DNA sequences were manually refined with Clustal X v1.83 (Thompson et al., 1997), with subsequent adjustment in Bioedit v7.0.4.1 (Hall, 1999). Although the congruency test for the three combined cpDNA regions in this study showed a non-significant rate of homogeneity (P = 0.4, < 0.5) by PAUP* 4.0b10 (Swofford, 2002), suggesting indistinctive degree of homogeneity between the cpDNA regions, we still combined these three regions to gain enough variable sites in the subsequent analysis as some former studies suggested (Yoder et al., 2001; Quicke et al., 2007).
Haplotypes from five markers for all the three species were calculated from aligned DNA sequences by DnaSP v5.0 (Librado and Rozas, 2009). The genetic diversity within- and among-populations were estimated by calculating Nei's nucleotide diversity (Pi) and haplotype diversity (Hd) indices through DnaSP software as well. The within-population gene diversity (HS), gene diversity in total populations (HT) and two coefficient of population differentiation, GST and NST were calculated by Permut v1.0 (http://www.pierroton.inra.fr/genetics/labo/Software/Permut).
The DnaSP v5.0 software was also used to investigate the demography of the species and check if the evolution matched with neutral mutation. The Tajima's D and Fu and Li's F* value were calculated to detect departures from population equilibrium, and the pairwise mismatch distribution was used to test for population expansion. We also used Arlequin v3.0 (Excoffier et al., 2005) to calculate the raggedness index and its significance to quantify the smoothness of the observed mismatch distribution. The sum-of-squared deviations (SSD) between the observed and expected mismatch distributions were computed, and P-values were calculated as the proportion of simulations producing a larger SSD than the observed SSD. The relatedness degree among cpDNA and among nDNA haplotypes were estimated by using Network v4.2.0.1 (Forster et al., 2007). In the network analysis, we treated an indel as one single mutational event. The Arlequin v3.0 (Excoffier et al., 2005) was used to conduct an analysis of molecular variance (AMOVA) and to estimate the genetic variation assigned within and among populations. Isolation by distance (IBD) model was tested between all pairs of populations by computing Mantel tests in GenAlEx package version 6.3 (Peakall and Smouse, 2006) using a correlation between FST and geographic distance.
Phylogenetic relationships among cpDNA and nDNA haplotypes generated from the three species were inferred using maximum likelihood method by online PhyML (http://www.atgc-montpellier.fr/phyml/) (Guindon et al., 2010) and Bayesian inference by MrBayes v3.2 (Ronquist et al., 2012), in which we employed a distinct species Cycas tanqingii D. Y. Wang as outgroup. We referred a tree-based species delimitation method of cladistic haplotype aggregation (CHA, Brower, 1999) which tabulated the testing haplotypes to determine the population profiles, and aggregated haplotypes that sharing identical profiles, then estimated the phylogeny of the unaggregated groups of haplotypes, and divided sets of topologically contiguous populations into separate species. The divergence time between lineages within populations were estimated by BEAST v1.7 (Drummond et al., 2012) with a strict molecular clock and the evolutionary rates set as 1.01 × 10⁻⁹ and 5.1–7.1 × 10⁻⁹ (6 × 10⁻⁹ in this study) mutation per site per year for cpDNA and nDNA respectively, which had previously been estimated in seed plants for synonymous sites (Graur and Li, 2000). The time of the basal node inferred from the average evolutionary rate was used as an age constraint for earliest lineage divergence. The phylogenic relationship of all samples was also constructed by MrBayes v3.2 (Ronquist et al., 2012) to infer the individuals' clustering for species delimitation, in which four simultaneous runs with four chains each were run for combined data for 107 generations and trees were sampled every 1000 generations, with the first 25% trees of the sample trees from each run were discarded. The above sampling data after Bayesian analysis was examined and determined by Tracer v1.6 (Rambaut et al., 2014). Before the phylogenetic analysis, the best evolution models were chosen by jModeltest 1.7 (Posada, 2008; Darriba et al., 2012) for both combined cpDNA (F81+G for AIC, F81 for BIC) and nDNA (both HKY+I for two sequences).
A Bayesian Skyline plot was also calculated by the BEAST v1.7 (Drummond et al., 2012) to infer the historical demography of species in this study. Posterior estimates of the mutation rate and time of divergence were obtained by Markov Chain Monte Carlo (MCMC) analysis. The analysis was run for 107 iterations with a burn-in of 106 and a strict clock model under the HKY+I evolution model for both cpDNA and nDNA. Genealogies and model parameters were sampled every 1000 iterations. Convergence of parameters and mixing of chains were followed by visual inspection of parameter trend lines and checking of effective sampling size (ESS) values in three pre-runs. The ESS parameter was expected to surpass 200, which suggested acceptable mixing and sufficient sampling in analysis. Adequate sampling and convergence to the stationary distribution were checked using Tracer v1.6 (Rambaut et al., 2014).
We also conducted an analysis on both population structure and species delimitation by the sequence data using STRUCTURE v2.2 (Evanno et al., 2005), as strategy employed by STRUCTURE is straightforward and matches reasonably well the properties of metapopulation lineages (Shaffer and Thomson, 2007). Sequence data were first converted to structure format. Ten independent runs were performed for each set, with values of K ranging from 1 to 15, a burn-in of 1 × 10⁵ iterations and 1 × 10⁵ subsequent MCMC steps. The combination of an admixture and a correlated-allele frequencies model was used for the analysis. The best-fit number of grouping was evaluated using ΔK by STRUCTURE HARVESTER, v0.6.8 (Earl, 2012).
Results
DNA Sequences Characterization
The combined chloroplastic sequence data of atpI-atpH, psbA-trnH, and trnL-rps4 was aligned as a consensus length of 1992 bp, containing 61 polymorphic sites among which 14 were substitutions and others were indels. A total of 13 haplotypes were detected in the 15 populations. The haplotype distributing patterns were listed in the Table S1 and showed in the Figure 1A.
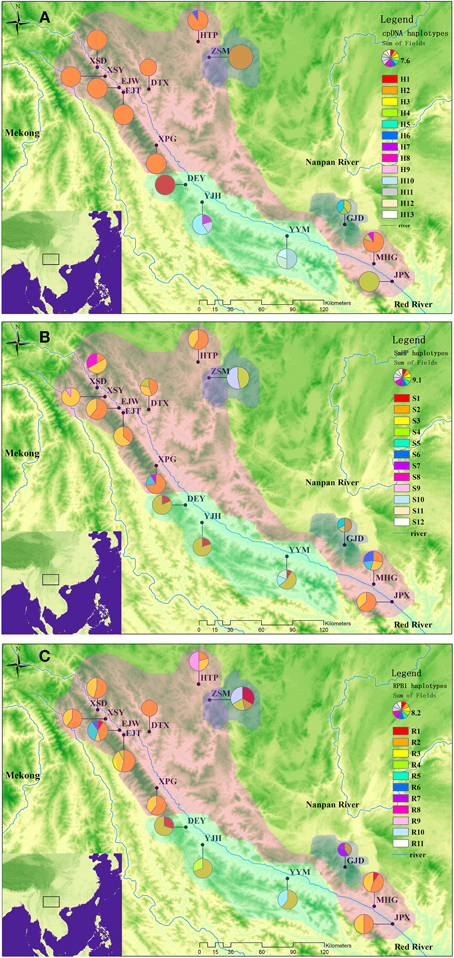
Figure 1. Geographical distributions of cpDNA haplotypes (A), nDNA SmHP haplotypes (B), nDNA RPB1 haplotypes (C) in C. diannanensis. Frequencies of haplotypes in each population are indicated by the proportions of pie diagrams. The colored dash areas present the sampling and possible distributions of the Cycas species in this study: Red, C. diannanensis; Green, C. parvula; Blue, C. multiovula.
The single nuclear copy gene SmHP (F004-R745) sequence matrix was aligned with a consensus length of 664bp, which contained 15 substitution sites, and formed 12 nuclear haplotypes in the 15 populations. The most widely distributed haplotypes were Hap S2 and S3, which occurred in 12 and 10 populations respectively and were shared by all the three species (Figure 1B).
The other nDNA RPB1 (010-1142) sequence matrix was aligned with an accordant length of 912bp, in which six substitutions were detected, deriving 11 nuclear haplotypes in total (Figure 1C).
Network Analysis
For the network diagram of combined cpDNA (Figure 2A), three missing haplotypes occurred in the internal nodes. The ancestral haplotype was also missed, with the low frequent haplotypes locating at the external position of the network diagram besides haplotype H2. Each haplotype in the cpDNA network kept one nucleotide difference to the nearest haplotype except haplotype H11 with H12 (six variations) and haplotype H1 with MV1 (missing haplotype, three steps).
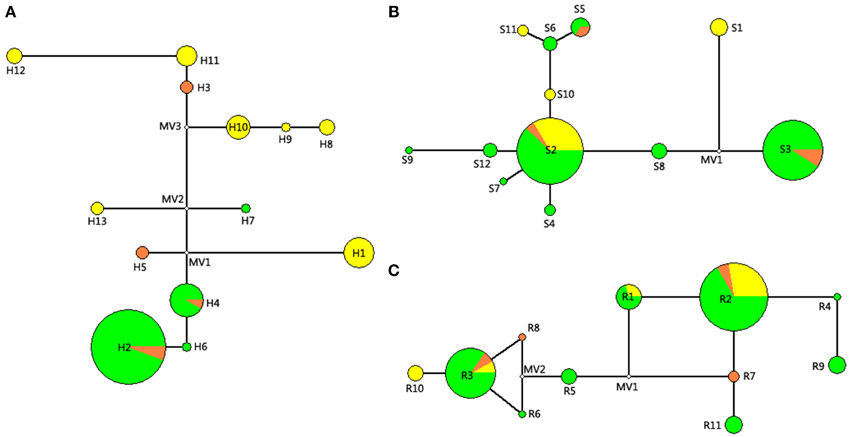
Figure 2. Networks of the combined cpDNA sequence (A), nDNA SmHP (B), and nDNA RPB1 (C) haplotypes of studied Cycas species. Each circle represents one haplotype. The size of the circles corresponds to the frequency of each haplotype, and the small hollow circles indicate hypothetical missing haplotype. For different colors in this figure: Green, C. diananensis, yellow, C. parvula, orange, C. multiovula.
For network analysis of nDNA SmHP sequence (Figure 2B), one missing haplotype was detected and the highest frequent haplotype S2 was shared by all the species and located at the center position of the reticulate evolution diagram, suggesting Hap S2 as the ancestral haplotype. For RPB1 gene, two loops and two missing haplotypes occurred in the network diagram. All the haplotypes held one nucleotide difference with its adjacent haplotype. Haplotype R5 located in the center position of the network diagram with most others placing at the external nodes (Figure 2C).
Haplotype Phylogeny (Aggregation), Divergence and Species Clustering Analysis
Maximum likelihood (ML) analysis and Bayesian inference of cpDNA and nDNA haplotypes generated similar cladograms corresponding to the network analysis, whereas differed in the support values located on internal nodes. For cpDNA, all 13 haplotypes appeared as a distinct comb-like structure with three paraphyletic subclades nested inside. Within the cladogram, haplotypes H12, H11, and H3 clustered in the same subclade which was occupied by C. parvula and C. multiovla from the downstream populations YYM and GJD, implying these two adjacent populations should be closely related. For the other subclades, the most widely distributed H2 was clustered with the haplotype H6, which was specific by upstream population HTP. Haplotype H8, H9 as well as H10 which were all peculiar in YJH shared a close relationship to form a subclade, whereas this subclade was nonexclusive with other haplotypes in the large clade (Figure 3A). As the evidence that none of the above lineage inferred from cpDNA data could be separated from all other populations by a branch in the cladogram, nor could they form a contiguous section in the network analysis (Figure 2), we deduced all the lineages (haplotypes) as one phylogenetic species.
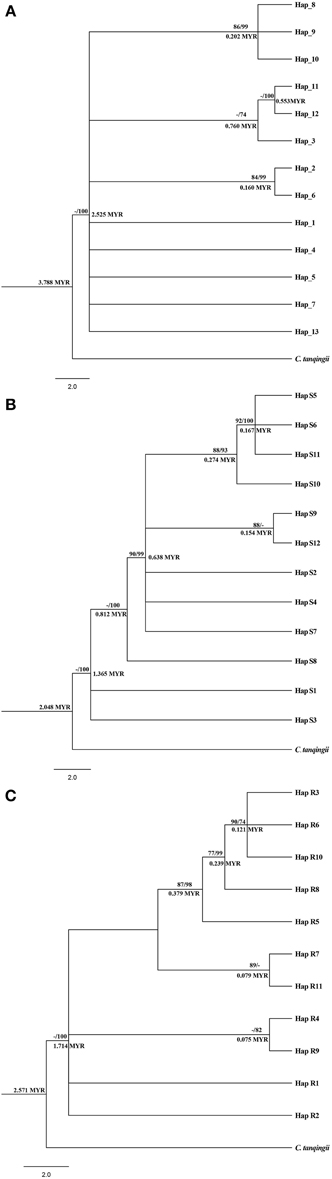
Figure 3. Phylogenetic analysis and divergent time obtained from cpDNA haplotypes (A), nDNA SmHP haplotypes (B), and nDNA RPB1 haplotypes (C) of the three Cycas species. Number above the line of each note stands for the bootstrap value of Maximum Likelihood/and posterior probability (PP) inferred from Bayesian inference (for PP > 70). Number below the line represents divergent time by BEAST v1.7. MYR: million years.
For nDNA SmHP, the first divergent haplotypes were Hap S1, S3, and S8, which were widely shared by all the populations (Table S1, Figure 3B), suggesting these three haplotypes (especially for S1 and S3) were more ancient than others. The other haplotypes formed one clade, within which the relationship were not fully resolved (Figure 3B). For nDNA RPB1, haplotype R1 and R2 were first divergent haplotypes from MV1 (missing haplotype 1) which was mapped in middle of the network evolution diagram. The second most frequent haplotype Hap S3 located at the top of the haplotype cladogram and the near margin of network evolution diagram, suggesting it a recent evolved haplotype. Similarly, haplotypes aggregation of RPB1 in each branch (clade) from the cladogram neither matched with the species populations nor geographical distributions (Table S1, Figure 3C).
Inference of divergent time of haplotypes from our cpDNA and nDNA data all suggested a recent divergence of the Cycas lineages (for cpDNA: 3.788 Myr (million years), SmHP: 2.048 Myr, RPB1: 2.571 Myr), indicating a haplotype splitting in late Pliocene (Piacenzian, 3.6 Myr) or within Pleistocene (2.6 Myr). Estimate time of different haplotypes on the internal divergence node was displayed on Figure 3.
All three phylogenic trees (combined cpDNA, SmHP and RPB1) showed well supported lineage clades (most PP > 90) of the three species (Figure S1). Nevertheless, none of the phylogram could explicitly generated monophyletic clade within each morphological identified species. Individuals from the C. parvula populations were located at the basal clades inferred from cpDNA data, and the other two species from different populations displayed non-aggregated clustering which were also conflicted to morphological classification through both cpDNA and nDNA data.
Genetic Diversity and Genetic Structure
Relative lower total nucleotide (Pi) and haplotype (Hd) diversity in all populations were detected in combined cpDNA (0.00087 and 0.564, respectively) than in nDNA (Pi = 0.00471, Hd = 0.67 for SmHP; Pi = 0.00302, Hd = 0.671 for RPB1, see Table S1). Total genetic diversity (HT = 0.627 for cpDNA, 0.667 for RPB1, 0.679 for SmHP) was higher than the average intra-population diversity (HS = 0.179, 0.562, 0.528 from cpDNA, RPB1 and SmHP respectively, Table 3), resulting in overall high level of genetic differentiation within populations (FST = 0.819, 0.055, 0.251 from cpDNA, RPB1 and SmHP, respectively). For cpDNA, most populations displayed no haplotype diversity except population GJD, MHG, HTP, YJH, and YYM, which distributed along downstream of the Red River. However, most populations occupied high haplotype diversities at the nDNA level.
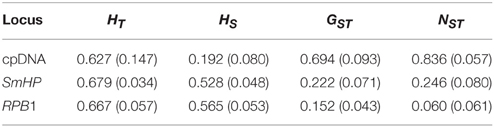
Table 3. Genetic diversity, differentiation parameters for the combined chloroplast DNA (cpDNA) sequences and two nuclear loci (SmHP, RPB1) in all population of C. diannanensis.
AMOVA analysis revealed that 81.85% of the genetic variation was shared among populations and 18.15% within populations for cpDNA (Table 4), indicating a high level of genetic variation among populations. For nDNA, however, only 5.46 and 25.06% of the genetic variation was partitioned among populations, and 94.54%, 74.94% within populations for RPB1 and SmHP respectively, which showed low level of interpopulation genetic variation and high intra-population variation. Mantel test results showed significant effect (R = 0.401, P < 0.05) of isolation by distance (IBD) by combined cpDNA data, indicating a positive correlation between genetic and geographical distance, while both two nDNA markers showed non-significant (for SmHP, R = 0.103, P>0.05; for RPB1, R = −0.164, P>0.05) correlations between such distances (Figure 4).
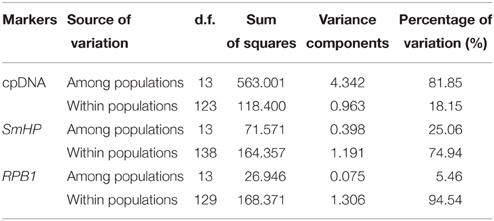
Table 4. Results of analysis of molecular variance (AMOVA) based on the combined cpDNA sequences and nuclear loci sequence data from populations of C. diannanensis.
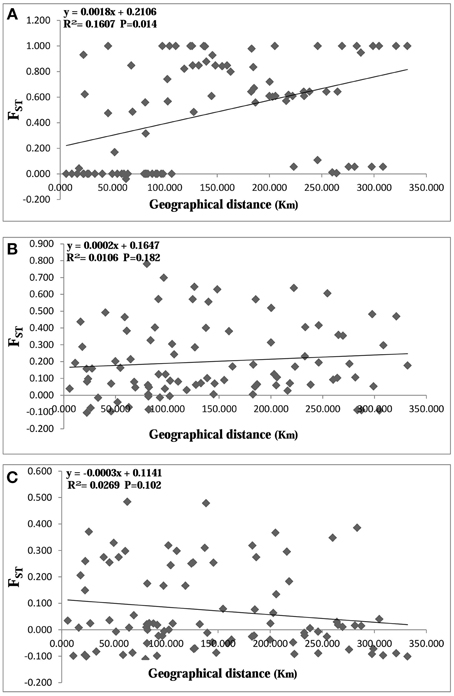
Figure 4. Plot of geographical distance against genetic distance for populations of Cycas diannanensis inferred from cpDNA (A), nDNA SmHP (B), and nDNA RPB1 (C).
The STRUCTURE analysis which used the ΔK method based on a combined chloroplastic data in the whole 15 populations of the three species showed K = 2 was the optimal value (Figure S2A), dividing populations of the three sympatric species into two clusters: the first contained most C. diannanensis populations and one C. multiovula population, the other group included all the three C. parvula populations and one C. multiovula population (ZSD) as well as one C. diannanensis population (MHG). The results of two nDNA sequences also both suggested K = 2 (Figures S2B,C) a better solution than other K values, while no distinct genetic structure could be obtained from the two nuclear data set, with the disparate genetic components sharing in all different populations (Figure 5).
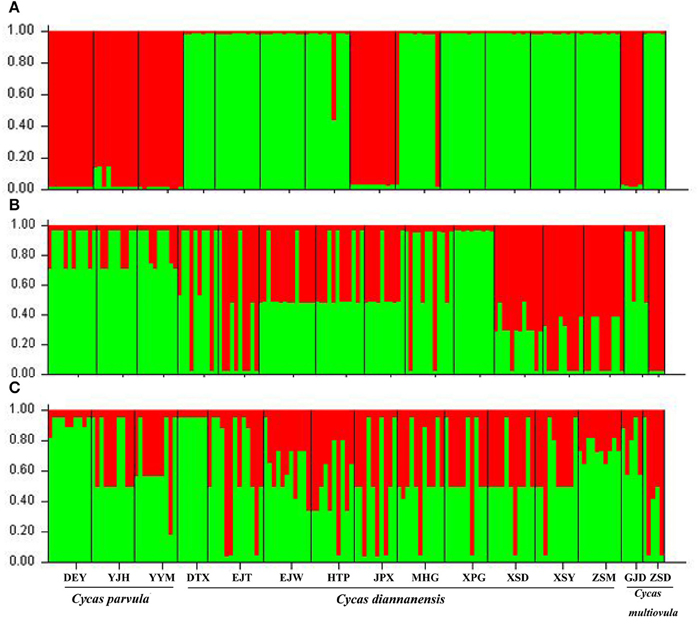
Figure 5. Estimated genetic clustering (K = 2 for all three markers) obtained with the STRUCTURE program from 15 populations of the three Cycas species based on cpDNA sequence (A) and nDNA SmHP (B), RPB1 (C). Black lines separate different populations.
Neutrality Test, Mismatch Analysis and Bayesian Skyline Reconstruction
The results of the Neutrality Test inferred from cpDNA showed a negative Tajima's D value and positive Fu and Li's F* (see Table 5), which were both non-significant, implying the populations experienced no bottleneck effect or population expansion in history. The nuclear SmHP gene displayed both positive but non-significant value on Tajima's D and Fu and Li's F*, which was accorded with the combined cpDNA result. Whereas the nuclear RPB1 showed both positive Tajima's D value and Fu and Li's F*, which suggested historical bottleneck effect or genetic drift of the Cycas populations.
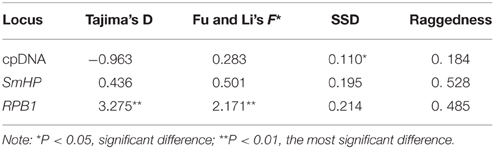
Table 5. Parameters of neutrality tests and demographic analysis based on cpDNA and nDNA of C. diannanensis.
Meanwhile, the results of the mismatch analysis (Figure 6) for all populations displayed a multimodal distribution pattern with non-significant positive SSD and raggedness values for cpDNA and nDNA (SmHP), indicating these populations had not undergone a recent population expansion. While result inferred from nuclear RPB1 gene showed a unimodal curve, suggesting that population had experienced bottleneck events in history.
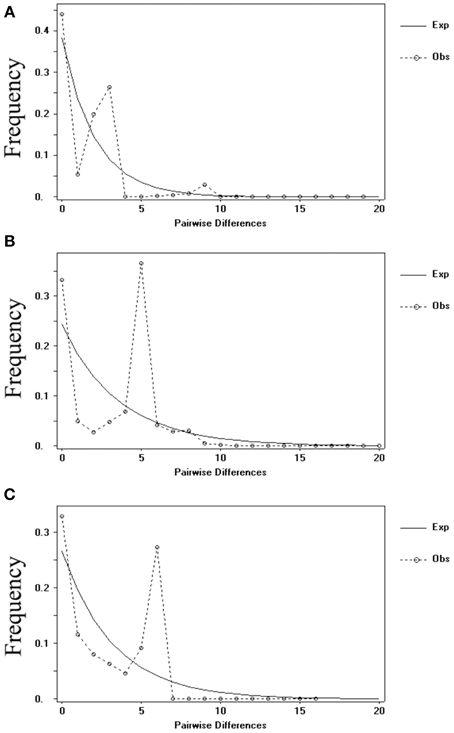
Figure 6. Distribution of the number of pairwise nucleotide differences for cpDNA sequence (A) and nDNA SmHP (B), RPB1 (C) sequences data in C. diannanensis. The solid line stands for expected values and the dashed line represents observed values under a model of sudden population expansion.
The skyline plots of historical population size dynamics analyzed by BEAST based on different datasets from the bayesian simulation were showed in Figure 7. The skyline plot indicated a long period of population equilibrium and recent declines (since 50–100 thousand years ago) in population size (Figure 7A, cpDNA; Figure 7B, nDNA SmHP) of the investigated populations during Quaternary glaciations. While for nDNA RPB1, a quite recent subsequent expansion after historical population decreasing (Figure 7C) was performed, which accorded with its possible bottleneck events in history detected by the above mismatch analysis.
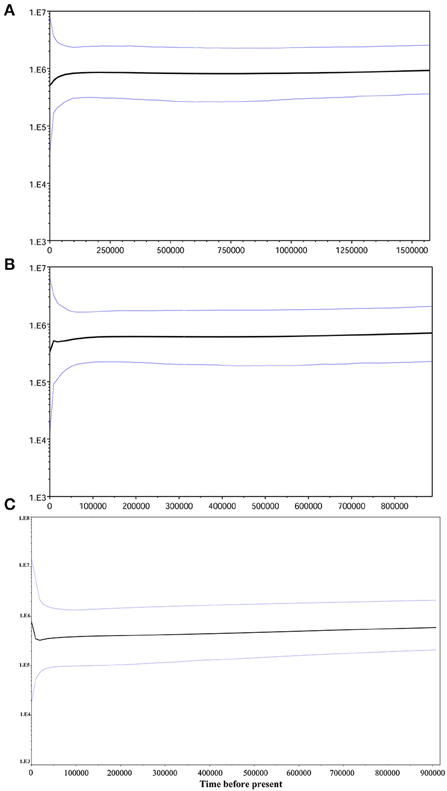
Figure 7. Bayesian skyline plot based on cpDNA (A) and single copy nuclear gene SmHP (B) as well as RPB1 (C) for the effective population size fluctuation throughout time. Root height is set as median of the maximum time. Black line: median estimation; areas between gray lines: 95% confidence interval.
Discussion
Species Delimitation of the three Cycas species
Species delimitation is one of the two major goals of systematics (Wiens, 2007). As “no one definition has as yet satisfied all naturalists, yet every naturalist knows vaguely what he means when he speaks of a species” proposed by Darwin (Darwin, 1859), it has arouse explosive issues attempting to define what a species is and guide what we should take into account when determining this definition. In this study, we admit and adopt the unified species concept as a “lineage” (de Queiroz, 1998, 2005), which is separation of the theoretical concept of species (as separately evolving metapopulation lineages) (De Queiroz, 2007) and offered operational criteria for species delimitation.
Generally, shared haplotypes between different species might be given risen by hybridization which introduces new genes to other species, or incomplete linage sorting that retains ancestral haplotypes in the processing of speciation (Chiang et al., 2009). Under the tree-based criteria of species delimitation of haplotypes (Sites and Marshall, 2003), the detected lineages (DNA haplotypes) of the three species in this study (see Figures 2, 3) neither underwent sufficient isolation for coalescence to monophyly in cladogram or a “contiguous section” in the network analysis (CHA, Brower, 1999), nor for geographical character divergence (Wiens and Penkrot, 2002). Although our Structure analysis of cpDNA detected two distinct clusters from the 15 populations, the two lineages didn't correspond to the morphological characteristics or lineage aggregation, but partially corresponded to geography through genetic diversity. In addition, the widely shared haplotypes inferred from our nuclear data revealed possible hybridization or introgression within the three Cycas species, which blurred the specificity of the three species in history as well. For the populations or species which are forming their lineages, no such specificity is kept in evolution history, which brings about little unique genes throughout the genome, although they occupy morphological polymorphism. As the divergent time of the genus Cycas is quite recent (Nagalingum et al., 2011), as well as the young lineages of different haplotypes among the three species (Figure 3), we infer the reason for sharing haplotypes between populations may also contribute to the historical incomplete linage sorting of Cycas, resulting in the present non-monophyletic phylograms.
Meanwhile, these three species share overlapped distributions in the undergrowth habitat on mountain slopes of the Red River basin, making it possible for immigrations and gene flows among these populations (Figure 1). Gene flow might exist in form of continuous gene introgression within partial genes between some closely related species in the processing of speciation, which suggests the maintaining of reproductive isolation and morphological specificity as well as the ecological characters between different species. As a biparental inherited property, nuclear genes might be more suitable for species delimitation as its larger effect population size than cpDNA in plants (Comes and Kadereit, 1998), which is more difficult to be fixed in evolution process. Our nuclear data suggested the focal Cycas species could be a single and nonexclusive species as the paraphyletic and weak supported clades for aggregating populations, as well as the discordant geography for clusters (lineages) (see Wiens and Penkrot, 2002). Even though the phylograms between cpDNA and nDNA are inconsistent, the phylogenic tree of the three species all demonstrated scattered populations from C. parvula and C. multiovula nesting into the most C. diannanensis (Figure S1), indicating possible introgression between these species, which was also supported by the results of STRUCTURE based on nDNA data (Figures 5B,C). Thus, considering a comprehensive wild examination and specimen comparison from the herbarium which showed few and unobvious difference in morphology of the three species, as well as overlapped distribution, non-reproductive isolation, incomplete lineage sorting and possible introgression between the populations according to both chloroplastic and nuclear data analysis basing on adequate sampling in this study, we propose the three Cycas species along the Red River as one species, with C. parvula and C. multiovula incorporated into Cycas diannanensis.
Taxonomy Treatment and Synonyms
Cycas diannanensis Z. T. Guan & G. D. Tao in Sichuan Forestry and Design, 1995(4): 1-2.
C. pectinata var. manhaoensis C. J. Chen & P. Yun, Acta Bot. Yunnan. 17(4): 400, 1995; C. parvula S. L. Yang & D. Y. Wang, Cycads in China. 93. 1996; C. multiovula D. Y. Wang, Cycads in China. 83. 1996.
Genetic Diversity and Genetic Structure of C. diannanensis
Genetic diversity could maintain the reproduction fitness adaptive evolution of species, which suggested low level of genetic variation might increase the possibilities of inbreeding and the risk of extinction (Lande, 1988; Reed and Frankham, 2001). We incorporated individuals from ZSD and ZSM populations from the same location together as one (ZSM), since they were regarded as the same species following our conclusion above. Our cpDNA result on C. diannanensis reveals it possesses higher haplotype diversity and total genetic diversity (Hd = 0.5642, HT = 0.627) than C. debaoensis (Hd = 0.492, HT = 0.564) (Zhan et al., 2011). However, in comparison with other reported Cycas species, it shows relatively lower level of diversity than C. simplicipinna (Hd = 0.846, HT = 1) (Feng et al., 2014) and C. revoluta (Hd = 0.641, HT = 0.641) (Kyoda and Setoguchi, 2010). Meanwhile, the total level of genetic diversity of C. diannanensis is lower than the mean value of 170 plant species that was estimated from cpDNA-based studies (HT = 0.67) (Petit et al., 2005), and its haplotype diversity is lower than some endangered species such as Hygrophila pogonocalyx (Hd = 0.870) (Huang et al., 2005) and Dysosma versipellis (Hd = 0.924) (Qiu et al., 2009). For nuclear DNA, our data also displayed a relatively low level of total genetic diversity (for RPB1: HT = 0.667, SmHP: HT = 0.679) when compared with C. simplicipinna (HT = 0.878, by ITS) (Feng et al., 2014), and other genetic diversity analysis inferred by nuclear genes, such as Cardamine nipponica (HT = 0.689, 0.798, 0.885, three nuclear genes) (Ikeda et al., 2008), Psammosilene tunicoides (Hd = 0.724) (Zhang et al., 2011) and Rhododendron pseudochrysanthum (Hd = 0.881, Huang et al., 2011).
Generally, low level of genetic diversity occurs in the species that are rare, endangered or endemic, for their few and isolated populations as well as their adaptation in one-fold habitat (Spielman et al., 2004). Drift might be incidental with the populations with continuous distribution areas or low effective population size, which would lead to the low level of genetic diversity (Templeton et al., 2001; Marchelli et al., 2010). Most of the wild population sizes based on our survey, however, were less than 50 (Table 1), with higher haplotype diversity being detected in the populations with larger population size (such as MHG and HTP). However, species that actively migrates toward refuge areas can maintain higher levels of genetic diversity in refugia if their range contraction is rapid (Arenas et al., 2012), even though the species occupies isolated patches. Genetic drift and inbreeding within extremely small populations caused by habitat fragmentation (Young et al., 1996) could be the main reason for the low levels of genetic differentiation at nDNA among populations of C. diannanensis in this study. In addition, lower genetic diversity at cpDNA than nDNA in our study (Table 3) might be attributed to lower evolutionary rates as well as the uniparental property of chloroplastic genes which are more likely to be fixed (Hewitt, 2001).
As an ancient gymnosperm and woody plant species, cycads are considered to possess high genetic variations within populations and low level of differentiation among populations for their diecious habit and long life cycle for millions years of evolving genealogies. These characters make it possible for them to accumulate enough genetic variations for adaptation under the selective pressure from the historical geographical and climate events, and develop migrating strategies allowing them to track the most suitable environment (Hamrick et al., 1992; Arenas et al., 2012). In the case of our studied species, we detected a high genetic differentiation among populations through cpDNA data but relative low genetic differentiation with nDNA data (Table 4). This discordance might be explained by different inherited and dispersal patterns between cpDNA and nDNA in C. diannanensis. As the former one is maternally inherited in Cycas and dispersed only by seeds, whereas nDNA is biparentally inherited and owns both the ways of seeds and pollens, which offer opportunities for nDNA to obtain more genetic components among populations by gene flow. Moreover, recombination within nuclear genome may play another important role in gaining more potential genetic diversity of nDNA.
Significant genetic differentiation of C. diannanensis was detected on the basis of both cpDNA (FST = 0.819) and nDNA (SmHP: FST = 0.251; RPB1: FST = 0.055). Particularly, a distinct phylogeographical structure with cpDNA haplotypes distribution was revealed by the result of U test (NST > GST, Table 3), which is corresponded with our IBD test result by Mantel test. The populations HTP, ZSM (ZSD), XSD, XSY, EJW, EJT, DTX, and XPG which overall occupied low genetic diversity distributed along the upstream “Ejia-Jiepai” basin, and populations DEY, YJH, YYM, GJD, MHG as well as JPX that owned high genetic diversity distributed along the downstream “Yuanjiang-Nanhun” basin (Figure 1A). As Jiepai that located in the middle of Red River fault zone is the turning point of the “neo-tectonic activity” (Oligo-Miocene, ~23Myr) after the collision of Indian Sub-continent with Laurasia (Tapponnier et al., 1990; Harrison et al., 1996), the gradually enhanced breakage activities from this location to south and north created the discrepancies in geology and climate condition between different drainages (Zhu et al., 2002), resulting in distinct habitats of extant distribution pattern of cpDNA haplotypes.
Population Historical dynamics of C. diannanensis
Glaciations, especially Pleistocene glaciations made deep effects on the spatial distribution of plants (Hewitt, 2000). These sessile organisms are thought to have different response scenarios during the Quaternary ice age, mostly choosing to shift their latitude or altitude ranges (Davis and Shaw, 2001) or seeking for a “shelter” (refugium hypothesis, Holder et al., 1999). Previous studies mostly showed species expansion or stability during the Last Glacial Maximum (LGM) (Marko et al., 2010; Bisconti et al., 2011; Cunha et al., 2011). Within gymnosperms, some species such as Taxus wallichiana (Liu et al., 2013), C. revoluta and C. taitungensise (Chiang et al., 2009) also expanded their geographical distribution during the ice age, while with some other Cycas species (e.g., C. debaoensis Zhan et al., 2011 and C. simplicipinna Feng et al., 2014), a contraction process pattern were detected. From a two set genetic data (cpDNA and nDNA SmHP) of three markers in this study, a possible similar population contraction may appear in C. diannanensis in history from the results of Bayesian skyline plots (Figures 7A,B). Mismatch analysis of the above two data set also rejected the population expansion hypothesis (Figures 6A,B) but a population contraction or a population dynamic equilibrium. However, the nuclear gene RPB1 provided unexpected result in the populations of C. diannanensis which showed a small recent expansion after long term of declining (bottleneck effect) by Bayesian skyline and the possible bottleneck events deducted from mismatch analysis. This discordance may be attributed to historical genetic drift or larger selective pressure existed on this gene (Figures 6C, 7C). Meanwhile, as larger genetic loss may be induced by slower range contraction or shift which brings about lower level of genetic diversity (Arenas et al., 2012), we argue that C. diannanensis were previously widely and continuously distributed before the ice age and slowly contracted (also revealed by our skyline plots of RPB1) into several isolated surviving populations during the glaciation, with relative lower genetic diversity being detected in this study.
It might be suspicious with the reported Cycas species distributed in southwest China had all experienced population retreats (Zhan et al., 2011; Feng et al., 2014, this study) rather than expansion during the Quaternary glaciation. In the case of Cycas diannanensis, the historical dynamics might tend to be closely related with the disjunctive distribution in the “Yuanjiang-Nanhun” basin and “Ejia-Jiepai” basin in the Red River fault zone at present. The Red River fault zone, a geographical boundary of South-China plate and Indo-Sunda plate as well as the principal displacement zone between the South-China plate and Indo-China Peninsula (Zhu et al., 2003), underwent frequent historically geological activities and climate changes since late Miocene. The most recent two dextral strike slip fault events occurred at 5.5 ± 1.5 MaBP and 2.1 ± 0.8 MaBP respectively (Xiang et al., 2007). Interestingly, the above timings were roughly accorded with the time of diversification of extant Cycas (~8.68MaBP, Nuclear plus Plastid gene, full sampled, Nagalingum et al., 2011) and the divergence of Cycas diannanensis haplotypes (2.0–3.8MaBP, this study). The fault region harbors numerous of Cycas species in its ranges, especially in the dry hot valley of southwest China (Wang et al., 1996), which can be considered as a typical glacial refugium for many plant species during Quaternary glaciation period. Therefore, it is possible that frequent geological activities in the Red River fault zone, impacts of glacial falling temperature (Harrison et al., 2001) as well as recent human activities (see discussion below) all exerted profound influences on the population dynamics (contraction) of C. diannanensis.
Conservation Implications for C. diannanensis
The main purpose of conservation genetics is to maintain the evolutionary ability of species for their adaptation to the varying environment (Frankham et al., 2002). The genetic constitution of one species is not only applied for distinguishing it from other species, but also determining its potential adaptation to the environmental variable changes (Van Dyke, 2008). Therefore, the conservation of species' genetic diversity is critical for its long-term survival (Schemske et al., 1994). Our chloroplastic and nuclear data that revealed low genetic diversity as well as the declining population size may trace the species' endangering status. Meanwhile, reduced allelic richness may limit a species' ability to respond to changing selection pressures (Frankel, 1995; Young et al., 1996). In the case of C. diannanensis, most populations occupied one specific haplotype, thus it may be risky as it can lead to a loss of adaptability once they are confronting with climate change or external biological disturbance.
Cycads, for their palm-like leaves and abundant symbols in tradition, are often cultivated as ornaments or traded for medical value (Cousins et al., 2011, 2012). For such anthropogenic reasons, the population size of wild cycads decreases extremely in recent decade years and most cycad species are classified in the Red List (IUCN, 2015). Cycas diannanensis is distributed in a narrow region along the “Ejia-Jiepai” basin and “Yuanjiang-Nanhun” basin in the Red River fault zone, where are often accompanied with fragmented original habitats, and disturbed by human activities such as plowing and grazing. To restore genetic diversity loss resulting from such landscape fragmentation, it needs to be maintained over dozens or hundreds of generations of the endangered species to have a significant effect on the local genetic diversity and population structure (Mona et al., 2014). Furthermore, for the purpose of protecting enough genetic components of C. diannanensis, a strategy of in-situ and ex-situ conservation should be taken, especially with the populations harboring relative higher diversity such as downstream populations HTP, YJH, YYM, MHG, and GJD. Simultaneously, for the populations DEY and JPG which possess high genetic distance and unique haplotypes, measures should also be adopted in order to protect the whole genetic diversity. Considering the above two populations (DEY, JPG) are conserved by cultivation in local regions, seed or seedling reproduction from the two populations are suggested to artificially introduce the genetic components into other regions or in the wild to increase the individual number and genetic diversity of each population.
Availability of Supporting Data
The data set of the DNA sequencing data in our study are deposited in GenBank under accession numbers KT334601-KT334653.
Conflict of Interest Statement
The authors declare that the research was conducted in the absence of any commercial or financial relationships that could be construed as a potential conflict of interest.
Acknowledgments
We thank for the two anonymous reviewers for the helpful suggestions to the manuscript. This research is supported by the United Fund of the NSFC and the Yunnan Natural Science Foundation (U1136602 to X. G.).
Supplementary Material
The Supplementary Material for this article can be found online at: http://journal.frontiersin.org/article/10.3389/fpls.2015.00696
Figure S1. Phylograms of all lineages from the three Cycas species inferred from Bayesian inference based on combined cpDNA (A) and single copy nuclear gene SmHP (B) as well as RPB1 (C) with C. tanqingii being employed as outgroup. Number on each node stands for posterior probability (PP).
Figure S2. Delta-K curves by Structure Harvester based on the Structure analysis of cpDNA (A) and single copy nuclear gene SmHP (B) as well as RPB1 (C).
References
Arenas, M., Ray, N., Currat, M., and Excoffier, L. (2012). Consequences of range contractions and range shifts on molecular diversity. Mol. Biol. Evol. 29, 207–218. doi: 10.1093/molbev/msr187
Barrett, C. F., and Freudenstein, J. V. (2011). An integrative approach to delimiting species in a rare but widespread mycoheterotrophic orchid. Mol. Ecol. 20, 2771–2786. doi: 10.1111/j.1365-294X.2011.05124.x
Bisconti, R., Canestrelli, D., Colangelo, P., and Nascetti, G. (2011). Multiple lines of evidence for demographic and range expansion of a temperate species (Hyla sarda) during the last glaciation. Mol. Ecol. 20, 5313–5327. doi: 10.1111/j.1365-294X.2011.05363.x
Brower, A. V. Z. (1999). Delimitation of phylogenetic species with DNA sequences: a critique of Davis and Nixon's population aggregation analysis. Syst. Biol. 48, 199–213. doi: 10.1080/106351599260535
Burleigh, J. G., Barbazuk, W. B., Davis, J. M., Morse, A. M., and Soltis, P. S. (2012). Exploring diversification and genome size evolution in extant gymnosperms through phylogenetic synthesis. J. Bot. 2012:292857. doi: 10.1155/2012/292857
Butlin, R., Debelle, A., Kerth, C., Snook, R. R., Beukeboom, L. W., Castillo Cajas, R. F., et al. (2012). What do we need to know about speciation? Trends Ecol. Evol. 27, 27–39. doi: 10.1016/j.tree.2011.09.002
Carstens, B. C., and Dewey, T. A. (2010). Species delimitation using a combined coalescent and information-theoretic approach: an example from North American Myotis bats. Syst. Biol. 59, 400–414. doi: 10.1093/sysbio/syq024
Chiang, Y. C., Hung, K. H., Moore, S. J., Ge, X. J., Huang, S., Hsu, T. W., et al. (2009). Paraphyly of organelle DNAs in Cycas Sect. Asiorientales due to ancient ancestral polymorphisms. BMC Evol. Biol. 9:161. doi: 10.1186/1471-2148-9-161
Comes, H. P., and Kadereit, J. W. (1998). The effect of Quaternary climatic changes on plant distribution and evolution. Trends Plant Sci. 3, 432–438. doi: 10.1016/S1360-1385(98)01327-2
Cousins, S. R., Williams, V. L., and Witkowski, E. T. F. (2011). Quantifying the trade in cycads (Encephalartos species) in the traditional medicine markets of Johannesburg and Durban, South Africa. Econ. Bot. 65, 365–370. doi: 10.1007/s12231-011-9173-0
Cousins, S. R., Williams, V. L., and Witkowski, E. T. F. (2012). Uncovering the cycad taxa (Encephalartos species) traded for traditional medicine in Johannesburg and Durban, South Africa. S. Afr. J. Bot. 78, 129–138. doi: 10.1016/j.sajb.2011.06.001
Cunha, R. L., Lopes, E. P., Reis, D. M., and Castilho, R. (2011). Genetic structure of Brachidontes puniceus populations in Cape Verde archipelago shows signature of expansion during the last glacial maximum. J. Molluscan Stud. 77, 175–181. doi: 10.1093/mollus/eyr001
Darriba, D., Taboada, G. L., Doallo, R., and Posada, D. (2012). jModelTest 2: more models, new heuristics and parallel computing. Nat. Methods 9, 772. doi: 10.1038/nmeth.2109
Darwin, C. (1859). On the Origin of Species by Means of Natural Selection, or the Preservation of Favoured Races in the Struggle for Life. London: John Murray. ISBN 1-4353-9386-4 (Retrieved 24 October, 2008).
Davis, M. B., and Shaw, R. G. (2001). Range shifts and adaptive responses to Quaternary climate change. Science 292, 673–679. doi: 10.1126/science.292.5517.673
de Queiroz, K. (1998). “The general lineage concept of species, species criteria, and the process of speciation: a conceptual unification and terminological recommendations,” in Endless Forms: Species and Speciation, eds D. J. Howard and S. H. Berlocher (New York, NY: Oxford University Press), 57–75.
de Queiroz, K. (2005). Ernst Mayr and the modern concept of species. Proc. Natl. Acad. Sci. U.S.A. 102, 6600–6607. doi: 10.1073/pnas.0502030102
De Queiroz, K. (2007). Species concepts and species delimitation. Syst. Biol. 56, 879–886. doi: 10.1080/10635150701701083
Dobzhansky, T., and Dobzhansky, T. G. (1937). Genetics and the Origin of Species. New York, NY: Columbia University Press.
Doyle, J. (1991). “DNA protocols for plants-CTAB total DNA isolation,” in Molecular Techniques in Taxonomy, eds G. M. Hewitt and A. Johnston (Berlin: Springer-Verlag), 283–293.
Drummond, A. J., Suchard, M. A., Xie, D., and Rambaut, A. (2012). Bayesian phylogenetics with BEAUti and the BEAST 1.7. Mol. Biol. Evol. 29, 1969–1973. doi: 10.1093/molbev/mss075
Earl, D. A. (2012). STRUCTURE HARVESTER: a website and program for visualizing STRUCTURE output and implementing the Evanno method. Conserv. Genet. Resour. 4, 359–361. doi: 10.1007/s12686-011-9548-7
Ence, D. D., and Carstens, B. C. (2011). SpedeSTEM: a rapid and accurate method for species delimitation. Mol. Ecol. Resour. 11, 473–480. doi: 10.1111/j.1755-0998.2010.02947.x
Evanno, G., Regnaut, S., and Goudet, J. (2005). Detecting the number of clusters of individuals using the software STRUCTURE: a simulation study. Mol. Ecol. 14, 2611–2620. doi: 10.1111/j.1365-294X.2005.02553.x
Excoffier, L., Laval, G., and Schneider, S. (2005). Arlequin (version 3.0): an integrated software package for population genetics data analysis. Evol. Bioinform. Online 1, 47.
Feng, X. Y., Wang, Y. H., and Gong, X. (2014). Genetic diversity, genetic structure and demographic history of Cycas simplicipinna (Cycadaceae) assessed by DNA sequences and SSR markers. BMC Plant Biol. 14:187. doi: 10.1186/1471-2229-14-187
Forster, M., Forster, P., and Watson, J. (2007). NETWORK (version 4.2. 0.1): a Software for Population Genetics Data Analysis. Fluxus Technology Ltd, Clare. Available online at: fluxus-engineering.com
Frankel, O. H. (1995). The Conservation of Plant Biodiversity. Cambridge, UK: Cambridge University Press.
Frankham, R., Briscoe, D. A., and Ballou, J. D. (2002). Introduction to Conservation Genetics. Cambridge: Cambridge University Press.
Fujita, M. K., Leaché, A. D., Burbrink, F. T., Mcguire, J. A., and Moritz, C. (2012). Coalescent-based species delimitation in an integrative taxonomy. Trends Ecol. Evol. 27, 480–488. doi: 10.1016/j.tree.2012.04.012
Gong, X., Luan, S. S., Hung, K. H., Hwang, C. C., Lin, C. J., Chiang, Y. C., et al. (2011). Population structure of Nouelia insignis (Asteraceae), an endangered species in southwestern China, based on chloroplast DNA sequences: recent demographic shrinking. J. Plant Res. 124, 221–230. doi: 10.1007/s10265-010-0363-0
Graur, D., and Li, W. H. (2000). Fundamentals of Molecular Evolution. Sunderland: Sinauer Associates.
Guindon, S., Dufayard, J. F., Lefort, V., Anisimova, M., Hordijk, W., and Gascuel, O. (2010). New algorithms and methods to estimate maximum-likelihood phylogenies: assessing the performance of PhyML 3.0. Syst. Biol. 59, 307–321. doi: 10.1093/sysbio/syq010
Hall, T. A. (1999). BioEdit: a user-friendly biological sequence alignment editor and analysis program for Windows 95/98/NT. Nucleic Acids Symp. Ser. 41, 95–98.
Hamrick, J. L., Godt, M. J. W., and Sherman-Broyles, S. L. (1992). “Factors influencing levels of genetic diversity in woody plant species,” in Proceedings of the International Symposium on Population Genetics of Forest Trees, eds W. T. Adams, S. H. Strauss, D. L. Copes, A. R. Griffin (Oregon: Springer Science & Business Media), 95–124. doi: 10.1007/978-94-011-2815-5_7
Harison, T., Chen, W., and Leloup, P. (1992). An early Miocene transition in deformation region with the Red River Fault zone, Yunnan and its significance for Indo-Asian Tectonics. J. Geophys. Res. 97, 7559–7682.
Harrington, R. C., and Near, T. J. (2012). Phylogenetic and coalescent strategies of species delimitation in snubnose darters (Percidae: Etheostoma). Syst. Biol. 61, 63–79. doi: 10.1093/sysbio/syr077
Harrison, S., Yu, G., Takahara, H., and Prentice, I. (2001). Palaeovegetation (Communications arising): diversity of temperate plants in east Asia. Nature 413, 129–130. doi: 10.1038/35093166
Harrison, T. M., Leloup, P., Ryerson, F., Tapponnier, P., Lacassin, R., and Chen, W. (1996). “Diachronous initiation of transtension along the Ailao Shan-Red River shear zone, Yunnan and Vietnam,” in Tectonic Evolution of Asia, eds A. Yin and T. M. Harrison (New York, NY: Cambridge University Press), 208–226.
Hewitt, G. (2000). The genetic legacy of the Quaternary ice ages. Nature 405, 907–913. doi: 10.1038/35016000
Hewitt, G. (2004). Genetic consequences of climatic oscillations in the Quaternary. Philos. Trans. R. Soc. Lond. B Biol. Sci. 359, 183–195. doi: 10.1098/rstb.2003.1388
Hewitt, G. M. (2001). Speciation, hybrid zones and phylogeography or seeing genes in space and time. Mol. Ecol. 10, 537–549. doi: 10.1046/j.1365-294x.2001.01202.x
Hill, K. (1994a). The Cycas media group (Cycadaceae) in new guinea. Aust. Syst. Bot. 7, 527–541. doi: 10.1071/SB9940527
Hill, K. (1994b). The Cycas rumphii complex (Cycadaceae) in New Guinea and the western Pacific. Aust. Syst. Bot. 7, 543–567. doi: 10.1071/SB9940543
Hill, K. (2008). The genus Cycas (Cycadaceae) in China. Telopea 12, 71–118. doi: 10.7751/telopea20085804
Holder, K., Montgomerie, R., and Friesen, V. (1999). A test of the glacial refugium hypothesis using patterns of mitochondrial and nuclear DNA sequence variation in rock ptarmigan (Lagopus mutus). Evolution 1936–1950. doi: 10.2307/2640452
Huang, C. C., Hung, K. H., Hwang, C. C., Huang, J. C., Lin, H. D., Wang, W. K., et al. (2011). Genetic population structure of the alpine species Rhododendron pseudochrysanthum sensu lato (Ericaceae) inferred from chloroplast and nuclear DNA. BMC Evol. Biol. 11:108. doi: 10.1186/1471-2148-11-108
Huang, J. C., Wang, W. K., Peng, C. I., and Chiang, T. Y. (2005). Phylogeography and conservation genetics of Hygrophila pogonocalyx (Acanthaceae) based on atpB–rbcL noncoding spacer cpDNA. J. Plant Res. 118, 1–11. doi: 10.1007/s10265-004-0185-z
Ikeda, H., Senni, K., Fujii, N., and Setoguchi, H. (2008). Consistent geographic structure among multiple nuclear sequences and cpDNA polymorphisms of Cardamine nipponica Franch. et Savat. (Brassicaceae). Mol. Ecol. 17, 3178–3188. doi: 10.1111/j.1365-294X.2008.03821.x
IUCN. (2015). The IUCN Red List of Threatened Species. Version 2015.1. Available online at: http://www.iucnredlist.org
Jia, J., Wu, H., Wang, J. F., and Gong, X. (2014). Genetic diversity and structure of Munronia delavayi Franch. (Meliaceae), an endemic species in the dry-hot valley of Jinsha River, south-western China. Genet. Resour. Crop Evol. 61, 1381–1395. doi: 10.1007/s10722-014-0120-7
Jiang, H. (2004). “The taxonomical supplement and revision of cycas in Yunnan,” in Proc. Acad. Conf. Cycad China (Gejiu).
Knowles, L. L., and Carstens, B. C. (2007). Delimiting species without monophyletic gene trees. Syst. Biol. 56, 887–895. doi: 10.1080/10635150701701091
Kyoda, S., and Setoguchi, H. (2010). Phylogeography of Cycas revoluta Thunb. (Cycadaceae) on the Ryukyu Islands: very low genetic diversity and geographical structure. Plant Syst. Evol. 288, 177–189. doi: 10.1007/s00606-010-0322-1
Lande, R. (1988). Genetics and demography in biological conservation. Science 241, 1455–1460. doi: 10.1126/science.3420403
Leloup, P. H., Lacassin, R., Tapponnier, P., Schärer, U., Zhong, D., Liu, X., et al. (1995). The Ailao Shan-Red River shear zone (Yunnan, China), Tertiary transform boundary of Indochina. Tectonophysics 251, 3–84. doi: 10.1016/0040-1951(95)00070-4
Lexer, C., and Widmer, A. (2008). The genic view of plant speciation: recent progress and emerging questions. Philos. Trans. R. Soc. Lond. B Biol. Sci. 363, 3023–3036. doi: 10.1098/rstb.2008.0078
Librado, P., and Rozas, J. (2009). DnaSP v5: a software for comprehensive analysis of DNA polymorphism data. Bioinformatics 25, 1451–1452. doi: 10.1093/bioinformatics/btp187
Liu, J., Möller, M., Provan, J., Gao, L. M., Poudel, R. C., and Li, D. Z. (2013). Geological and ecological factors drive cryptic speciation of yews in a biodiversity hotspot. New Phytol. 199, 1093–1108. doi: 10.1111/nph.12336
Liu, N. (2004). “The Cycas taiwaniana Complex in southeast China,” in Proc. Acad. Conf. Cycad China (Gejiu).
Lu, Y., Ran, J. H., Guo, D. M., Yang, Z. Y., and Wang, X. Q. (2014). Phylogeny and divergence times of gymnosperms inferred from single-copy nuclear genes. PLoS ONE 9:e107679. doi: 10.1371/journal.pone.0107679
Mallet, J. (1995). A species definition for the modern synthesis. Trends Ecol. Evol. 10, 294–299. doi: 10.1016/0169-5347(95)90031-4
Marchelli, P., Baier, C., Mengel, C., Ziegenhagen, B., and Gallo, L. (2010). Biogeographic history of the threatened species Araucaria araucana (Molina) K. Koch and implications for conservation: a case study with organelle DNA markers. Conserv. Genet. 11, 951–963. doi: 10.1007/s10592-009-9938-5
Marko, P. B., Hoffman, J. M., Emme, S. A., Mcgovern, T. M., Keever, C. C., and Nicole Cox, L. (2010). The ‘Expansion’Contraction'model of Pleistocene biogeography: rocky shores suffer a sea change? Mol. Ecol. 19, 146–169. doi: 10.1111/j.1365-294X.2009.04417.x
Mayr, E. (1942). Systematics and the Origin of Species, from the Viewpoint of a Zoologist. Cambridge, MA: Harvard University Press.
Mona, S., Ray, N., Arenas, M., and Excoffier, L. (2014). Genetic consequences of habitat fragmentation during a range expansion. Heredity 112, 291–299. doi: 10.1038/hdy.2013.105
Nagalingum, N., Marshall, C., Quental, T., Rai, H., Little, D., and Mathews, S. (2011). Recent synchronous radiation of a living fossil. Science 334, 796–799. doi: 10.1126/science.1209926
Niemiller, M. L., Near, T. J., and Fitzpatrick, B. M. (2012). Delimiting species using multilocus data: diagnosing cryptic diversity in the southern cavefish, Typhlichthys subterraneus (Teleostei: Amblyopsidae). Evolution 66, 846–866. doi: 10.1111/j.1558-5646.2011.01480.x
Nong, B. X., Huang, Y. Y., and Liu, C. (2011). Genetic relationships analysis in some species of Cycas in China by RAPD markers. Guihaia. 31, 167–174.
O'meara, B. C. (2009). New heuristic methods for joint species delimitation and species tree inference. Syst. Biol. 59, 59–73. doi: 10.1093/sysbio/syp077
Peakall, R. O. D., and Smouse, P. E. (2006). GENALEX 6: genetic analysis in Excel. Population genetic software for teaching and research. Mol. Ecol. Notes 6, 288–295. doi: 10.1111/j.1471-8286.2005.01155.x
Petit, R. J., Duminil, J., Fineschi, S., Hampe, A., Salvini, D., and Vendramin, G. G. (2005). Invited review: comparative organization of chloroplast, mitochondrial and nuclear diversity in plant populations. Mol. Ecol. 14, 689–701. doi: 10.1111/j.1365-294X.2004.02410.x
Petit, R. J., and Excoffier, L. (2009). Gene flow and species delimitation. Trends Ecol. Evol. 24, 386–393. doi: 10.1016/j.tree.2009.02.011
Posada, D. (2008). jModelTest: phylogenetic model averaging. Mol. Biol. Evol. 25, 1253–1256. doi: 10.1093/molbev/msn083
Qiu, Y. X., Guan, B. C., Fu, C. X., and Comes, H. P. (2009). Did glacials and/or interglacials promote allopatric incipient speciation in East Asian temperate plants? Phylogeographic and coalescent analyses on refugial isolation and divergence in Dysosma versipellis. Mol. Phylogen. Evol. 51, 281–293. doi: 10.1016/j.ympev.2009.01.016
Quicke, D. L., Jones, O. R., and Epstein, D. R. (2007). Correcting the problem of false incongruence due to noise imbalance in the incongruence length difference (ILD) test. Syst. Biol. 56, 496–503. doi: 10.1080/10635150701429974
Rambaut, A., Suchard, M., Xie, D., and Drummond, A. (2014). Tracer v1. 6. Chromosomal Evolution in Higher Plants. Available online at: http://beast.bio.ed.ac.uk/tracer
Reed, D. H., and Frankham, R. (2001). How closely correlated are molecular and quantitative measures of genetic variation? a meta-analysis. Evolution 55, 1095–1103. doi: 10.1111/j.0014-3820.2001.tb00629.x
Rissler, L. J., and Apodaca, J. J. (2007). Adding more ecology into species delimitation: ecological niche models and phylogeography help define cryptic species in the black salamander (Aneides flavipunctatus). Syst. Biol. 56, 924–942. doi: 10.1080/10635150701703063
Ronquist, F., Teslenko, M., Van Der Mark, P., Ayres, D. L., Darling, A., Höhna, S., et al. (2012). MrBayes 3.2: efficient Bayesian phylogenetic inference and model choice across a large model space. Syst. Biol. 61, 539–542. doi: 10.1093/sysbio/sys029
Schemske, D. W., Husband, B. C., Ruckelshaus, M. H., Goodwillie, C., Parker, I. M., and Bishop, J. G. (1994). Evaluating approaches to the conservation of rare and endangered plants. Ecology 75, 584–606. doi: 10.2307/1941718
Shaffer, H. B., and Thomson, R. C. (2007). Delimiting species in recent radiations. Syst. Biol. 56, 896–906. doi: 10.1080/10635150701772563
Shaw, J., Lickey, E. B., Beck, J. T., Farmer, S. B., Liu, W., Miller, J., et al. (2005). The tortoise and the hare II: relative utility of 21 noncoding chloroplast DNA sequences for phylogenetic analysis. Am. J. Bot. 92, 142–166. doi: 10.3732/ajb.92.1.142
Sites, J. W., and Marshall, J. C. (2003). Delimiting species: a Renaissance issue in systematic biology. Trends Ecol. Evol. 18, 462–470. doi: 10.1016/S0169-5347(03)00184-8
Spielman, D., Brook, B. W., and Frankham, R. (2004). Most species are not driven to extinction before genetic factors impact them. Proc. Natl. Acad. Sci. U.S.A. 101, 15261–15264. doi: 10.1073/pnas.0403809101
Swindell, S. R., and Plasterer, T. N. (1997). SEQMAN[M]//Sequence Data Analysis Guidebook. NewYork, NY: Springer.
Swofford, D. L. (2002). Phylogenetic Analysis Using Parsimony (* and Other Methods). Version 4. Sunderland, MA: Sinauer Associates.
Tapponnier, P., Lacassin, R., Leloup, P. H., Schärer, U., Dalai, Z., Haiwei, W., et al. (1990). The Ailao Shan/Red River metamorphic belt: tertiary left-lateral shear between Indochina and South China. Nature 343, 431–437. doi: 10.1038/343431a0
Templeton, A. R., Robertson, R. J., Brisson, J., and Strasburg, J. (2001). Disrupting evolutionary processes: the effect of habitat fragmentation on collared lizards in the Missouri Ozarks. Proc. Natl. Acad. Sci. U.S.A. 98, 5426–5432. doi: 10.1073/pnas.091093098
Thompson, J. D., Gibson, T. J., Plewniak, F., Jeanmougin, F., and Higgins, D. G. (1997). The CLUSTAL_X windows interface: flexible strategies for multiple sequence alignment aided by quality analysis tools. Nucleic Acids Res. 25, 4876–4882. doi: 10.1093/nar/25.24.4876
Turelli, M., Barton, N. H., and Coyne, J. A. (2001). Theory and speciation. Trends Ecol. Evol. 16, 330–343. doi: 10.1016/S0169-5347(01)02177-2
Van Dyke, F. (2008). Conservation Biology: Foundations, Concepts, Applications. Dordrecht: Springer Science & Business Media.
Wang, D. Y. (2000). Morphlogy, Systematics and Evolution of Cycadaceae. Nanjing: Nanjing Forestry University.
Wang, F. X, Liang, H. B., Chen, T. Q., and Wang, D. Y. (1996). Cycads in China. Guangzhou: Guangdong Science and Technology Press.
Wang, X. Q., and Ran, J. H. (2014). Evolution and biogeography of gymnosperms. Mol. Phylogen. Evol. 75, 24–40. doi: 10.1016/j.ympev.2014.02.005
Wiens, J. J. (2007). Species delimitation: new approaches for discovering diversity. Syst. Biol. 56, 875–878. doi: 10.1080/10635150701748506
Wiens, J. J., and Penkrot, T. A. (2002). Delimiting species using DNA and morphological variation and discordant species limits in spiny lizards (Sceloporus). Syst. Biol. 51, 69–91. doi: 10.1080/106351502753475880
Wu, C. I. (2001). The genic view of the process of speciation. J. Evol. Biol. 14, 851–865. doi: 10.1046/j.1420-9101.2001.00335.x
Wu, C. Y., and Raven, P. (1999). Flora of China. Beijing; St. Louis, MO: Science Press; Missouri Botanical Garden Press.
Xiang, H., Wan, J., Han, Z., Guo, S., Zhang, W., Chen, L., et al. (2007). Geological analysis and FT dating of the large-scale right-lateral strike-slip movement of the Red River fault zone. Sci. China Ser. D Earth Sci. 50, 331–342. doi: 10.1007/s11430- 007-2037-x
Xiao, L. Q., and Gong, X. (2006). Genetic differentiation and relationships of populations in the Cycas balansae complex (Cycadaceae) and its conservation implications. Ann. Bot. 97, 807–812. doi: 10.1093/aob/mcl039
Yang, S. L., and Meerow, A. W. (1996). The Cycas pectinata (Cycadaceae) complex: genetic structure and gene flow. Int. J. Plant Sci. 157, 468–483. doi: 10.1086/297364
Yang, Z., and Rannala, B. (2010). Bayesian species delimitation using multilocus sequence data. Proc. Natl. Acad. Sci. U.S.A. 107, 9264–9269. doi: 10.1073/pnas.0913022107
Yoder, A. D., Irwin, J. A., and Payseur, B. A. (2001). Failure of the ILD to determine data combinability for slow loris phylogeny. Syst. Biol. 50, 408–424. doi: 10.1080/106351501300318003
Young, A., Boyle, T., and Brown, T. (1996). The population genetic consequences of habitat fragmentation for plants. Trends Ecol. Evol. 11, 413–418. doi: 10.1016/0169-5347(96)10045-8
Zhan, Q. Q., Wang, J. F., Gong, X., and Peng, H. (2011). Patterns of chloroplast DNA variation in Cycas debaoensis (Cycadaceae): conservation implications. Conserv. Genet. 12, 959–970. doi: 10.1007/s10592-011-0198-9
Zhang, Q. Y., Zhao, Y. J., and Gong, X. (2011). Genetic variation and phylogeography of Psammosilene tunicoides (Caryophyllaceae), a narrowly distributed and endemic species in south-western China. Aust. J. Bot. 59, 450–459. doi: 10.1071/BT11024
Zhao, Y. J., and Gong, X. (2012). Genetic structure of the endangered Leucomeris decora (Asteraceae) in China inferred from chloroplast and nuclear DNA markers. Conserv. Genet. 13, 271–281. doi: 10.1007/s10592-011-0281-2
Zhu, J. J., Zhan, W. H., Tang, C., and Qiu, X. L., (2002). Study on fractal characteristic of hydrographic nets and activity of the Red River Fault Zone. South China J. Seis. 22, 1–7. doi: 10.3969/j.issn.1001-8662.2002.01.001
Keywords: Cycas, species delimitation, tree-based, sympatry, population dynamics, conservation genetics, Red River region, China
Citation: Liu J, Zhou W and Gong X (2015) Species delimitation, genetic diversity and population historical dynamics of Cycas diannanensis (Cycadaceae) occurring sympatrically in the Red River region of China. Front. Plant Sci. 6:696. doi: 10.3389/fpls.2015.00696
Received: 18 June 2015; Accepted: 21 August 2015;
Published: 08 September 2015.
Edited by:
Miguel Arenas, Institute of Molecular Pathology and Immunology of the University of Porto, PortugalReviewed by:
Yang Liu, School of Life Sciences/Sun Yat-sen University, ChinaXiaozeng Yang, Dow Chemical, USA
Copyright © 2015 Liu, Zhou and Gong. This is an open-access article distributed under the terms of the Creative Commons Attribution License (CC BY). The use, distribution or reproduction in other forums is permitted, provided the original author(s) or licensor are credited and that the original publication in this journal is cited, in accordance with accepted academic practice. No use, distribution or reproduction is permitted which does not comply with these terms.
*Correspondence: Xun Gong, Key Laboratory for Plant Diversity and Biogeography of East Asia, Kunming Institute of Botany, Chinese Academy of Sciences, Heilongtan, Lanhei Road 132, Kunming 650201, China,Z29uZ3h1bkBtYWlsLmtpYi5hYy5jbg==