 Umar M. Quraishi1,2*
 Caroline Pont2Qurat-ul Ain1
 Raphael Flores3Laura Burlot3
 Michael Alaux3Hadi Quesneville3
 Jerome Salse2*
- 1Department of Plant Sciences, Quaid-i-Azam University, Islamabad, Pakistan
- 2Institut National de la Recherche Agronomique, Université Clermont Auvergne, UMR 1095 Génétique, Diversité et Ecophysiologie des Céréales, Clermont-Ferrand, France
- 3Institut National de la Recherche Agronomique UR1164 URGI (Research Unit in Genomics-Info), Université Paris-Saclay, Versailles, France
The high resolution integration of bread wheat genetic and genomic resources accumulated during the last decades offers the opportunity to unveil candidate genes driving major agronomical traits to an unprecedented scale. We combined 27 public quantitative genetic studies and four genetic maps to deliver an exhaustive consensus map consisting of 140,315 molecular markers hosting 221, 73, and 82 Quantitative Trait Loci (QTL) for respectively yield, baking quality, and grain protein content (GPC) related traits. Projection of the consensus genetic map and associated QTLs onto the wheat syntenome made of 99,386 genes ordered on the 21 chromosomes delivered a complete and non-redundant repertoire of 18, 8, 6 metaQTLs for respectively yield, baking quality and GPC, altogether associated to 15,772 genes (delivering 28,630 SNP-based makers) including 37 major candidates. Overall, this study illustrates a translational research approach in transferring information gained from grass relatives to dissect the genomic regions hosting major loci governing key agronomical traits in bread wheat, their flanking markers and associated candidate genes to be now considered as a key resource for breeding programs.
Introduction
The development of high-yielding, durably stress-tolerant wheat varieties is essential to ensure present and future food security in coping to ongoing and future climate change (Boyer and Westgate, 2004; Heijmans et al., 2005; Habash et al., 2009). This can only be achieved through the identification of the genetic bases of key traits and their proper utilization in genomics-assisted breeding programs. Bread wheat (Triticum aestivum L.), 3rd cereal for production and 1st for world trade, has been a central crop for the development of numerous genetic and genomic resources by the scientific community during the last decades to reach this objective (Borrill et al., 2015). However, very few genetic/genomic information have been effectively transferred into breeding programs due to the lack of an integrative framework of the existing resources, references to as meta-analysis.
Meta-analysis is the statistical concept of integrating in a single analysis different data obtained independently. The meta-analysis concept was transposed by Goffinet and Gerber (2000) into the field of genetics and especially into the concept of the calculation of meta- Quantitative Trait Loci (QTL) from independent studies (Veyrieras et al., 2007). The method allows the length of the confidence interval of QTL location to be consistently reduced when there is co-localization of several QTL loci deriving from independent quantitative genetic studies. This derived method (meta-QTL, hereafter MQTL) was successfully carried out on dairy cattle (MacLeod et al., 2003; Khatkar et al., 2004; Charbonneau et al., 2006; Lean et al., 2006), Human (Heijmans et al., 2005; Lawlor et al., 2006; Rice et al., 2006), as well as in the field of plant breeding and more precisely for the genetic determinisms of flowering time in maize (Chardon et al., 2004, 2005; Salvi et al., 2011) and wheat (Hanocq et al., 2007; Griffiths et al., 2009; Gegas et al., 2010; Tyagi et al., 2015).
Genetic resources and associated genome-wide diversity maps have been made publicly available for hexaploids (Chao et al., 2010; Allen et al., 2011, 2013; Lai et al., 2012; Winfield et al., 2012; Cavanagh et al., 2013), tetraploids (Saintenac et al., 2011; Trebbi et al., 2011), or diploid (You et al., 2011; Wang et al., 2013) wheats. Despite the previous genetic data accumulated during the last decade, wheat genomic resources have also been recently published with the release of the genome shotgun sequences of hexaploid (Brenchley et al., 2012; International Wheat Genome Sequencing Consortium, 2014) and diploid (Jia et al., 2013; Ling et al., 2013; Luo et al., 2013) wheats. The access to such public resources offers now the opportunity to unveil, to an unprecedented scale, the molecular mechanisms driving major agronomical traits in wheat in conducting a meta-analysis integrating genetic (markers and QTLs) and genomic (gene and genome sequences) data to deliver a completed catalog of markers and putative candidate genes driving such traits.
A large bibliographic survey allowed us to identify more than 90 publications for agronomic traits in bread wheat (excluding biotic and abiotic stresses). Out of these, 27 (~30%) publications provided the necessary information for MQTL calculation such as, the genetic mapping (marker name, position) as well as QTL information (LOD score, confidence interval, position on the genetic map, R2) for grain yield (with grain number, tons per hectare, tiller number, thousand kernel weight, harvest index, plant height), grain protein content (GPC), and baking quality (with pentosan viscosity, dough strength, volume, panification, durity, height of bubble in alveograph, pel-schank, total starch, flour swelling volume, particule size index, slope after peak of mixograph) traits (Charmet et al., 2001; Börner et al., 2002; Groos et al., 2003, 2007; Prasad et al., 2003; Huang et al., 2004, 2006; Turner et al., 2004; Kulwal et al., 2005; McCartney et al., 2005, 2006; Kumar et al., 2006; Narasimhamoorthy et al., 2006; Laperche et al., 2007; Li et al., 2007; Chu et al., 2008; Cuthbert et al., 2008; Sun et al., 2008; Wang et al., 2009, 2011; Deng et al., 2011; Tang et al., 2011; Bennett et al., 2012; Mir et al., 2012; Liu et al., 2013). From these genetic and genomic resources, we deliver in the current study (i) the construction of a dense composite genetic map on which major public genetic maps has been integrated; (ii) the projection of public QTLs for yield, baking quality and GPC from different populations; (iii) the calculation of consensus MQTLs; (iv) the identification of candidate genes exploiting the synteny with grass relatives.
Results
High Resolution Wheat Consensus Genetic Map
In order to integrate public quantitative genetic studies of traits (Figure 1), we constructed a high resolution consensus genetic map using Biomercator v3.0 software (Sosnowski et al., 2012), removing markers showing inconsistency in their positions between the considered genetic maps, due to errors in mapping or genotype-specific inversions and translocations, using mapinspect v2.0 software. Following this strategy, four public genetic maps have been integrated consisting in 2,293 markers from Xu et al. (2008), 1,239 markers from Somers et al. (2004), 40,267 markers from Wang et al. (2014) and 104,804 markers from Saintenac et al. (2013). The derived consensus high-resolution genetic map is made of 140,315 molecular markers (with an average of 6,682 markers per chromosome) and a recombination distance of 4,853.22 cM (1,687.22, 1,489.19, and 1,676.80 cM for the A, B, and D subgenomes respectively), Figure 2 and Table 1. The highest number of markers were obtained on the homoeologous group 2 (23,311) and the B subgenome (55,524) with the lowest number of markers found on the homoeologous group 4 (14,175) and the D subgenome (38,058). The consensus genetic map, consisting in SSRs (4,367), RFLPs (2,001), DarTs (2,231), Genes (284) and SNPs (131,432), is made available as Supplementary Table 1.
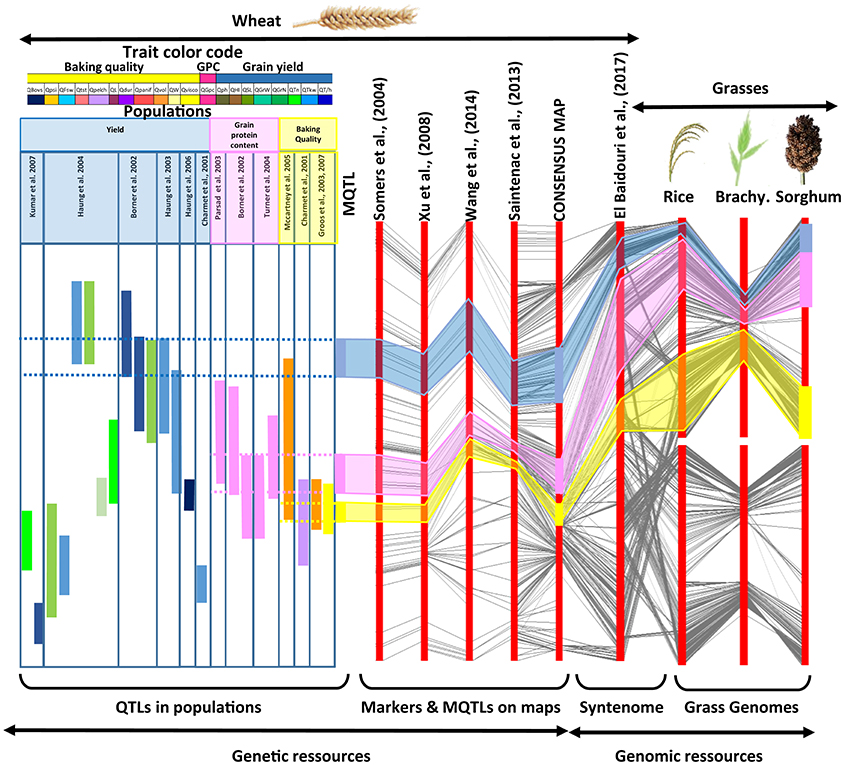
Figure 1. Strategy for genomic and genetic resources integration. The figure, from left to right, illustrates the integration of (i) independent QTL analyses from distinct mapping populations deriving MQTLs (with a color code for the considered traits and populations, top), (ii) genetic maps deriving a consensus high density map (with conserved markers linked with black connecting lines), (iii) the syntenome deriving from the exploitation of the synteny with relatives (with rice, Brachypodium and sorghum orthologs linked with black connecting lines). This strategy fills the gap between low resolution QTL intervals in a species of interest (left) and known gene functions in closely related species for a considered trait (right).
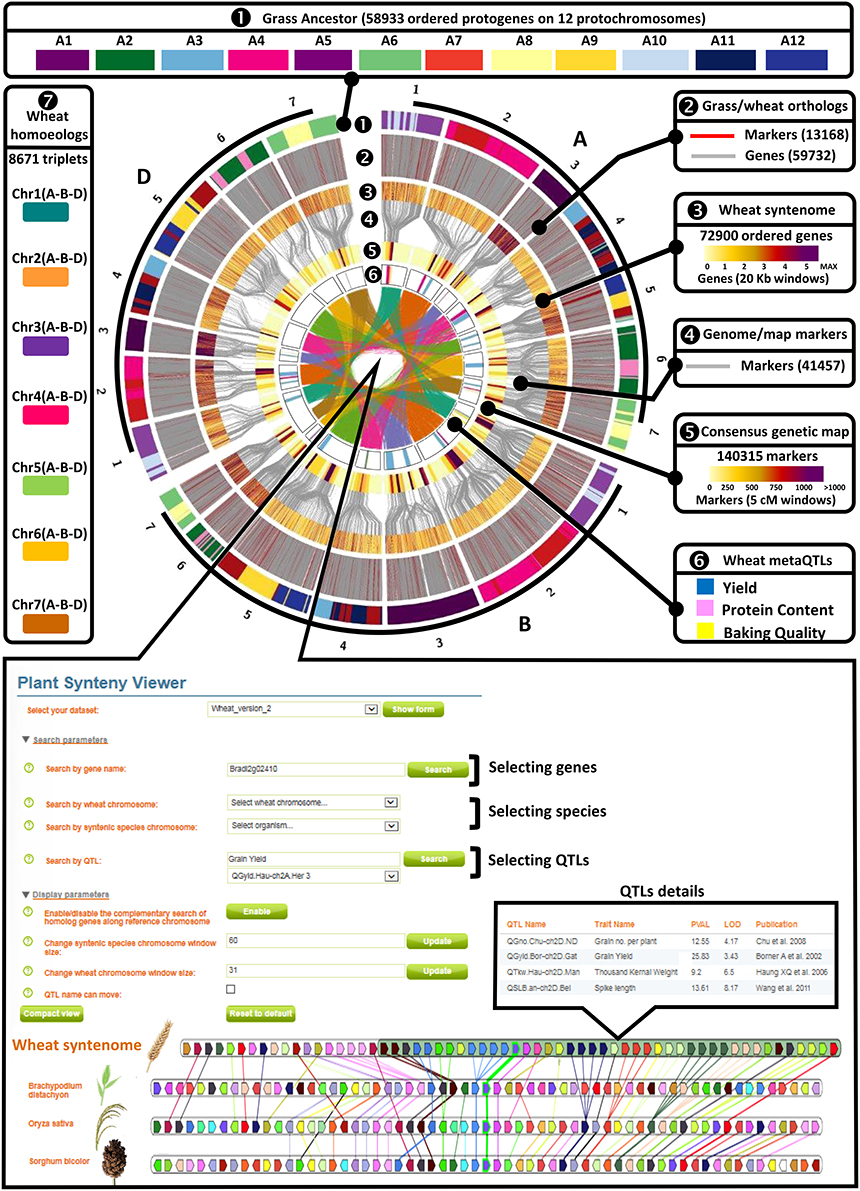
Figure 2. Genomic and genetic integration of major agronomical traits in bread wheat. A—Wheat genomic and genetic resources. Circle 1—Illustration of the synteny between the n = 12 AGK (color code for A1–A12) and the 21 bread wheat chromosomes (1–21). Circle 2—Illustration of the wheat genes ordered on the 21 chromosomes based on molecular markers (red connecting lines) and synteny with AGK (gray connecting lines). Circle 3—Heat map illustration of the gene density (color code in legend for the number of genes within 20 kbp physical windows) on the 21 chromosomes. Circle 4—Molecular markers bridging (gray connecting lines) the consensus genetic map to the syntenome. Circle 5—Heat map illustration of the marker density (color code in legend for the number of markers within 5 cM genetic intervals) on the 21 chromosomes. Circle 6—Illustration of the MQTL intervals with a color code for yield (blue), protein content (pink), and baking quality (yellow). Center 7—Illustration of the retained homoeologous triplets (A, B, and D copies) on the 21 chromosomes. B—Wheat web viewer. Screen capture of the PlantSyntenyViewer web tool [http://urgi.versailles.inra.fr/synteny-wheat] visualizing the synteny between wheat, Brachypodium, rice, sorghum and delivering the access to the wheat syntenome made of 72,900 genes ordered on the 21 chromosomes as well as the information (populations, traits, flanking markers, trial details) related to the 376 QTLs, 32 MQTLs, and 37 candidate genes described in the current study.
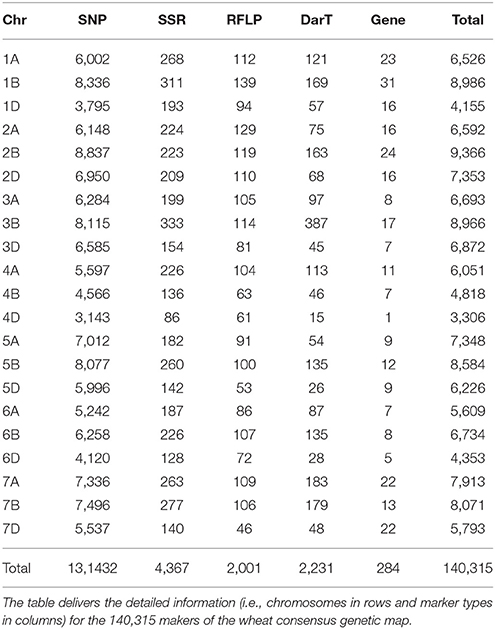
Table 1. Wheat consensus genetic map.
Major MetaQTLs of Wheat Traits
Twenty-seven independent quantitative genetic studies delivering 376 QTLs related to grain yield (GY), grain protein content (GPC) and baking quality (BQ) were projected onto the previous high resolution consensus genetic map (Figure 1 and Table 2). Two hundred and twenty-one QTLs referenced to as GY are associated to yield components such as grain weight (GrW), grain number (GrN), tons per hectare (T/h), tiller number (Tn), thousand kernel weight (TKW), harvest index (HI), plant height (PH), spike length (SL). Seventy three QTLs referenced to as BQ are associated to baking quality related traits such as pentosan viscosity (Visco.), dough strength (W), volume (Vol.) as well as other traits such as (panification, durity, height of bubble in alveograph, pel-schank, total starch, flour swelling volume, particule size index, slope after peak of mixograph). Finally, 82 QTLs referenced to as GPC are related to grain protein content and composition and were integrated on the consensus genetic map.
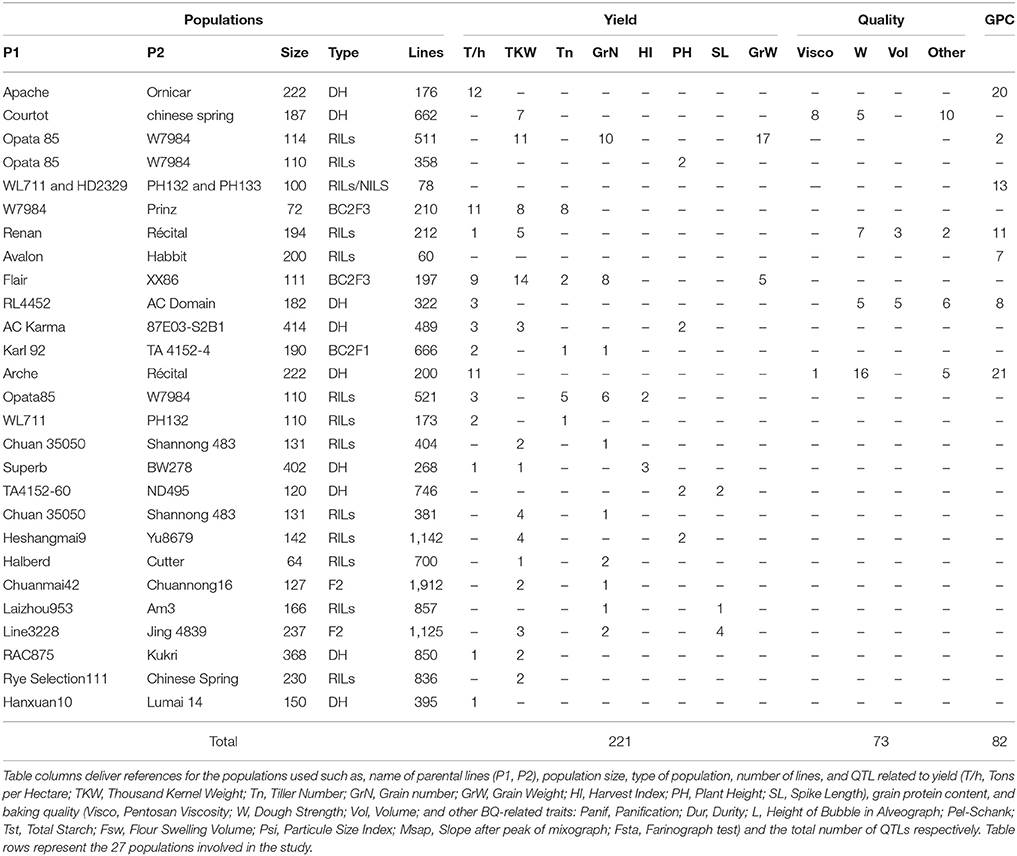
Table 2. Wheat populations and QTLs.
Three hundred and seventy-six QTLs (221 GY, 82 GPC, 73 BQ) projected on the consensus genetic map, were statistically combined through meta-analysis using Biomercator v3.0 to deliver MQTLs, defined as a locus where independent QTLs originating from at least two initial populations overlap and then computed to deliver consensus confidence intervals (CI). Following this strategy, the 376 projected QTLs produced 32 MQTLs including 18 for GY, 8 for GPC and 6 BQ (Figure 2 and Table 3). For GY, the 18 MQTLs involve 2 (on chromosomes 1B, 2B, 3B, 5A, 5B, 6A), 3 (on chromosomes 1D, 2A, 2D, 3B, 6B, 7A, 7D), 4 (on chromosomes 2D, 3D, 4B, 5A), and 5 (on chromosome 4A) yield components. 17 (94%) GY MQTLs involve tons per hectare (T/h) and thousand kernel weight (TKW) components among which 10 (56%) MQTLs also involve grain number (GrN). For BQ, the 73 QTLs produced 6 MQTLs involving at least one of the major traits of viscosity (Visco.), dough strength (W) and volume (Vol.). For GPC, eight MQTLs were identified involving chromosomes 1A, 2A, 2B, 2D, 3A, 4A, 6B, and 7A.
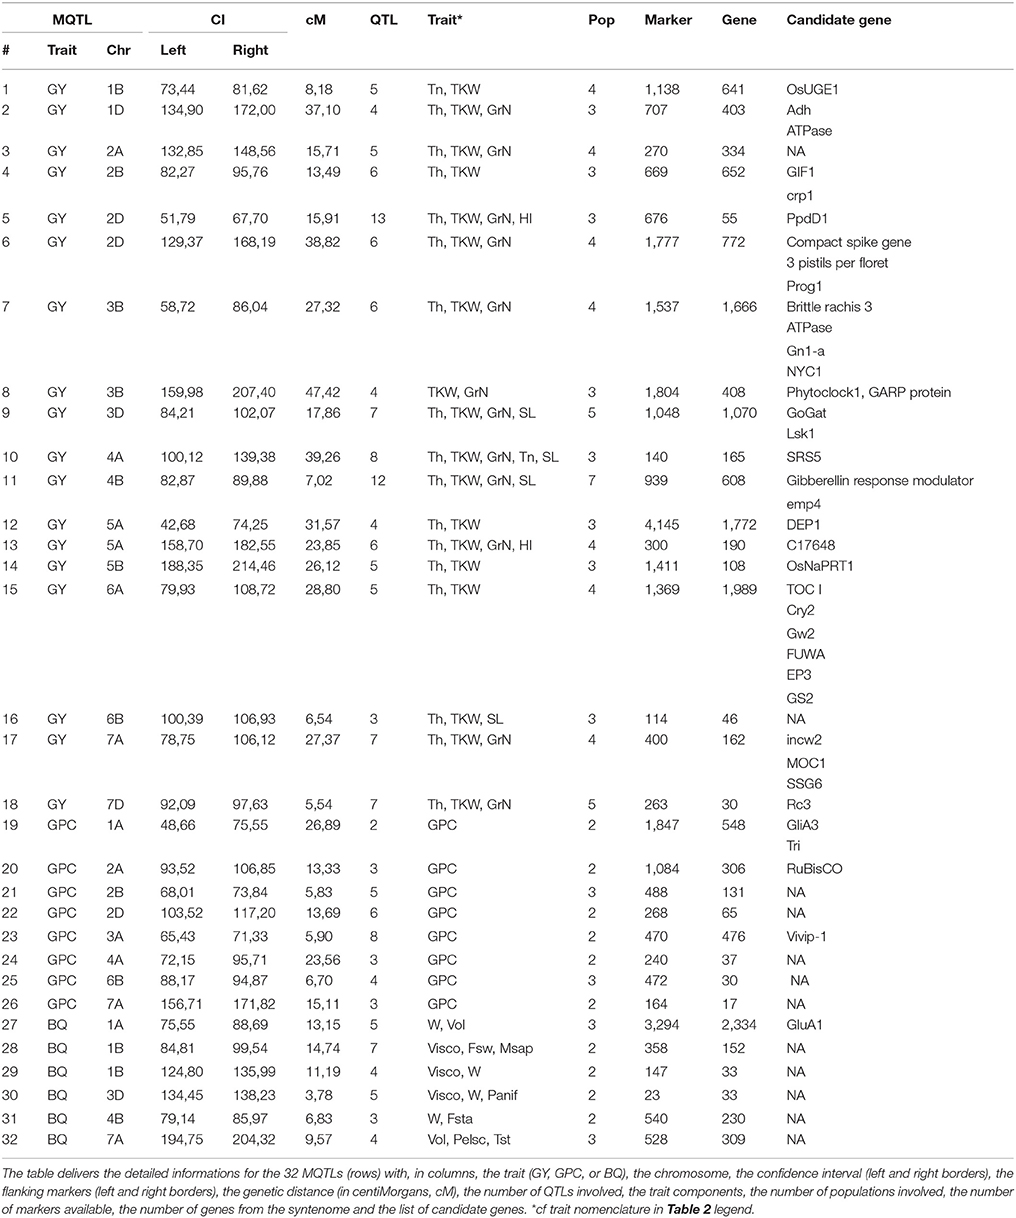
Table 3. Wheat metaQTLs and associated candidate genes.
The 32 MQTLs were located on all chromosomes except 4D, 5D, 6D, and 7B. The most precise MQTLs (i.e., reduced confidence intervals) were located on chromosomes 3D (3.78 cM) for BQ, 7D (5.54 cM) for GY, and 2B (5.83 cM) for GPC. Finally, from the initial set of 376 QTLs, 171 (45%) have been involved in the calculation of the final repertoire of 32 MQTLs and deriving from 24 (89%) of the 27 considered populations. The 32 MQTLs and associated QTLs are made available as Supplementary Tables 2–8.
Synteny-Based Candidate Genes of Wheat Traits
The consensus genetic map (140,315 markers) associated with QTLs (376) and derived MQTLs (32) were projected on the wheat syntenome consisting of 99,386 gene models covering 10.2 Mb of sequence fragmented into 10.8 million of scaffolds (Borrill et al., 2015), Figure 1. We recently produced the most accurate synteny-based gene order in wheat, referenced to as syntenome (Pont et al., 2011, 2013), where the most robust wheat genetic map involving 40,267 markers (Wang et al., 2014), and delivering 13,168 orthologous relationships with the ancestral grass genome (Murat et al., 2014), was enriched with 59,732 wheat syntenic (ancestral) genes/scaffolds intercalated between molecular markers, ultimately delivering 72,900 (73.4% of the 99,386 gene models) ordered genes on the 21 chromosomes (El Baidouri et al., 2017; Pont and Salse, 2017). Wang et al. (2014) genetic map was used as a backbone to project the consensus genetic map (14,0315 markers) and associated QTLs (376) and MQTLs (32) onto the wheat syntenome (72,900 genes) to deliver a robust list of candidates for each of the MQTL intervals. We then deliver an exhaustive list of 15,772 genes under the 32 MQTL CIs for further validation (Figure 2, Supplementary Tables 2–8). Among this repertoire of wheat genes, we identified 37 major candidates from known and validated genes in grass relatives (Sakamoto and Matsuoka, 2008; Huang et al., 2013; Valluru et al., 2014; Agarwal et al., 2016), Table 3. Regarding yield, the candidate genes can be classified into developmental genes (13 genes), genes linked to metabolism (11 genes), genes driving grain size (3 genes), and genes involved in grain number and grain weight (2 genes). Regarding grain protein content we identified Gliadin, Triticin, Tri-ribulose-1,5-bisphosphate carboxylase/Viviparous, as candidates for three MQTLs (on chromosomes 1A, 2A, 3A) with five additional MQTLs without any obvious candidates. Finally, for the six MQTLs of baking quality, only a Glutenin has been proposed as candidate for a single MQTL located on the chromosome 1A.
The current data are made accessible to the scientific community through a web platform allowing to navigate between the genetic and genomic resources, from QTL, MQTL up to the synteny with grass relatives and ultimately candidate genes. The public web interface named PlantSyntenyViewer available at http://urgi.versailles.inra.fr/synteny-wheat (Figure 2) delivers (either through a chromosome or gene search), the genetic (markers, QTLs, MQTLs) and associated genomic (wheat syntenome and syntenic genes from related grasses) data that can be considered for (i) marker development, (ii) improving conserved gene annotation or (iii) candidate gene selection for any traits of interest (either GY, GPC, BQ, or trait components). Such resources can also be considered for a translational research approach with grass relatives where the delivered QTL, MQTL, and candidate genes in wheat are projected on rice, and sorghum genomes and can then be also considered as candidates of major traits for such closely related species.
Discussion
The access to 27 public quantitative genetic studies from the last decades offered the opportunity to unveil major loci driving agronomical traits in wheat. Meta-analysis of QTLs can be considered as a statistical tool that helps in combining data from different sources into a single study through the identification of the relevant subset of genome loci (MQTL) which are dominant in different genetic populations for the considered traits. This strategy of meta-analysis shows that the MQTL generally gives a confidence interval that is confirmed through numerous single independent studies. Moreover, the identification of a narrow genetic/genomic confidence interval driving traits, delivered by the inferred MQTLs, is a key step for a more precise search for relevant candidate genes (Veyrieras et al., 2007). Based on the construction of a consensus genetic map with 140,315 molecular markers, we integrated 376 QTLs into 32 MQTLs consisting in 18, 8, 6 MQTLs for, respectively, yield, baking quality and grain protein content. Such high resolution and large-scale integration of wheat genetic and genomic resources offers a tremendous set of gene-based markers that can be considered as a guide for accelerated dissection of major agronomical traits in breeding.
Jordan et al. (2007) used the RL4452 × “AC Domain” population (included in our data set) to map expression level polymorphisms and identified 542 eQTLs considered as representing major effectors of yield, baking quality, and grain protein content. This approach is complementary to our data as it can provide regulatory candidates of our inferred 32 MQTLs. Moreover, there were a few regions of the genome in which eQTL clustered (hot spots) that may represent chromosomal regions affecting the expression of several genes. These results are consistent with the current data set as the eQTL clusters reported in this study do correspond to MQTLs involved in multiple traits in our analysis. As example, a 4B loci (between BF484674-297 and WMC349) associated with 20 eQTL from Jordan et al. (2007) corresponds to MQTL11 for yield (TKW, Th, GrN), and MQTL31 for baking quality (Fst, W) in the current study (Table 3).
The 376 QTLs and derived 32 MQTLs were projected onto the wheat syntenome consisting in 72,900 ordered genes on the 21 chromosomes delivering direct links between wheat and rice-Brachypodium-sorghum genomes. We delivered 15,772 genes covering the 32 MQTLs intervals, including 37 major candidates based on known genes in wheat and grass relatives (Valluru et al., 2014). Our study consists in a clear example illustrating the power of the translational research approach in exploiting the knowledge gained in relatives (rice, sorghum, and Brachypodium here) to dissect the genetic basis of major traits in a more complex species (wheat in our case). These candidate genes are best guesses, according to their function and mapping position in relation to the MQTL confidence intervals. However the co-location criteria between MQTLs and genes do not assume or even prove any functional relationship. The 37 synteny-based genes proposed for the 32 MQTLs can be considered as potential candidates for future functional validation. These genes located under MQTL intervals have to be only considered as best candidates for cloning, functional analyses or the development of markers for crop improvement (i.e., marker assisted breeding programs). Major wheat genes of yield components have already been identified in the past through similar approaches taking advantages of related species such as GW2 (Bednarek et al., 2012), GS3 (Li et al., 2016), CKX2 (Zhang et al., 2011), ISA3 (Kang et al., 2013), Eps (Faricelli et al., 2010), IPA1 (Li et al., 2016), DEP1 (Li et al., 2016).
Overall, the current study of meta-analysis of QTL in wheat clearly shows that MQTLs (32) are associated with confidence interval that are confirmed through numerous single independent analyses and associated with relevant genes (15,772 including 37 major candidates) and derived markers (28,630 SNP-based makers) to be considered in current breeding schemes. These resources are now made available through the web interface PlantSyntenyViewer for cloning, functional analyses, or the development of markers for wheat improvement.
Materials and Methods
Construction of the Consensus Genetic Map
Four public wheat genetic maps were considered for the construction of a wheat consensus genetic map: Xu et al. (2008) with 2,293 markers, Somers et al. (2004) with 1,239 markers, Wang et al. (2014) with 40,267 markers and Saintenac et al. (2013) with 104,804 markers. Biomercator v3.0 (Sosnowski et al., 2012) delivers a graphical interface that allows the projection of different maps into a single genetic consensus map. A text file is necessary to describe all the genetic maps (marker name, position) as well as their associated QTL statistics (LOD score, R2 percentage of phenotypic variation, confidence interval). Biomercator first integrates independent genetic maps into a comprehensive map (with a specific map projection algorithm) and secondly recalculates the marker position as well as those of the initial QTLs, based on a most likely consensus QTL distribution through meta-analysis algorithms. As a consequence, we used the first function of Biomercator v3.0 to compile four genetic maps to create a dense consensus genetic map with all the markers available from the investigated maps. A prerequisite for producing a comprehensive consensus genetic map is to eliminate inconsistent markers, i.e., markers located on non-identical positions between two maps, so that they could not create discrepancies in the final consensus map. As a consequence, we used the MapInspect software (http://mapinspect.software.informer.com/), to verify chromosome by chromosome the marker order between the four considered maps. All the inconsistent loci (mainly non-collinear markers corresponding to large inversions) were thus discarded. Following this strategy we deliver a wheat consensus genetic map consisting of 140,315 markers (Table 1 and Supplementary Table 1).
QTL Projection and MQTL Construction
Twenty seven genetic maps from independent quantitative genetic studies (Charmet et al., 2001; Börner et al., 2002; Groos et al., 2003, 2007; Prasad et al., 2003; Huang et al., 2004, 2006; Turner et al., 2004; Kulwal et al., 2005; McCartney et al., 2005, 2006; Kumar et al., 2006; Narasimhamoorthy et al., 2006; Laperche et al., 2007; Li et al., 2007; Chu et al., 2008; Cuthbert et al., 2008; Sun et al., 2008; Wang et al., 2009, 2011; Deng et al., 2011; Tang et al., 2011; Bennett et al., 2012; Mir et al., 2012; Ravel et al., 2012; Liu et al., 2013) of grain yield (GY with grain number, tons per hectare, tiller number, thousand kernel weight, harvest index, plant height), GPC, and baking quality (BQ with pentosan viscosity, dough strength, volume, panification, durity, height of bubble in alveograph, pel-schank, total starch, flour swelling volume, particule size index, slope after peak of mixograph, farinograph test), as well as 110 public morpho-physiological genes (height, protein content, gluten subunits, gliadins, pigmentation, vernalization, glaucousness, tiller inhibition, brittle rachis, etc.) were projected on the consensus genetic map using common markers available in the Komugi gene list (McIntosh et al., 2011) and the constructed consensus genetic map.
The 27 genetic maps with QTL/loci mapped were projected on the consensus genetic map by means of the homothetic function of Biomercator v3.0. All the ambiguous loci being previously detected by MapInspect were removed as described above. Biomercator then detects all the markers in each single genetic map (source of QTLs) and locates them onto the consensus map on the basis of their relative distance compared to common markers, and then projects the most likely position of each QTL with their left and right flanking borders of confidence intervals (using an homothetic function based on common markers between the reference map and the QTL map). All the projections have to be cross-verified because small inversions would not allow a precise projection of QTLs (based on the positions of QTL and markers associated with confidence intervals), Table 2.
After integration of the 27 genetic maps (and associated 376 QTLs) into the consensus genetic map using Biomercator v3.0, meta-analysis of QTLs (as described by Goffinet and Gerber, 2000) was launched for each trait separately. The approach provides decisions, based on a modified Akaike criterion, to determine the number of MQTL that best fits the QTLs available on different genetic maps. Biomercator v3.0 determines if n QTL detected from independent experiments in the same region of a chromosome are consistent with 1, 2, 3, 4, or n MQTL models (the n MQTL model being the case where there are as many MQTLs as input QTLs). For each of these five models, Biomercator predicts the most likely QTL distribution using means of the maximum likelihood method (ratio likelihood method). Then, an Akaike-type statistical criterion indicates the best model among the five available. Models with least Akaike values predicted on each chromosome was used to identify MQTLs on the chromosomes. Currently, the method used in the software does not allow to distinguish between models with more than four MQTLs on the same linkage group. If the estimated number of MQTLs is more than four, Biomercator declares that the most probable model is a number of MQTLs equal to the number of initially projected QTLs (n MQTL model). In this case, the deletion function of the software was used to select segments of a linkage group separated by regions with no QTL and the meta-analysis was applied to these segments. Following this strategy, we identified 32 MQTLs for respectively yield (18), baking quality (6), and grain protein content (8) traits (Table 3 and Supplementary Tables 2–8).
Genetic Map and Associated MQTL Projection of the Wheat Syntenome
The wheat syntenome was used as described in El Baidouri et al. (2017). Briefly, the ancestral grass genome (AGK for ancestral grass karyotype) was used as delivered in Murat et al. (2014) with 58,933 ordered ancestral genes on 12 ancestral chromosomes based on synteny relationships investigated between Oryza sativa (International Rice Genome Sequencing Project, 2005), Brachypodium distachyon (International Brachypodium Initiative, 2010) and Sorghum bicolor (Paterson et al., 2009) genomes. The blastn alignment of 40,267 mapped markers from the wheat consensus SNP map published by Wang et al. (2014) and AGK genes, delivered orthologs between these two resources. Using DRIMM-Synteny tool (Pham and Pevzner, 2010), we built synteny groups allowing the identification of ancestral regions as well as the ancestral gene content and order between wheat markers along the consensus map (21 chromosomes). Following this method, we ordered 62,135 wheat sequence scaffolds (from International Wheat Genome Sequencing Consortium, 2014) containing 72,900 genes along the 21 chromosomes of the bread wheat genome, i.e. referenced as the bread wheat syntenome (available at http://urgi.versailles.inra.fr/synteny-wheat). The genetic map from Wang et al. (2014), used as a backbone for both the consensus genetic map and the syntenome, provided direct links between both resources to project the 376 QTLs and associated 32 MQTLs, ultimately delivering a complete repertoire of genes (from the syntenome) covering the MQTL intervals (from the consensus genetic map) in wheat, rice, sorghum, and Brachypodium (Table 3).
Synteny-Based Identification of Candidate Genes
A list of 110 genes located on the four genetic maps used in this study as well as candidate genes available in grass relatives (mainly rice) from Sakamoto and Matsuoka (2008), Huang et al. (2013), Valluru et al. (2014), and Agarwal et al. (2016) were considered. The genes were aligned (blastn) against the wheat syntenome using two parameters to increase the stringency and significance of the sequence alignment: cumulative identity percentage (CIP) corresponding to the cumulative percent of sequence identity obtained for all the high scoring pairs (HSPs) and CALP for the cumulative alignment length percentage (Salse et al., 2009). The CIP and CALP parameters allow the identification of the best alignment, i.e., the highest cumulative percentage of identity in the longest cumulative length, taking into account all HSPs obtained for any pairwise alignment. Following this strategy, 37 synteny-based candidates were proposed for the 32 MQTLs (Table 3 and Supplementary Table 9). The integrated genomic and genetic resources are made available to the scientific community through a user friendly and public web interface PlantSyntenyViewer available at http://urgi.versailles.inra.fr/synteny-wheat delivering QTLs (376), MQTLs (32), genes (15,772), major candidates (37), and derived SNP markers (28,630).
Author Contributions
UQ, CP, and QA performed the analysis. RF, LB, MA, and HQ managed the web viewer PlantSyntenyViewer. UQ and JS wrote the article.
Funding
This study has been supported by a visiting scientist (UQ) grant from INRA.
Conflict of Interest Statement
The authors declare that the research was conducted in the absence of any commercial or financial relationships that could be construed as a potential conflict of interest.
Supplementary Material
The Supplementary Material for this article can be found online at: https://www.frontiersin.org/articles/10.3389/fpls.2017.01843/full#supplementary-material
Supplementary Table 1. Wheat consensus genetic map.
Supplementary Table 2. Wheat chromosome group 1 (A, B, and D subgenomes) with genetic maps, QTLs, MQTLs, and candidate genes.
Supplementary Table 3. Wheat chromosome group 2 (A, B, and D subgenomes) with genetic maps, QTLs, MQTLs, and candidate genes.
Supplementary Table 4. Wheat chromosome group 3 (A, B, and D subgenomes) with genetic maps, QTLs, MQTLs, and candidate genes.
Supplementary Table 5. Wheat chromosome group 4 (A, B, and D subgenomes) with genetic maps, QTLs, MQTLs, and candidate genes.
Supplementary Table 6. Wheat chromosome group 5 (A, B, and D subgenomes) with genetic maps, QTLs, MQTLs, and candidate genes.
Supplementary Table 7. Wheat chromosome group 6 (A, B, and D subgenomes) with genetic maps, QTLs, MQTLs, and candidate genes.
Supplementary Table 8. Wheat chromosome group 7 (A, B, and D subgenomes) with genetic maps, QTLs, MQTLs, and candidate genes.
Supplementary Table 9. Detailed information regarding the 37 candidate genes.
References
Agarwal, P., Parida, S. K., Raghuvanshi, S., Kapoor, S., Khurana, P., Khurana, J. P., et al. (2016). Rice improvement through genome-based functional analysis and molecular breeding in India. Rice 9, 1. doi: 10.1186/s12284-015-0073-2
Allen, A. M., Barker, G. L., Berry, S. T., Coghill, J. A., Gwilliam, R., Kirby, S., et al. (2011). Transcript-specific, single-nucleotide polymorphism discovery and linkage analysis in hexaploid bread wheat (Triticum aestivum L.). Plant Biotechnol. J. 9, 1086–1099. doi: 10.1111/j.1467-7652.2011.00628.x
Allen, A. M., Barker, G. L., Wilkinson, P., Burridge, A., Winfield, M., Coghill, J., et al. (2013). Discovery and development of exome-based, co-dominant single nucleotide polymorphism markers in hexaploid wheat (Triticum aestivum L.). Plant Biotechnol. J. 11, 279–295. doi: 10.1111/pbi.12009
Bednarek, J., Boulaflous, A., Girousse, C., Ravel, C., Tassy, C., Barret, P., et al. (2012). Down-regulation of the TaGW2 gene by RNA interference results in decreased grain size and weight in wheat. J. Exp. Bot. 63, 5945–5955. doi: 10.1093/jxb/ers249
Bennett, D., Izanloo, A., Reynolds, M., Kuchel, H., Langridge, P., and Schnurbusch, T. (2012). Genetic dissection of grain yield and physical grain quality in bread wheat (Triticum aestivum L.) under water-limited environments. Theor. Appl. Genet. 125, 255–271. doi: 10.1007/s00122-012-1831-9
Börner, A., Schumann, E., Fürste, A., Cöster, H., Leithold, B., Röder, M., et al. (2002). Mapping of quantitative trait loci determining agronomic important characters in hexaploid wheat (Triticum aestivum L.). Theor. Appl. Genet. 105, 921–936. doi: 10.1007/s00122-002-0994-1
Borrill, P., Adamski, N., and Uauy, C. (2015). Genomics as the key to unlocking the polyploid potential of wheat. New Phytol. 208, 1008–1022. doi: 10.1111/nph.13533
Boyer, J. S., and Westgate, M. E. (2004). Grain yields with limited water. J. Exp. Bot. 55, 2385–2394. doi: 10.1093/jxb/erh219
Brenchley, R., Spannagl, M., Pfeifer, M., Barker, G. L., D'Amore, R., Allen, A. M., et al. (2012). Analysis of the bread wheat genome using whole-genome shotgun sequencing. Nature 491, 705–710. doi: 10.1038/nature11650
Cavanagh, C. R., Chao, S., Wang, S., Huang, B. E., Stephen, S., Kiani, S., et al. (2013). Genome-wide comparative diversity uncovers multiple targets of selection for improvement in hexaploid wheat landraces and cultivars. Proc. Natl. Acad. Sci. U.S.A. 110, 8057–8062. doi: 10.1073/pnas.1217133110
Chao, S., Dubcovsky, J., Dvorak, J., Luo, M. C., Baenziger, S. P., Matnyazov, R., et al. (2010). Population- and genome-specific patterns of linkage disequilibrium and SNP variation in spring and winter wheat (Triticum aestivum L.). BMC Genomics 11:727. doi: 10.1186/1471-2164-11-727
Charbonneau, E., Pellerin, D., and Oetzel, G. R. (2006). Impact of lowering dietary cation-anion difference in nonlactating dairy cows: a meta-analysis. J. Dairy Sci. 89, 537–548. doi: 10.3168/jds.S0022-0302(06)72116-6
Chardon, F., Hourcade, D., Combes, V., and Charcosset, A. (2005). Mapping of a spontaneous mutation for early flowering time in maize highlights contrasting allelic series at two-linked QTL on chromosome 8. Theor. Appl. Genet. 112, 1–11. doi: 10.1007/s00122-005-0050-z
Chardon, F., Virlon, B., Moreau, L., Falque, M., Joets, J., Decousset, L., et al. (2004). Genetic architecture of flowering time in maize as inferred from quantitative trait loci meta-analysis and synteny conservation with the rice genome. Genetics 168, 2169–2185. doi: 10.1534/genetics.104.032375
Charmet, G., Robert, N., Perretant, M. R., Gay, G., Sourdille, P., Groos, C., et al. (2001). Marker assisted recurrent selection for cumulating QTLs for bread-making related traits. Euphytica 119, 89–93. doi: 10.1023/A:1017577918541
Chu, C.-G., Xu, S. S., Friesen, T. L., and Faris, J. D. (2008). Whole genome mapping in a wheat doubled haploid population using SSRs and TRAPs and the identification of QTL for agronomic traits. Mol. Breed. 22, 251–266. doi: 10.1007/s11032-008-9171-9
Cuthbert, J. L., Somers, D. J., Brûlé-Babel, A. L., Brown, P. D., and Crow, G. H. (2008). Molecular mapping of quantitative trait loci for yield and yield components in spring wheat (Triticum aestivum L.). Theor. Appl. Genet. 117, 595–608. doi: 10.1007/s00122-008-0804-5
Deng, S., Wu, X., Wu, Y., Zhou, R., Wang, H., Jia, J., et al. (2011). Characterization and precise mapping of a QTL increasing spike number with pleiotropic effects in wheat. Theor. Appl. Genet. 122, 281–289. doi: 10.1007/s00122-010-1443-1
El Baidouri, M., Murat, F., Veyssiere, M., Molinier, M., Flores, R., Burlot, L., et al. (2017). Reconciling the evolutionary origin of bread wheat (Triticum aestivum). New Phytol. 213, 1477–1486. doi: 10.1111/nph.14113
Faricelli, M. E., Valárik, M., and Dubcovsky, J. (2010). Control of flowering time and spike development in cereals: the earliness per se Eps-1 region in wheat, rice, and Brachypodium. Funct. Integr. Genomics 10, 293–306. doi: 10.1007/s10142-009-0146-7
Gegas, V. C., Nazari, A., Griffiths, S., Simmonds, J., Fish, L., Orford, S., et al. (2010). A genetic framework for grain size and shape variation in wheat. Plant Cell 22, 1046–1056. doi: 10.1105/tpc.110.074153
Goffinet, B., and Gerber, S. (2000). Quantitative trait loci: a meta-analysis. Genetics 155, 463–473.
Griffiths, S., Simmonds, J., Leverington, M., Wang, Y., Fish, L., Sayers, L., et al. (2009). Meta-QTL analysis of the genetic control of ear emergence in elite European winter wheat germplasm. Theor. Appl. Genet. 119, 383–395. doi: 10.1007/s00122-009-1046-x
Groos, C., Bervas, E., Chanliaud, E., and Charmet, G. (2007). Genetic analysis of bread-making quality scores in bread wheat using a recombinant inbred line population. Theor. Appl. Genet. 115, 313–323. doi: 10.1007/s00122-007-0563-8
Groos, C., Robert, N., Bervas, E., and Charmet, G. (2003). Genetic analysis of grain protein-content, grain yield and thousand-kernel weight in bread wheat. Theor. Appl. Genet. 106, 1032–1040. doi: 10.1007/s00122-002-1111-1
Habash, D. Z., Kehel, Z., and Nachit, M. (2009). Genomic approaches for designing durum wheat ready for climate change with a focus on drought. J. Exp. Bot. 60, 2805–2815. doi: 10.1093/jxb/erp211
Hanocq, E., Laperche, A., Jaminon, O., Laine, A. L., and Le Gouis, J. (2007). Most significant genome regions involved in the control of earliness traits in bread wheat, as revealed by QTL meta-analysis. Theor. Appl. Genet. 114, 569–584. doi: 10.1007/s00122-006-0459-z
Heijmans, B. T., Beekman, M., Putter, H., Lakenberg, N., van der Wijk, H. J., Whitfield, J. B., et al. (2005). Meta-analysis of four new genome scans for lipid parameters and analysis of positional candidates in positive linkage regions. Eur. J. Hum. Genet. 13, 1143–1153. doi: 10.1038/sj.ejhg.5201466
Huang, R., Jiang, L., Zheng, J., Wang, T., Wang, H., Huang, Y., et al. (2013). Genetic bases of rice grain shape: so many genes, so little known. Trends Plant Sci. 18, 218–226. doi: 10.1016/j.tplants.2012.11.001
Huang, X. Q., Cloutier, S., Lycar, L., Radovanovic, N., Humphreys, D. G., Noll, J. S., et al. (2006). Molecular detection of QTLs for agronomic and quality traits in a doubled haploid population derived from two Canadian wheats (Triticum aestivum L.). Theor. Appl. Genet. 113, 753–766. doi: 10.1007/s00122-006-0346-7
Huang, X. Q., Kempf, H., Ganal, M. W., and Röder, M. S. (2004). Advanced backcross QTL analysis in progenies derived from a cross between a German elite winter wheat variety and a synthetic wheat (Triticum aestivum L.). Theor. Appl. Genet. 109, 933–943. doi: 10.1007/s00122-004-1708-7
International Brachypodium Initiative (2010). Genome sequencing and analysis of the model grass Brachypodium distachyon. Nature 463, 763–768. doi: 10.1038/nature08747
International Rice Genome Sequencing Project. (2005). The map-based sequence of the rice genome. Nature 436, 793–800. doi: 10.1038/nature03895
International Wheat Genome Sequencing Consortium (2014). A chromosome-based draft sequence of the hexaploid bread wheat (Triticum aestivum) genome. Science 345:1251788. doi: 10.1126/science.1251788
Jia, J., Zhao, S., Kong, X., Li, Y., Zhao, G., He, W., et al. (2013). Aegilops tauschii draft genome sequence reveals a gene repertoire for wheat adaptation. Nature 496, 91–95. doi: 10.1038/nature12028
Jordan, M. C., Somers, D. J., and Banks, T. W. (2007). Identifying regions of the wheat genome controlling seed development by mapping expression quantitative trait loci. Plant Biotechnol. J. 5, 442–453. doi: 10.1111/j.1467-7652.2007.00253.x
Kang, G. Z., Liu, G. Q., Xu, W., Zhu, Y. J., Wang, C. Y., Ling, H. Q., et al. (2013). Identification of the isoamylase 3 gene in common wheat and its expression profile during the grain-filling period. Genet. Mol. Res. 12, 4264–4275. doi: 10.4238/2013.February.28.17
Khatkar, M. S., Thomson, P. C., Tammen, I., and Raadsma, H. W. (2004). Quantitative trait loci mapping in dairy cattle: review and meta-analysis. Genet. Sel. Evol. 36, 163–190. doi: 10.1186/1297-9686-36-2-163
Kulwal, P., Kumar, N., Kumar, A., Gupta, R. K., Balyan, H. S., and Gupta, P. K. (2005). Gene networks in hexaploid wheat: interacting quantitative trait loci for grain protein content. Funct. Integr. Genomics 5, 254–259. doi: 10.1007/s10142-005-0136-3
Kumar, N., Kulwal, P. L., Gaur, A., Tyagi, A. K., Khurana, J. P., Khurana, P., et al. (2006). QTL analysis for grain weight in common wheat. Euphytica 151, 135–144. doi: 10.1007/s10681-006-9133-4
Lai, K., Berkman, P. J., Lorenc, M. T., Duran, C., Smits, L., Manoli, S., et al. (2012). WheatGenome.info: an integrated database and portal for wheat genome information. Plant Cell Physiol. 53:e2. doi: 10.1093/pcp/pcr141
Laperche, A., Brancourt-Hulmel, M., Heumez, E., Gardet, O., Hanocq, E., Devienne-Barret, F., et al. (2007). Using genotype × nitrogen interaction variables to evaluate the QTL involved in wheat tolerance to nitrogen constraints. Theor. Appl. Genet. 115, 399–415. doi: 10.1007/s00122-007-0575-4
Lawlor, D. A., Owen, C. G., Davies, A. A., Whincup, P. H., Ebrahim, S., Cook, D. G., et al. (2006). Sex differences in the association between birth weight and total cholesterol. A meta-analysis. Ann. Epidemol. 16, 19–25. doi: 10.1016/j.annepidem.2005.04.006
Lean, I. J., DeGaris, P. J., McNeil, D. M., and Block, E. (2006). Hypocalcemia in dairy cows: meta-analysis and dietary cation anion difference theory revisited. J. Dairy Sci. 89, 669–684. doi: 10.3168/jds.S0022-0302(06)72130-0
Li, M., Li, X., Zhou, Z., Wu, P., Fang, M., Pan, X., et al. (2016). Reassessment of the four yield-related genes Gn1a, DEP1, GS3, and IPA1 in rice using a CRISPR/Cas9 system. Front. Plant Sci. 7:377. doi: 10.3389/fpls.2016.00377
Li, S., Jia, J., Wei, X., Zhang, X., Li, L., Chen, H., et al. (2007). A intervarietal genetic map and QTL analysis for yield traits in wheat. Mol. Breed. 20, 167–178. doi: 10.1007/s11032-007-9080-3
Ling, H.-Q., Zhao, S., Liu, D., Wang, J., Sun, H., Zhang, C., et al. (2013). Draft genome of the wheat a-genome progenitor Triticum urartu. Nature 496, 87–90. doi: 10.1038/nature11997
Liu, X., Li, R., Chang, X., and Jing, R. (2013). Mapping QTLs for seedling root traits in a doubled haploid wheat population under different water regimes. Euphytica 189, 51–66. doi: 10.1007/s10681-012-0690-4
Luo, M.-C., Gu, Y. Q., You, F. M., Deal, K. R., Ma, Y., Hu, Y., et al. (2013). A 4-gigabase physical map unlocks the structure and evolution of the complex genome of Aegilops tauschii, the wheat D-genome progenitor. Proc. Natl. Acad. Sci. U.S.A. 110, 7940–7945. doi: 10.1073/pnas.1219082110
MacLeod, I. M., Robinson, N. A., and Goddard, M. E. (2003). “A consensus map of quantitative trait loci (QTL) affecting milk production,” in 50 Years of DNA: Proceedings of the Fifteenth Conference, Association for the Advancement of Animal Breeding and Genetics (Melbourne, VIC), 22–26 (Accessed July 11, July 2003).
McCartney, C. A., Somers, D. J., Humphreys, D. G., Lukow, O., Ames, N., Noll, J., et al. (2005). Mapping quantitative trait loci controlling agronomic traits in the spring wheat cross RL4452x'AC domain'. Genome 48, 870–883. doi: 10.1139/g05-055
McCartney, C. A., Somers, D. J., Lukow, O., Ames, N., Noll, J., Cloutier, S., et al. (2006). QTL analysis of quality traits in the spring wheat cross RL4452 × “AC domain.” Plant Breed. 125, 565–575. doi: 10.1111/j.1439-0523.2006.01256.x
McIntosh, R. A., Dubcovsky, J., Rogers, W. J., Morris, C. F., Appels, R., and Xia, X. C. (2011). Catalogue of gene symbols for wheat: 2011 supplement. Annu. Wheat Newsl. 57, 303–321.
Mir, R. R., Kumar, N., Jaiswal, V., Girdharwal, N., Prasad, M., Balyan, H. S., et al. (2012). Genetic dissection of grain weight in bread wheat through quantitative trait locus interval and association mapping. Mol. Breed. 29, 963–972. doi: 10.1007/s11032-011-9693-4
Murat, F., Zhang, R., Guizard, S., Flores, R., Armero, A., Pont, C., et al. (2014). Shared subgenome dominance following polyploidization explains grass genome evolutionary plasticity from a seven protochromosome ancestor with 16K protogenes. Genome Biol. Evol. 6, 12–33. doi: 10.1093/gbe/evt200
Narasimhamoorthy, B., Gill, B. S., Fritz, A. K., Nelson, J. C., and Brown-Guedira, G. L. (2006). Advanced backcross QTL analysis of a hard winter wheat × synthetic wheat population. Theor. Appl. Genet. 112, 787–796. doi: 10.1007/s00122-005-0159-0
Paterson, A. H., Bowers, J. E., Bruggmann, R., Dubchak, I., Grimwood, J., Gundlach, H., et al. (2009). The Sorghum bicolor genome and the diversification of grasses. Nature 457, 551–556. doi: 10.1038/nature07723
Pham, S. K., and Pevzner, P. A. (2010). DRIMM-Synteny: decomposing genomes into evolutionary conserved segments. Bioinformatics 26, 2509–2516. doi: 10.1093/bioinformatics/btq465
Pont, C., Murat, F., Confolent, C., Balzergue, S., and Salse, J. (2011). RNA-seq in grain unveils fate of neo- and paleopolyploidization events in bread wheat (Triticum aestivum L.). Genome Biol. 12:R119. doi: 10.1186/gb-2011-12-12-r119
Pont, C., Murat, F., Guizard, S., Flores, R., Foucrier, S., Bidet, Y., et al. (2013). Wheat syntenome unveils new evidences of contrasted evolutionary plasticity between paleo- and neoduplicated subgenomes. Plant J. 76, 1030–1044. doi: 10.1111/tpj.12366
Pont, C., and Salse, J. (2017). Wheat paleohistory created asymmetrical genomic evolution. Curr. Opin. Plant Biol. 36, 29–37. doi: 10.1016/j.pbi.2017.01.001
Prasad, M., Kumar, N., Kulwal, P., Röder, M., Balyan, H., Dhaliwal, H., et al. (2003). QTL analysis for grain protein content using SSR markers and validation studies using NILs in bread wheat. Theor. Appl. Genet. 106, 659–667. doi: 10.1007/s00122-002-1114-y
Ravel, C., Dardevet, M., Leenhardt, F., Bordes, J., Joseph, J. L., Perretant, M. R., et al. (2012). Improving the yellow pigment content of bread wheat flour by selecting the three homoeologous copies of Psy1. Mol. Breed. 31, 87–99. doi: 10.1007/s11032-012-9772-1
Rice, T., Cooper, R. S., Wu, X. D., Bouchard, C., Rankinen, T., Rao, D. C., et al. (2006). Meta-analysis of genome-wide scans for blood pressure in African American and Nigerian samples. Am. J. Hypertens. 19, 270–274. doi: 10.1016/j.amjhyper.2005.09.006
Saintenac, C., Jiang, D., and Akhunov, E. D. (2011). Targeted analysis of nucleotide and copy number variation by exon capture in allotetraploid wheat genome. Genome Biol. 12:R88. doi: 10.1186/gb-2011-12-9-r88
Saintenac, C., Jiang, D., Wang, S., and Akhunov, E. (2013). Sequence-based mapping of the polyploid wheat genome. G3 3, 1105–1114. doi: 10.1534/g3.113.005819
Sakamoto, T., and Matsuoka, M. (2008). Identifying and exploiting grain yield genes in rice. Curr. Opin. Plant Biol. 11, 209–214. doi: 10.1016/j.pbi.2008.01.009
Salse, J., Abrouk, M., Murat, F., Quraishi, U. M., and Feuillet, C. (2009). Improved criteria and comparative genomics tool provide new insights into grass paleogenomics. Brief. Bioinform. 10, 619–630. doi: 10.1093/bib/bbp037
Salvi, S., Corneti, S., Bellotti, M., Carraro, N., Sanguineti, M. C., Castelletti, S., et al. (2011). Genetic dissection of maize phenology using an intraspecific introgression library. BMC Plant Biol. 11:4. doi: 10.1186/1471-2229-11-4
Somers, D. J., Isaac, P., and Edwards, K. (2004). A high-density microsatellite consensus map for bread wheat (Triticum aestivum L.). Theor. Appl. Genet. 109, 1105–1114. doi: 10.1007/s00122-004-1740-7
Sosnowski, O., Charcosset, A., and Joets, J. (2012). BioMercator V3: an upgrade of genetic map compilation and quantitative trait loci meta-analysis algorithms. Bioinformatics 28, 2082–2083. doi: 10.1093/bioinformatics/bts313
Sun, X. Y., Wu, K., Zhao, Y., Kong, F. M., Han, G. Z., Jiang, H. M., et al. (2008). QTL analysis of kernel shape and weight using recombinant inbred lines in wheat. Euphytica 165, 615–624. doi: 10.1007/s10681-008-9794-2
Tang, Y. L., Li, J., Wu, Y. Q., Wei, H. T., Li, C. S., Yang, W. Y., et al. (2011). Identification of QTLs for yield-related traits in the ecombinant inbred line population derived from the cross between a synthetic hexaploid wheat-derived variety chuanmai 42 and a Chinese elite variety chuannong 16. Agric. Sci. China 10, 1665–1680. doi: 10.1016/S1671-2927(11)60165-X
Trebbi, D., Maccaferri, M., de Heer, P., Sorensen, A., Giuliani, S., Salvi, S., et al. (2011). High-throughput SNP discovery and genotyping in durum wheat (Triticum durum Desf.). Theor. Appl. Genet. 123, 555–569. doi: 10.1007/s00122-011-1607-7
Turner, A. S., Bradburne, R. P., Fish, L., and Snape, J. W. (2004). New quantitative trait loci influencing grain texture and protein content in bread wheat. J. Cereal Sci. 40, 51–60. doi: 10.1016/j.jcs.2004.03.001
Tyagi, S., Mir, R. R., Balyan, H. S., and Gupta, P. K. (2015). Interval mapping and meta-QTL analysis of grain traits in common wheat (Triticum aestivum L.). Euphytica 201, 367–380. doi: 10.1007/s10681-014-1217-y
Valluru, R., Reynolds, M. P., and Salse, J. (2014). Genetic and molecular bases of yield-associated traits: a translational biology approach between rice and wheat. Theor. Appl. Genet. 127, 1463–1489. doi: 10.1007/s00122-014-2332-9
Veyrieras, J. B., Goffinet, B., and Charcosset, A. (2007). MetaQTL: a package of new computational methods for the meta-analysis of QTL mapping experiments. BMC Bioinformatics 8:49. doi: 10.1186/1471-2105-8-49
Wang, J., Liu, W., Wang, H., Li, L., Wu, J., Yang, X., et al. (2011). QTL mapping of yield-related traits in the wheat germplasm 3228. Euphytica 177, 277–292. doi: 10.1007/s10681-010-0267-z
Wang, J., Luo, M. C., Chen, Z., You, F. M., Wei, Y., Zheng, Y., et al. (2013). Aegilops tauschii single nucleotide polymorphisms shed light on the origins of wheat D-genome genetic diversity and pinpoint the geographic origin of hexaploid wheat. New Phytol. 198, 925–937. doi: 10.1111/nph.12164
Wang, R. X., Hai, L., Zhang, X. Y., You, G. X., Yan, C. S., and Xiao, S. H. (2009). QTL mapping for grain filling rate and yield-related traits in RILs of the Chinese winter wheat population Heshangmai × Yu8679. Theor. Appl. Genet. 118, 313–325. doi: 10.1007/s00122-008-0901-5
Wang, S., Wong, D., Forrest, K., Allen, A., Chao, S., Huang, B. E., et al. (2014). Characterization of polyploid wheat genomic diversity using a high-density 90 000 single nucleotide polymorphism array. Plant Biotechnol. J. 12, 786–796. doi: 10.1111/pbi.12183
Winfield, M. O., Wilkinson, P. A., Allen, A. M., Barker, G. L., Coghill, J. A., Burridge, A., et al. (2012). Targeted re-sequencing of the allohexaploid wheat exome. Plant Biotechnol. J. 10, 733–742. doi: 10.1111/j.1467-7652.2012.00713.x
Xu, Z., Kohel, R. J., Song, G., Cho, J., Yu, J., Yu, S., et al. (2008). An integrated genetic and physical map of homoeologous chromosomes 12 and 26 in upland cotton (G. hirsutum L.). BMC Genomics 9:108. doi: 10.1186/1471-2164-9-108
You, F. M., Huo, N., Deal, K. R., Gu, Y. Q., Luo, M. C., McGuire, P. E., et al. (2011). Annotation-based genome-wide SNP discovery in the large and complex Aegilops tauschii genome using next-generation sequencing without a reference genome sequence. BMC Genomics 12:59. doi: 10.1186/1471-2164-12-59
Keywords: wheat, traits, gene, QTL, synteny
Citation: Quraishi UM, Pont C, Ain Q-u, Flores R, Burlot L, Alaux M, Quesneville H and Salse J (2017) Combined Genomic and Genetic Data Integration of Major Agronomical Traits in Bread Wheat (Triticum aestivum L.). Front. Plant Sci. 8:1843. doi: 10.3389/fpls.2017.01843
Received: 18 July 2017; Accepted: 10 October 2017;
Published: 14 November 2017.
Edited by:
Romain Guyot, UMR IPME IRD, FranceReviewed by:
Xueyong Zhang, Chinese Academy of Agricultural Sciences, ChinaTurgay Unver, iBG-Izmir, International Biomedicine and Genome Institute, Turkey
Copyright © 2017 Quraishi, Pont, Ain, Flores, Burlot, Alaux, Quesneville and Salse. This is an open-access article distributed under the terms of the Creative Commons Attribution License (CC BY). The use, distribution or reproduction in other forums is permitted, provided the original author(s) or licensor are credited and that the original publication in this journal is cited, in accordance with accepted academic practice. No use, distribution or reproduction is permitted which does not comply with these terms.
*Correspondence: Umar M. Quraishi, dW1hcl9tYXNvb2Q4MkB5YWhvby5jby51aw==; dW1hc29vZEBxYXUuZWR1LnBr
Jerome Salse, anNhbHNlQGNsZXJtb250LmlucmEuZnI=