 Therése Bengtsson1*
 Inger Åhman1
 Outi Manninen2Lars Reitan3Therese Christerson4†Jens Due Jensen5Lene Krusell6
 Ahmed Jahoor1,5
 Jihad Orabi5
- 1Department of Plant Breeding, Swedish University of Agricultural Sciences, Uppsala, Sweden
- 2Boreal Plant Breeding Ltd., Jokioinen, Finland
- 3Graminor AS, Ridabu, Norway
- 4Lantmännen Lantbruk, Malmö, Sweden
- 5Nordic Seed A/S, Galten, Denmark
- 6Sejet Plant Breeding, Horsens, Denmark
The powdery mildew fungus, Blumeria graminis f. sp. hordei is a worldwide threat to barley (Hordeum vulgare L. ssp. vulgare) production. One way to control the disease is by the development and deployment of resistant cultivars. A genome-wide association study was performed in a Nordic spring barley panel consisting of 169 genotypes, to identify marker-trait associations significant for powdery mildew. Powdery mildew was scored during three years (2012–2014) in four different locations within the Nordic region. There were strong correlations between data from all locations and years. In total four QTLs were identified, one located on chromosome 4H in the same region as the previously identified mlo locus and three on chromosome 6H. Out of these three QTLs identified on chromosome 6H, two are in the same region as previously reported QTLs for powdery mildew resistance, whereas one QTL appears to be novel. The top NCBI BLASTn hit of the SNP markers within the novel QTL predicted the responsible gene to be the 26S proteasome regulatory subunit, RPN1, which is required for innate immunity and powdery mildew-induced cell death in Arabidopsis. The results from this study have revealed SNP marker candidates that can be exploited for use in marker-assisted selection and stacking of genes for powdery mildew resistance in barley.
Introduction
Powdery mildew is one of the major diseases of barley (Hordeum vulgare L.) caused by the powdery mildew fungus, Blumeria graminis f. sp. hordei, an obligate biotrophic pathogen (Glawe, 2008). Control of powdery mildew may be achieved by fungicide applications, by deployment of resistant cultivars or a combination of the two. The use of host plant resistance is an environmentally sound alternative; however introduction of single resistance genes often leads to the so called ‘boom and bust cycles,’ where cultivars with a single major resistance gene are grown extensively until the pathogen overcomes the resistance. One way to avoid the ‘boom and bust cycles’ is to grow cultivars with broad-spectrum resistance, effective against several or all pathotypes. A successful example of this in barley is the use of the loss-of-function (mlo) alleles of the Mlo gene on chromosome 4H which has led to nearly complete resistance to powdery mildew, durable for more than 50 years (Jørgensen, 1992; Büschges et al., 1997). Before mlo was deployed, barley breeders made efforts to combine major resistance genes to combat the prevailing pathotypes. The locations of several major genes and quantitative trait loci (QTLs) associated with powdery mildew resistance have now been identified in barley (Friedt and Ordon, 2007). For example, major resistance genes have been mapped to chromosome 1H (Mla, Mlat, Mlk, Mlnn, Mlra, MlGa, and Mlp), 2H (MlLa), 4H (Mlg), 5H (Mlj), 6H (Mlh), and 7H (mlt and Mlf) (Jensen and Jørgensen, 1975; Doll and Jensen, 1986; Hilbers et al., 1992; Görg et al., 1993; Jørgensen and Wolfe, 1994; Schönfeld et al., 1996; Wei et al., 1999).
To enable the breeding of disease resistant barley material while at the same time maintain and/or improve important agronomical traits such as yield and malting quality, it is important to dissect the genetics behind the resistance traits. One method to localize genes for important agronomical traits is genome-wide association study mapping (GWAS) also known as linkage disequilibrium (LD) mapping (Zhu et al., 2008). GWAS takes advantage of ancestral recombination events to identify significant phenotypic and genotypic associations. One of the advantages of GWAS, compared to traditional linkage mapping of populations from bi-parental crosses, is that alleles present within diverse sets of accessions or existing natural populations can be identified (Zhu et al., 2008). However, to avoid false positives, a limit for the minor allele frequency (MAF) needs to be set, something which restricts the chance to detect rare and potentially unexploited alleles (Tabangin et al., 2009). The power of the GWAS lies in the degree of LD between the marker allele and the functional disease resistance allele. In cultivated barley, LD between markers has been found to be extensive, from 1 cM to beyond 10 cM (Kraakman et al., 2004; Caldwell et al., 2006; Malysheva-Otto et al., 2006; Rostoks et al., 2006; Comadran et al., 2011; Bengtsson et al., 2017). Compared to wild barley (H. vulgare ssp. spontaneum C. Koch) populations, the LD in elite breeding germplasm extends much further (Caldwell et al., 2006). Another important factor to consider when conducting GWAS analyses is the population structure (genetic relatedness) within the set of accessions, since it can inflate the number of spurious marker-trait associations identified (Pritchard et al., 2000). Barley is known to have a clear population structure with distinct sub-populations due to differences in row-type, i.e., two-row and six-row, as well as in seasonal growth habit, i.e., spring and winter (Malysheva-Otto et al., 2006; Rostoks et al., 2006; Hamblin et al., 2010; Rajala et al., 2016). Several statistical models to account for the strong population structure, hence reducing the inflation of false positive associations, have been developed (Price et al., 2006; Kang et al., 2008; Stich and Melchinger, 2009).
Recently, 15 QTLs for powdery mildew resistance were identified by GWAS in a wild barley collection, out of which seven were novel QTLs for powdery mildew resistance (Ames et al., 2015). Wild barley, H. v. ssp. spontaneum, is the progenitor of cultivated barley and can be used as a source of resistance. However, to introduce such novel QTL from wild barley to cultivated barley takes many back-crossing generations. Nevertheless, this demonstrates the potential of GWAS in detection of new markers for resistance traits.
In the present study, the aim was to identify SNP markers significantly associated with powdery mildew resistance loci in a Nordic spring barley panel using GWAS. The Nordic spring barley panel consisted of 169 breeding lines and cultivars provided by five Nordic plant breeding entities. Markers linked with known and novel powdery mildew resistance genes enable breeders to test for and combine the resistance genes in their breeding lines.
Materials and Methods
Nordic Spring Barley Panel
The association mapping panel consisted of 169 spring H. vulgare L. ssp. vulgare advanced breeding lines and cultivars originating from Boreal Plant Breeding (27), Graminor Breeding AS (28), Agricultural University of Iceland, LBHI (26), Lantmännen Lantbruk, LSW (28), Nordic Seed (28), and Sejet Planteforaedling I/S (30). Out of the 169 lines, 124 lines were two-rowed and 45 six-rowed. Further description of the lines can be found in Bengtsson et al. (2017).
Field Trials and Phenotypic Evaluation
The spring barley panel was evaluated for powdery mildew resistance in naturally infected fields for three consecutive years and with one or two observations over time per year at the following locations: southern Sweden at Svalöv (2012, 2; 2013, 2; 2014, 2) and Bjertorp (2013, 1), Denmark at Dyngby (2012, 1; 2014, 2) and Horsens (2013, 1), and Norway at Værnes (2014, 1). The field trials conducted in Sweden were sown in two replicates using a randomized complete block design. In Dyngby three replicates with three line rows, 1 m per replicate were used. At Horsens the trial was sown in four replicates with a plot size of 1.5 m × 2.5 m in an alpha lattice design with incomplete blocks. A hill plot system in an alpha lattice design with 50 seeds per plot in two replications, were used in Norway. The field designs were selected based on each breeding entities’ daily practices and field availability.
Statistical analyses of the phenotypic evaluations using the ordinal 1–9 disease rating scale (1 = minimum susceptibility, 9 = maximum susceptibility) were made in Minitab, release 16 (Minitab Inc., 2010). Mean values from replicates of a certain line, observation time, field location, and year were used for calculations of the frequency distribution whereas mean values from replicates of a certain line were used for calculations of the Spearman’s correlation coefficients.
Genotyping
DNA was extracted from 2 weeks old seedlings, using a CTAB (Cetyl Trimethyl Ammonium Bromide) method as described earlier by Orabi et al. (2014). The spring barley panel was genotyped using 48 SSR markers evenly distributed over all chromosomes and the barley iSelect SNP chip based on the Illumina Infinium 9K assay as described in Bengtsson et al. (2017). The SNP genotyping of the lines were outsourced to Trait Genetics (Gatersleben, Germany).
mlo Genotyping
The presence of mlo alleles in the spring barley panel was evaluated according to Piffanelli et al. (2004) for mlo-11 (MITE-Fw 5′-CTCCATTTGACTTGACTCG-3′, MITE-Rw 5′-CATGCATGGTTATTGTAAGC-3′) and by designing allele specific primers for mlo-5 and mlo-9 (mlo-5 and mlo-9 Fw 5′-GTAGCGTGCGCTTTCTTTTT-3′, mlo-5 Rw 5′-GCACCCCTTTTTTGTCCGA[C/T]-3′ and mlo-9 Rw 5′-GGCGTCTCCGGCAGCTCCC[G/A]-3′) according to Büschges et al. (1997). PCR amplifications were performed in Thermo-Fast 96-well plates in a final volume of 10 μl containing the following components: 100 ng/μl template DNA, 1x key buffer, 1.5 mM MgCl2, 200 μM dNTPs, 250 nM each forward and reverse primer and 0.25 U Taq-polymerase. Amplifications were carried out using a GeneAmp PCR System 2700 thermal cycler (Applied Biosystems, Foster City, CA, United States) with the following program: an initial denaturation step at 94°C for 60 s, followed by 18 touchdown cycles (decrementing 0.5°C per cycle) consisting of a denaturation step of 60 s at 94°C, an annealing step between 64 and 55°C for 30 s and an elongation step at 72°C for 60 s. Next, 20 cycles with a denaturing step of 60 s at 94°C, annealing step of 60 s at 55°C and an elongation step of 60 s at 72°C were performed. The final elongation step was carried out at 72°C for 5 min. The PCR products were evaluated on a 1.5% agarose gel with expected product sizes of 530 bp for mlo-11, 238 bp for mlo-5 and 263 bp for mlo-9.
Population Structure and Linkage Disequilibrium (LD)
Analyses of population structure based on a Bayesian clustering approach (STRUCTURE v.2.3.4, Pritchard et al., 2000), linkage disequilibrium (allele frequency correlation, r2) estimates between the SNP marker pairs using the full matrix option (Tassel 3.0 software1) and LD decay within this spring barley panel were performed and reported by Bengtsson et al. (2017).
Due to the non-normal data distribution we have, and to compare powdery mildew severity between structure groups, Kruskal–Wallis analysis was performed in Minitab, release 16 (Minitab Inc., 2010). Kruskal–Wallis analysis utilizes the median values and uses the p-value to determine whether any of the differences between the medians are statistically significant. The calculated mean from the powdery mildew observations and replicates of a certain line, using the ordinal 1–9 scale, were input data for calculations of the median value.
Genome-Wide Association Study (GWAS) of the Nordic Spring Barley Panel
Genome-wide association study based on the SNP markers was performed using Tassel version 5 (Bradbury et al., 2007). The SNPs were filtered for MAF ≤ 0.05 resulting in 5556 SNPs left for GWAS analyses. Nine models comprising both general linear models (GLMs) and mixed linear models (MLMs) were tested to account for the strong population structure, hence reducing the inflation of false positive associations. The different models included covariates from principal component analysis (PCA) obtained from Tassel, ancestry coefficient data (Q matrix) obtained from STRUCTURE, genetic distance (D) matrix and the relative kinship matrix (K) obtained from Tassel. D matrices from the SSR and the SNP markers were calculated using an in-house program written in VBA (Visual Basic for Applications) and implemented in Microsoft Excel 2007 (Microsoft, Redmond, WA, United States). The program utilizes R language software v.2.14.2 (R Development Core Team, 2012), which includes the modern applied statistics with S-plus (MASS) package (Venables and Ripley, 2002). Further details about the in-house program can be found in the paper by Ingvordsen et al. (2015).
The following GLM methods were tested: (i) Naïve (GLM without any correction for population structure); (ii) SNP distance (GLM, correction with DSNP matrix); (iii) SNP distance – PCA (GLM, correction with DSNP matrix and PCA covariates); (iv) SNP distance – SSR (GLM, correction with DSNP matrix and QSSR matrix); (v) SNP distance – SNP (GLM, correction with DSNP matrix and QSNP matrix) and the tested MLM methods were: (i) EMMA [efficient mixed-model association; MLM, correction with kinship (K) matrix]; (ii) EMMA – PCA (MLM, correction with K-matrix and PCA covariates); (iii) EMMA – SSR (MLM correction with K-matrix and QSSR-matrix); (iv) EMMA – SNP (MLM correction with K-matrix and QSNP-matrix).
A combined quantile–quantile plot for all models and methods, showing the relative distribution of the observed -log10 (p)-values for each marker – trait association compared with the cumulative were plotted in R. When selecting the best model and method the following criteria were considered (i) least deviation from the expected p-values, (ii) highest number of groups, (iii) high heritability, (iv) the lowest compression value, and (v) the lowest variance error. Association analysis between SNP markers and mildew infection was made using the model best fitting the criteria. The critical p-values for assessing the significance of associations in the naive model were corrected for multiple comparisons based on the Bonferroni method where the adjusted p-value = -log10 (α/n), α = significance level and n = number of observations (Bonferroni, 1935, 1936). Thus the Bonferroni adjusted cut-off for accepting associations were set to -log10 (p)-value ≥ 5.0 which corresponds to an experiment wise error rate of 0.05.
Kruskal–Wallis analyses were performed for the powdery mildew comparison between markers identified in the GWAS analysis. The input data for these calculations were the calculated mean score from replicates of a certain line, observation time, location, and year (N = 169).
Results
Powdery Mildew Evaluation
The Spearman correlation analysis revealed a high correlation between all powdery mildew evaluations performed in the field during the 2012, 2013 and 2014 growing seasons, coefficients ranging between 0.77 and 0.96 (Table 1). The distribution of the phenotypic values for powdery mildew resistance was skewed toward resistant reactions and the residuals did not follow a normal distribution (Figure 1). The mean values and range scores of the powdery mildew infection within each location for every observation and year can be found in Supplementary Table 1.
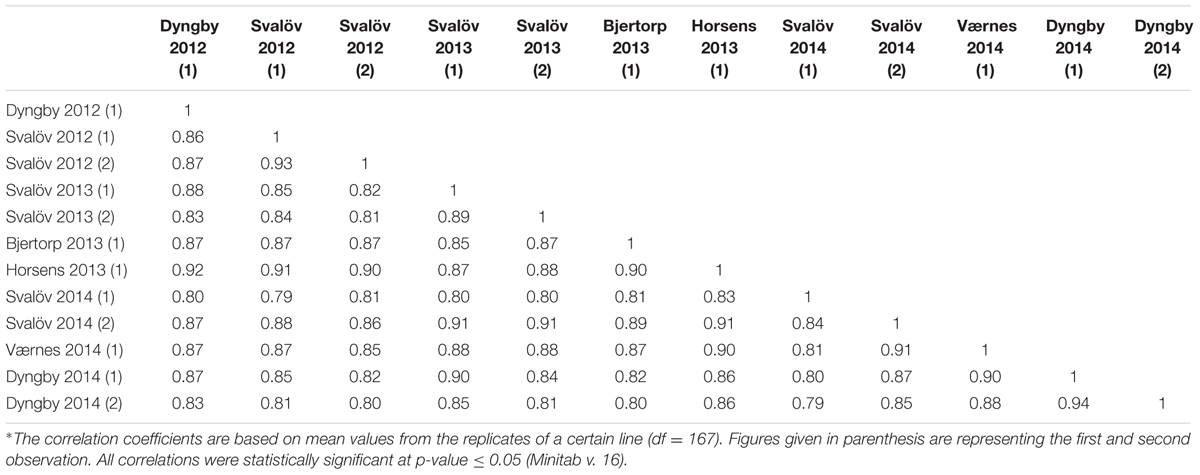
TABLE 1. Spearman’s correlation coefficients∗ of powdery mildew mean scores in the Nordic field trials 2012–2014.
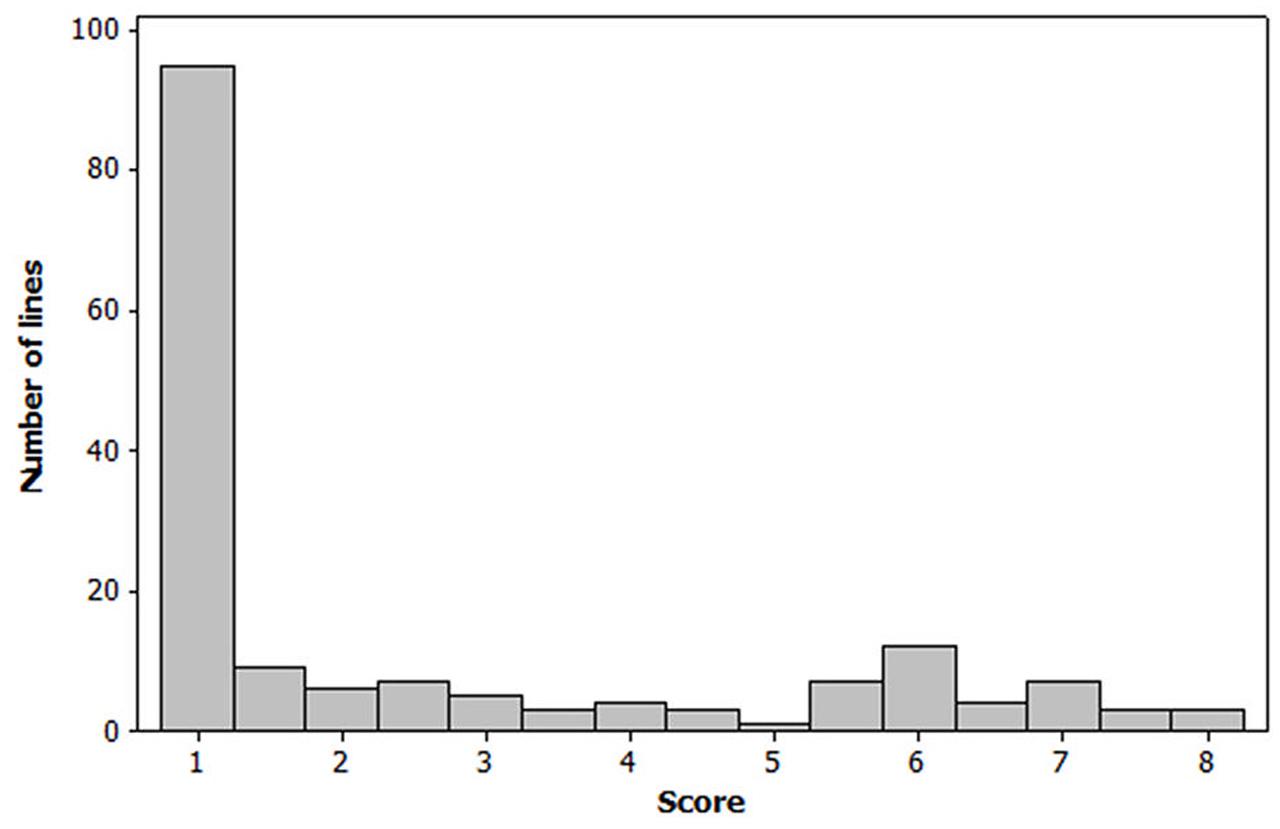
FIGURE 1. Frequency distribution of the barley lines based on their powdery mildew mean scores in the Nordic field trials 2012, 2013, and 2014. Each mean value is based on replicates of a certain line, observation time, location, and year (N = 169). Infection was scored on a 1–9 scale, where 1 = not infected and 9 = heavily infected.
Genotyping
Out of the 7,842 high-confidence SNPs, derived from expressed genes, on the barley iSelect SNP chip based on the Illumina Infinium 9K assay, 6,208 SNPs were polymorphic. The polymorphic information content (PIC) values ranged between 0.26 (1H) and 0.31 (6H) with an average of 0.28 (Table 2). The marker coverage for the seven chromosomes varied between 0.17 and 0.28 (Table 2). The genotyping based on the SSR markers resulted in 234 scorable loci and an average PIC value of 0.46. More detailed information regarding the genotyping, as well as results from the comparison of the two marker systems, can be found in Bengtsson et al. (2017).
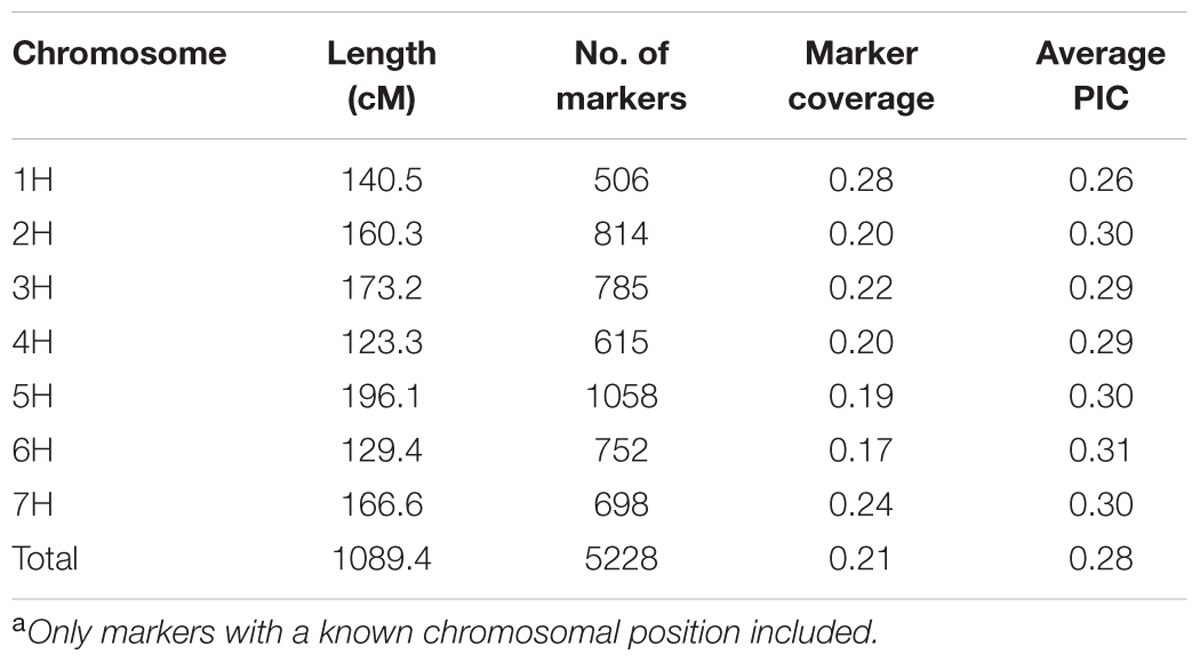
TABLE 2. SNP coverage, polymorphism (PIC) and distribution across chromosomesa.
mlo Evaluation
Lines tested positive with primers for any of the three mlo alleles mlo-5, mlo-9, and mlo-11 were considered as mlo lines. Out of the 169 lines, 109 were found to be mlo lines. There was a large difference between the two row types, where an mlo allele was found in 78% of the two-rowed lines but in just 27% of the six-rowed lines.
Powdery Mildew within the Structure Groups
The Bayesian clustering analysis showed population sub-structuring within the spring barley panel; group K1 (N = 109) consisting only of two-rowed lines, K2 (N = 47) consisting mainly of six-rowed lines and admixed (N = 13) (Figure 2). The admixed group is a small group of two-rowed lines, from the northern parts of the Nordic region. Breeder origin and row type of each line have been reported earlier by Bengtsson et al. (2017). The highest powdery mildew infection mean was found in sub-groups admixed and K2 whereas the lowest infection rate was found in sub-group K1 (Table 3 and Figure 2). Kruskal–Wallis analysis revealed that the K1 median was significantly different (p-value ≤ 0.05) from those of both K2 and the admixed group with a negative Z-value which indicates that the K1 group’s average rank is less than the overall average (Table 3). No significant difference was observed between K2 and the admixed group. The proportion of lines with mlo alleles in K1 and K2 were 88 and 26%, respectively, whereas no mlo alleles were found in the admixed group.
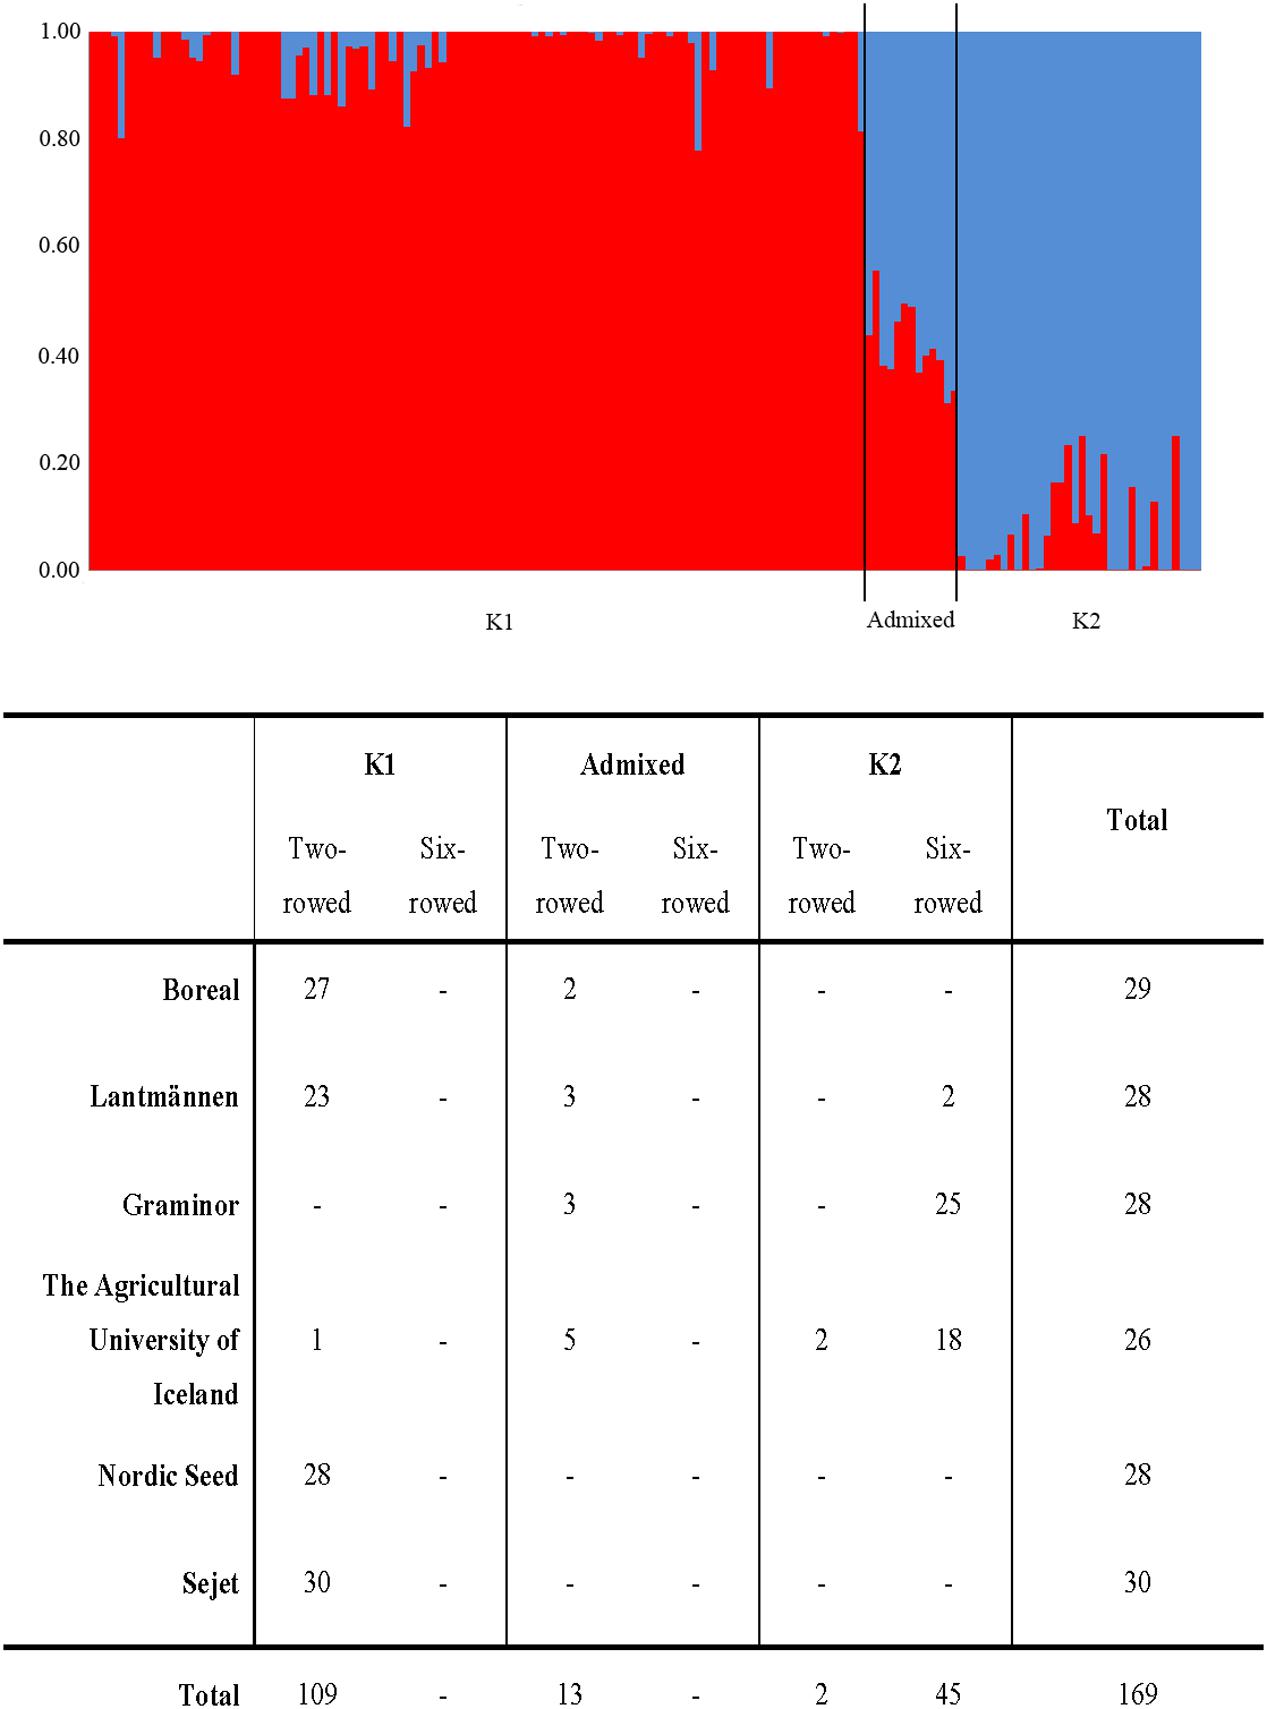
FIGURE 2. Sub-groups in the Nordic spring barley panel according to STRUCTURE software analysis. The table shows number of lines in each sub-group from each breeding entity, split on two-rowed and six-rowed genotypes.
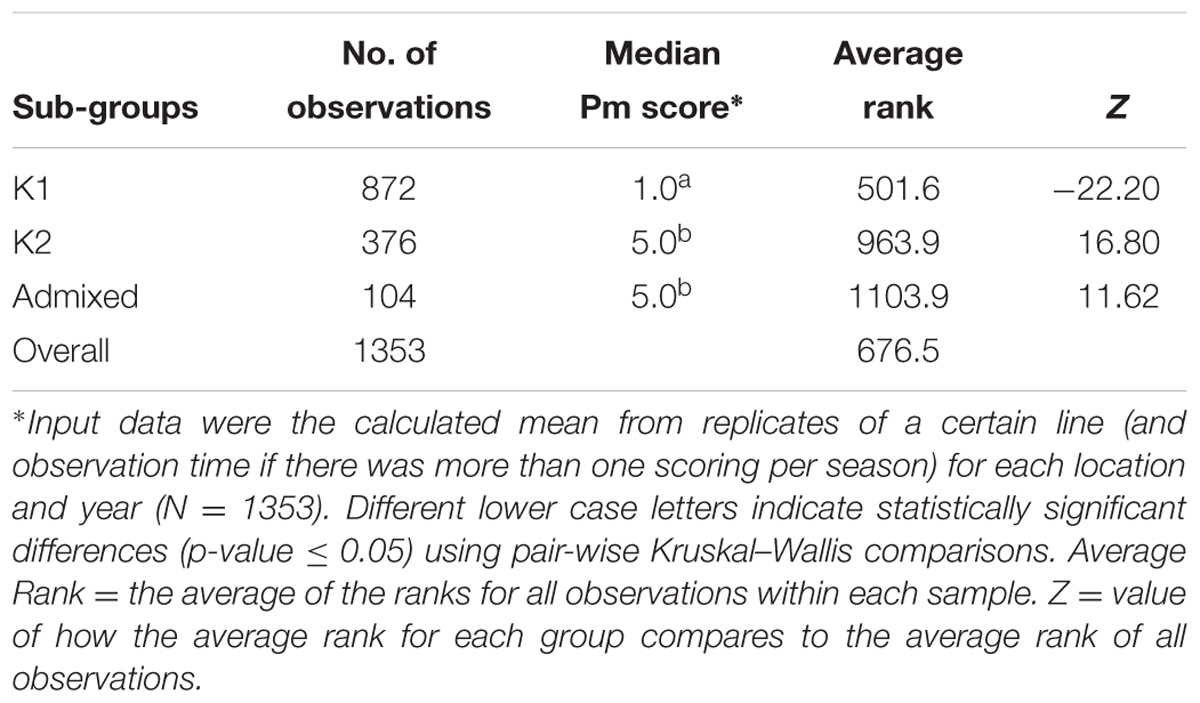
TABLE 3. Powdery mildew (Pm) infection rates of the sub-groups in the Nordic spring barley panel, consisting of 169 lines, based on data from the five different field locations during 2012–2014.
Genome-Wide Association Analysis of the Nordic Spring Barley Panel
Selection of Model
The QQ-plot (Figure 3), showing the relative distribution of observed -log10 (p)-values for every model in comparison with the cumulative distribution, revealed numerous spurious observations when applying the naïve model and the four GLM using the DSNP matrix. Among the GLM models the model including the D-matrix and PCA covariates from the SNP data was best in correcting for the structure. However, the four MLM using the K matrix were found to better account for the observed population structure and showed a similar distribution. Thus these EMMA models were further compared based on number of groups, compression, heritability, explained genetic variance, variance error and minus two log likelihood function value (-2LnLk). The number of groups and compression level were 169 and 1, respectively, for all EMMA models. The EMMA-none model had highest heritability (0.90), the highest genetic variance (1.09), and lowest error (0.13) and was therefore used in all GWAS analysis.
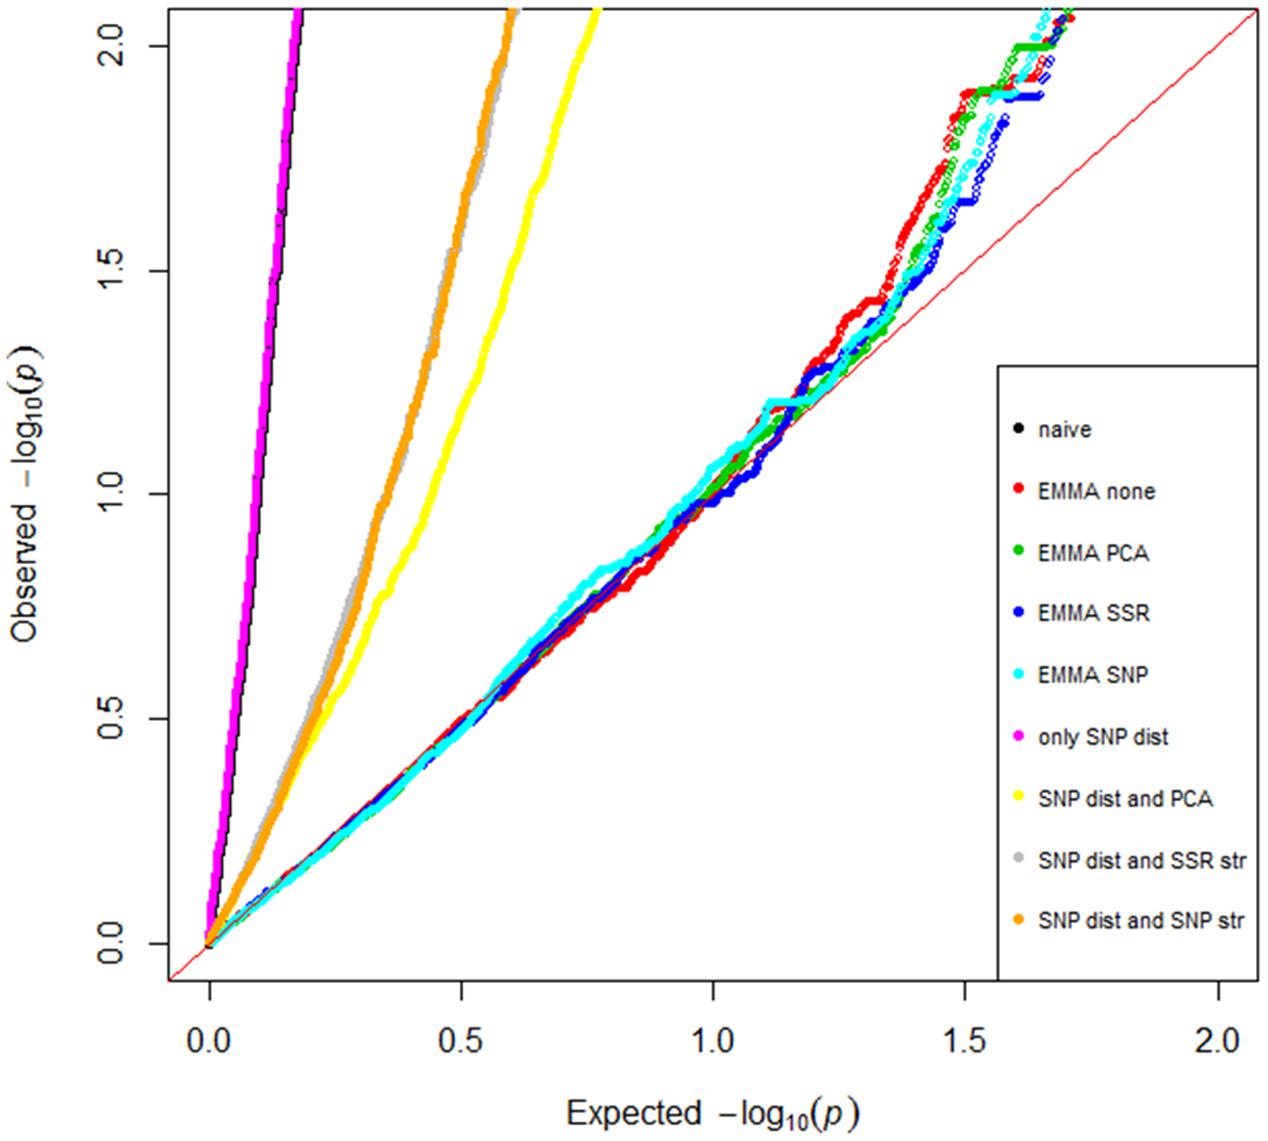
FIGURE 3. Model comparisons for the genome-wide association study. Quantile–quantile plot of the expected versus the observed distribution of p-values were computed from 5,556 SNP markers for the different association models.
Associations with Powdery Mildew Resistance
Genome-wide association between the SNP markers and powdery mildew resistance was performed based on overall mean values from all locations. A Manhattan plot showing the -log10 (p)-values for the markers according to chromosomal position, except four cases where the genetic chromosomal positions are unknown (“U” in Table 4), are shown in Figure 4. A total of 18 significant SNP marker-trait associations (p-value ≤ 0.05, Bonferroni corrected) were found, that could be grouped into one QTL on 4H (99–104 cM) and three QTLs on 6H (11, 45–49, and 106 cM). The effect of the most significant marker within each QTL varied between 2.0 and 2.9 (on a disease scale from 1 to 9) (Table 4).
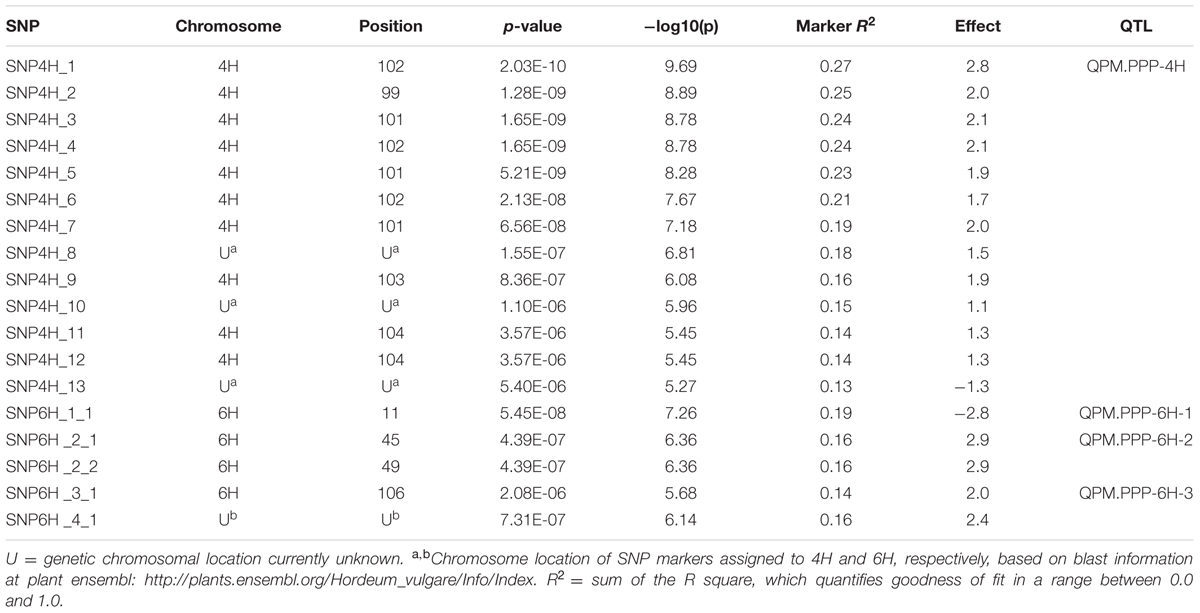
TABLE 4. Significant markers associated with powdery mildew resistance using the EMMA model in the Nordic spring barley panel.
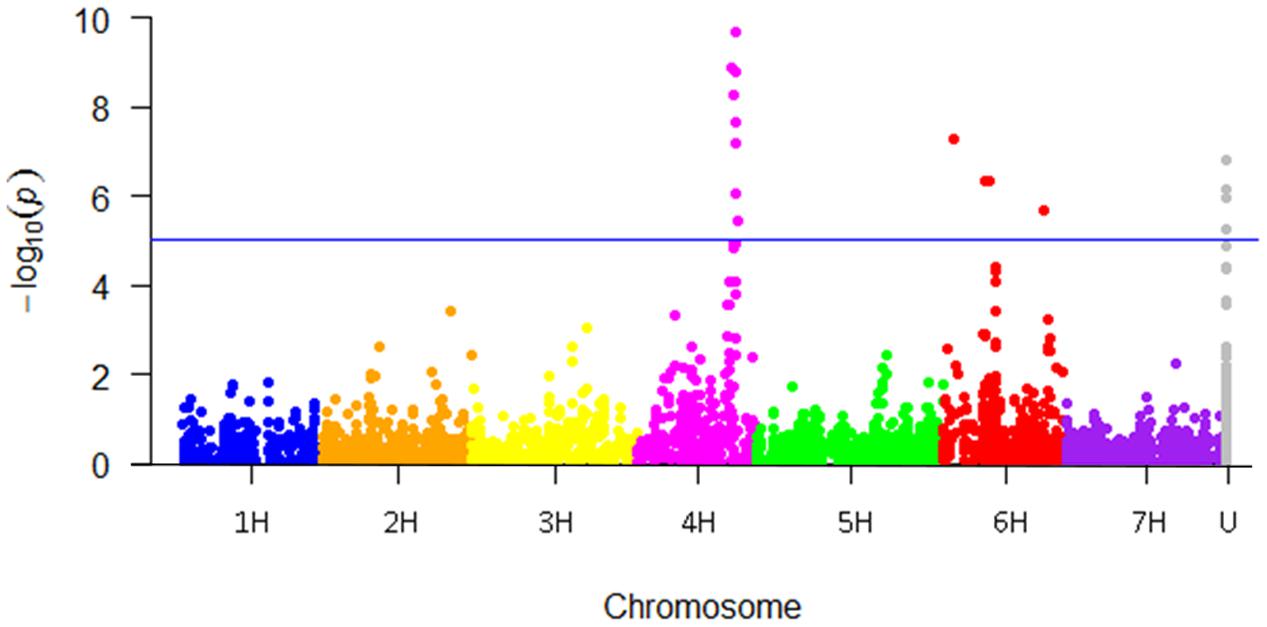
FIGURE 4. Manhattan plot showing the genome-wide association study (GWAS) results for powdery mildew in the Nordic spring barley panel. The Bonferroni adjusted cut-off for accepting associations were set to –log10 (p)-value ≥ 5.0 corresponding to an experiment wise error rate of 0.05. U = genetic chromosomal location currently unknown.
Blast information2 revealed that the most significant marker, SNP4H_1 marker in QTL QPM.PPP-4H on chromosome 4H, and the mlo gene are physically close (∼3 Kbp, data not shown). A significantly lower (p-value ≤ 0.05) median mildew score was found among lines with the positive allele of the SNP4H_1 marker for QPM.PPP-4H and the mlo lines compared to the lines having the negative allele of SNP4H_1 and the non-mlo lines, respectively (Table 5). There was no difference in the median mildew score between lines with the resistance allele of marker SNP4H_1 and the lines carrying one of the mlo resistance alleles (Table 5). All mlo lines were found to have the positive allele of the SNP4H_1 marker and these lines had an average powdery mildew score of 1.2. The 15 non-mlo lines with the positive allele for SNP4H_1 had a median mildew score of 3.1.
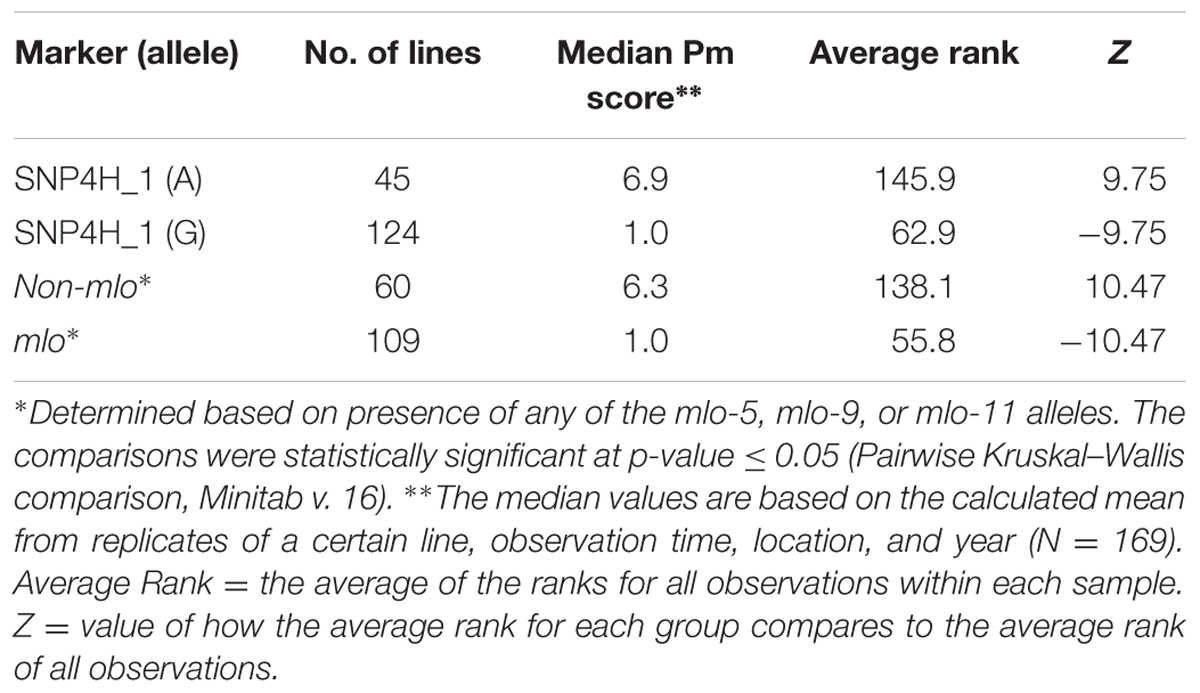
TABLE 5. Powdery mildew (Pm) comparisons between the presence of mlo alleles and the most significant QPM.PPP-4H marker, physically close to mlo.
Almost all mlo lines were found to also have the positive alleles of the most significant markers within QPM.PPP-6H-1, QPM.PPP-6H-2, and QPM.PPP-6H-3 (data not shown). The top NCBI BLASTn hit3 for SNP6H_2_2 was predicted to be in the gene for 26S proteasome regulatory subunit, RPN1. For SNP6H_2_1 the top hit was an mRNA sequence from a H. v. ssp. vulgare cDNA clone: FLbaf61b05, with unknown function. No BLASTn hits for the other markers on 6H were found. Since the GWAS results revealed that the two markers in QPM.PPP-6H-2 had equal effect and significance level, the SNP6H_2_2 marker was chosen to be used for further marker comparisons.
The positive alleles of marker: SNP6H_1_1, SNP6H_2_2, and SNP6H_3_1 on 6H were associated with a significantly reduced (p-value ≤ 0.05) median powdery mildew score in the non-mlo lines; from 7.7 to 4.9, 7.0 to 3.5 and 7.6 to 4.9, respectively (Table 6). Lines having all the positive alleles for the SNP6H_1_1, SNP6H_2_2, and SNP6H_3_1 marker had the lowest median powdery mildew score (haplotype CGT; 1.0), which was significantly lower than the median powdery mildew score found among the lines having all the three negative alleles (haplotype TAC; 7.7) (Table 7). The lowest powdery mildew median scores were found for the haplotypes including the positive allele of SNP6H_2_2 (CGC, 1.4; CGT, 1.0; TGT, 3.7).
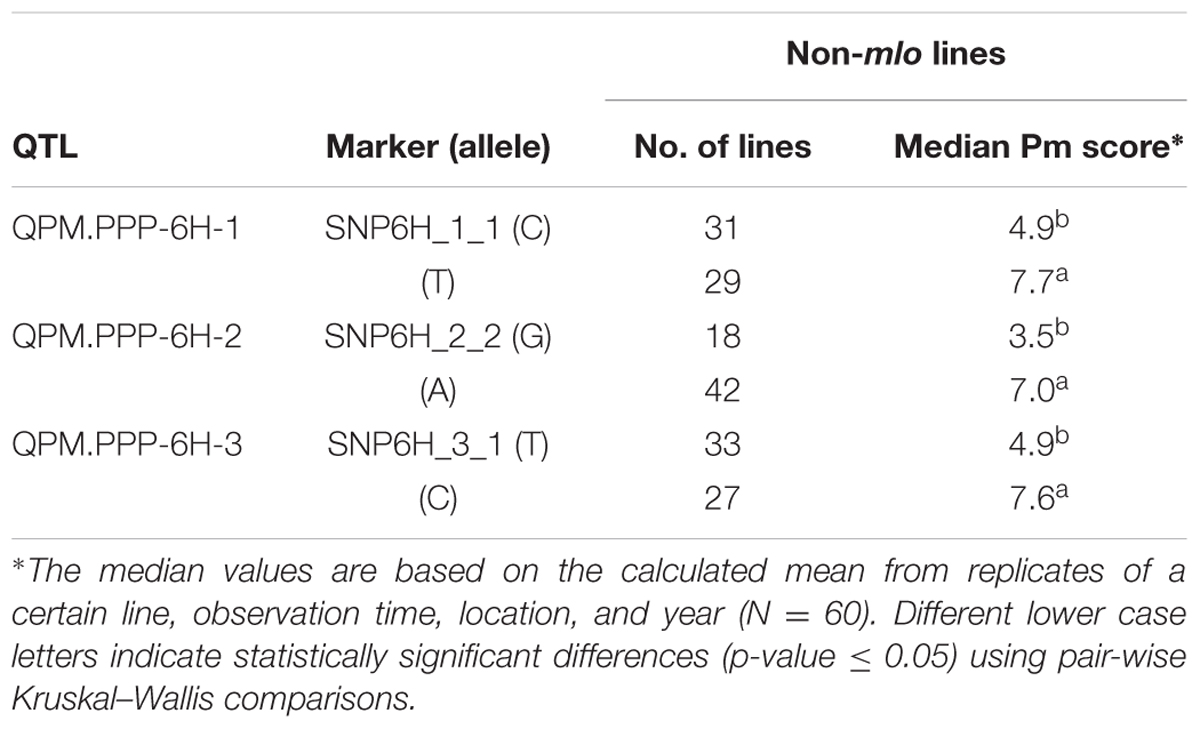
TABLE 6. Allele distributions of the most effective markers in QPM.PPP-6H-1 to 3 in non-mlo lines.
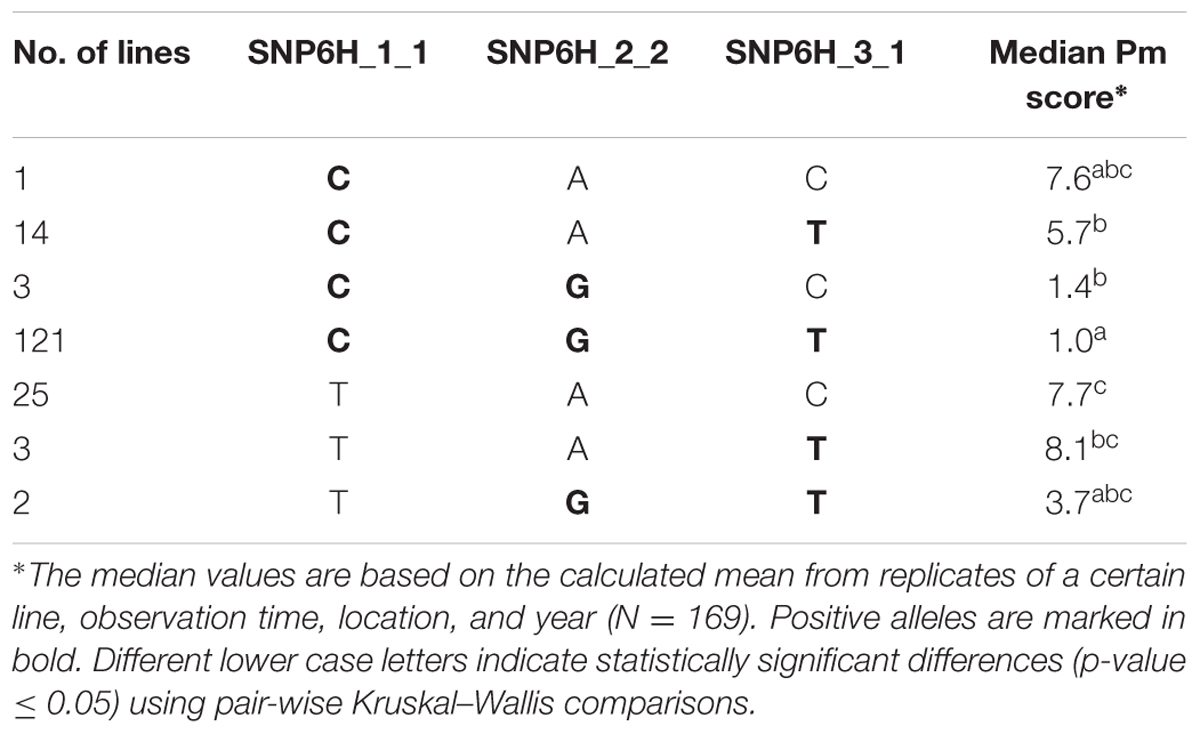
TABLE 7. Haplotype effect of the most effective markers in QPM.PPP-6H-1 to 3 on the powdery mildew (Pm) infection.
The positive allele of the most significant marker in QPM.PPP-4H and QPM.PPP-6H-2, reduced the mean infection scores by 25 and 35% among the lines only having the positive allele for QPM.PPP-4H (three lines) or QPM.PPP-6H-2 (five lines), respectively, whereas a reduction of the mean powdery mildew infection score by 79% was found among the lines having both of the positive alleles (121 lines).
Discussion
This panel of advanced breeding lines and cultivars consists of two genetically distinct groups each with a common ancestry, K1 and K2, and one admixed group (Bengtsson et al., 2017). The present study revealed that the proportion of lines with mlo alleles was 88% in K1 (only two-rowed lines) and 26% in K2 (mostly six-rowed lines), whereas no mlo alleles were found in the admixed group consisting of cultivars and breeding lines from the northern part of the Nordic region. This difference explains the low powdery mildew infection mean observed in K1 compared to the other two groups. A high proportion of lines with mlo alleles among the two-rowed lines is expected since the risk of powdery mildew infection is higher in the southern region with its milder climate, and where mostly two-rowed barley is cultivated (Hovmøller et al., 2000).
Due to the strong population structure observed in this spring barley panel, several models were tested to control for structure. To find the best model, the naïve GLM model was compared with variants including the SNP D-matrix and with EMMA-none with variants for corrections (Figure 3). The EMMA-none model was superior to all methods tested in controlling the strong population structure in this spring barley panel (Figure 3), as well as for controlling structure in a world-wide spring barley collection (Pasam et al., 2012). The EMMA-none model is faster to compute compared to the linear models and has the advantage that it does not require any additional matrix for calculation.
Using the EMMA-none model and field data, consistent between observation times, years and locations (Table 1), 18 significant marker-trait associations were found for powdery mildew with an estimated marker effect of the most significant marker within each QTL varying between 2.0 and 2.9 (on a disease scale from 1 to 9) (Table 4). Out of these, four significant marker-trait associations were found for previously unmapped markers, however three of them could be assigned to chromosome 4H and one to 6H using blast information at plant ensembl4.
The three markers on 4H were assigned to QPM.PPP-4H. In total 13 significant SNP markers were found within a QTL (QPM.PPP-4H) on 4H, with an average mildew score reduction of 2.8 for the most significant marker-trait association and locating physically close (∼3 Kbp) to the previously identified mlo locus (Piffanelli et al., 2004). This was expected, since 64% of the barley lines included in this study contains one of the mlo resistance alleles mlo-5, mlo-9 (Büschges et al., 1997) or mlo-11 (MITE) (Piffanelli et al., 2004). Interestingly, there was no difference in the median mildew score between the lines having the positive allele for the QPM.PPP-4H, SNP4H_1 marker and the mlo lines (Table 5), which shows that the markers within QPM.PPP-4H can be good candidates for future use in marker-assisted selection for powdery mildew resistance in barley. The SNPs found within QPM.PPP-4H can easily be converted to easy-to-use DNA markers such as competitive allele-specific PCR (KASP) markers (Semagn et al., 2014), which enables fast and high-throughput analysis compared to the more time-consuming agarose-based analysis associated with the MITE markers for mlo (Piffanelli et al., 2004). However, there were 15 non-mlo lines with the positive allele for SNP4H_1 that had a low median mildew score, but not as low as for the mlo lines. Still the benefits with a high-throughput and faster analysis for screening of powdery mildew resistance based on the SNP4H_1 marker are higher than the disadvantage of at the same time selecting a few lines without mlo with a somewhat higher but still low average mildew score.
Four significant marker-trait associations were also located on chromosome 6H and assigned to two QTLs on the short arm (QPM.PPP-6H-1, QPM.PPP-6H-2) and one on the long arm (QPM.PPP-6H-3). The significant marker-trait association identified on 6H at 11 cM, QPM.PPP-6H-1, was within the same region (19 cM) as a QTL (Bgh-qtl-6H-bPb-8473) recently identified to be associated with powdery mildew resistance in wild barley (Ames et al., 2015). Two significant marker-trait associations were found located on 6H at 45 and 49 cM within QPM.PPP-6H-2, which had a similarly strong effect as the QTL QPM.PPP-4H. This could be due to the strong LD found between the markers within QPM.PPP-4H and markers within QPM.PPP-6H-2 (r2 between 0.5 and 0.8, data not shown) which most likely is caused by the strong population structure. However, when comparing the haplotype effect of the most significant marker in QPM.PPP-4H and QPM.PPP-6H-2, the mean infection scores were reduced considerably more among the lines having both of the positive alleles compared to the lines only having the positive allele for either of the two. Altogether, this indicates that QPM.PPP-6H-2 adds to the QPM.PPP-4H effect.
When comparing the haplotypes for the most effective markers in QPM.PPP-6H-1 to 3, the lowest powdery mildew median scores were also found in the haplotypes including the most effective marker within QPM.PPP-6H-2 (Table 7). The spring barley panel appears to suffer from the skewness due to the large number of lines carrying mlo resistance allele and this may affect the GWAS results. However, the mildew scores for the different haplotypes indicate that we may be dealing with a new QTL. No other QTL for powdery mildew resistance has so far, to our knowledge, been reported within the location of QPM.PPP-6H-2; hence this could be a novel QTL for powdery mildew resistance. The top NCBI BLASTn hit for SNP6H_2_2 within QPM.PPP-6H-2 is predicted to be the protein 26S proteasome regulatory subunit, RPN1. RPN1a has previously been reported to be required for innate immunity and mildew-induced cell death in Arabidopsis (Yao et al., 2012) as well as to negatively control ABA signaling and to function during embryogenesis and stress responses in Arabidopsis (Brukhin et al., 2005; Yu et al., 2016). Another significant marker-trait association QPM.PPP-6H-3 was found on the long arm of 6H at 106 cM which is close to the powdery mildew resistance QTL, Rbgq (Aghnoum et al., 2010). Possibly it marks the same QTL.
Even though mlo-resistance is common in barley cultivars and valued among growers, there are reports showing that it may lead to an increased susceptibility to necrotrophic and hemi-biotrophic pathogens (Kumar et al., 2001; Brown and Rant, 2013; McGrann et al., 2014). A negative correlation between powdery mildew and Ramularia infestation found also in our material may be in support of this (data not shown). In addition, mlo-resistance has been shown to be accompanied with deleterious pleiotropic effects such as development of spontaneous leaf cell death lesions in the absence of pathogens, leading to some reduction in yield (Kjaer et al., 1990; Thomas et al., 1998). This makes the localization of the markers for powdery mildew resistance on chromosome 6H very valuable for breeders when breeding for multiple disease resistance in barley in the Nordic region, even though the mildew reducing effect is not as dramatic as with mlo.
In a previous study of a world-wide collection of spring barley, the spike morphology trait ‘row-type’ (two-rowed spike vs. six-rowed spike) were used as a proof-of-concept for the GWAS and a total of 34 marker-trait associations including associations with known spike morphology loci like vrs1, vrs2, vrs3, vrs4, and int-c were identified (Pasam et al., 2012). The same analysis was performed in our study to evaluate the EMMA model used in the GWAS for powdery mildew resistance. In contrast to the results reported by Pasam et al. (2012), only two significant marker-trait associations for spike morphology, one on 2H (74 cM) and one on 4H (26 cM), were identified here. The two associations were concurrent with the previously identified major spike morphology loci vrs1 and int-c (Komatsuda et al., 2007; Ramsay et al., 2011). One possible explanation for this difference between these two studies might be that the number of six-rowed lines used in the present study was less than half of the number of six-rowed lines used by Pasam et al. (2012). Another explanation could be the stricter threshold used in this study to claim significant associations. Nevertheless, the logarithmic values for the two associations detected here is substantially higher [-log10 (p) > 25] compared to the values for the spike morphology associations reported by Pasam et al. (2012). The two associations detected for spike morphology in our study demonstrate the stringency and accuracy of the GWAS analysis. However, it is important to consider that while reducing the number of false-positives, the number of false negatives may increase. It has earlier been shown that increasing the stringency of the GWAS model in barley results in that a larger proportion of the trait variation is explained by the model itself rather than by genetic effects (Pasam et al., 2012). In our study the percentage of genetic trait variation detected (R2 values) for the corresponding SNPs were low, ranging from 0.13 to 0.27. Low R2 values have often been reported in studies of GWAS and the unexplained variation has been referred to as ‘unexplained missing heritability’ (Manolio et al., 2009). Several possible explanations for this ‘unexplained missing heritability’ has been proposed including; insufficient marker coverage, rare alleles (MAF < 5%) with a major effect excluded from the analysis, the trait depends on several genes/QTLs with small individual effects, inadequate statistical approaches to detect epistatic interactions and biased estimates of R2 for individual SNPs caused by population stratification (Maher, 2008; Frazer et al., 2009; Manolio et al., 2009; Gibson, 2010; Hall et al., 2010). The strong population structure in the barley panel could be a possible explanation for the unexplained missing heritability observed in this study.
Conclusion
Careful optimization of the model is needed to find an appropriate balance in terms of sensitivity and selectivity in GWAS of highly structured populations and inbreeding crops like barley. In this study the use of the best model to account for population structure resulted in the localization of three presumably known QTLs for powdery mildew resistance and the detection of one, to our knowledge, novel QTL on chromosome 6H. After validation the corresponding SNPs could be exploited for marker-assisted selection and for stacking of powdery mildew resistance genes in barley.
Author Contributions
All authors were involved in the planning and design of the study, edited and approved the final manuscript. LR, TC, JDJ, and LK were responsible for the field experiments and phenotyping in the field. JO performed the genotyping of the SNPs and SSRs and the mlo evaluation. TB performed the GWAS and statistical analysis, wrote the manuscript, made the figures and finalized the tables. IÅ, OM, AJ, and JO assisted in the writing and interpretation of the data.
Funding
We thank NordGen and the Nordic Council of Ministers (NMR) for administration and financial support of this study that was conducted within a larger project, Public Private Partnership (PPP) for Pre-breeding in barley. This work was funded by Nordisk Ministerråd (No. PPP_02).
Conflict of Interest Statement
The authors declare that the research was conducted in the absence of any commercial or financial relationships that could be construed as a potential conflict of interest.
Acknowledgments
We would like to thank former and present partners of the PPP Barley consortium, i.e., Merja Veteläinen, Marja Jalli, Muath Alsheikh, Stein Bergersen, Stine Tuvesson, Vahid Edriss, Rasmus Lund Hjortshøj, Magnus Göransson, Sæmundur Sveinsson, and Gunter Backes.
Supplementary Material
The Supplementary Material for this article can be found online at: https://www.frontiersin.org/articles/10.3389/fpls.2017.01954/full#supplementary-material
Footnotes
- ^ http://www.maizegenetics.net
- ^ http://plants.ensembl.org
- ^ https://blast.ncbi.nlm.nih.gov
- ^ http://plants.ensembl.org
References
Aghnoum, R., Marcel, T. C., Johrde, A., Pecchioni, N., Schweizer, P., and Niks, R. E. (2010). Basal host resistance of barley to powdery mildew: connecting quantitative trait loci and candidate genes. Mol. Plant Microbe Interact. 23, 91–102. doi: 10.1094/MPMI-23-1-0091
Ames, N., Dreiseitl, A., Steffenson, B. J., and Muehlbauer, G. J. (2015). Mining wild barley for powdery mildew resistance. Plant Pathol. 64, 1396–1406. doi: 10.1111/ppa.12384
Bengtsson, T., Manninen, O., Jahoor, A., and Orabi, J. (2017). Genetic diversity, population structure and linkage disequilibrium in Nordic spring barley (Hordeum vulgare L. subsp. vulgare). Genet. Resour. Crop Evol. 64, 2021–2033. doi: 10.1007/s10722-017-0493-5
Bonferroni, C. E. (1935). Il Calcolo Delle Assicurazioni su Gruppi di Teste. Rome: Tipografia del Senato.
Bonferroni, C. E. (1936). Teoria Statistica Delle Classi e Calcolo Delle Probabilita. Florence: Libreria internazionale Seeber.
Bradbury, P. J., Zhang, Z., Kroon, D. E., Casstevens, T. M., Ramdoss, Y., and Buckler, E. S. (2007). TASSEL: software for association mapping of complex traits in diverse samples. Bioinformatics 23, 2633–2635. doi: 10.1093/bioinformatics/btm308
Brown, J., and Rant, J. (2013). Fitness costs and trade-offs of disease resistance and their consequences for breeding arable crops. Plant Pathol. 62, 83–95. doi: 10.1111/ppa.12163
Brukhin, V., Gheyselinck, J., Gagliardini, V., Genschik, P., and Grossniklaus, U. (2005). The RPN1 subunit of the 26S proteasome in Arabidopsis is essential for embryogenesis. Plant Cell 17, 2723–2737. doi: 10.1105/tpc.105.034975
Büschges, R., Hollricher, K., Panstruga, R., Simons, G., Wolter, M., Frijters, A., et al. (1997). The barley Mlo gene: a novel control element of plant pathogen resistance. Cell 88, 695–705. doi: 10.1016/S0092-8674(00)81912-1
Caldwell, K. S., Russell, J., Langridge, P., and Powell, W. (2006). Extreme population-dependent linkage disequilibrium detected in an inbreeding plant species, Hordeum vulgare. Genetics 172, 557–567. doi: 10.1534/genetics.104.038489
Comadran, J., Thomas, W. T., van Eeuwijk, F. A., Ceccarelli, S., Grando, S., Stanca, A. M., et al. (2011). Patterns of genetic diversity and linkage disequilibrium in a highly structured Hordeum vulgare association-mapping population for the Mediterranean basin. Theor. Appl. Genet. 119, 175–187. doi: 10.1007/s00122-009-1027-0
Doll, H., and Jensen, H. P. (1986). Localization of powdery mildew resistance gene Ml-ra on barley chromosome 5. Hereditas 105, 61–65. doi: 10.1111/j.1601-5223.1986.tb00642.x
Frazer, K. A., Murray, S. S., Schork, N. J., and Topol, E. J. (2009). Human genetic variation and its contribution to complex traits. Nat. Rev. Genet. 10, 241–251. doi: 10.1038/nrg2554
Friedt, W., and Ordon, F. (2007). “Molecular markers for gene pyramiding and disease resistance breeding in barley,” in Genomics-Assisted Crop Improvement: Genomics Applications in Crops, Vol. 2, eds R. K. Varshney and R. Tuberosa (Dordrecht: Springer), 81–101. doi: 10.1007/978-1-4020-6297-1_4
Gibson, G. (2010). Hints of hidden heritability in GWAS. Nat. Genet. 42, 558–560. doi: 10.1038/ng0710-558
Glawe, D. A. (2008). The powdery mildews: a review of the world’s most familiar (yet poorly known) plant pathogens. Phytopathology 46, 27–51. doi: 10.1146/annurev.phyto.46.081407.104740
Görg, R., Hollricher, K., and Schulze-Lefert, P. (1993). “Functional analysis of the MLG resistance locus in barley,” in Mechanisms of Plant Defense Responses, eds B. Fritig and M. Legrand (Dordrecht: Springer), 45–48. doi: 10.1007/978-94-011-1737-1_7
Hall, D., Tegström, C., and Ingvarsson, P. K. (2010). Using association mapping to dissect the genetic basis of complex traits in plants. Brief. Funct. Genomics 9, 157–165. doi: 10.1093/bfgp/elp048
Hamblin, M. T., Close, T. J., Bhat, P. R., Chao, S., Kling, J. G., Abraham, K. J., et al. (2010). Population structure and linkage disequilibrium in US barley germplasm: implications for association mapping. Crop Sci. 50, 556–566. doi: 10.2135/cropsci2009.04.0198
Hilbers, S., Fischbeck, G., and Jahoor, A. (1992). Localization of the laevigatum resistance gene MlLa against powdery mildew in the barley genome by the use of RFLP markers. Plant Breed. 109, 335–338. doi: 10.1111/j.1439-0523.1992.tb00193.x
Hovmøller, M., Caffier, V., and Jalli, M. (2000). The European barley powdery mildew virulence survey and disease nursery 1993–1999. Agronomie 20, 729–743. doi: 10.1051/agro:2000172
Ingvordsen, C. H., Backes, G., Lyngkjær, M. F., Peltonen-Sainio, P., Jahoor, A., Mikkelsen, T. N., et al. (2015). Genome-wide association study of production and stability traits in barley cultivated under future climate scenarios. Mol. Breed. 35, 1–14. doi: 10.1007/s11032-015-0283-8
Jensen, J., and Jørgensen, J. H. (1975). The barley chromosome 5 linkage map. Hereditas 80, 17–26. doi: 10.1111/j.1601-5223.1975.tb01495.x
Jørgensen, I. H. (1992). Discovery, characterization and exploitation of Mlo powdery mildew resistance in barley. Euphytica 63, 141–152. doi: 10.1007/BF00023919
Jørgensen, J. H., and Wolfe, M. (1994). Genetics of powdery mildew resistance in barley. CRC Crit. Rev. Plant Sci. 13, 97–119. doi: 10.1080/07352689409701910
Kang, H. M., Zaitlen, N. A., Wade, C. M., Kirby, A., Heckerman, D., Daly, M. J., et al. (2008). Efficient control of population structure in model organism association mapping. Genetics 178, 1709–1723. doi: 10.1534/genetics.107.080101
Kjaer, B., Jensen, H., Jensen, J., and Jørgensen, J. H. (1990). Associations between three ml-o powdery mildew resistance genes and agronomic traits in barley. Euphytica 46, 185–193. doi: 10.1007/BF00027217
Komatsuda, T., Pourkheirandish, M., He, C., Azhaguvel, P., Kanamori, H., Perovic, D., et al. (2007). Six-rowed barley originated from a mutation in a homeodomain-leucine zipper I-class homeobox gene. Proc. Natl. Acad. Sci. U.S.A. 104, 1424–1429. doi: 10.1073/pnas.0608580104
Kraakman, A. T., Niks, R. E., Van den Berg, P. M., Stam, P., and Van Eeuwijk, F. A. (2004). Linkage disequilibrium mapping of yield and yield stability in modern spring barley cultivars. Genetics 168, 435–446. doi: 10.1534/genetics.104.026831
Kumar, J., Huckelhoven, R., Beckhove, U., Nagarajan, S., and Kogel, K. H. (2001). A Compromised Mlo pathway affects the response of barley to the necrotrophic fungus Bipolaris sorokiniana (Teleomorph: Cochliobolus sativus) and its toxins. Phytopathology 91, 127–133. doi: 10.1094/phyto.2001.91.2.127
Malysheva-Otto, L. V., Ganal, M. W., and Roder, M. S. (2006). Analysis of molecular diversity, population structure and linkage disequilibrium in a worldwide survey of cultivated barley germplasm (Hordeum vulgare L.). BMC Genet. 7:6. doi: 10.1186/1471-2156-7-6
Manolio, T. A., Collins, F. S., Cox, N. J., Goldstein, D. B., Hindorff, L. A., Hunter, D. J., et al. (2009). Finding the missing heritability of complex diseases. Nature 461, 747–753. doi: 10.1038/nature08494
McGrann, G. R. D., Stavrinides, A., Russell, J., Corbitt, M. M., Booth, A., Chartrain, L., et al. (2014). A trade off between mlo resistance to powdery mildew and increased susceptibility of barley to a newly important disease, Ramularia leaf spot. J. Exp. Bot. 65, 1025–1037. doi: 10.1093/jxb/ert452
Minitab Inc. (2010). Minitab 16 Statistical Software [Computer software]. State College, PA: Minitab Inc.
Orabi, J., Jahoor, A., and Backes, G. (2014). Changes in allelic frequency over time in European bread wheat (Triticum aestivum L.) varieties revealed using DArT and SSR markers. Euphytica 197, 447–462. doi: 10.1007/s10681-014-1080-x
Pasam, R. K., Sharma, R., Malosetti, M., van Eeuwijk, F. A., Haseneyer, G., Kilian, B., et al. (2012). Genome-wide association studies for agronomical traits in a world wide spring barley collection. BMC Plant Biol. 12:16. doi: 10.1186/1471-2229-12-16
Piffanelli, P., Ramsay, L., Waugh, R., Benabdelmouna, A., D’Hont, A., Hollricher, K., et al. (2004). A barley cultivation-associated polymorphism conveys resistance to powdery mildew. Nature 430, 887–891. doi: 10.1038/nature02781
Price, A. L., Patterson, N. J., Plenge, R. M., Weinblatt, M. E., Shadick, N. A., and Reich, D. (2006). Principal components analysis corrects for stratification in genome-wide association studies. Nat. Genet. 38, 904–909. doi: 10.1038/ng1847
Pritchard, J. K., Stephens, M., Rosenberg, N. A., and Donnelly, P. (2000). Association mapping in structured populations. Am. J. Hum. Genet. 67, 170–181. doi: 10.1086/302959
R Development Core Team (2012). R: A Language and Environment for Statistical Computing. Vienna: R Foundation for Statistical Computing.
Rajala, A., Peltonen-Sainio, P., Jalli, M., Jauhiainen, L., Hannukkala, A., Tenhola-Roininen, T., et al. (2016). One century of Nordic barley breeding: nitrogen use efficiency, agronomic traits and genetic diversity. J. Agric. Sci. 155, 582–598. doi: 10.1017/S002185961600068X
Ramsay, L., Comadran, J., Druka, A., Marshall, D. F., Thomas, W. T., Macaulay, M., et al. (2011). INTERMEDIUM-C, a modifier of lateral spikelet fertility in barley, is an ortholog of the maize domestication gene TEOSINTE BRANCHED 1. Nat. Genet. 43, 169–172. doi: 10.1038/ng.745
Rostoks, N., Ramsay, L., MacKenzie, K., Cardle, L., Bhat, P. R., Roose, M. L., et al. (2006). Recent history of artificial outcrossing facilitates whole-genome association mapping in elite inbred crop varieties. Proc. Natl. Acad. Sci. U.S.A. 103, 18656–18661. doi: 10.1073/pnas.0606133103
Schönfeld, M., Ragni, A., Fischbeck, G., and Jahoor, A. (1996). RFLP mapping of three new loci for resistance genes to powdery mildew (Erysiphe graminis f. sp. hordei) in barley. Theor. Appl. Genet. 93, 48–56. doi: 10.1007/BF00225726
Semagn, K., Babu, R., Hearne, S., and Olsen, M. (2014). Single nucleotide polymorphism genotyping using Kompetitive Allele Specific PCR (KASP): overview of the technology and its application in crop improvement. Mol. Breed. 33, 1–14. doi: 10.1007/s11032-013-9917-x
Stich, B., and Melchinger, A. E. (2009). Comparison of mixed-model approaches for association mapping in rapeseed, potato, sugar beet, maize, and Arabidopsis. BMC Genomics 10:94. doi: 10.1186/1471-2164-10-94
Tabangin, M. E., Woo, J. G., and Martin, L. J. (2009). The effect of minor allele frequency on the likelihood of obtaining false positives. BMC proc. 3:S41. doi: 10.1186/1753-6561-3-S7-S41
Thomas, W., Baird, E., Fuller, J., Lawrence, P., Young, G., Russell, J., et al. (1998). Identification of a QTL decreasing yield in barley linked to Mlo powdery mildew resistance. Mol. Breed. 4, 381–393. doi: 10.1023/A:1009646115967
Venables, W. N., and Ripley, B. D. (2002). Modern Applied Statistics with S. Berlin: Springer. doi: 10.1007/978-0-387-21706-2
Wei, F., Gobelman-Werner, K., Morroll, S. M., Kurth, J., Mao, L., Wing, R., et al. (1999). The Mla (powdery mildew) resistance cluster is associated with three NBS-LRR gene families and suppressed recombination within a 240-kb DNA interval on chromosome 5S (1HS) of barley. Genetics 153, 1929–1948.
Yao, C., Wu, Y., Nie, H., and Tang, D. (2012). RPN1a, a 26S proteasome subunit, is required for innate immunity in Arabidopsis. Plant J. 71, 1015–1028. doi: 10.1111/j.1365-313X.2012.05048.x
Yu, D., Li, X., Zhao, X., Du, C., Chen, J., Li, C., et al. (2016). RPN1a negatively regulates ABA signaling in Arabidopsis. Plant Physiol. Biochem. 108, 279–285. doi: 10.1016/j.plaphy.2016.06.012
Keywords: Blumeria graminis f. sp. hordei, mlo, GWAS, Hordeum vulgare L., linkage disequilibrium, plant breeding, resistance
Citation: Bengtsson T, Åhman I, Manninen O, Reitan L, Christerson T, Due Jensen J, Krusell L, Jahoor A and Orabi J (2017) A Novel QTL for Powdery Mildew Resistance in Nordic Spring Barley (Hordeum vulgare L. ssp. vulgare) Revealed by Genome-Wide Association Study. Front. Plant Sci. 8:1954. doi: 10.3389/fpls.2017.01954
Received: 01 August 2017; Accepted: 30 October 2017;
Published: 14 November 2017.
Edited by:
Elena Prats, Consejo Superior de Investigaciones Científicas (CSIC), SpainReviewed by:
Meixue Zhou, University of Tasmania, AustraliaThomas Miedaner, University of Hohenheim, Germany
Copyright © 2017 Bengtsson, Åhman, Manninen, Reitan, Christerson, Due Jensen, Krusell, Jahoor and Orabi. This is an open-access article distributed under the terms of the Creative Commons Attribution License (CC BY). The use, distribution or reproduction in other forums is permitted, provided the original author(s) or licensor are credited and that the original publication in this journal is cited, in accordance with accepted academic practice. No use, distribution or reproduction is permitted which does not comply with these terms.
*Correspondence: Therése Bengtsson, dGhlcmVzZS5iZW5ndHNzb25Ac2x1LnNl
†Present address: Therese Christerson, Alfahills Gård, Asmundtorp, Sweden