 Jian Guo1†
 Ke Cao1†
 Yong Li1
 Jia-Long Yao2
 Cecilia Deng2Qi Wang1Gengrui Zhu1Weichao Fang1Changwen Chen1Xinwei Wang1Liping Guan1Tiyu Ding1Lirong Wang1*
- 1The Key Laboratory of Biology and Genetic Improvement of Horticultural Crops (Fruit Tree Breeding Technology), Ministry of Agriculture, Zhengzhou Fruit Research Institute, Chinese Academy of Agricultural Sciences, Zhengzhou, China
- 2The New Zealand Institute for Plant & Food Research Limited, Auckland, New Zealand
Fruit shape is an important external characteristic that consumers use to select preferred fruit cultivars. In peach, the flat fruit cultivars have become more and more popular worldwide. Genetic markers closely linking to the flat fruit trait have been identified and are useful for marker-assisted breeding. However, the cellular and genetic mechanisms underpinning flat fruit formation are still poorly understood. In this study, we have revealed the differences in fruit cell number, cell size, and in gene expression pattern between the traditional round fruit and modern flat fruit cultivars. Flat peach cultivars possessed significantly lower number of cells in the vertical axis because cell division in the vertical direction stopped early in the flat fruit cultivars at 15 DAFB (day after full bloom) than in round fruit cultivars at 35 DAFB. This resulted in the reduction in vertical development in the flat fruit. Significant linear relationship was observed between fruit vertical diameter and cell number in vertical axis for the four examined peach cultivars (R2 = 0.9964) at maturation stage, and was also observed between fruit vertical diameter and fruit weight (R2 = 0.9605), which indicated that cell number in vertical direction contributed to the flat shape formation. Furthermore, in RNA-seq analysis, 4165 differentially expressed genes (DEGs) were detected by comparing RNA-seq data between flat and round peach cultivars at different fruit development stages. In contrast to previous studies, we discovered 28 candidate genes potentially responsible for the flat shape formation, including 19 located in the mapping site and 9 downstream genes. Our study indicates that flat and round fruit shape in peach is primarily determined by the regulation of cell production in the vertical direction during early fruit development.
Introduction
Fruit development is mainly controlled by two processes, cell division and cell expansion (Coome, 1976) that directly affect fruit cell number, cell size, and fruit size. The pattern of fruit cell distribution and expansion further affects fruit shape (Chusreeaeom et al., 2014). In tomato, various fruit shape mutants have been collected and used for map-based cloning of the gene underpinning the mutant phenotype. These genes include FASCIATED (FAS) (Cong et al., 2008) and, LOCULE NUMBER (LC) (Munos et al., 2011) conferring flat fruit by increasing locule numbers; SUN (Xiao et al., 2008) and OVATE (Liu et al., 2002) causing fruit elongation (Rodriguez et al., 2011) by increasing and reducing cell numbers in the vertical and transversal direction of the fruit, respectively (Wu et al., 2011). A novel tomato mutant (Slelf1) exhibits elongated fruit shape caused by increased cell layers in the proximal region of the ovary (Chusreeaeom et al., 2014). In peach, cell number is the controlling factor in fruit size between small- and large-fruited peach cultivars (Scorzal et al., 1991). Cell number is one of the most vital aspects that determine fruit development, including fruit shape and size, and has been reported in many fruit crops, such as apple (Denne, 1960), strawberry (Cheng and Breen, 1992), melon (Higashi and Hosoya, 1999), olive (Rapoport and Costagli, 2004), sweet cherry (Olmstead et al., 2007) and tomato (Bertin et al., 2003; Bertin et al., 2009).
Besides cell proliferation, cell expansion also plays an important role in fruit development. Cell expansion often occurs during late stages of fruit development when cell division has completed (Gillaspy et al., 1993). In apple, fruit size is positively correlated to fruit cell size because cultivars with large fruit has much larger fruit cell size than wild small fruit accessions (Yao et al., 2015) and a sport mutation has enlarged fruit by enhancing fruit cell expansion (Malladi and Hirst, 2010). In addition to fruit trees, grain size and shape have also been found to be controlled by WTG1 (WIDE AND THICK GRAIN 1) through regulating cell expansion (Huang et al., 2017). Positive relationships between fruit size and cell size were reported among five fruit genotypes in apples (Harada et al., 2005), as well as in tomatoes (Cheniclet et al., 2005). However, there are cases where fruit size is not strongly associated with fruit cell size but with cell number in peach (Scorzal et al., 1991), strawberry (Cheng and Breen, 1992), pear (Zhang et al., 2006) and sweet cherry (Olmstead et al., 2007). Therefore, the cellular mechanisms controlling fruit development vary in different fruit crops. Investigating the cellular differences between flat and round peaches will enhance our understanding of fruit development.
Fruit shape is critical to the appearance of the fruit and affects the marketability of fruit crops. For peach (Prunus persica), the typical fruit shape is round, but more and more peach cultivars producing saucer-shaped fruit have been bred in recent years (Iglesias, 2013). The flat peaches (P. persica var. platycarpa) are called ‘Pantao’ in China and ‘Saturn peach’ or ‘donut peach’ in western countries. The flat fruit is a mutant of round fruit and is controlled by a single dominant gene as first described by Lesley (1940). This gene is mapped to the distal part of chromosome 6 (Lesley, 1940; Dirlewanger et al., 1998, 2006; Picañol et al., 2013; Micheletti et al., 2015; Cao et al., 2016; López-Girona et al., 2017). Two different candidate genes have been suggested for controlling this trait (Cao et al., 2016; López-Girona et al., 2017), indicating that further work is required to unequivocally indentify this gene.
For peaches, the cellular basis of fruit shape variations remains unknown, although the cellular basis of different fruit size is determined (Scorzal et al., 1991). Transcriptomic analysis has not yet been used to filter flat peach candidate genes although it is an effective method to screen the candidate genes at a genome wide scale (Zhou et al., 2014; Kanjana et al., 2016; Czemmel et al., 2017; Estrada-Johnson et al., 2017; Liu et al., 2017; Xu et al., 2017). In the present study, we aimed to illustrate the differences in fruit cell number and size, and in gene expression pattern between flat and round fruit by using histological sections and transcriptomic analyses. We found that peach fruit shape was primarily determined by the difference in cell number along the vertical direction of the fruit and identified 28 differentially expressed genes (DEGs), including 19 DEGs within the map region of flat fruit locus and 9 having potential functions in cell number regulation in the whole genome. These results would guide further studies to identify the flat shape gene and improve our understanding of fruit development in peach, as well as in other fruit trees.
Materials and Methods
Plant Materials and Sample Collection
Four peach cultivars were selected in this study, including two round ones ‘Zhong Nong Jin Hui’ (JH) and ‘Zhong Tao Hong Yu’ (HY), and two heterozygous flat ones ‘Xin Hong Pan Tao’ (XH) and ‘Zao Huang Pan Tao’ (ZH). They are widely cultivated in China with similar harvesting date but not directly related, thus can represent for flat and round peaches (Supplementary Figure S1). All trees used in this study were grown at Zhengzhou Fruit Research Institute, CAAS. Fruit diameters (including vertical diameter and cheek diameter) of six fruit per cultivar were measured from full bloom to fruit maturity at 0, 10, 15, 20, 25, 30, 35, 40, 45, 55, 65, and 75 DAFB (day after full bloom), using a digital caliper. Fruit samples at 0 DAFB were collected from almost 200 full bloom flowers by removing the petals and styles. Vertical diameters were measured from the top to bottom of the fruit in the vertical axis and cheek diameters were between the cheeks of peach. In addition, six fruit per cultivar were used for microscopy analysis to determine histological differences. For microscopy, fruit samples were collected at 0, 15, 25, 35, 55, and 65 DAFB and fixed in FAA (75% ethyl alcohol, 5% formalin, 5% acetic acid), then stored at room temperature until further analysis. To measure cell number and cell size of the two different fruit shape types, we selected regions in vertical sections from the middle of the fruit kernel to the top in the vertical direction, and the middle of the fruit kernel to fruit cheek side in transversal direction (Figure 1a). Because of fruit stone hardening, samples prepared for microscopy analyses contained exocarp, mesocarp, and endocarp before fruit pit hardening (35 DAFB) and exocarp, mesocarp merely for the late two periods. For comparative transcriptome analysis, HY and ZH fruit samples were collected at 0, 15, and 65 DAFB for RNA sequencing with three biological replicates.
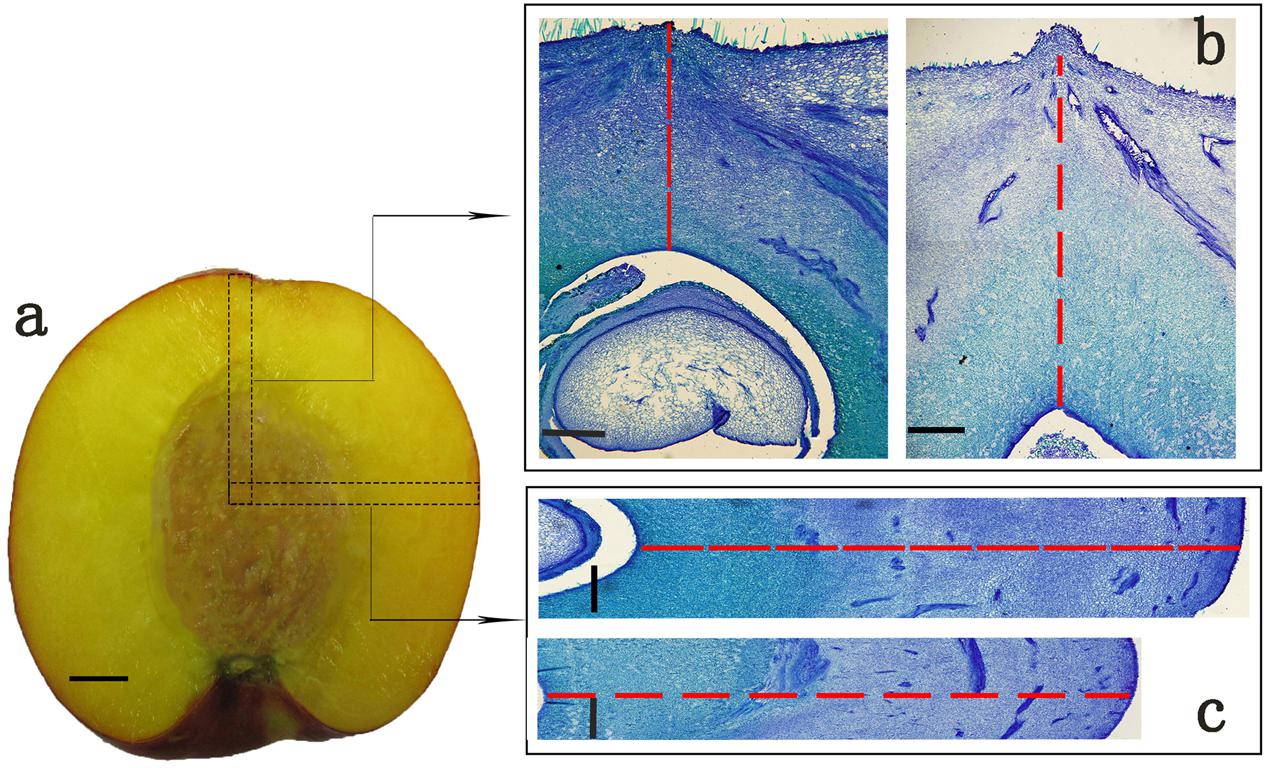
FIGURE 1. The typical target regions of peach fruit for microscopy analysis. (a) Fruit parts marked with black dotted boxes in vertical and transversal direction were selected for paraffin section analysis. (b,c) Are paraffin sections corresponding to the regions in transverse and vertical direction. (b) Stands for sections in vertical direction of flat (left) and round (right) shaped peach, while (c) stands for sections in transverse direction of flat (up) and round (down) shaped peach. Cell number was calculated along the red dashed lines in one straight single-cell line in (b,c). Cells calculated in this way were regarded as cell number in vertical or transversal diameter. Scale bar = 1 cm (a), and 500 μm (b,c).
Paraffin Section Analysis
Samples were removed from FAA and rinsed thoroughly in deionized water. Then, the samples were dehydrated using gradient ethanol, transparentized with xylene, and embedded in wax finally. For determining the cellular basis of flat and round shape formation, we focused on the vertical and transversal fruit development. For early fruit samples, section thickness was from 10 to 15 μm, whereas that for fruit samples collected at late development stages was from 15 to 30 μm. All sections were rehydrated and stained using aqueous toluidine blue (pH 7.0) (Yao et al., 2015). Images were captured with a light microscope (Olympus) fitted with a camera (DP71; Olympus).
Analysis of Cell Number and Area
To determine the cell number in the target regions (Figures 1b,c), we counted all cells using a light microscope. Six samples per cultivar were counted for each development stage. The cells were counted one by one along vertical or transversal axis through the eyepiece of a light microscope. Here, we provided a model for cell number calculating. The cells along the red dotted line in Figures 1b,c were counted in one straight single-cell line direction. The cell number that calculated in this way was regarded as cell number in vertical or transversal axis in this study. Cell area measurements were made using the ImageJ software1. Because of pit hardening, the target regions of early fruit contained parts of endocarp, whereas regions of late development fruit did not. Therefore, the cell number of sections of the late fruit developmental period was calculated by adding the cell number of endocarp for each cultivar.
Statistical Analysis
For microscopy analysis, the data was subjected to analysis of variance using the SAS general linear model procedure with the variance for subsamples used as the error term (SAS Institute, Cary, NC, United States). The SAS correlation procedure was also used for other appropriate analysis.
Validation of Flat Shape Genetic Marker
To validate the candidate gene for flat shape, the DNA marker PC4 was amplified using primer pairs FlatIn_F and IndelS_R as described in a previously published paper (López-Girona et al., 2017) from 72 peach cultivars that included 42 heterozygous and 1 homozygous flat cultivar which aborted at early fruit development, and 30 round cultivars (Supplementary Table S1). The 3730XLDNAanalyzer equipment (ABI, United States) was used for genotyping.
Total RNA Extraction
Total RNA was extracted from 18 peach samples that represent for three biological replicates of two peach cultivars at three development stages (named HY1-1, HY1-2, HY1-3, HY2-1, HY2-2, HY2-3, HY3-1, HY3-2, HY3-3, ZH1-1, ZH1-2, ZH1-3, ZH2-1, ZH2-2, ZH2-3, ZH3-1, ZH3-2, ZH3-3), using the RNAprep Pure Plant Kit (Tiangen, Beijing). RNA integrity was confirmed by 1% agarose gel electrophoresis. After digestion with DNase I at 37°C for 30 min to remove DNA residue, RNA quality and concentration were measured using an the NanoPhotometer spectrophotometer (Thermo, United States).
Library Construction and Transcriptome Sequencing
Total RNA of 20 μg from each of the 18 RNA samples was sent to Novogene (Beijing, China) for construction of RNA-seq libraries and sequencing. The mRNA was purified from the total RNA using the Oligotex mRNA Midi Kit (Qiagen, Beijing), and assessed for quality using the Agilent Technologies 2100 Bioanalyzer (Agilent, United States). The mRNA was then broken into short fragment (approximately 300 bp). First and second strand complementary DNA (cDNA) was synthesized using a cDNA Synthesis System kit (TOYOBO, Japan) using random hexamer-primer, following the manufacturer’s protocol. Then double-strand cDNA were purified and adapters were ligated to the short fragments. The constructed RNA libraries were sequenced on the Illumina HiSeqTM 2000 platform in paired-end (PE) mode.
RNA-Seq Data Analysis
Reference peach genome V1.02 and annotation files were downloaded from GDR website3. The index of reference genome was generated by hisat2-build script. RNA-seq data was filtered to remove the low-quality reads using FASTX toolkit4 based on the Q20 value per base. Cleaned reads were mapped to the reference peach genome using Hisat2 software (Kim et al., 2015). The alignments were compressed and sorted into bam files using Samtools (Li et al., 2009). Based on the alignments, transcript abundances were estimated and transcript assembly was performed using the Stringtie (Pertea et al., 2015) program. DEG analysis was carried out using the R package ballgown (Frazee et al., 2015).
Validation of RNA-Seq Data by Quantitative RT-PCR
The expression level of selected DEGs identified from RNA-seq data were validated by qRT-PCR using the cDNA samples used for RNA-Seq library construction. The primer pairs (Supplementary Table S2) were designed with primer-blast program from NCBI5. The qRT-PCR was performed by Roche LightCycler480 with the following procedure: 95°C for 5 min, followed by 45 cycles at 95°C for 10 s, 60°C for 10 s and 72°C for 20 s. The house-keeping gene RP-II was used as an internal control (Cao et al., 2016). The relative expression level was calculated by the 2-ΔΔCT method (Livak and Schmittgen, 2001).
IAA Measurement in Flat and Round Peach
Plant materials used for IAA measurement were the same as materials for RNA-seq. To determine the IAA content in each sample, the HPLC-MS/MS system (HPLC, Shim-pack UFLC SHIMADZU CBM30A system6; MS, Applied Biosystems 4500 Triple Quadrupole7) analyses were carried out.
Results
Differences in Fruit Diameter and Cell Number between Flat and Round Peaches
After recording fruit vertical diameter both vertical and transverse directions, we found that vertical diameter of flat peach was much smaller than that of the round peach. This difference started from 15 DAFB and was present during entire subsequent development periods. The final vertical diameters of round shaped peaches were almost two times larger than flat ones, conferring obviously different shape phenotypes (Figure 2A). However, fruit diameter in the transversal direction was almost the same and increased at a similar speed between flat and round peaches from full bloom to fruit ripening (Figure 2B). Collectively, these data indicated that there were no significant differences between flat and round shaped peaches in fruit cheek diameter, whereas there was a difference in fruit vertical diameter.
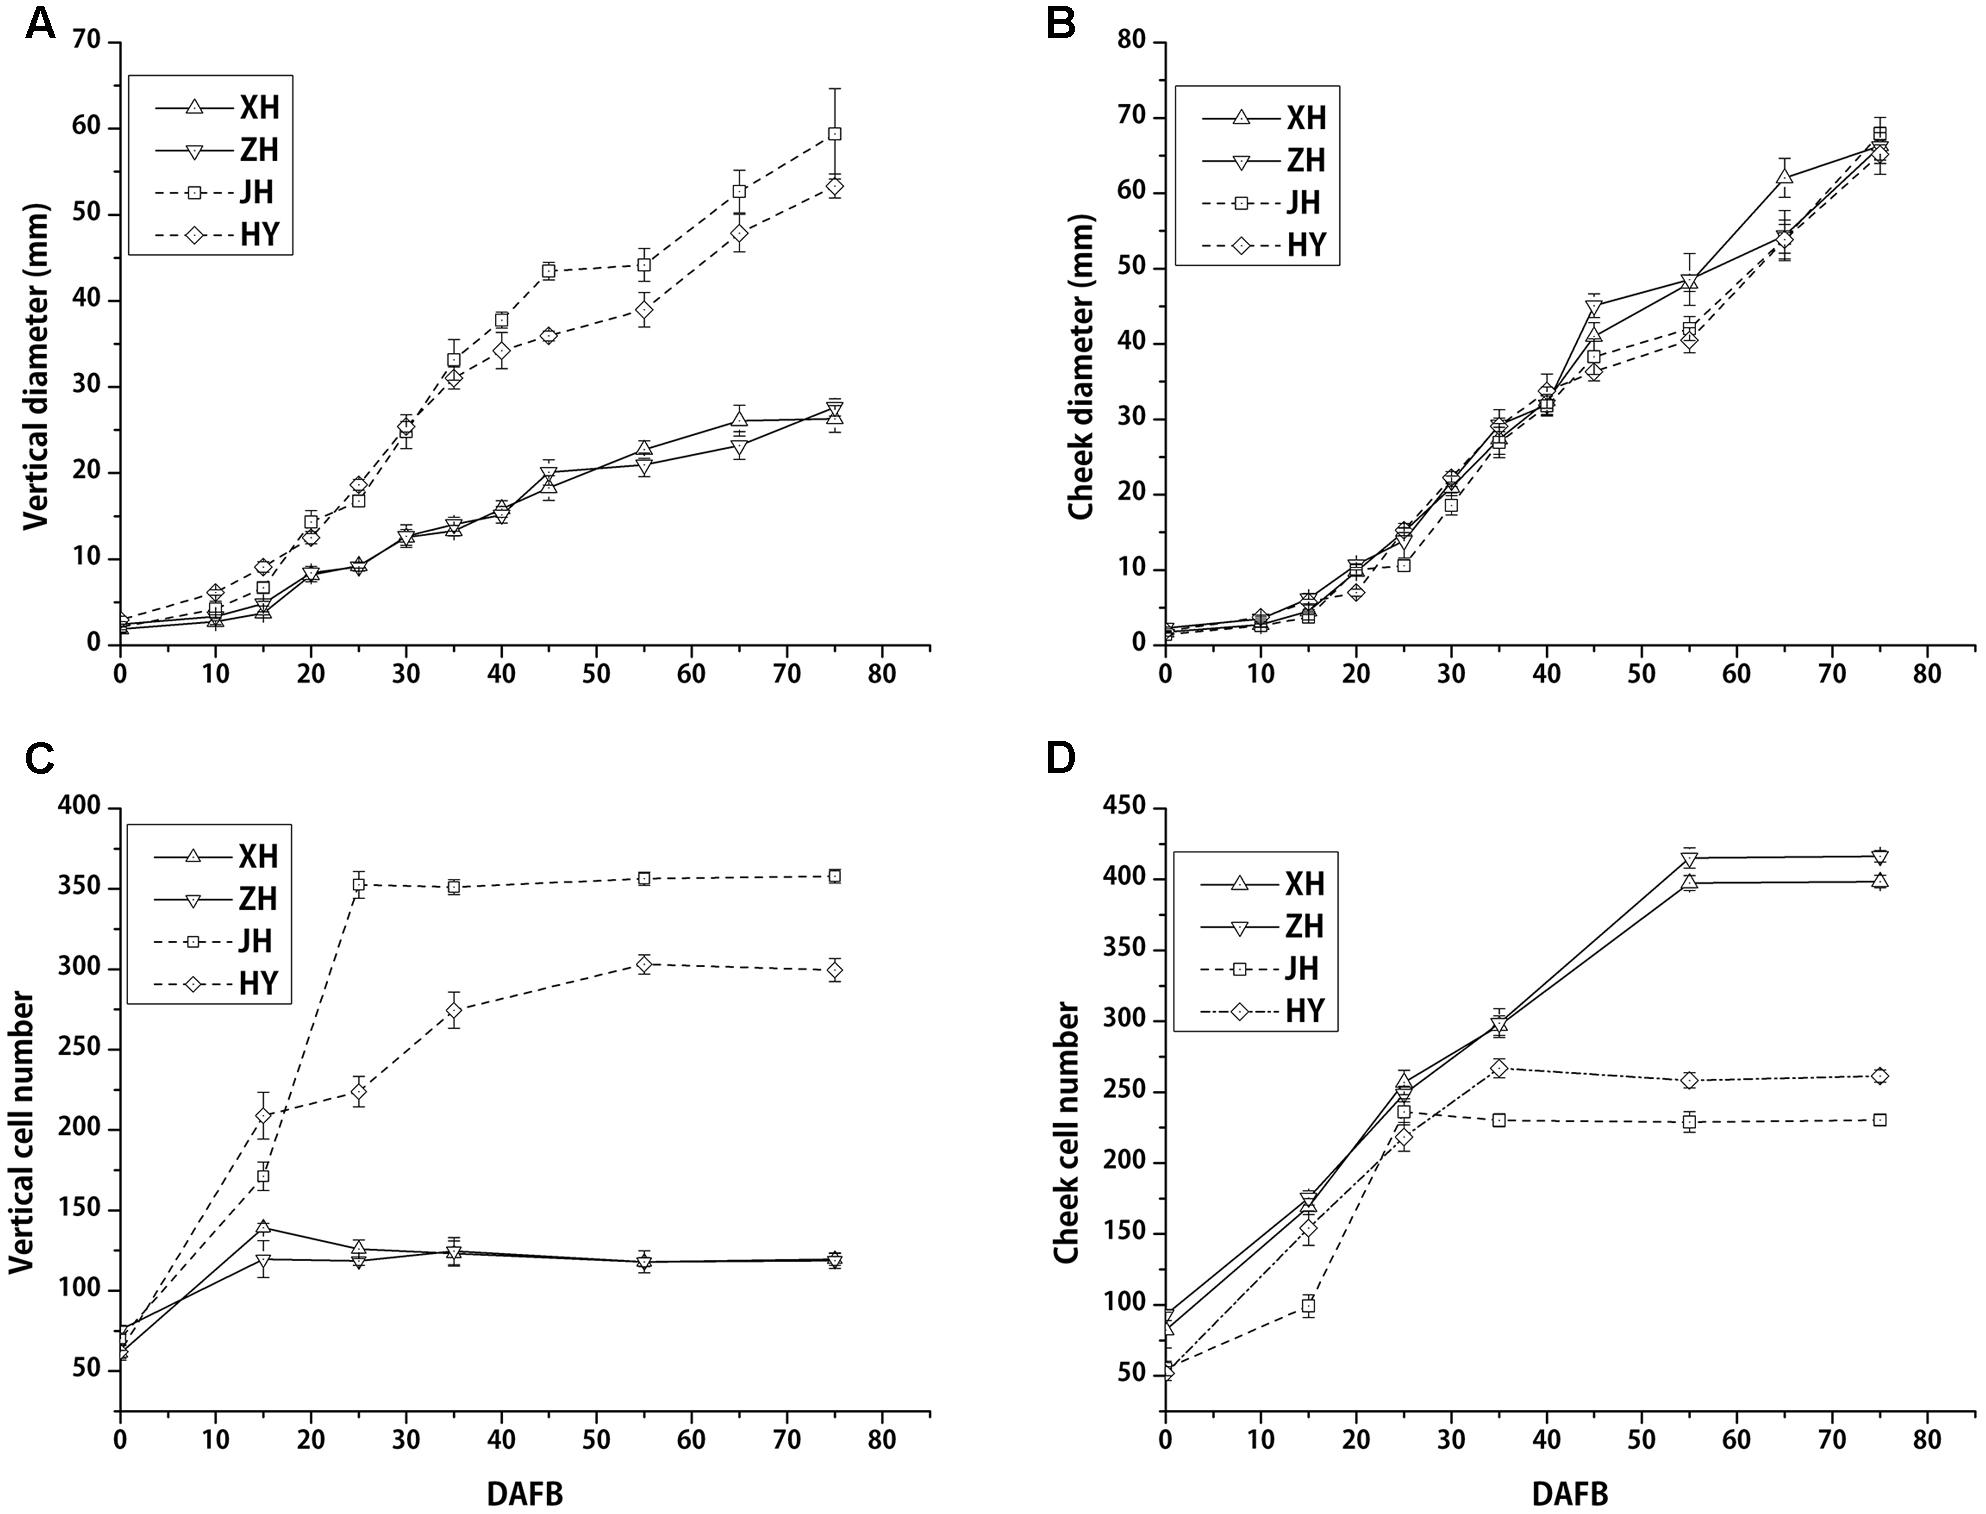
FIGURE 2. Fruit diameter and cell number among four different cultivars (two flat and two round peaches) during fruit development. Fruit vertical diameters of flat peaches are smaller than those in round ones from the early period of fruit development. Cell division in flat peaches ceases at almost 15 DAFB, while it continues in round ones until 35 DAFB (A,C). Cheek diameters are similar among flat and round peaches (B). Transversal cell numbers were higher in flat peaches than in round peaches (D). Two solid and dashed lines stand for flat and round peaches, respectively. Each data point consists six data for each cultivar (n = 6) and the bars stand for SD.
In addition, cell number were counted across the vertical and transversal axis. In the vertical axis, cell number continued to increase from 0 to 35 DAFB in the two round peach cultivars, whereas it ceased to increase at an early fruit development stage (15 DAFB) in two flat ones (Figure 2C). The final cell number for the flat peach cultivars was approximately 2 to 3 times lower than that in the round ones. In the transversal axis, cell number stopped increasing at 35 DAFB in the round peach cultivars, while it continued to increase until 55 DAFB in the flat ones, which resulted in much more cells in the flat ones in this direction (Figure 2D). Cell size of flat peach is smaller than that in round peach in transversal axis, which results in the similar fruit cheek diameter (Supplementary Figure S2). Consequently, the reduction of cell number in the vertical diameter is one important factor which resulted in the limitation of fruit vertical development in flat peach cultivars.
Correlation among Fruit Vertical Diameter, Cell Number, and Cell Size
Cell number and cell size are two vital factors that facilitate fruit development. Herein, we analyzed the relationship between fruit vertical diameter and cell number and also analyzed the relationship between vertical diameter and cell size to determine the main causes that may be responsible for variation in flat and round fruit shape at maturation stage. A relative strong linear relationship between fruit vertical diameter and cell number was observed (R2 = 0.9627) which indicated that cell number was the main factor for fruit flat shape formation (Figure 3A). However, there was no strong linear relationship between cell size and fruit vertical diameter (R2 = 0.5395) (Figure 3B), which indicated that cell size contributed almost equally to fruit development, with cell area enlargement and vertical diameter increasing synchronously. Linear regression analyses were also performed for fruit weight vs. fruit vertical or cheek diameter. Strong linear relationship was found in the analysis of final fruit weight vs. vertical diameter (R2 = 0.9035), not in fruit weight vs. transversal diameter (R2 = 0.0241) (Figures 3C,D). This observation indicated that cell number, not cell size, was the factor that controlled variation in flat fruit shape.
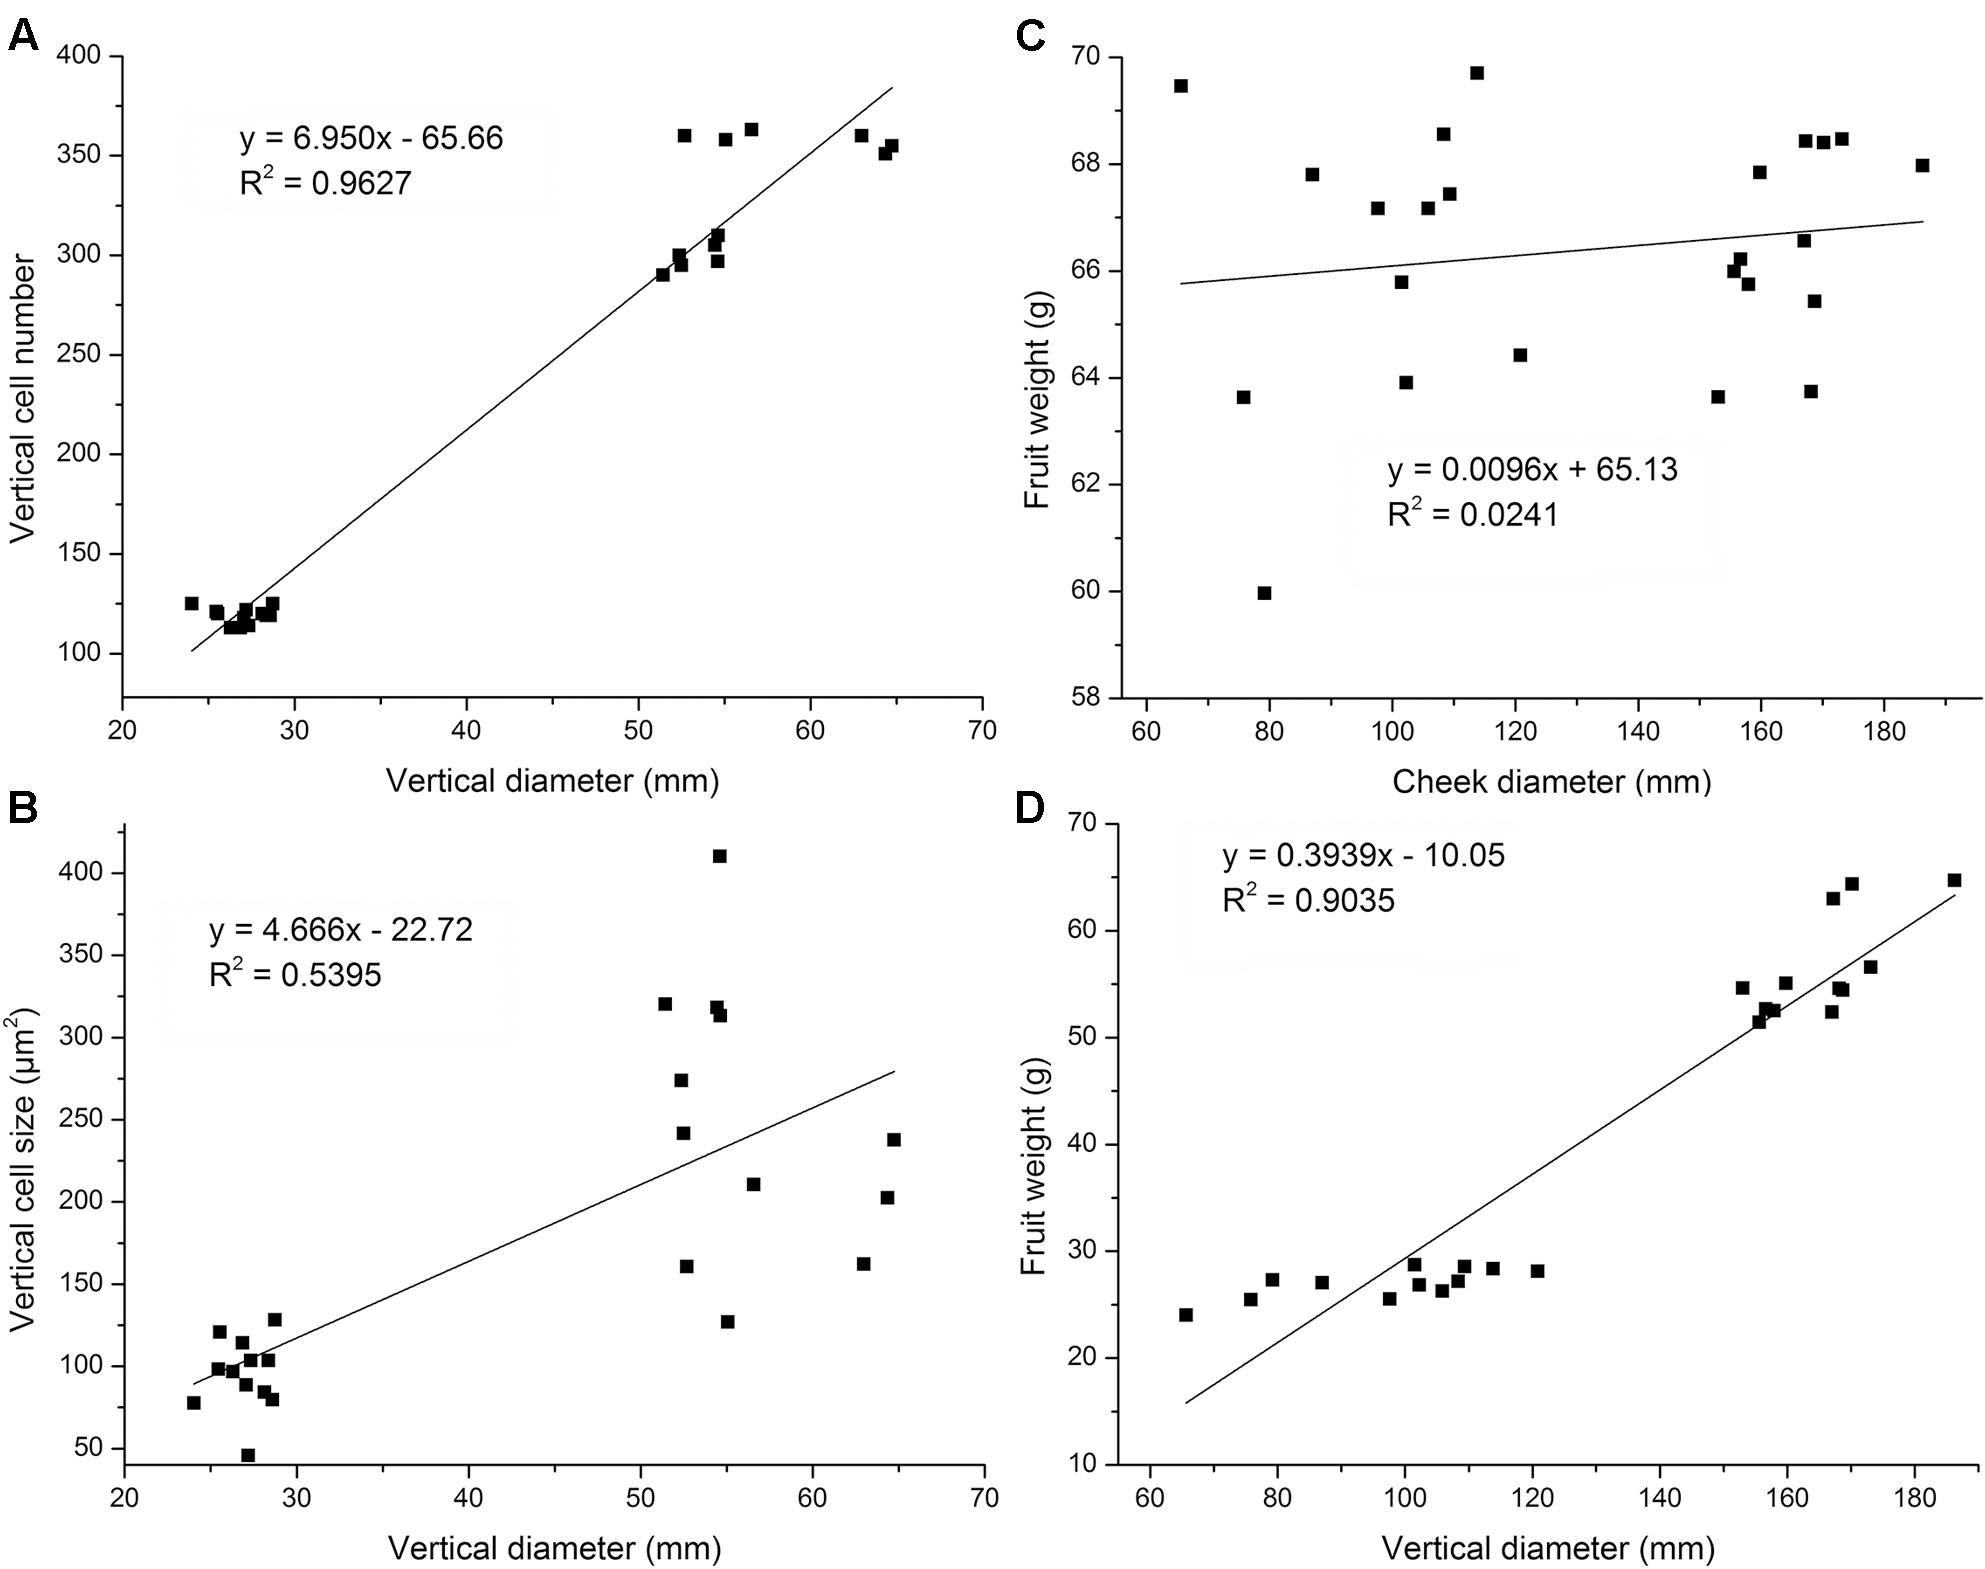
FIGURE 3. Linear regression analysis of fruit diameter, cell area, and cell number at fruit maturation stage. Linear regression analysis showed no strong linear relationship between cheek diameter and fruit weight (B) but a strong linear relationship between vertical diameter and fruit weight (R2 = 0.9627) (A). Linear regression analysis showed no linear relationship between cheek diameter and fruit weight (C) but a strong linear relationship between vertical diameter and fruit weight (R2 = 0.9035) (D). Four cultivars were used. Each cultivar was measured six times at fruit maturation stage (n = 6).
In addition, we also analyzed the relationship between final cheek diameter and cell number or cell area with the examined cultivars. There were no differences in fruit cheek diameter between flat and round peaches. In transversal axis, no strong linear relationships were observed between fruit cheek diameter and cell number, as well as fruit cheek diameter and cell area (Supplementary Figure S3), which indicated that both cell number and cell size played important roles in fruit transversal development. Collectively, these results suggested that cell size may not play a vital role in the variation in flat and round fruit shape development in the vertical direction, whereas the reduction in cell number in the flat peach may be the key factor.
Flat Shape DNA Marker
Two candidate genes for flat peach have been identified in previous studies, including ppa003772m (Cao et al., 2016) and ppa025511m (López-Girona et al., 2017). The marker in ppa003772m and ppa025511m has been verified in 474 and 178 peach accessions, respectively, with 100% accuracy rate in the previous studies (Cao et al., 2016). However, the marker in ppa025511m did not show a 100% association with flat fruit phenotype in this study when 72 peach cultivars were genotyped using the same primers as described in López-Girona et al. (2017). The genotype of 18 cultivars were not consistent with their fruit shape phenotype, including 14 of the 42 heterozygous flat cultivars, one homozygous flat peach (aborting at early fruit development) and 3 of the 30 round cultivars (Supplementary Table S1). The association rate was only 75%.
Overview of RNA-Seq Data
A total of 67.4 Gb cleaned data was generated from the 18 cDNA libraries. The minimum number of reads per library was 38.7 million for ZH2-3 and the maximum number was 50.1 million for ZH2-2. The read length was 150 bp. Approximate 90% of the reads were mapped to the pear reference genome V1.08 (Table 1).
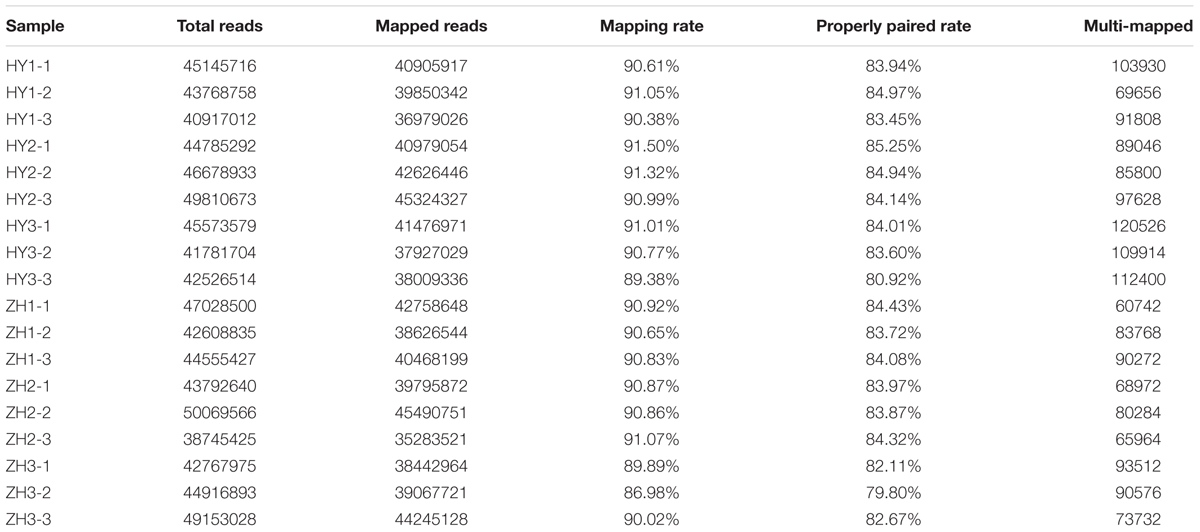
TABLE 1. Mapping of RNA-seq reads from flat and round peaches at three developmental stages (0, 15, and 65 DAFB), against the peach reference genome.
DEGs Analysis
Differential expression test was done between flat and round peach cultivars at three developmental stages (0, 15, and 65 DAFB) and 4165 DEGs were identified (Supplementary Table S3). There were 3231, 1049, 541genes identified as DEGs at the three developmental stages between flat and round peach with P-value < 0.05 (Figure 4A). Comparing the three developmental stages, much more genes (3231) were differentially expressed at full bloom date when the difference in fruit shape started to emerge. There were less DEGs at 65 DAFB between flat and round peach when fruits were close to maturity. In addition, we also analyzed DEGs among different stages in the same cultivar and compared them with each other in order to find some common DEGs. There were 1458 DEGs in HY1_vs_HY2, 593 in HY2_vs_HY3, 1036 in HY1_vs_HY3, 1465 in ZH1_vs_ZH2, 442 in ZH2-vs_ZH3, and 1141 in ZH1_vs_ZH3 (Figures 4B,C). And there were no common DEGs among them.
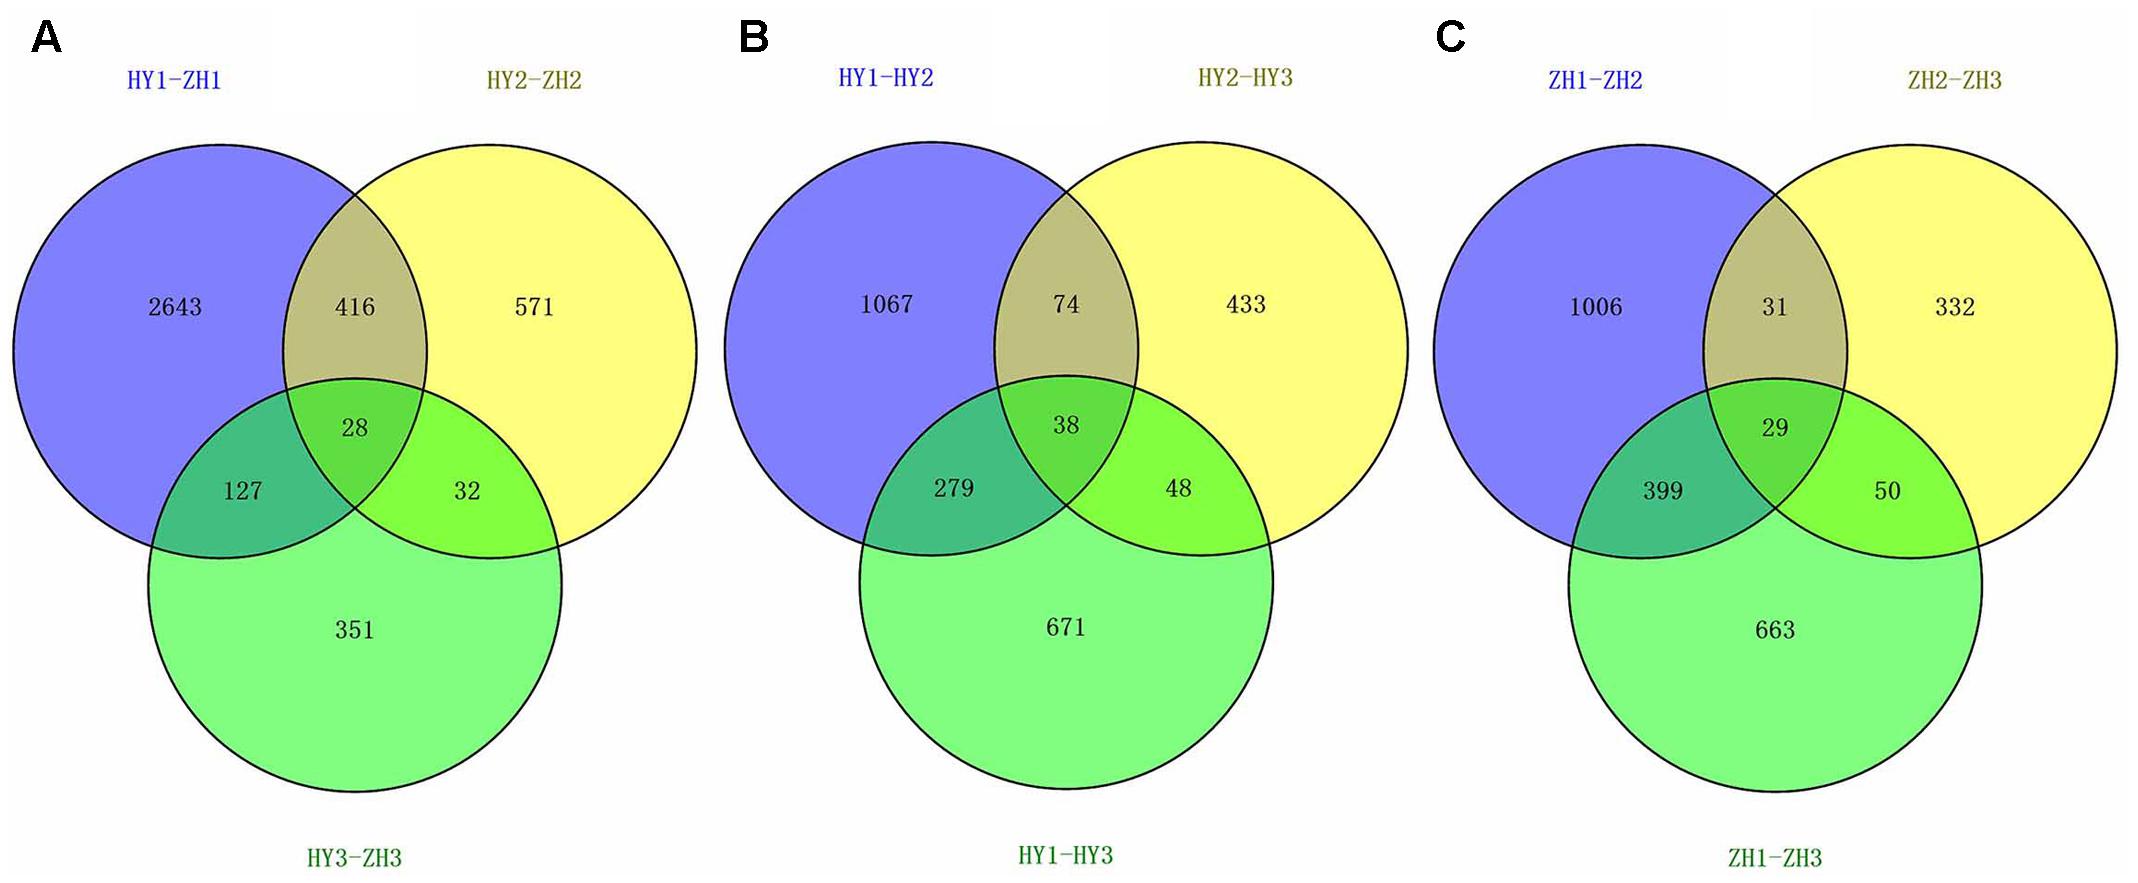
FIGURE 4. The venn diagrams of DEGs. (A) Venn diagram for HY1-ZH1, HY2-ZH2, and HY3-ZH3. (B) Venn diagram for HY1-HY2, HY1-HY3, and HY2-HY3. (C) V Venn diagram for ZH1-ZH2, ZH1-ZH3, and ZH2-ZH3.
Functional Annotation of DEGs at 0 DAFB
To identify genes important to fruit shape, we annotated the DEGs at 0 DAFB because full bloom is the earliest stage showing differences in cell number between flat and round fruits, thus is the critical time for identification of relevant genes. Based on GO (gene ontology) annotation, all the DEGs were clarified into three main categories, including cellular component, molecular function, and biological process (Figure 5). Most of DEGs belonged to cellular component and biological process, with each category possessing 13 and 17 terms. The most common terms were cellular process and processes related to cells in the biological process category. Genes related to cell cycle, cell proliferation, cell death, and cell wall biogenesis were also enriched. In the cellular component category, the main terms were cell and cell part. Overall, lots of DEGs were enriched in cell-related processes.
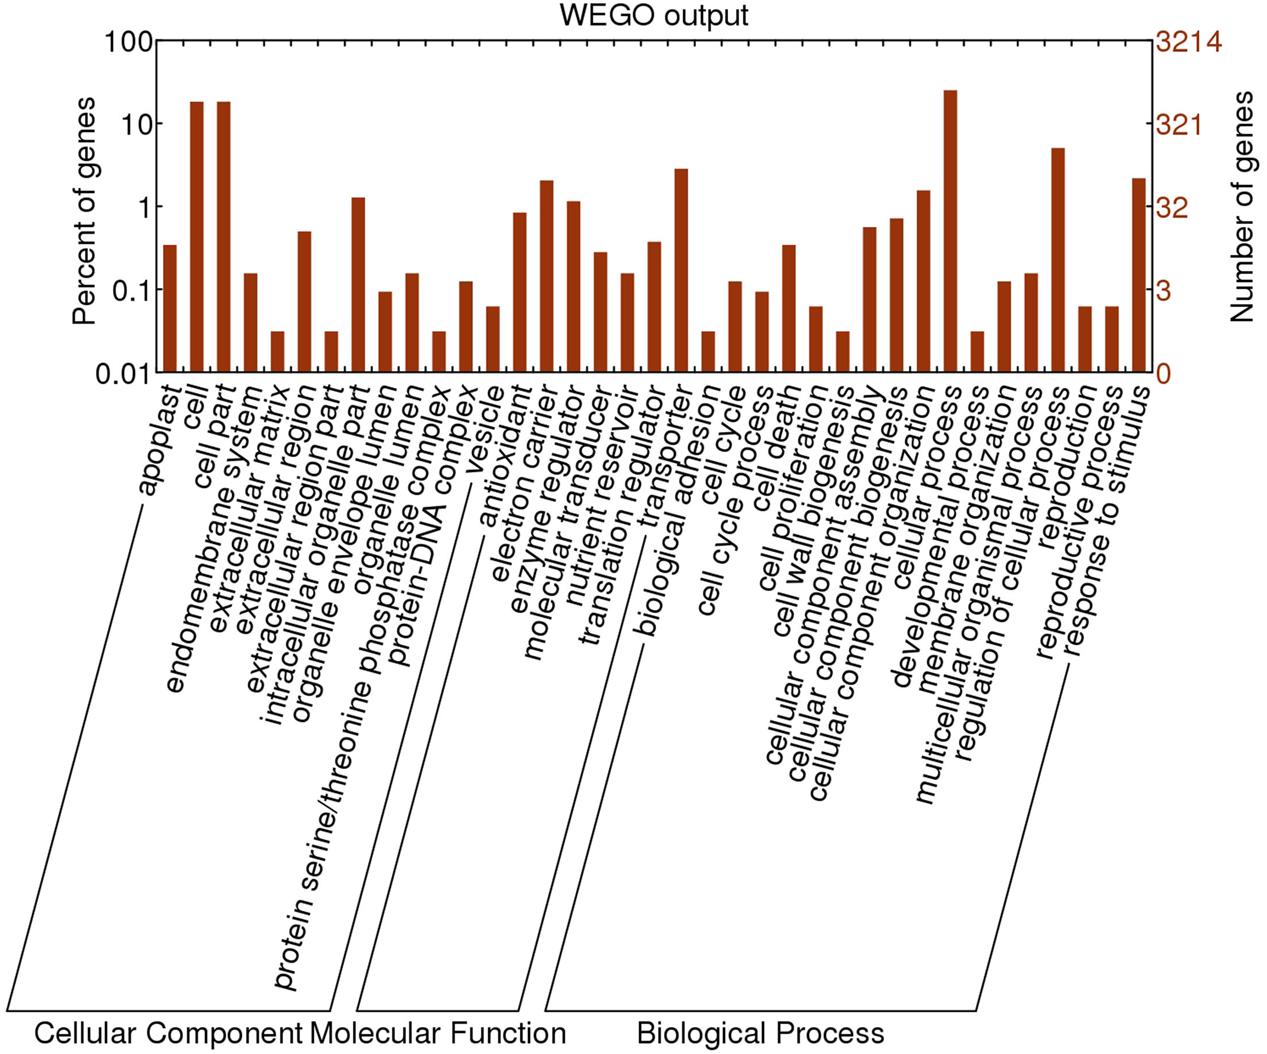
FIGURE 5. Gene ontology annotation of DEGs identified in comparative transcriptome analysis between flat and round peaches at 0 DAFB.
Selection of Genes for Fruit Shape Variation
Using the FPKM (fragments per kilo-base per million mapped reads) value of 4165 DEGs, the heatmap was made to show relative gene expression patterns. From the heatmap (Figure 6), we found that some genes that were highly expressed in round or flat peach at 0 DAFB clustered together. The main factor leading to fruit shape variation in this study was the difference in cell number in vertical diameter between flat and round shaped fruit. Thus, genes that may be correlated with cell proliferation were further analyzed.
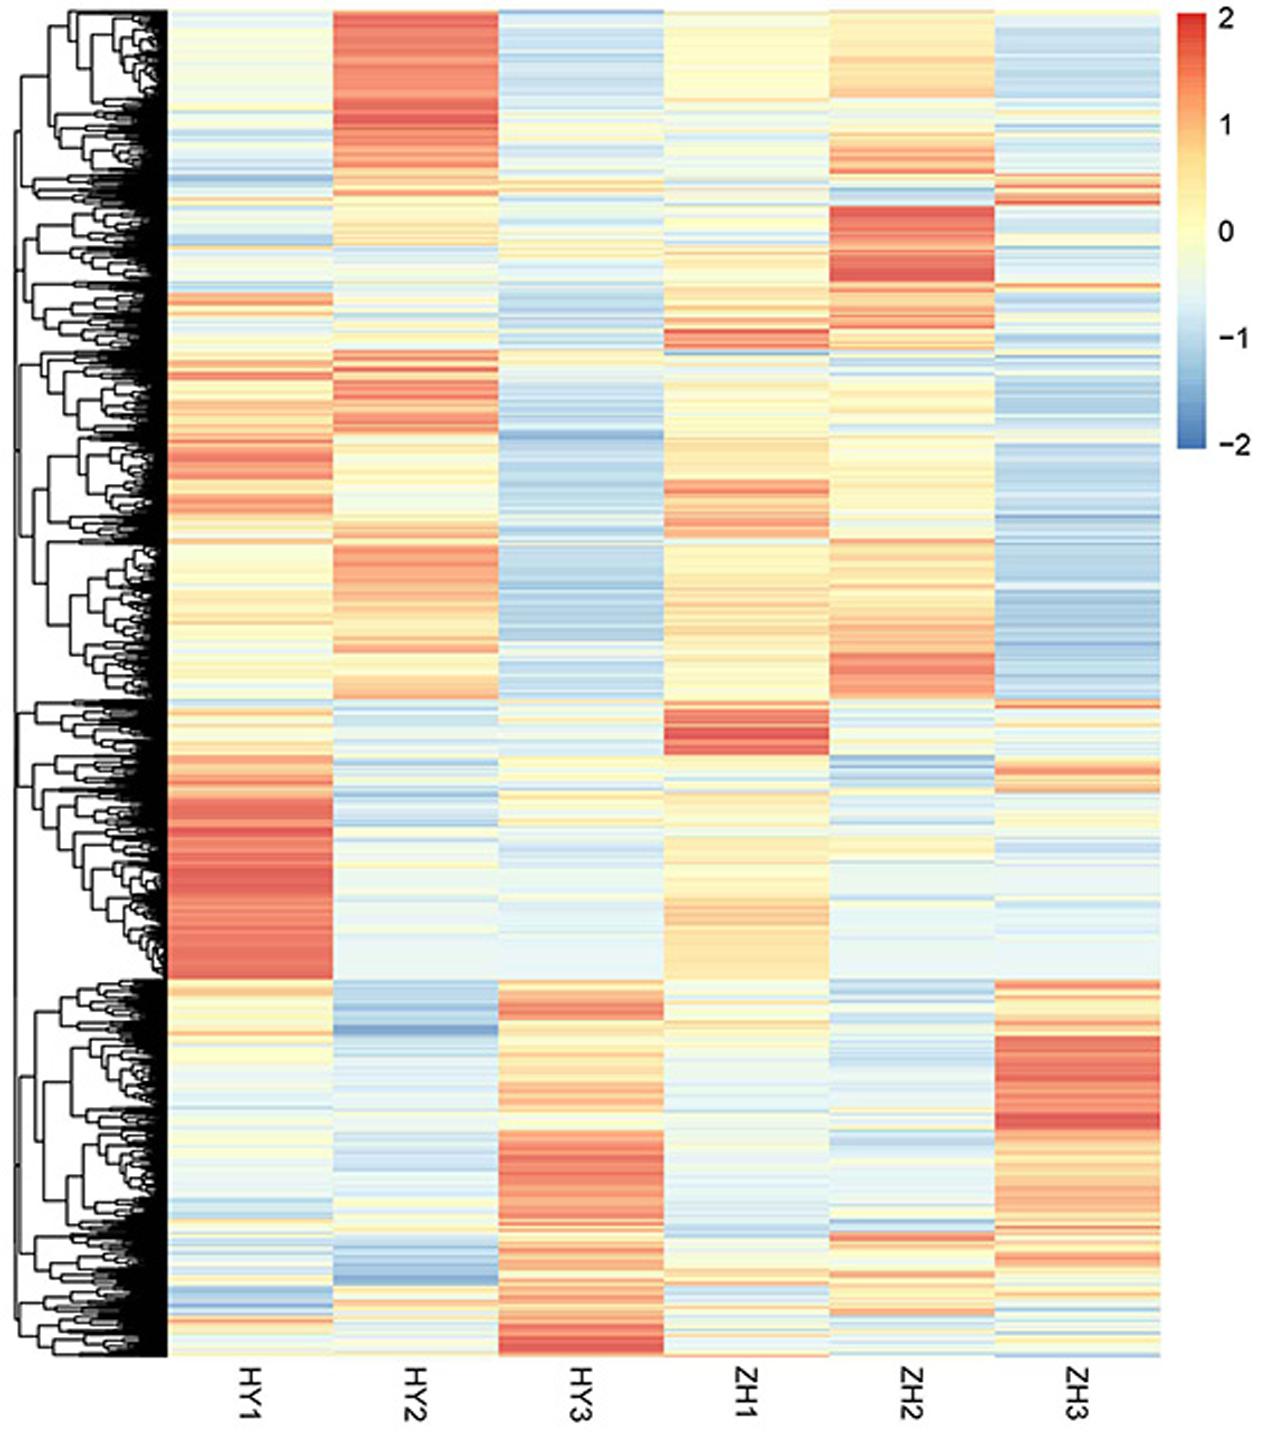
FIGURE 6. The expression level heatmap of all DEGs detected between flat and round peaches.
First, we selected 346 genes that were located within 1 Mb up- or down-stream of the main GWAS (genome wide association study) locus for fruit shape (Cao et al., 2016). Of these 346 genes, 76 were differentially expressed. According to expression pattern in the heatmap (Figure 7A), 23 DEGs were selected as candidates for the flat shape gene, including 19 highly expressed in round peach and 4 highly expressed in flat one at 0 DAFB.
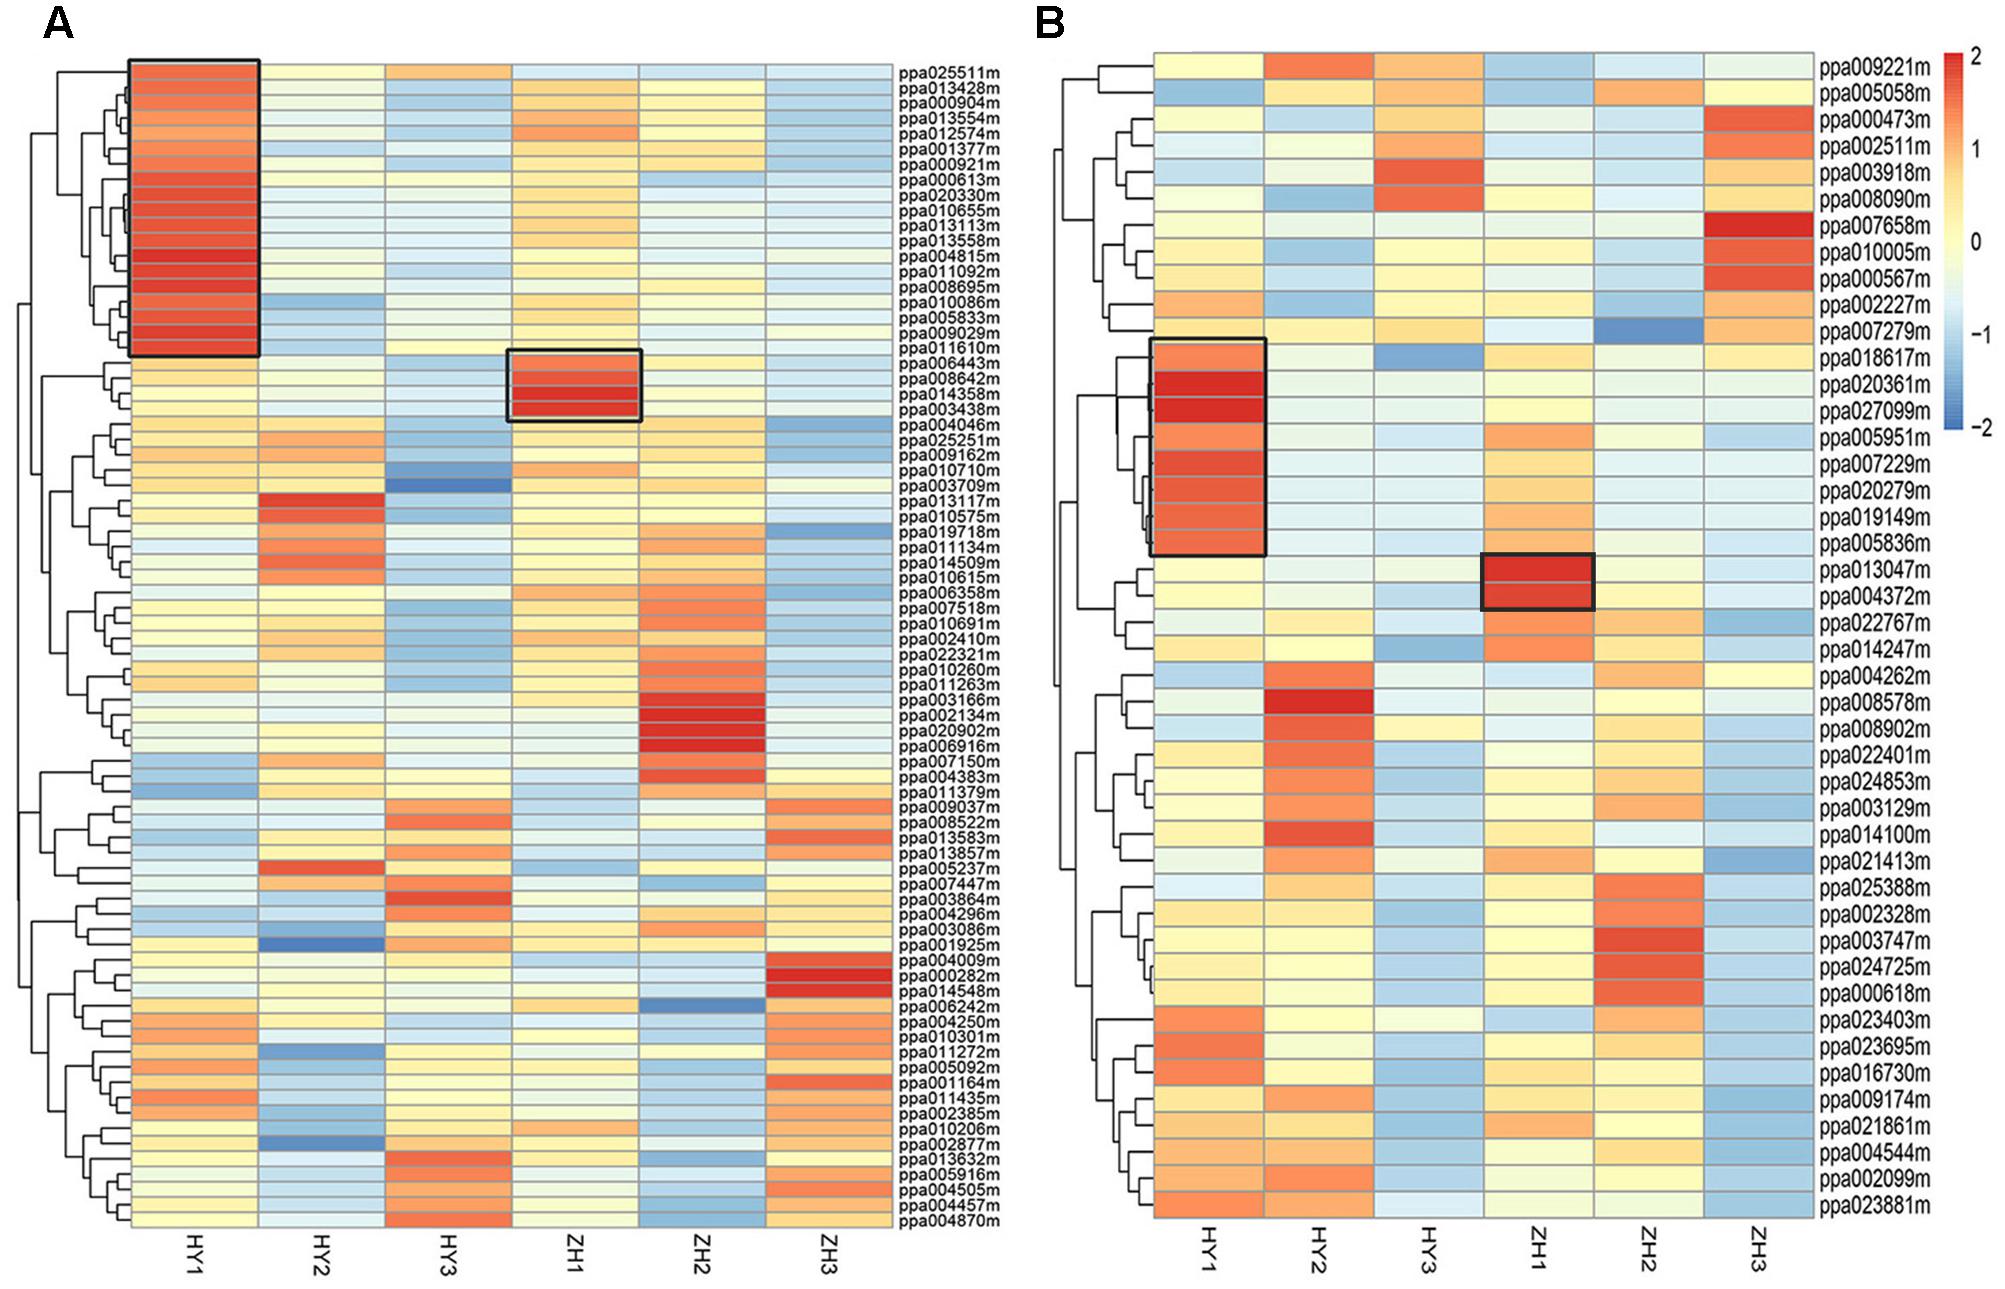
FIGURE 7. The expression level heatmap of selected DEGs. DEGs located within one Mega-base up- or down-stream of ppa003772m (A) and DEGs associated with cell number (B). Genes associated with cell number were selected from GDR Prunus persica Pathway Search ( https://www.rosaceae.org/). Black box shows the genes that had higher expression levels in round or flat peach and had higher expression levels at early fruit development stage than at the two late fruit development stages.
Then, we selected 231 genes that were associated with cellulose biosynthesis, auxin biosynthesis, cytokinin biosynthesis, gibberellin biosynthesis, cell cycle and cell proliferation, from the reference peach genome9. Of these 231 genes, 192 were detected in the RNA-seq data and 44 were differentially expressed. We further selected 10 DEGs, including 8 DEGs that clustered together with expression levels higher in the round peach and 2 in the flat one at 0 DAFB (Figure 7B). In these 10 genes, five were associated with auxin, two with gibberellin, one with cell cycle, and two with cellulose. These 10 DEGs may act downstream of the flat shape gene to regulate the flat shape formation, because they are not located in the genome mapping site of flat shape gene.
After these two aspects analysis (Figure 7), we totally selected 33 DEGs that might participate in the process of flat shape formation, which were described in Supplementary Table S4.
Validation of the Expression Patterns of Candidate Genes
To confirm the accuracy of the RNA-seq results and validate the expression patterns of candidate genes, qRT-PCR was performed with 27 selected genes which highly expressed in round peach at 0 DAFB. The relative expression levels of all the 27 genes were consistent with the results of RNA-seq analysis, which have confirmed the reliability of transcriptome data (Figure 8).
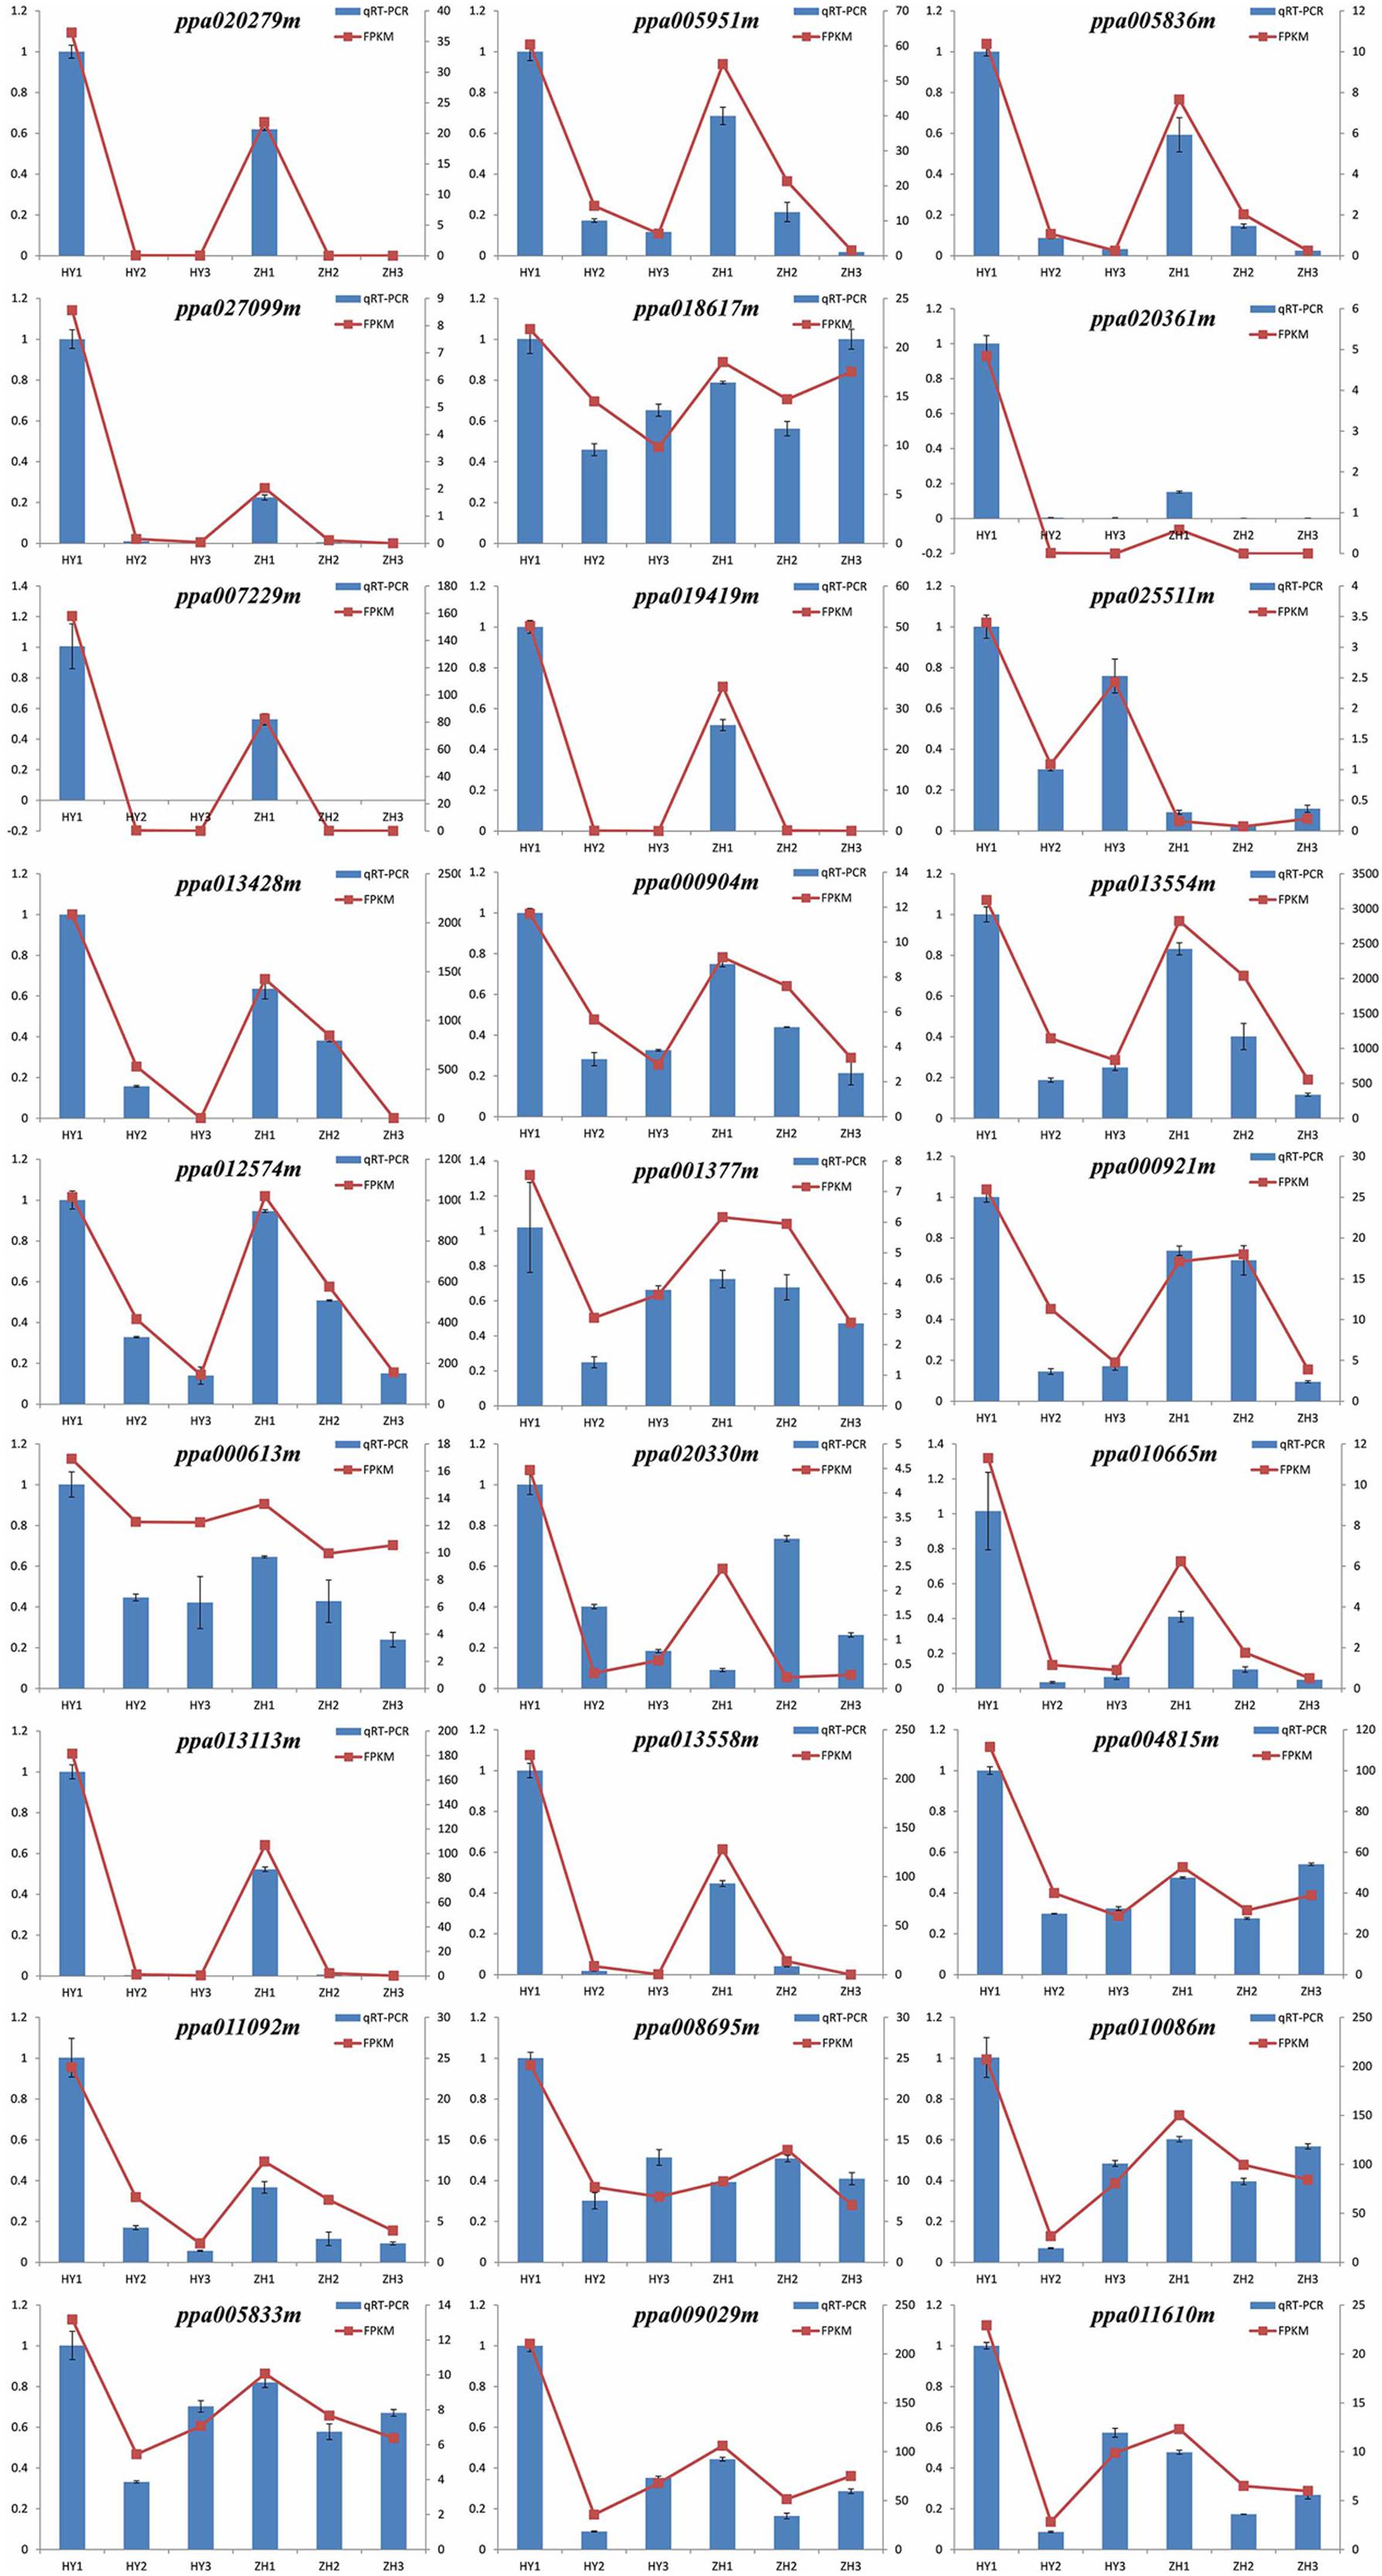
FIGURE 8. RT-PCR validation of expression levels of 28 DEGs identified by RNA-seq. The left vertical axis stands for the quantitative real-time polymerase chain reaction (qRT-PCR) and the right vertical axis stands for fragments per kilo-base per million mapped reads (FPKM).
However, we selected these 33 DEGs merely through the heatmaps, but not the definite FPKM values. Therefore, there might be some genes that were unexpected in these 33 genes. We preferred to select genes which were differentially expressed at 0 DAFB and highly expressed at 0 DAFB than the other two stages. According to the results of qRT-PCR and also FPKM value, the number of candidate genes was further narrowed down from 33 to 28. In this section, 28 genes were finally regarded as key candidate genes named ppa013047m, ppa004372m, ppa007229m, ppa019149m, ppa020361m, ppa020279m, ppa010655m, ppa009029m, ppa014358m, ppa003438m, ppa025511m, ppa010086m, ppa006443m, ppa013113m, ppa008642m, ppa004815m, ppa013558m, ppa013554m, ppa013428m, ppa000904m, ppa011610m, ppa011092m, ppa020330m, ppa000613m, ppa008695m, ppa005951m, ppa005836m, and ppa027099m (Supplementary Figure S4). Nineteen were in the vicinity of major QTL of flat shape and nine were regarded as downstream genes, indicating that multiple genes may be involved in flat fruit formation in peach (Table 2). Two of the 19 genes were LRR-RLK (leucine-rich receptor like kinases) genes, including ppa025511m which was reported to be responsible for flat shape recently (López-Girona et al., 2017) and ppa000904m. Four of the 9 genes were associated with the auxin signal pathway (ppa020279m, ppa005951m, ppa005836m, ppa027099m).
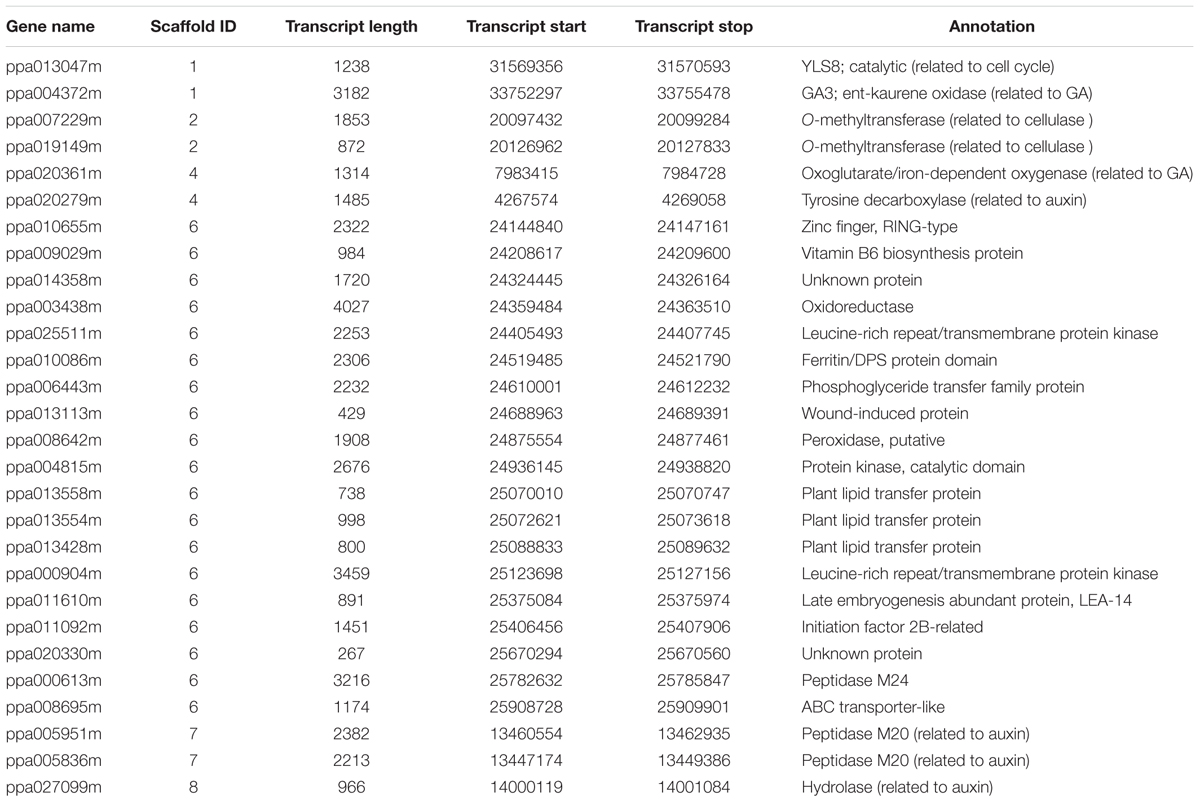
TABLE 2. Annotations and physical locations of 28 candidate genes.
IAA Concentration in Flat and Round Peach
There were differences in IAA content between flat and round peach at early fruit development stages (0 and 15 DAFB) when the fruit shape began to form. The IAA content was much higher in round peach than flat one at the first two stages, while there was no difference at 65 DAFB (Figure 9).
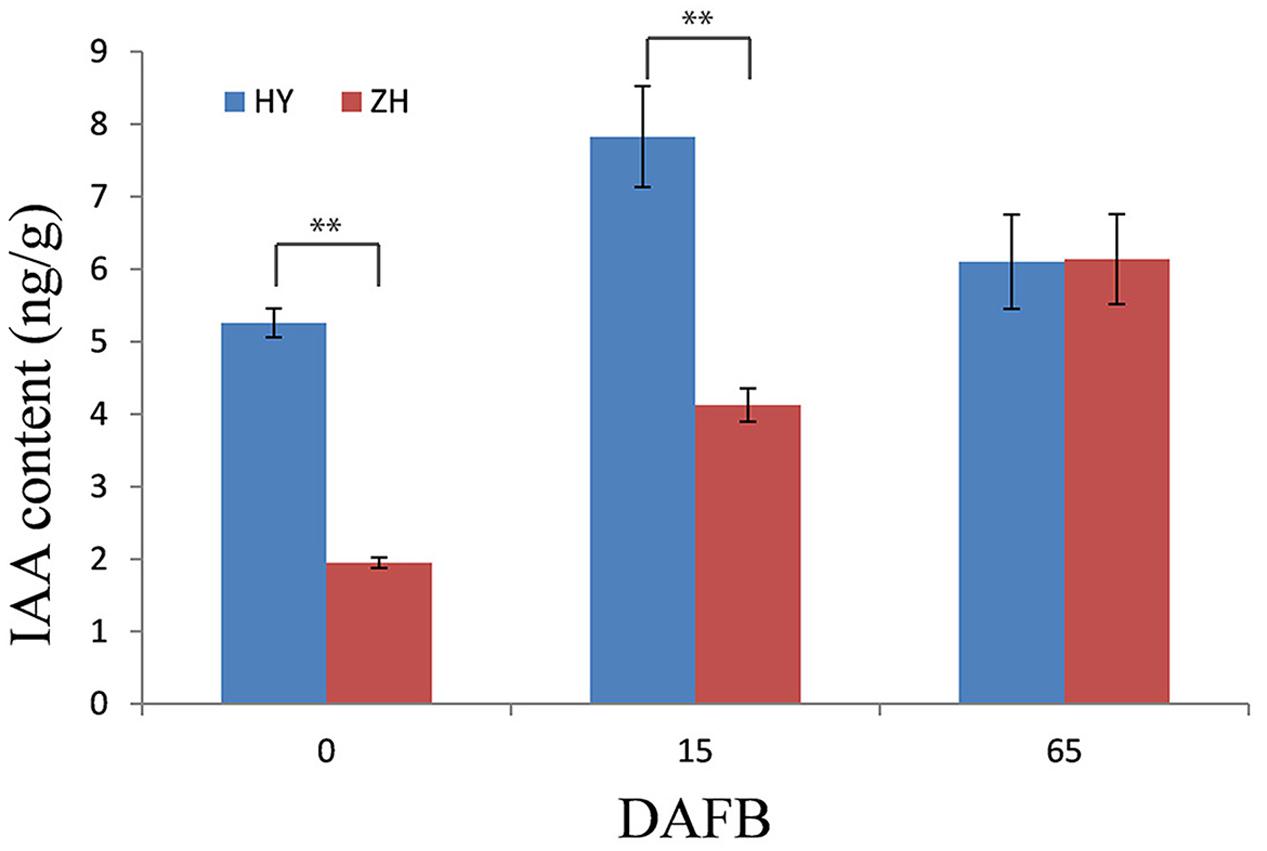
FIGURE 9. IAA content in flat and round peach. IAA content was measured in one round (HY) and one flat (ZH) peach cultivar using the same samples in RNA-seq analysis. ∗∗Represents the level of significance difference P < 0.01 in independent-samples t-test.
Discussion
The Critical Cellular Factor That Determines Fruit Shape Variation
In this study, the cellular basis of flat and round peaches was investigated. Among the different size of fruits, cell number plays an important role in fruit size, such as in peach (Scorzal et al., 1991), blueberry (Johnson and Malladi, 2011), sweet cherry (Olmstead et al., 2007), apple (Denne, 1960), and tomato (Cheniclet et al., 2005). In peach, fruit growth shows a double-sigmoid pattern with cell production from full bloom to pit hardening and cell enlargement during the final period (Coome, 1976). Pits of peach cultivars examined in the present study began to harden at 35 DAFB.
In this study, we found that cell number in vertical direction determined peach flat and round fruit shape during early fruit development. This result supported the finding that peach flat shape was determined in the early stages of flower development (Dirlewanger et al., 1998). Cell number also determined fruit size in large and small fruits in peach (Scorzal et al., 1991). Based on these studies, we could find that cell number played a vital role in peach fruit development, including fruit shape and size. In peach, there are some other fruit shape types, such as oval shape. Whether these shape types are also determined by cell number remains unknown. And these results may provide some meaningful information to uncover other fruit shape types.
Genetic Mechanisms That May Control Flat Shape Formation
Fruit shape formation is one of the most important processes of fruit development. For tomato, as the model fruit for fruit shape research, four fruit shape genes have been identified and named as OVATE (Liu et al., 2002), SUN (Xiao et al., 2008), FASCIATED (Cong et al., 2008), and LOCULE NUMBER (Munos et al., 2011). On the basis of their functional annotations and coding sequences, we did not find genes belong to these types in the 28 identified candidate genes, which indicated that there might have different mechanisms in the regulation of fruit shape formation between tomato and peach. However, their common characteristic is that cell number or size plays important roles in fruit development. In tomato, the gene SUN has functions in cell production, which results in a slender fruit phenotype (Wu et al., 2011) and microscopic analysis demonstrated that the higher pericarp thickness was not due to a larger number of cells, but to the increase in cell size (Su et al., 2014). Multiple quantitative trait loci for fruit size in tomato were associated with cell proliferation (Bertin et al., 2009). In apple, there were two genes associated with cell proliferation may result in vertical fruit development (Dash and Malladi, 2012). In crops, WTG1 determines grain size and shape by influencing cell expansion (Huang et al., 2017). In cucumber, larger fruits have more cells and much larger cell area (Yang et al., 2013). No significant relationship was found between fruit diameter and cell area in Rabbiteye Blueberry genotypes (Johnson and Malladi, 2011). Similarly, increase in cell division has caused variation in fruit size in Japanese pear (Zhang et al., 2006). These studies have shown that genes regulating cell proliferation and expansion had a vital role in fruit shape and size, which support the finding of the present study. Data from this study indicate that mechanisms that regulate cell proliferation in the early period of fruit development determine the final fruit shape variation.
Recently, in our previous study, we discovered a candidate gene (PpCAD1) for flat shape in peach, which is annotated with CONSTITUTIVELY ACTIVATED CELL DEATH GENES 1 (Cao et al., 2016) and is expressed much higher in round peach than in flat one at fruit maturation stage. Although this allele can exactly classify flat and round peach, the nucleotide mutation in this gene is a SNP in the fifth intron of the gene and the main difference between flat and round peach is expression level at maturation stage; however, in the present study, we confirmed that the flat shape formation was mainly caused by the reduction of cell number in the vertical axis at early fruit development. In the present study, the samples were collected at fruit developmental stages. The qRT-PCR results of the present study showed that there were no differences in relative expression levels between flat and round peach at 0, 15, and 65 DAFB (Supplementary Figure S5), which indicated that PpCAD1 might play important functions at maturation stage in regulating fruit development. The gene PpCAD1 was identified through GWAS which was based on genotypes and phenotypes. However, in the present study, we focused on the gene expression level to identify genes related to fruit shape variation based on cellular proof. These two independent studies had different perspectives in identifying the flat shape gene. The high correlation between fruit shape and the SNP in PpCAD1 made PpCAD1 a more likely candidate, while, not like genes identified in the present study, the higher expression of PpCAD1 in round peach at fruit maturation stage could not explain the fruit shape variation very well at early fruit development when the flat shape began to form. So, in our opinion, there might be no conflict between these two studies. The candidates of these two studies might have functions in the process of fruit shape formation together.
More recently, one gene named ppa025511m was identified to be co-segregated with flat shape in peach, because of a large deletion upstream of the gene and some nucleotide polymorphisms in the gene region (López-Girona et al., 2017). The primers for the flat shape marker provided by these authors could not distinguish the fruit types very well in our peach cultivars which were almost Chinese cultivars. As we known, peach originated in China and spread all over the world. Therefore, we believed that the diversities or amounts of the original flat peach cultivars that introduced into Europe may be too limited to produce a relative abundant genetic background, which may result in this unsatisfied result. Although we have found this gene in our transcriptome analysis, we believed that some other genes might be involved in flat shape formation. It has been reported that LRR-RLK genes have functions in plant organ regulation (De Smet et al., 2009; Mandel et al., 2014). There was a CLAVATA-WUSCHEL signaling pathway in the shoot meristem, with many LRR-RLK genes involved (Somssich et al., 2016). In our present study, we found two LRR-RLK genes (ppa025511m and ppa000904m) with an approximate physical distance 700 Kb. The ppa025511m itself may not be the flat shape gene, while these two genes may involve in flat shape formation together or there may be other genes involved in it. Therefore, we still could not discard any of them. The limitation of transgenesis in peach made it quite difficult to validate which gene is the real flat shape gene.
In our opinion, the flat shape gene resides in the genome region alongside these two previously reported candidate genes. PpCAD1 may have function in fruit development at maturation stage, while ppa025511m at early stage. Therefore, in this study, 76 DEGs located within 1 Mb up- or down-stream of the main GWAS locus for fruit shape (Cao et al., 2016) were detected, including 19 expected in the relative expression patterns. Forty-four DEGs associated with plant hormones (Fosket and Torrey, 1969), cellulose (Cosgrove, 2005), cell cycle (Malladi and Johnson, 2011) and cell proliferation (Gillaspy et al., 1993; Harada et al., 2005) were also identified in the whole genome, including 7 expected (Table 2). In this study, we totally provided 28 candidate genes. Further studies should be carried out to identify the flat shape gene and verify the mechanisms among genes, cells and fruit development.
Downstream Regulators Contribute to Fruit Development
In addition to the unconfirmed flat shape gene, some other downstream genes would participate in fruit shape formation. The gene (ppa013047m) annotated as yellow leaf senescence which has function in leaf senescence through cell cycle regulation (Yoshida et al., 2001) was highly expressed in flat peach at 0 DAFB, which might result in cell number reduction. Plant hormones have a major influence on plant growth. In a recent study, one WOX-like gene had functions in regulation of leaf width and stem thickness by enhanced cell proliferation in transgenic rice and Brachypodium and altered cytokinin homeostasis (Wang et al., 2017). In the present study, we did not find cytokinin-related genes, but four genes involved in auxin signal pathway (ppa005951m, ppa005836m, ppa027099m, ppa018617m). ppa005951m and ppa005836m were annotated as Peptidase M20 (Woodward and Bartel, 2005; Simunovic et al., 2011), ppa027099m and ppa018617m as hydrolase (Davies et al., 1999; Rampey et al., 2004). In peach, IAA has also been found to play a substantial role in fruit development, such as fruit ripening and softening (Tatsuki et al., 2013; Pan et al., 2015; Tadiello et al., 2016). In this study, the IAA concentration was higher in round peach than flat one at 0 and 15 DAFB when the fruit shape, which suggested that IAA might participate in the fruit shape formation in peach. Overall, the process of fruit shape formation is complicated, the results of the present study might aid other researchers to further illustrate the flat shape formation in peach.
Accession Codes
Sequence data have been deposited in the NCBI Short Read Archive (SRA) under accession SRP116734. All other relevant data contained within the paper are available in Supplementary Files.
Author Contributions
LW and KC designed the experiments. JG and YL analyzed the data. J-LY suggested the histological experiment. JG, YL, and QW prepared DNA and RNA samples. JG performed gene expression and paraffin section analyses. GZ, WF, XW, CC, LG, and TD prepared the materials. JG prepared the manuscript. J-LY and CD revised the manuscript.
Conflict of Interest Statement
The authors declare that the research was conducted in the absence of any commercial or financial relationships that could be construed as a potential conflict of interest.
Acknowledgments
This study was supported by the Ministry of Science and Technology of China (2013AA102606), the Agricultural Science and Technology Innovation Program (CAAS-ASTIP-2015-ZFRI-01), and the National Key Technology Research and Development Program of China (2013BAD01B04-19).
Supplementary Material
The Supplementary Material for this article can be found online at: https://www.frontiersin.org/articles/10.3389/fpls.2017.02215/full#supplementary-material
FIGURE S1 | Family trees of the four examined cultivars.
FIGURE S2 | Comparison of cell size and number between flat and round peach in cheek diameter.
FIGURE S3 | Linear regression analysis of fruit cheek diameter, cell size, and cell number at fruit maturation stage.
FIGURE S4 | The expression level heatmap of 28 candidate genes. Red color bands show high expression levels. Blue color bands indicate low expression levels.
FIGURE S5 | The relative expression level of ppa003772m. Blue columns stand for relative expression levels of round peach. Red columns stand for relative expression levels of flat peach. The horizontal axis shows three different stages during fruit development (S1: 0 DAFB; S2: 15 DAFB; S3: 65 DAFB).
TABLE S1 | Genotyping of 72 peach cultivars using the primers IndelS_R and FlatIn_F that are associated with ppa025511m.
TABLE S2 | Primers used for qRT-PCR analyses.
TABLE S3 | FPKM values, fold changes and annotations of 4165 DEGs.
TABLE S4 | Description of 33 selected genes.
Footnotes
- ^ http://imagej.nih.gov/ij/
- ^ https://www.rosaceae.org/node/355
- ^ https://www.rosaceae.org/
- ^ http://hannonlab.cshl.edu/fastx_toolkit/
- ^ http://www.ncbi.nlm.nih.gov/tools/primer-blast/
- ^ http://www.shimadzu.com.cn
- ^ http://www.appliedbiosystems.com.cn
- ^ https://www.rosaceae.org/node/355
- ^ http://pathways.rosaceae.org/pwy-search.shtml
References
Bertin, N., Borel, C., Brunel, B., Cheniclet, C., and Causse, M. (2003). Do genetic make-up and growth manipulation affect tomato fruit size by cell number, or cell size and DNA endoreduplication? Annu. Bot. 92, 415–424. doi: 10.1093/aob/mcg146
Bertin, N., Causse, M., Brunel, B., Tricon, D., and Genard, M. (2009). Identification of growth processes involved in QTLs for tomato fruit size and composition. J. Exp. Bot. 60, 237–248. doi: 10.1093/jxb/ern281
Cao, K., Zhou, Z., Wang, Q., Guo, J., Zhao, P., Zhu, G., et al. (2016). Genome-wide association study of 12 agronomic traits in peach. Nat. Commun. 7:13246. doi: 10.1038/ncomms13246
Cheng, G. W., and Breen, P. J. (1992). Cell count and size in relation to fruit size among strawberry cultivars. J. Am. Soc. Hortic. Sci. 117, 946–950.
Cheniclet, C., Rong, W. Y., Causse, M., Frangne, N., Bolling, L., Carde, J. P., et al. (2005). Cell expansion and endoreduplication show a large genetic variability in pericarp and contribute strongly to tomato fruit growth. Plant Physiol. 139, 1984–1994. doi: 10.1104/pp.105.068767
Chusreeaeom, K., Ariizumi, T., Asamizu, E., Okabe, Y., Shirasawa, K., and Ezura, H. (2014). A novel tomato mutant, Solanum lycopersicum elongated fruit1 (Slelf1), exhibits an elongated fruit shape caused by increased cell layers in the proximal region of the ovary. Mol. Genet. Genomics 289, 399–409. doi: 10.1007/s00438-014-0822-8
Cong, B., Barrero, L. S., and Tanksley, S. D. (2008). Regulatory change in YABBY-like transcription factor led to evolution of extreme fruit size during tomato domestication. Nat. Genet. 40, 800–804. doi: 10.1038/ng.144
Coome, B. G. (1976). The development of fleshy fruits. Annu. Rev. Plant Physiol. 27, 207–228. doi: 10.1146/annurev.pp.27.060176.001231
Cosgrove, D. J. (2005). Growth of the plant cell wall. Nat. Rev. Mol. Cell Biol. 6, 850–861. doi: 10.1038/nrm1746
Czemmel, S., Holl, J., Loyola, R., Arce-Johnson, P., Alcalde, J. A., and Matus, J. T. (2017). Transcriptome-wide identification of novel UV-B- and light modulated flavonol pathway genes controlled by VviMYBF1. Front. Plant Sci. 8:1084. doi: 10.3389/fpls.2017.01084
Dash, M., and Malladi, A. (2012). The AINTEGUMENTA genes, MdANT1 and MdANT2, are associated with the regulation of cell production during fruit growth in apple (Malus × domestica Borkh.). BMC Plant Biol. 12:98. doi: 10.1186/1471-2229-12-98
Davies, R. T., Goetz, D. H., Lasswell, J., Anderson, M. N., and Bartel, B. (1999). IAR3 encodes an auxin conjugate hydrolase from Arabidopsis. Plant Cell 11, 365–376. doi: 10.1105/tpc.11.3.365
De Smet, I., Voss, U., Jurgens, G., and Beeckman, T. (2009). Receptor-like kinases shape the plant. Nat. Cell Biol. 11, 1166–1173. doi: 10.1038/ncb1009-1166
Denne, M. P. (1960). The growth of apple fruitlets, and the effect of early thinning on fruit development. Ann. Bot. 24, 397–406.
Dirlewanger, E., Cosson, P., Boudehri, K., Renaud, C., Capdeville, G., Tauzin, Y., et al. (2006). Development of a second-generation genetic linkage map for peach [Prunus persica (L.) Batsch] and characterization of morphological traits affecting flower and fruit. Tree Genet. Genomes 3, 1–13. doi: 10.1007/s11295-006-0053-1
Dirlewanger, E., Pronier, V., Parvery, C., Rothan, C., Guye, A., and Monet, R. (1998). Genetic linkage map of peach [Prunus persica (L.) Batsch] using morphological and molecular markers. Theor. Appl. Genet. 97, 888–895. doi: 10.1007/s001220050
Estrada-Johnson, E., Csukasi, F., Pizarro, C. M., Vallarino, J. G., Kiryakova, Y., Vioque, A., et al. (2017). Transcriptomic analysis in strawberry fruits reveals active auxin biosynthesis and signaling in the ripe receptacle. Front. Plant Sci. 8:889. doi: 10.3389/fpls.2017.00889
Fosket, D. E., and Torrey, J. G. (1969). Hormonal control of cell proliferation and xylem differentiation in cultured tissues of Glycine max var. Biloxi. Plant Physiol. 44, 871–880. doi: 10.1104/pp.44.6.871
Frazee, A. C., Pertea, G., Jaffe, A. E., Langmead, B., Salzberg, S. L., and Leek, J. T. (2015). Ballgown bridges the gap between transcriptome assembly and expression analysis. Nat. Biotechnol. 33, 243–246. doi: 10.1038/nbt.3172
Gillaspy, G., David, H. B., and Gruissem, W. (1993). Fruits: a developmental perspective. Plant Cell 5, 1439–1451. doi: 10.1105/tpc.5.10.1439
Harada, T., Kurahashi, W., Yanai, M., Wakasa, Y., and Satoh, T. (2005). Involvement of cell proliferation and cell enlargement in increasing the fruit size of Malus species. Sci. Hortic. 105, 447–456. doi: 10.1016/j.scienta.2005.02.006
Higashi, K., and Hosoya, K. (1999). Histological analysis of fruit development between two melon (Cucumis melo L. reticulatus) genotypes setting a different size of fruit. J. Exp. Bot. 50, 1593–1597. doi: 10.1093/jxb/50.339.1593
Huang, K., Wang, D., Duan, P., Zhang, B., Xu, R., Li, N., et al. (2017). WIDE AND THICK GRAIN 1, which encodes an otubain-like protease with deubiquitination activity, influences grain size and shape in rice. Plant J. 91, 849–860. doi: 10.1111/tpj.13613
Iglesias, I. (2013). “Peach production in Spain: current situation and trends, from production to consumption,” in Proceedings of the 4th Conference on Innovations in Fruit Growing, Barcelona, 75–96.
Johnson, L. K., and Malladi, A. (2011). Differences in cell number facilitate fruit size variation in Rabbiteye blueberry genotypes. J. Am. Soc. Hortic. Sci. 136, 10–15.
Kanjana, W., Suzuki, T., Ishii, K., Kozaki, T., Iigo, M., and Yamane, K. (2016). Transcriptome analysis of seed dormancy after rinsing and chilling in ornamental peaches (Prunus persica (L.) Batsch). BMC Genomics 17:575. doi: 10.1186/s12864-016-2973-y
Kim, D., Langmead, B., and Salzberg, S. L. (2015). HISAT: a fast spliced aligner with low memory requirements. Nat. Methods 12, 357–360. doi: 10.1038/nmeth.3317
Lesley, J. W. (1940). A genetic study of saucer fruit shape and other characters in the peach. Proc. Am. Soc. Hortic. Sci. 37, 218–222.
Li, H., Handsaker, B., Wysoker, A., Fennell, T., Ruan, J., Homer, N., et al. (2009). The sequence alignment/map format and SAMtools. Bioinformatics 25, 2078–2079. doi: 10.1093/bioinformatics/btp352
Liu, J., Ming, Y., Cheng, Y., Zhang, Y., Xing, J., and Sun, Y. (2017). Comparative transcriptome analysis reveal candidate genes potentially involved in regulation of primocane apex rooting in raspberry (Rubus spp.). Front. Plant Sci. 8:1036. doi: 10.3389/fpls.2017.01036
Liu, J., Van Eck, J., Cong, B., and Tanksley, S. D. (2002). A new class of regulatory genes underlying the cause of pear-shaped tomato fruit. Proc. Natl. Acad. Sci. U.S.A. 99, 13302–13306. doi: 10.1073/pnas.162485999
Livak, K. J., and Schmittgen, T. D. (2001). Analysis of relative gene expression data using real-time quantitative PCR and the 2-ΔΔCT method. Methods 25, 402–408. doi: 10.1006/meth.2001.1262
López-Girona, E., Zhang, Y., Eduardo, I., Mora, J. R. H., Alexiou, K. G., Arús, P., et al. (2017). A deletion affecting an LRR-RLK gene co-segregates with the fruit flat shape trait in peach. Sci. Rep. 7:6714. doi: 10.1038/s41598-017-07022-0
Malladi, A., and Hirst, P. M. (2010). Increase in fruit size of a spontaneous mutant of ‘Gala’ apple (Malus x domestica Borkh.) is facilitated by altered cell production and enhanced cell size. J. Exp. Bot. 61, 3003–3013. doi: 10.1093/jxb/erq134
Malladi, A., and Johnson, L. K. (2011). Expression profiling of cell cycle genes reveals key facilitators of cell production during carpel development, fruit set, and fruit growth in apple (Malus x domestica Borkh.). J. Exp. Bot. 62, 205–219. doi: 10.1093/jxb/erq258
Mandel, T., Moreau, F., Kutsher, Y., Fletcher, J. C., Carles, C. C., and Eshed Williams, L. (2014). The ERECTA receptor kinase regulates Arabidopsis shoot apical meristem size, phyllotaxy and floral meristem identity. Development 141, 830–841. doi: 10.1242/dev.104687
Micheletti, D., Dettori, M. T., Micali, S., Aramini, V., Pacheco, I., and Da Silva Linge, C. (2015). Whole-genome analysis of diversity and SNP-major gene association in peach germplasm. PLOS ONE 10:e0136803. doi: 10.1371/journal.pone.0136803
Munos, S., Ranc, N., Botton, E., Berard, A., Rolland, S., Duffe, P., et al. (2011). Increase in tomato locule number is controlled by two single-nucleotide polymorphisms located near WUSCHEL. Plant Physiol. 156, 2244–2254. doi: 10.1104/pp.111.173997
Olmstead, J. W., Iezzoni, A. F., and Whiting, M. D. (2007). Genotypic differences in sweet cherry fruit size are primarily a function of cell number. J. Am. Soc. Hortic. Sci. 132, 697–703.
Pan, L., Zeng, W., Niu, L., Lu, Z., Liu, H., Cui, G., et al. (2015). PpYUC11, a strong candidate gene for the stony hard phenotype in peach (Prunus persica L. Batsch), participates in IAA biosynthesis during fruit ripening. J. Exp. Bot. 66, 7031–7044. doi: 10.1093/jxb/erv400
Pertea, M., Pertea, G. M., Antonescu, C. M., Chang, T. C., Mendell, J. T., and Salzberg, S. L. (2015). StringTie enables improved reconstruction of a transcriptome from RNA-seq reads. Nat. Biotechnol. 33, 290–295. doi: 10.1038/nbt.3122
Picañol, R., Eduardo, I., Aranzana, M. J., Howad, W., Batlle, I., Iglesias, I., et al. (2013). Combining linkage and association mapping to search for markers linked to the flat fruit character in peach. Euphytica 190, 279–288. doi: 10.1007/s10681-012-0844-4
Rampey, R. A., Leclere, S., Kowalczyk, M., Ljung, K., Sandberg, G., and Bartel, B. (2004). A family of auxin-conjugate hydrolases that contributes to free indole-3-acetic acid levels during Arabidopsis germination. Plant Physiol. 135, 978–988. doi: 10.1104/pp.104.039677
Rapoport, H. F., and Costagli, G. (2004). The effect of water deficit during early fruit development on olive fruit morphogenesis. J. Am. Soc. Hortic. Sci. 129, 121–127.
Rodriguez, G. R., Munos, S., Anderson, C., Sim, S. C., Michel, A., Causse, M., et al. (2011). Distribution of SUN, OVATE, LC, and FAS in the tomato germplasm and the relationship to fruit shape diversity. Plant Physiol. 156, 275–285. doi: 10.1104/pp.110.167577
Scorzal, R., May, L. G., Purnell, B., and Upchurch, B. (1991). Differences in number and area of mesocarp cells between small- and large-fruited peach cultivars. J. Am. Soc. Hortic. Sci. 116, 861–864.
Simunovic, M., Zagrovic, B., and Tomic, S. (2011). Mechanism and thermodynamics of ligand binding to auxin amidohydrolase. J. Mol. Recognit. 24, 854–861. doi: 10.1002/jmr.1128
Somssich, M., Je, B. I., Simon, R., and Jackson, D. (2016). CLAVATA-WUSCHEL signaling in the shoot meristem. Development 143, 3238–3248. doi: 10.1242/dev.133645
Su, L., Bassa, C., Audran, C., Mila, I., Cheniclet, C., Chevalier, C., et al. (2014). The auxin Sl-IAA17 transcriptional repressor controls fruit size via the regulation of endoreduplication-related cell expansion. Plant Cell Physiol. 55, 1969–1976. doi: 10.1093/pcp/pcu124
Tadiello, A., Ziosi, V., Negri, A. S., Noferini, M., Fiori, G., Busatto, N., et al. (2016). On the role of ethylene, auxin and a GOLVEN-like peptide hormone in the regulation of peach ripening. BMC Plant Biol. 16:44. doi: 10.1186/s12870-016-0730-7
Tatsuki, M., Nakajima, N., Fujii, H., Shimada, T., Nakano, M., Hayashi, K., et al. (2013). Increased levels of IAA are required for system 2 ethylene synthesis causing fruit softening in peach (Prunus persica L. Batsch). J. Exp. Bot. 64, 1049–1059. doi: 10.1093/jxb/ers381
Wang, H., Niu, L., Fu, C., Meng, Y., Sang, D., Yin, P., et al. (2017). Overexpression of the WOX gene STENOFOLIA improves biomass yield and sugar release in transgenic grasses and display altered cytokinin homeostasis. PLOS Genet. 13:e1006649. doi: 10.1371/journal.pgen.1006649
Woodward, A. W., and Bartel, B. (2005). Auxin: regulation, action, and interaction. Ann. Bot. 95, 707–735. doi: 10.1093/aob/mci083
Wu, S., Xiao, H., Cabrera, A., Meulia, T., and Van Der Knaap, E. (2011). SUN regulates vegetative and reproductive organ shape by changing cell division patterns. Plant Physiol. 157, 1175–1186. doi: 10.1104/pp.111.181065
Xiao, H., Jiang, N., Schaffner, E., Stockinger, E. J., and Van Der Knaap, E. (2008). A retrotransposon-mediated gene duplication underlies morphological variation of tomato fruit. Science 319, 1527–1530. doi: 10.1126/science.1153040
Xu, J. M., Fan, W., Jin, J. F., Lou, H. Q., Chen, W. W., Yang, J. L., et al. (2017). Transcriptome analysis of Al-induced genes in Buckwheat (Fagopyrum esculentum Moench) root apex: new insight into Al toxicity and resistance mechanisms in an Al accumulating species. Front. Plant Sci. 8:1141. doi: 10.3389/fpls.2017.01141
Yang, X. Y., Wang, Y., Jiang, W. J., Liu, X. L., Zhang, X. M., Yu, H. J., et al. (2013). Characterization and expression profiling of cucumber kinesin genes during early fruit development: revealing the roles of kinesins in exponential cell production and enlargement in cucumber fruit. J. Exp. Bot. 64, 4541–4557. doi: 10.1093/jxb/ert269
Yao, J. L., Xu, J., Cornille, A., Tomes, S., Karunairetnam, S., Luo, Z., et al. (2015). A microRNA allele that emerged prior to apple domestication may underlie fruit size evolution. Plant J. 84, 417–427. doi: 10.1111/tpj.13021
Yoshida, S., Ito, M., Nishida, I., and Watanabe, A. (2001). Isolation and RNA gel blot analysis of genes that could serve as potential molecular markers for leaf senescence in Arabidopsis thaliana. Plant Cell Physiol. 42, 170–178. doi: 10.1093/pcp/pce021
Zhang, C., Tanabe, K., Wang, S., Tamura, F., Yoshida, A., and Matsumoto, K. (2006). The impact of cell division and cell enlargement on the evolution of fruit size in Pyrus pyrifolia. Ann. Bot. 98, 537–543. doi: 10.1093/aob/mcl144
Zhou, Y., Zhou, H., Lin-Wang, K., Vimolmangkang, S., Espley, R. V., Wang, L., et al. (2014). Transcriptome analysis and transient transformation suggest an ancient duplicated MYB transcription factor as a candidate gene for leaf red coloration in peach. BMC Plant Biol. 14:388. doi: 10.1186/s12870-014-0388-y
Keywords: fruit shape, peach, transcriptome, cell number and size, fruit diameter, fruit development
Citation: Guo J, Cao K, Li Y, Yao J-L, Deng C, Wang Q, Zhu G, Fang W, Chen C, Wang X, Guan L, Ding T and Wang L (2018) Comparative Transcriptome and Microscopy Analyses Provide Insights into Flat Shape Formation in Peach (Prunus persica). Front. Plant Sci. 8:2215. doi: 10.3389/fpls.2017.02215
Received: 06 September 2017; Accepted: 18 December 2017;
Published: 04 January 2018.
Edited by:
Stefan de Folter, Centro de Investigación y de Estudios Avanzados del Instituto Politécnico Nacional, MexicoReviewed by:
Michael Lenhard, University of Potsdam, GermanyYuepeng Han, Wuhan Botanical Garden of Chinese Academy of Sciences, China
Copyright © 2018 Guo, Cao, Li, Yao, Deng, Wang, Zhu, Fang, Chen, Wang, Guan, Ding and Wang. This is an open-access article distributed under the terms of the Creative Commons Attribution License (CC BY). The use, distribution or reproduction in other forums is permitted, provided the original author(s) or licensor are credited and that the original publication in this journal is cited, in accordance with accepted academic practice. No use, distribution or reproduction is permitted which does not comply with these terms.
*Correspondence: Lirong Wang, d2xpcm9uZzIwMDlAc2luYS5jb20=
†These authors have contributed equally to this work.