 Pan-Pan Lu1,2†Tai-Fei Yu1,2†Wei-Jun Zheng1†
 Ming Chen2Yong-Bin Zhou1,2
 Jun Chen2You-Zhi Ma2Ya-Jun Xi1*
 Zhao-Shi Xu2*
- 1College of Agronomy, State Key Laboratory of Crop Stress Biology for Arid Areas, Northwest A&F University, Yangling, China
- 2Chinese Academy of Agricultural Sciences, National Key Facility for Crop Gene Resources and Genetic Improvement, Key Laboratory of Biology and Genetic Improvement of Triticeae Crops, Ministry of Agriculture, Beijing, China
Bax inhibitor-1 (BI-1) is an endoplasmic reticulum (ER)-resident cell death suppressor evolutionarily conserved in eukaryotes. The ability of BI-1 to inhibit the biotic and abiotic stresses have been well-studied in Arabidopsis, while the functions of wheat BI-1 are largely unknown. In this study, the wheat BI-1 gene TaBI-1.1 was isolated by an RNA-seq analysis of Fusarium graminearum (Fg)-treated wheat. TaBI-1.1 expression was induced by a salicylic acid (SA) treatment and down-regulated by an abscisic acid (ABA) treatment. Based on β-glucuronidase (GUS) staining, TaBI-1.1 was expressed in mature leaves and roots but not in the hypocotyl or young leaves. Constitutive expression of TaBI-1.1 in Arabidopsis enhanced its resistance to Pseudomonas syringae pv. Tomato (Pst) DC3000 infection and induced SA-related gene expression. Additionally, TaBI-1.1 transgenic Arabidopsis exhibited an alleviation of damage caused by high concentrations of SA and decreased the sensitivity to ABA. Consistent with the phenotype, the RNA-seq analysis of 35S::TaBI-1.1 and Col-0 plants showed that TaBI-1.1 was involved in biotic stresses. These results suggested that TaBI-1.1 positively regulates SA signals and plays important roles in the response to biotic stresses. In addition, TaBI-1.1 interacted with the aquaporin TaPIP1, and both them were localized to ER membrane. Furthermore, we demonstrated that TaPIP1 was up-regulated by SA treatment and TaPIP1 transgenic Arabidopsis enhanced the resistance to Pst DC3000 infection. Thus, the interaction between TaBI-1.1 and TaPIP1 on the ER membrane probably occurs in response to SA signals and defense response.
Introduction
Crop plants are constantly exposed to a variety of biotic and abiotic stresses, such as drought, salinity and pathogen infection, leading to major losses in productivity. Unlike animals, plants cannot move to escape from environmental stresses. Plants have developed complex and elaborate mechanisms of induction and execute a wide range of physiological and metabolic responses to adapt to these stresses.
The plant hormone salicylic acid (SA) plays an important role in the plant response to biotic stress. As a key signal in the plant defense response, SA induces broad-spectrum systemic resistance by up-regulating the expression of pathogenesis-related (PR) genes and promoting cell wall rigidification and phytoalexin synthesis (Ryals et al., 1996; Dong, 1998; Pieterse and van Loon, 1999; Wildermuth et al., 2001). PR1 is a well-known marker gene of SA-mediated disease resistance (Van Loon, 1998). The SA level is normally increased in tissues attacked by pathogens, which induces the expression of PR genes, including PR1, PR2, and PR5, to enhance plant resistance (Bari and Jones, 2008; Canet et al., 2012; Peng et al., 2012; Tateda et al., 2014; Choi et al., 2015). In addition, ISOCHORISMATE SYNTHASE 1 (ICS1) and DISEASE SUSCEPTIBILITY 1 (EDS1) also play key roles in disease resistance. ICS1 encodes a key enzyme in SA biosynthesis (Wildermuth et al., 2001), whereas EDS1 controls basal immunity by restricting the growth of virulent pathogens (Wiermer et al., 2005).
Salicylic acid synthesis is associated with the onset of the hypersensitive response (HR), which induces calcium influx, protein phosphorylation, dephosphorylation, the production of reactive oxygen intermediates, and PR gene expression. Extreme defense responses induce programmed cell death (PCD) (Morel and Dangl, 1997; Grant et al., 2000; Lam et al., 2001; Choi et al., 2012). PCD is crucial for defense responses to restrict the spread of pathogens in plants. Apoptotic-like PCD is one of the cell death pathways which results in a corpse morphology that is similar to the apoptotic morphology seen in animal cells (Reape and Mccabe, 2010). Bcl-2 family members are not present in fungi and reveal the pathways of apoptosis in animals (Breckenridge et al., 2003). Bcl-2 family proteins are divided into three subfamilies: Bcl-2 subfamily (pro-survival type; Bcl-2, Bcl-XL), Bax subfamily (pro-apoptotic type; Bax, Bak), and BH3 subfamily (pro-apoptotic type; Bad, Bid) (Ameisen, 2002; Watanabe and Lam, 2009). Unlike Bcl-2 family proteins, Bax inhibitor-1 (BI-1) is evolutionarily conserved and widely present in eukaryotic species from fungi to plants and animals (Chae et al., 2003). BI-1, as a highly conserved cell death suppressor, was identified based on its suppression of Bax-activated cell death in yeast (Xu and Reed, 1998; Kawai-Yamada and Uchimiya, 2001; Bolduc et al., 2003; Ishikawa et al., 2011; Lee et al., 2014). BI-1 is a cytoprotective protein localized to the endoplasmic reticulum (ER) membrane and plays important roles in responses to biotic and abiotic stresses (Watanabe and Lam, 2009). AtBI-1-overexpressing rice cells exhibit enhanced tolerance to menadione-induced oxidative stress and to infection with the rice blast fungus (Magnaporthe grisea) (Matsumura et al., 2003; Ishikawa et al., 2010) as well as an alleviation of stress-induced cell death; these effects are achieved by decreasing the levels of flotillin (FLOT) and HIR3, which are required for cell death induced by oxidative stress and SA (Ishikawa et al., 2015). AtBI-1 also suppresses cell death induced by pokeweed antiviral protein (PAP), Bax, H2O2, or SA (Kawai-Yamada et al., 2004). AtBI-1 expression is induced by the non-phytopathogenic hrpA mutant of DC3000 and Escherichia coli (Sanchez et al., 2000). Overexpression of HvBI-1 in single epidermal cells of barley enhances the resistance to the powdery mildew fungus Blumeria graminis f. sp. Hordei (Babaeizad et al., 2009). In Arabidopsis, AtBI-1 plays a pivotal role in ER stress-mediated PCD. Two AtBI-1 mutants (atbi1-1 and atbi1-2) enhance sensitivity to the ER stress inducer tunicamycin (TM), and overexpression of AtBI-1 markedly reduces the sensitivity to TM (Watanabe and Lam, 2008) compared with that of wild-type plants. The expression level of Ss-Bi1 increases upon various stress treatments, and gene silenced lines are sensitive to heat stress and ER stress (Yu et al., 2015). Overexpression of CaBI-1 in tobacco plants leads to a markedly improved tolerance to high temperature, water deficit, and high salinity (Isbat et al., 2009). The exogenous expression of wheat TaBI-1 in tobacco partially blocks Bax-induced cell death caused, and the suppression of TaBI-1 expression in wheat enhances the plant susceptibility to Pst (Wang et al., 2012).
To date, several proteins that interact with BI-1 have been identified. AtBI-1 interacts with calmodulin in yeast and plant cells and responds to ion homeostasis to regulate plant cell death (Ihara-Ohori et al., 2007). Human BI-1 interacts with NADPH-dependent cytochrome P450 oxidoreductase (NPR) and modulates ER stress-induced reactive oxygen species (ROS) accumulation (Hyung-Ryong et al., 2009). It have been demonstrated that BI-1 interacts with cytochrome b(5) and cytochrome P450 83A1 (CYP83A1) at the ER (Nagano et al., 2009; Weis et al., 2013). However, the knowledge about the mechanism of BI-1 in ER stress is also limited. Thus, a screen of candidate interacting proteins that are localized to the ER membrane may be an effective approach to better understand the function of BI-1 in ER stress.
Currently, the mechanisms by which BI-1 regulates the response to ER stress in plants are unclear, and the functions of BI-1 in responses to biotic and abiotic stresses are also poorly understood, requiring further investigation. Wheat is one of the most important cereals, providing ∼20% of the calories consumed by humans. Environmental stresses significantly suppress wheat growth and affect quality and yield. Therefore, studies aiming to understand the molecular mechanisms of genes involved in abiotic and biotic stress responses are necessary to enable the breeding of crops with stress tolerance. However, the function of wheat BI-1 is largely unknown. Here, we identified the wheat BI-1 gene TaBI-1.1, selected through an RNA-seq analysis of Fusarium graminearum (Fg)-treated wheat. TaBI-1.1 interacted with an aquaporin TaPIP1, and was co-localized with TaPIP1 on the ER membrane. Both TaBI-1.1 and TaPIP1 were SA-induced genes, and enhanced resistance to Pseudomonas syringae pv. Tomato (Pst) DC3000 in Arabidopsis, revealing a possible role of the interaction between TaBI-1.1 and TaPIP1 on the ER membrane in response to pathogen infection.
Materials and Methods
Plant Materials and Gene Cloning
Arabidopsis Columbia-0 (Col-0) was used as the background for overexpressing TaBI-1.1. The mutant atbi1-2 (CS323793) was obtained from the Arabidopsis Biological Resource Center (ABRC). The cDNAs of TaBI-1.1 (TRIAE_CS42_U_TGACv1_ 644608_AA2140670) and TaPIP1 (TRIAE_CS42_6DL_TGACv1_526452_AA1684100) were amplified from the cultivated wheat cultivar Xiaobaimai (for primer sequences, see Supplementary Table S2). The PCR products were cloned into the pLB vector (TIANGEN, China). Amino acid sequence identity comparison was performed using the DNAMAN 6.0 software (Lynnon Biosoft, United States).
Quantitative Real-Time PCR (qRT-PCR) Analysis
Wheat seedlings were grown at 22°C under a 16 h light/8 h dark photoperiod. 10-day-old wheat seedlings were used for SA, NaCl, and abscisic acid (ABA) treatments. For the SA, NaCl, and ABA treatments, wheat seedlings were sprayed with solutions containing 2 mM SA, 200 mM NaCl, and 1 μM ABA, respectively. For the NaCl and ABA treatments, samples were harvested at 0, 0.5, 1, 2, 4, 8, 12, and 24 h. For the SA treatment, the samples were harvested at 0, 1, 4, 8, 12, 24, 36, and 48 h. For the Pst DC3000 treatment, leaves of 4-week-old Arabidopsis seedlings were infiltrated with Pst DC3000 at OD600 = 0.002 and were collected at 0, 1, 2, and 3 days post-infection (dpi). For each time point, five leaves were collected from five individual plants. For the qRT-PCR analysis of SA-related genes, 2-week-old seedlings of Col-0, atbi1-2, and 35S::TaBI-1.1#1 grown under normal condition were used. All samples were rapidly frozen in liquid nitrogen and stored at -80°C. Three biological replicates were performed for different plants at each time point. RNA extraction and qRT-PCR were performed using the RNAprep plant kit (TIANGEN, China) and the ABI7500 real-time PCR system (ABI, United States), respectively. The specific primers and reference gene for the qRT-PCR were listed in Supplementary Table S2.
Generation and Performance Evaluation of Transgenic Arabidopsis Plants under Stress Treatments
The coding sequences of TaBI-1.1 and TaPIP1 were cloned into the pCAMBIA1302 vector under the control of the CaMV 35S promoter using an In-Fusion HD Cloning Kit (Clontech, United States) (for primer sequences, see Supplementary Table S2). The fusions of 35S::TaBI-1.1 and 35S::TaPIP1 were transformed into Col-0 plants via the floral dipping method (Clough and Bent, 1998). The expression levels of TaBI-1.1 and TaPIP1 in transgenic Arabidopsis were detected using qRT-PCR, and sequenced to confirm transgenic plants constitutively overexpressing TaBI-1.1 or TaPIP1. Homozygous T3 seeds of two transgenic lines of TaBI-1.1 and TaPIP1 with higher expression level were used for the further phenotypic analysis. The seeds were surface-sterilized, kept at 4°C for 3 days, and then sown on MS medium (Murashige and Skoog, 1962) supplemented with 2% Suc and solidified with 0.8% (w/v) agar at 22°C under long-day photoperiod (16 h light/8 h dark). For the phenotype analysis of TaBI-1.1 transgenic plants, 4-day-old seedling plants per genotype were transferred to MS media containing 100 mM NaCl, 120 mM NaCl, 20 μM ABA, 30 μM ABA, 30 μM SA, and 50 μM SA for 13 days. The root length, fresh weight, and lateral root numbers of plants were monitored via statistical analysis. For the germination assay of TaBI-1.1 transgenic plants, the seed number was recorded every 12 h post-incubation for visible radical emergence as a proxy for seed germination. Each treatment contained three independent replicates.
β-Glucuronidase (GUS) Activity Assay
For the GUS activity assay, the promoter of TaBI-1.1 was amplified from wheat cultivar Xiaobaimai and cloned into pCAMBIA1391Z using an In-Fusion HD Cloning Kit (Clontech, United States) (for primer sequences, see Supplementary Table S2) and transformed into Col-0 plants. The T2 generation transgenic seeds were germinated and grown on MS media for 5 days and then exposed to MS media containing 120 mM NaCl, 20 μM ABA, and 50 μM SA for 1 day under a day/night 16/8 h cycle at 22°C. Seedlings without any stress treatment were used as the control. GUS histochemical assays kit was used for detecting GUS activity (Real-Times, Beijing). The seedlings after staining were photographed using a Leica M165 FC stereomicroscope (Wetzlar, Germany).
Bacterial Inoculation and Determination of Bacterial Growth
The Pst DC3000 was grown on King’s medium B (KB) (King et al., 1954) supplemented with 25 mg/L rifampicin for 48 h at 28°C and resuspended in 10 mM MgCl2 to OD600 = 0.002. Leaves of 4-week-old plants were infected with the bacterial suspension by pressing an 1-ml syringe (without a needle) against the abaxial side of the leaves and forcing the suspension through the stomata into the intercellular spaces. Each sample consisted of 20–25 infected leaves selected from five plants. Twenty leaves per genotype were harvested and photographed at 3 dpi. Eight leaf disks with 0.25 cm2 in size were cut from each genotype and ground into powder. Then, the materials were diluted with 10 mM MgCl2 and spread on KB medium. The medium was incubated for 2 days at 28°C. Eight replicate samples per genotype were assayed to obtain means and SD, which were determined from the logarithm of the number of c.f.u. cm-2.
Yeast Two-Hybrid System
The MATCHMAKER two-hybrid system (Clontech, United States) was used for the yeast two-hybrid interaction assay. The coding regions of TaBI-1.1 and TaPIP1 were amplified and cloned into pGBKT7 and pGADT7 to create BD-TaBI-1.1, AD-TaBI-1.1, BD-TaPIP1, and AD-TaPIP1, respectively, using an In-Fusion HD Cloning Kit (Clontech, United States) (for primer sequences, see Supplementary Table S2). Seven groups, BD-TaBI-1.1 + AD-TaPIP1, AD-TaBI-1.1 + BD-TaPIP1, AD-TaBI-1.1 + BD, BD-TaBI-1.1 + AD, AD + BD-TaPIP1, BD + AD-TaPIP1 and AD + BD, were transformed into the yeast strain AH109 and selected by growing on SD/-Trp-Leu medium at 30°C for 4 days. Surviving clones were retransferred to SD/-Trp-Leu-His-Ade medium, according to the manufacturer instructions (Clontech, United States).
Pull-Down assay
TaBI-1.1 was cloned into the prokaryotic expression vector pCOLD (Takara, Japan), and TaPIP1 was cloned into pGEX-4T-1 using an In-Fusion HD Cloning Kit (Clontech, United States) (for primer sequences, see Supplementary Table S2). GST pull-down assays was performed as described (Liu et al., 2013).
Subcellular Localization Assay
The coding sequences without terminators of TaBI-1.1 and TaPIP1 were cloned into the p16318GFP vectors (for primer sequences, see Supplementary Table S2). For the subcellular localization analysis, TaBI-1.1-GFP and mRFP-HDEL, TaPIP1-GFP and mRFP-HDEL, TaBI-1.1-GFP and TaPIP1-mRFP were co-transformed into the wheat protoplasts via polyethylene glycol-mediated transformation (Marion et al., 2008). After 12 h of incubation in the dark at 22°C, the cells were observed using a confocal laser scanning microscope.
ELISA Assay
Triplicate leaves with the weight of 0.5 g from 4-week-old seedlings were harvested and ground to fine powder in liquid nitrogen, and then, 450 μl methyl alcohol:PBS = 1:8 mixed liquor was added to the powder. The mixture was centrifuged at 12,000 rpm for 8 min at 4°C, and the supernatant was collected. For the ELISA assay, a Plant SA ELISA Kit (Rapidbio, United States) was used purified SA antibodies to coat microtiter plate wells to make solid-phase antibodies. Then, SA was added to wells, and combined SA antibodies were labeled with HRP to become an antibody-antigen-enzyme-antibody complex. After complete washing and TMB substrate solution addition, the TMB substrate became blue in HRP enzyme-catalyzed reactions. The reaction was terminated by the addition of a sulfuric acid solution, and the color change was measured spectrophotometrically at a 450 nm wavelength. The concentration of SA in the samples was determined by comparing the O.D. of the samples to the standard curve.
RNA-Seq Analysis
At least 30 leaves from 4-week-old Col-0 and transgenic line 35S::TaBI-1.1 plants were collected for RNA-seq analysis (Allwegene, Beijing). The mRNA was isolated using poly-(T)-oligonucleotide-attached magnetic beads and fragmented to 100 to 200 bases. The double-strand cDNA was synthetized from mRNA using reverse transcriptase and random hexamer primers. Then, the cDNA fragments were purified using AMPure XP beads. Through an end-repair process, the addition of a single A base, and the ligation of the adapters, cDNA libraries were created via PCR enrichment. The libraries were sequenced using the HiSeqTM2500 sequencing system according to the manufacturer instructions (Illumina, United States). Sequencing reads were mapped to the TAIR 10 Arabidopsis reference genome using TopHat1 with default parameters. The abundance of assembled transcripts was calculated in fragments per kilobase of exon model per million mapped fragments (FPKM). The TopHat and Cufflink software packages were used for the mRNAseq data analysis to identify DEGs. For the no-biological-repeat RNA-seq analysis, the readcount data needed to be standardized using TMM, and the threshold value of differentially expressed genes was | log2 (FoldChange)| > 1 and P-Adjusted < 0.005. The hierarchical clustering analysis was generated via the RPKM of differentially expressed genes of 35S::TaBI-1.1 VS Col-0. The GO terms enrichment of differentially expressed genes was conducted using the GOseq software based on the Wallenius non-central hypergeometric distribution. The top 30 enriched GO terms were shown in histograms for up-regulated and down-regulated genes. The KEGG enrichment analysis, based on pathways from the KEGG database, used a hypergeometric examination to find the enriched pathways in differentially expressed genes compared with the transcriptome background. The wheat Fg treated RNA-seq data was download from SRA database (accession number: PRJNA289545) and analyzed by BMKCloud (BIOMARKER, China).
Results
The Expression Patterns of TaBI-1.1 Were Determined via qRT-PCR and β-Glucuronidase (GUS) Staining
We analyzed the RNA-seq data from Fg-treated wheat to investigate the plant defense signaling pathway. Using the transcript count threshold for cytokinin (CK) of greater than 100 (as the control for Fg treatment, “CK1_Count,” “CK2_Count,” and “CK3_Count” represent three replicates) and the fragments per kilobase of transcript per million mapped reads (FPKM) threshold for CK of greater than 15 (“CK1_FPKM,” “CK1_FPKM,” and “CK1_FPKM” are three replicates), we isolated the top 10 differentially expressed genes from the RNA-seq analysis (Supplementary Table S1). Two wheat BI-1 genes (TRIAE_CS42_U_TGACv1_644608_AA2140670 and TRIAE_CS42_6BS_TGACv1_515717_AA1671980) were identified among the 10 genes. TRIAE_CS42_6BS_TGACv1_515717_AA1671980 was named TaBI-1 in a previous study (Wang et al., 2012). Only three BI-1 genes were screened in the wheat Ensembl database: TaBI-1, TRIAE_CS42_U_TGACv1_644608_AA2140670 and TRIAE_CS42_6AS_TGACv1_488014_AA1573990. Of the two differentially expressed BI-1 genes, TRIAE_CS42_U_TGACv1_644608_AA2140670, which was named TaBI-1.1, displayed the greatest difference in expression. TaBI-1.1 shared 99.19% identity with TaBI-1, according to the amino acid alignment. The expression level of TaBI-1.1 was up-regulated 24-fold in response to the Fg treatment compared with that in CK. Many studies on AtBI-1 have confirmed that AtBI-1 plays a pivotal role in plant resistance to biotic and abiotic stresses. The sequence of the TaBI-1.1 protein shared 69.88% identity with AtBI-1, indicating substantial conservation of this sequence in the BI-1 family (Sanchez et al., 2000). The expression patterns of TaBI-1.1 were monitored using qRT-PCR to determine the possible role of TaBI-1.1 in biotic and abiotic stresses. TaBI-1.1 expression was significantly up-regulated in response to the SA treatment and down-regulated in response to the ABA treatment. TaBI-1.1 expression peaked at ∼8-fold at 48 h after the SA treatment (Figure 1A). The level of down-regulation in response to the ABA treatment reached ∼1/5 of the initial level at 8 h (Figure 1C). In response to the NaCl treatment, the expression level declined at 4 h after a slight increase at 2 h and returned to its initial level at 8 h (Figure 1B).
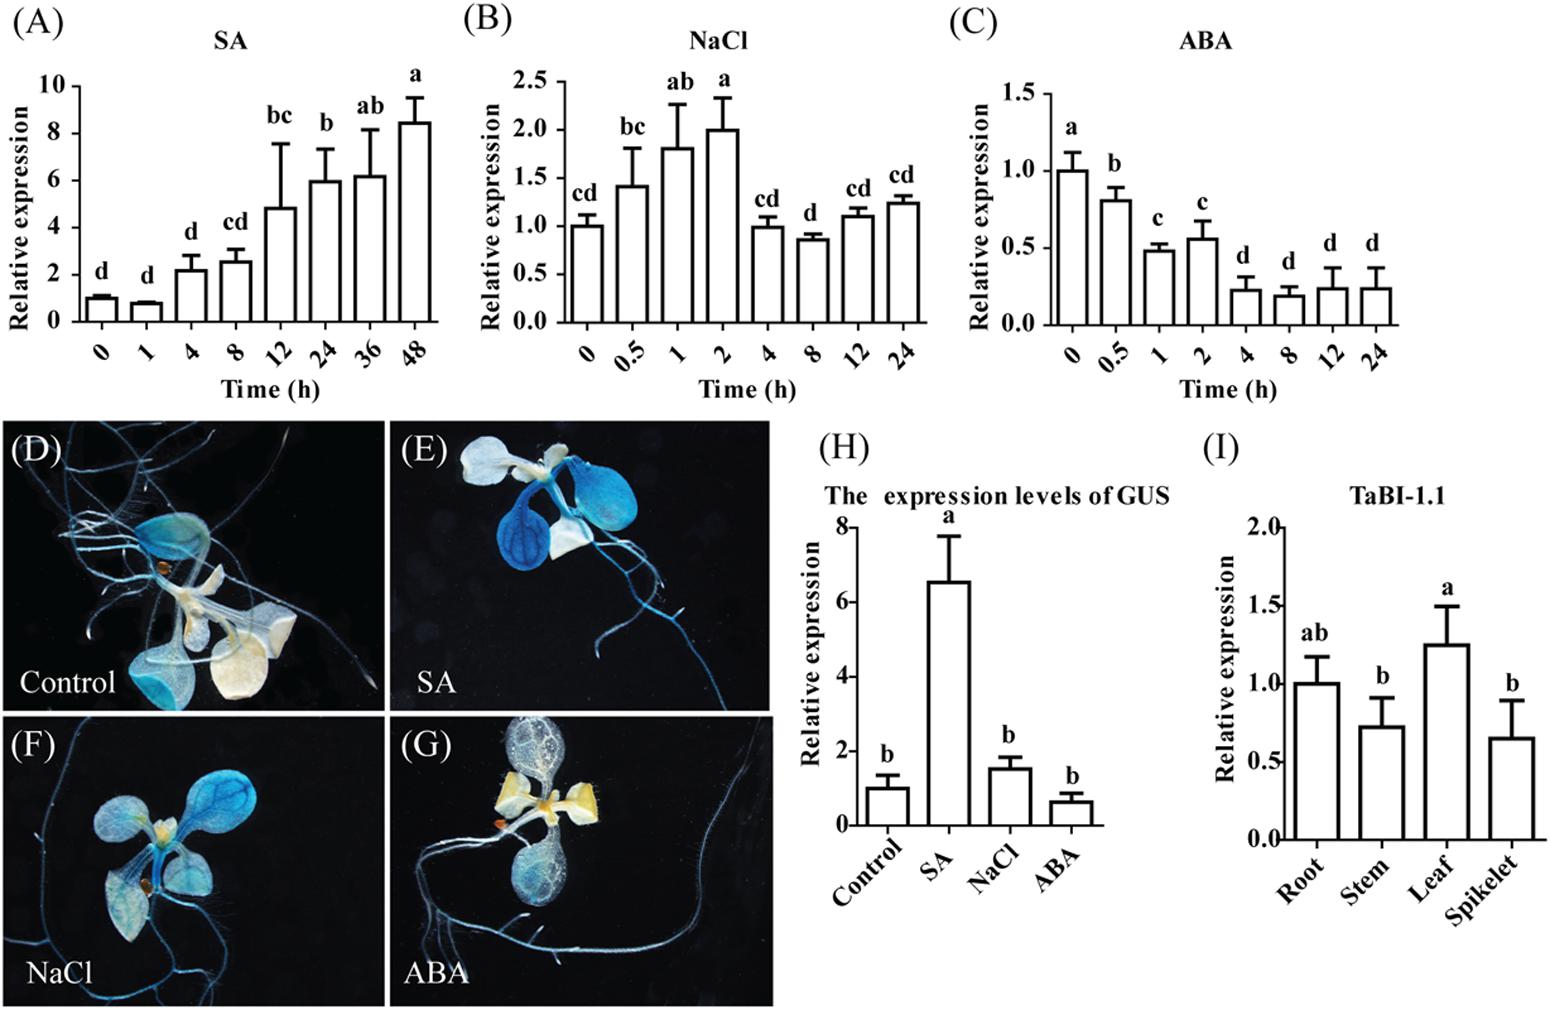
FIGURE 1. Relative and spatial expression patterns of TaBI-1.1 were evaluated by qRT-PCR and GUS staining. qRT-PCR analysis showing relative expression of TaBI-1.1 in the wheat seedlings with SA (A), NaCl (B), and ABA (C) treatments. The vertical coordinates represent fold changes, and the horizontal coordinates represent time. Wheat actin was used as a reference. (D–G) GUS staining for TaBI-1.1 expression in seedlings grown in the presence of SA, NaCl and ABA treatments. Seedlings grown under normal condition were used as the control. (H) qRT-PCR analysis of GUS expression levels in the PBI:GUS transgenic lines. The vertical coordinates represent fold changes, and the horizontal coordinates represent different treatments. Arabidopsis actin2 was used as a reference. (I) qRT-PCR analysis of the transcript levels of TaBI-1.1 in roots, stems, leaves, and spikelets wheat tissues. The vertical coordinates represent fold changes, and the horizontal coordinates represent different tissues. Wheat actin was used as a reference. Three biological replicates were taken for qRT-PCR. Error bars indicate standard deviations (SDs). All the data represent the means ± SDs of three independent biological replicates. Different letters in bar graphs indicate significant differences.
We created a PBI::GUS fusion construct that contained 1.7 kb of the TaBI-1.1 promoter and generated transgenic Arabidopsis to investigate the spatial expression pattern of TaBI-1.1. The histological GUS activity was determined using GUS staining. TaBI-1.1 expression was observed in mature leaves and roots, but not in hypocotyl and young leaves (Figure 1D). We also examined the TaBI-1.1 expression levels in various wheat tissues: roots, stems, leaves, and spikelets, and the results showed that the expression of TaBI-1.1 was ubiquitous in these wheat tissues, and it was highest in leaves and lowest in spikelets (Figure 1I). Following the SA and NaCl treatments, the expression in mature leaves was increased compared with that in the control, and higher expression was observed in response to the SA treatment. Expression was also detected in the hypocotyl upon exposure to SA and NaCl treatments (Figures 1E,F). Weaker expression was detected in the leaves of ABA-treated plants (Figure 1G). GUS expression levels were further confirmed by qRT-PCR (Figure 1H). Based on these results, TaBI-1.1 expression responded to various stresses.
Constitutive Expression of TaBI-1.1 Enhanced Resistance to Pst DC3000 Infection in Arabidopsis
Based on its up-regulation in response to Fg and SA treatments, we hypothesized that TaBI-1.1 may be involved in responses to biotic stresses. We ectopically expressed TaBI-1.1 in Arabidopsis under the control of the cauliflower mosaic virus (CaMV) 35S promoter to verify this hypothesis. Two homozygous lines with relatively high TaBI-1.1 expression levels, lines 3 and 7 (35S::TaBI-1.1#1 and 35S::TaBI-1.1#2), were selected for further analysis (Figure 2A). Four-week-old leaves of atbi1-2, Col-0, and two transgenic lines were subjected to a Pst DC3000 infection or 10 mM MgCl2 (mock). Under the mock treatment, no obviously differences were observed among leaves from atbi1-2, Col-0, and the two transgenic lines 3 days after treatment with 10 mM MgCl2 (Figure 2B). Disease symptoms were detected in these leaves 3 days after inoculation with Pst DC3000 at an optical density at 600 nm (OD600) of 0.002. The atbi1-2 mutant clearly exhibited severe symptoms, as almost all leaves showed serious chlorosis and necrosis, whereas the two transgenic lines showed milder disease symptoms than atbi1-2 and Col-0. A small portion of leaves of transgenic plants were green and did not display chlorosis and necrosis. The degree of the disease symptoms in Col-0 leaves was intermediate between atbi1-2 and the two transgenic lines (Figure 2C). The SA level was monitored at 24 h after inoculation with Pst DC3000 or 10 mM MgCl2 (mock). In the mock group, the highest SA level was observed in 35S::TaBI-1.1#1, which was significantly higher than that in Col-0. Under Pst DC3000 treatment, significantly higher SA levels were detected in the two transgenic lines compared with Col-0, and 35S::TaBI-1.1#1 contained the highest SA level among the four genotypes. The difference between Col-0 and atbi1-2 also reached a significant level (Figure 2D). The bacterial titres in leaves of atbi1-2, Col-0, and the two transgenic lines were measured at 0 and 3 dpi. No significant differences in pathogenic bacterial growth were observed among the four genotypes in the initial inoculation amount (0 dpi). At 3 dpi, the bacterial titres of the two transgenic lines were significantly lower than those of Col-0, and the bacterial titre of Col-0 was also significantly lower than that of atbi1-2, indicating that the two transgenic lines exhibited a substantial inhibition of pathogenic bacterial growth, and that atbi1-2 was more susceptible to pathogenic bacteria than Col-0 (Figure 2E). Based on the higher level of 35S::TaBI-1.1#1 in two transgenic lines, we used 35S::TaBI-1.1#1 to further detect the expression of PR1. High SA levels induce the expression of PR genes to enhance plant resistance to pathogen attack (Ohshima et al., 1990). The increase in PR1 expression may explain the enhancement of the resistance to Pst infections (Figure 2F).
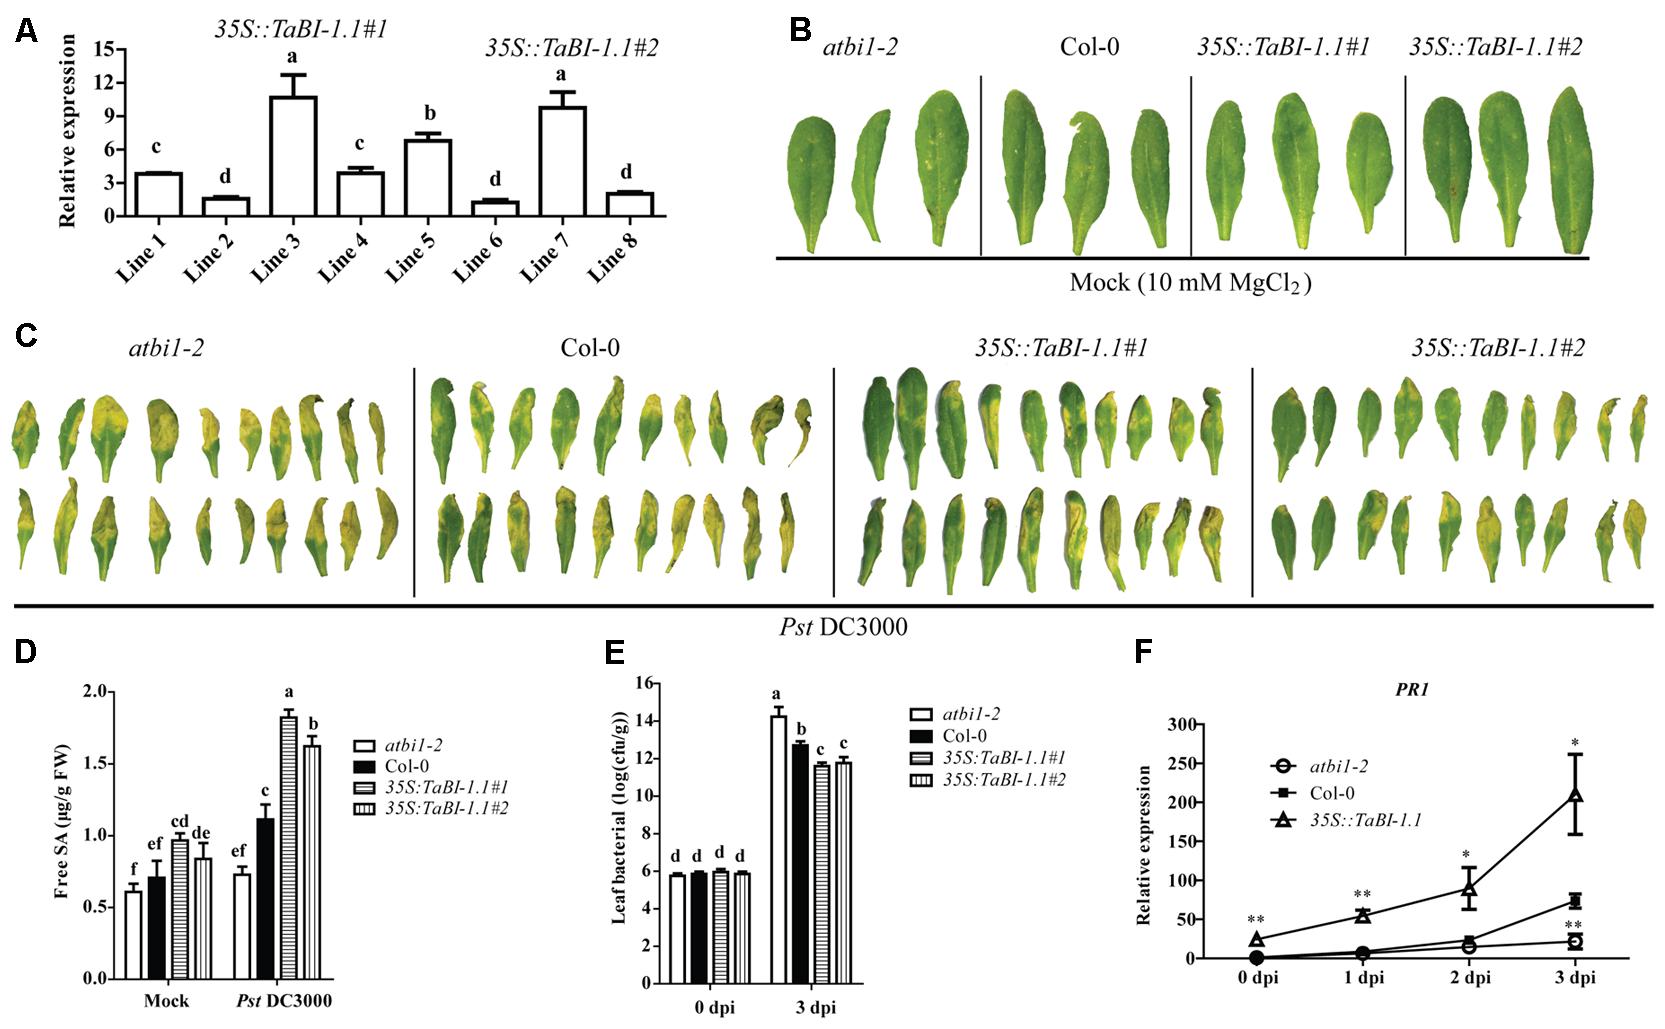
FIGURE 2. TaBI-1.1 transgenic Arabidopsis exhibited enhanced resistance to Pst DC3000. (A) qRT-PCR analysis of TaBI-1.1 transcripts in eight 35S::TaBI-1.1 transgenic lines. The line 6 with the lowest expression levels was set to “1.” Arabidopsis actin2 was used as a reference. Bacterial defense phenotypes on 4-week-old atbi1-2, Col-0, 35S::TaBI-1.1#1, and 35S::TaBI-1.1#2 plant leaves exposed to 10 mM MgCl2 (mock) (B) and Pst DC3000 (OD600 = 0.002) (C) observed at 3 dpi. (D) Free SA levels in atbi1-2, Col-0, 35S::TaBI-1.1#1, and 35S::TaBI-1.1#2 leaves exposed to 10 mM MgCl2 (mock) and Pst DC3000 (OD600 = 0.002) after 24 h. Different letters in bar graphs indicate significant differences. (E) The bacterial titre (log10) of atbi1-2, Col-0, 35S::TaBI-1.1#1, and 35S::TaBI-1.1#2 leaves at 0 and 3 dpi with Pst DC3000 (OD600 = 0.002). Different letters in bar graphs indicate significant differences. (F) qRT-PCR analysis showing the PR1 expression levels at 0, 1, 2, and 3 dpi with Pst DC3000 (OD600 = 0.002). The expression level of PR1 in Col-0 at 0 dpi was set to “1.” Arabidopsis actin2 was used as a reference. Asterisks indicate significant differences (∗P < 0.05 and ∗∗P < 0.01) compared with Col-0 (Student’s t-test). Error bars indicate SDs. All the data represent the means ± SDs of three independent biological replicates.
TaBI-1.1 Positively Regulated SA-Related Gene Expression
PR gene expression is associated with SA accumulation and systemic acquired resistance (SAR) (Wildermuth et al., 2001). We further examined SA-related genes expression in 2-week-old seedlings of Col-0, atbi1-2, and 35S::TaBI-1.1#1 grown under normal condition. Significantly higher expression levels of PR1, PR5, ICS1, and EDS1 were observed in 35S::TaBI-1.1 than in Col-0 and atbi1-2. However, no significant difference was detected between Col-0 and atbi1-2 in these genes expression levels (Figure 3). The expression levels of PR1 and PR5 in 35S::TaBI-1.1 increased ∼11- and ∼9-fold, respectively, compared with those in Col-0. The fold changes in PR2, ICS1 and EDS1 expression were lower than the changes in PR1 and PR5 expression (Figure 3). Thus, TaBI-1.1 up-regulated the expression of the PR1, PR2, PR5, ICS1 and EDS1 genes, indicating a positive role of TaBI-1.1 in SA signaling.
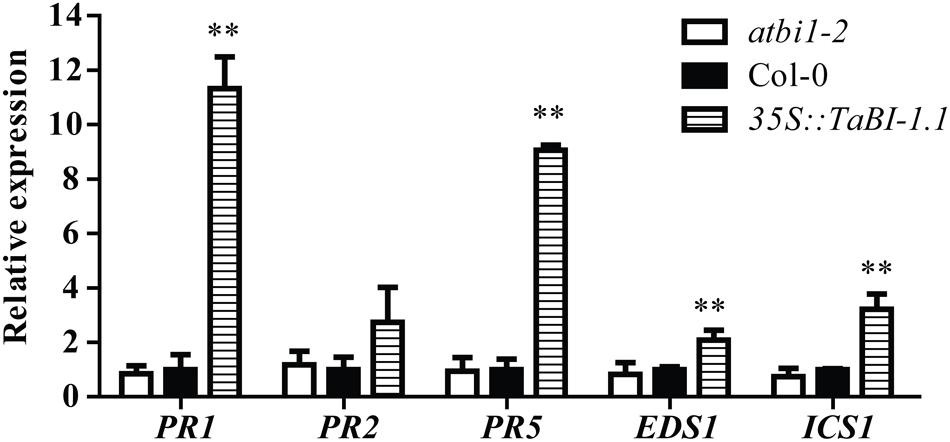
FIGURE 3. The expression levels of five SA-related genes in 2-week-old seedlings of atbi1-2, Col-0, and 35S::TaBI-1.1 transgenic Arabidopsis grown under normal condition were monitored by qRT-PCR. Arabidopsis actin2 was used as a reference. The expression levels of genes in Col-0 were set to “1.” Arabidopsis actin2 was used as a reference. Error bars indicate the SDs. The data represent the means ± SDs of three independent replicates. Asterisks indicate significant differences (∗P < 0.05 and ∗∗P < 0.01) compared with Col-0 (Student’s t-test).
TaBI-1.1 Decreased the Sensitivity to SA and ABA
Four-day-old seedlings of Col-0, atbi1-2, and 35S::TaBI-1.1 were placed in Murashige and Skoog (MS) medium containing different concentrations of SA, NaCl, and ABA to investigate the different phenotypes among Col-0, atbi1-2, and 35S::TaBI-1.1 transgenic Arabidopsis plants at the seedling stage in response to SA and other stress treatments. The morphological changes were monitored after 13 days. On MS medium without growth regulators (MS0), no significant differences in root length, lateral roots, or fresh weight were observed between any two genotypes of Col-0, atbi1-2, and two transgenic lines of 35S::TaBI-1.1 (Figures 4A,E–G). On MS medium supplemented with 30 μM SA, atbi1-2 exhibited significant differences from Col-0 in fresh weight, root length and lateral root numbers (Figures 4H–J). The lateral root numbers of 35S::TaBI-1.1#2 were also significantly different from those of Col-0 (Figure 4J). The degree of aberrant growth of Col-0 was intermediate between atbi1-2 and 35S::TaBI-1.1 plants grown on MS medium containing 30 μM SA (Figures 4H–J). High SA concentrations increase the accumulation of H2O2 and lead to oxidative damage (Horváth et al., 2007). When placed on MS medium containing 50 μM SA, seedlings showed more evident growth malformation. Based on these results, seedlings were subjected to more severe SA stress in the presence of higher SA concentrations. Leaves that had been treated with a high concentration of SA were pale green, yellowish and smaller than leaves treated with MS0 medium (Figure 4B). The root length of 35S::TaBI-1.1#1 grown on MS medium containing 50 μM SA was significantly longer than that of Col-0 (Figure 4K). The fresh weight and lateral root number of 35S::TaBI-1.1#1 were significantly increased compared with those of Col-0 (Figures 4L,M). Thus, SA not only affected the size and color of leaves but also the root length, fresh weight, and lateral root number.
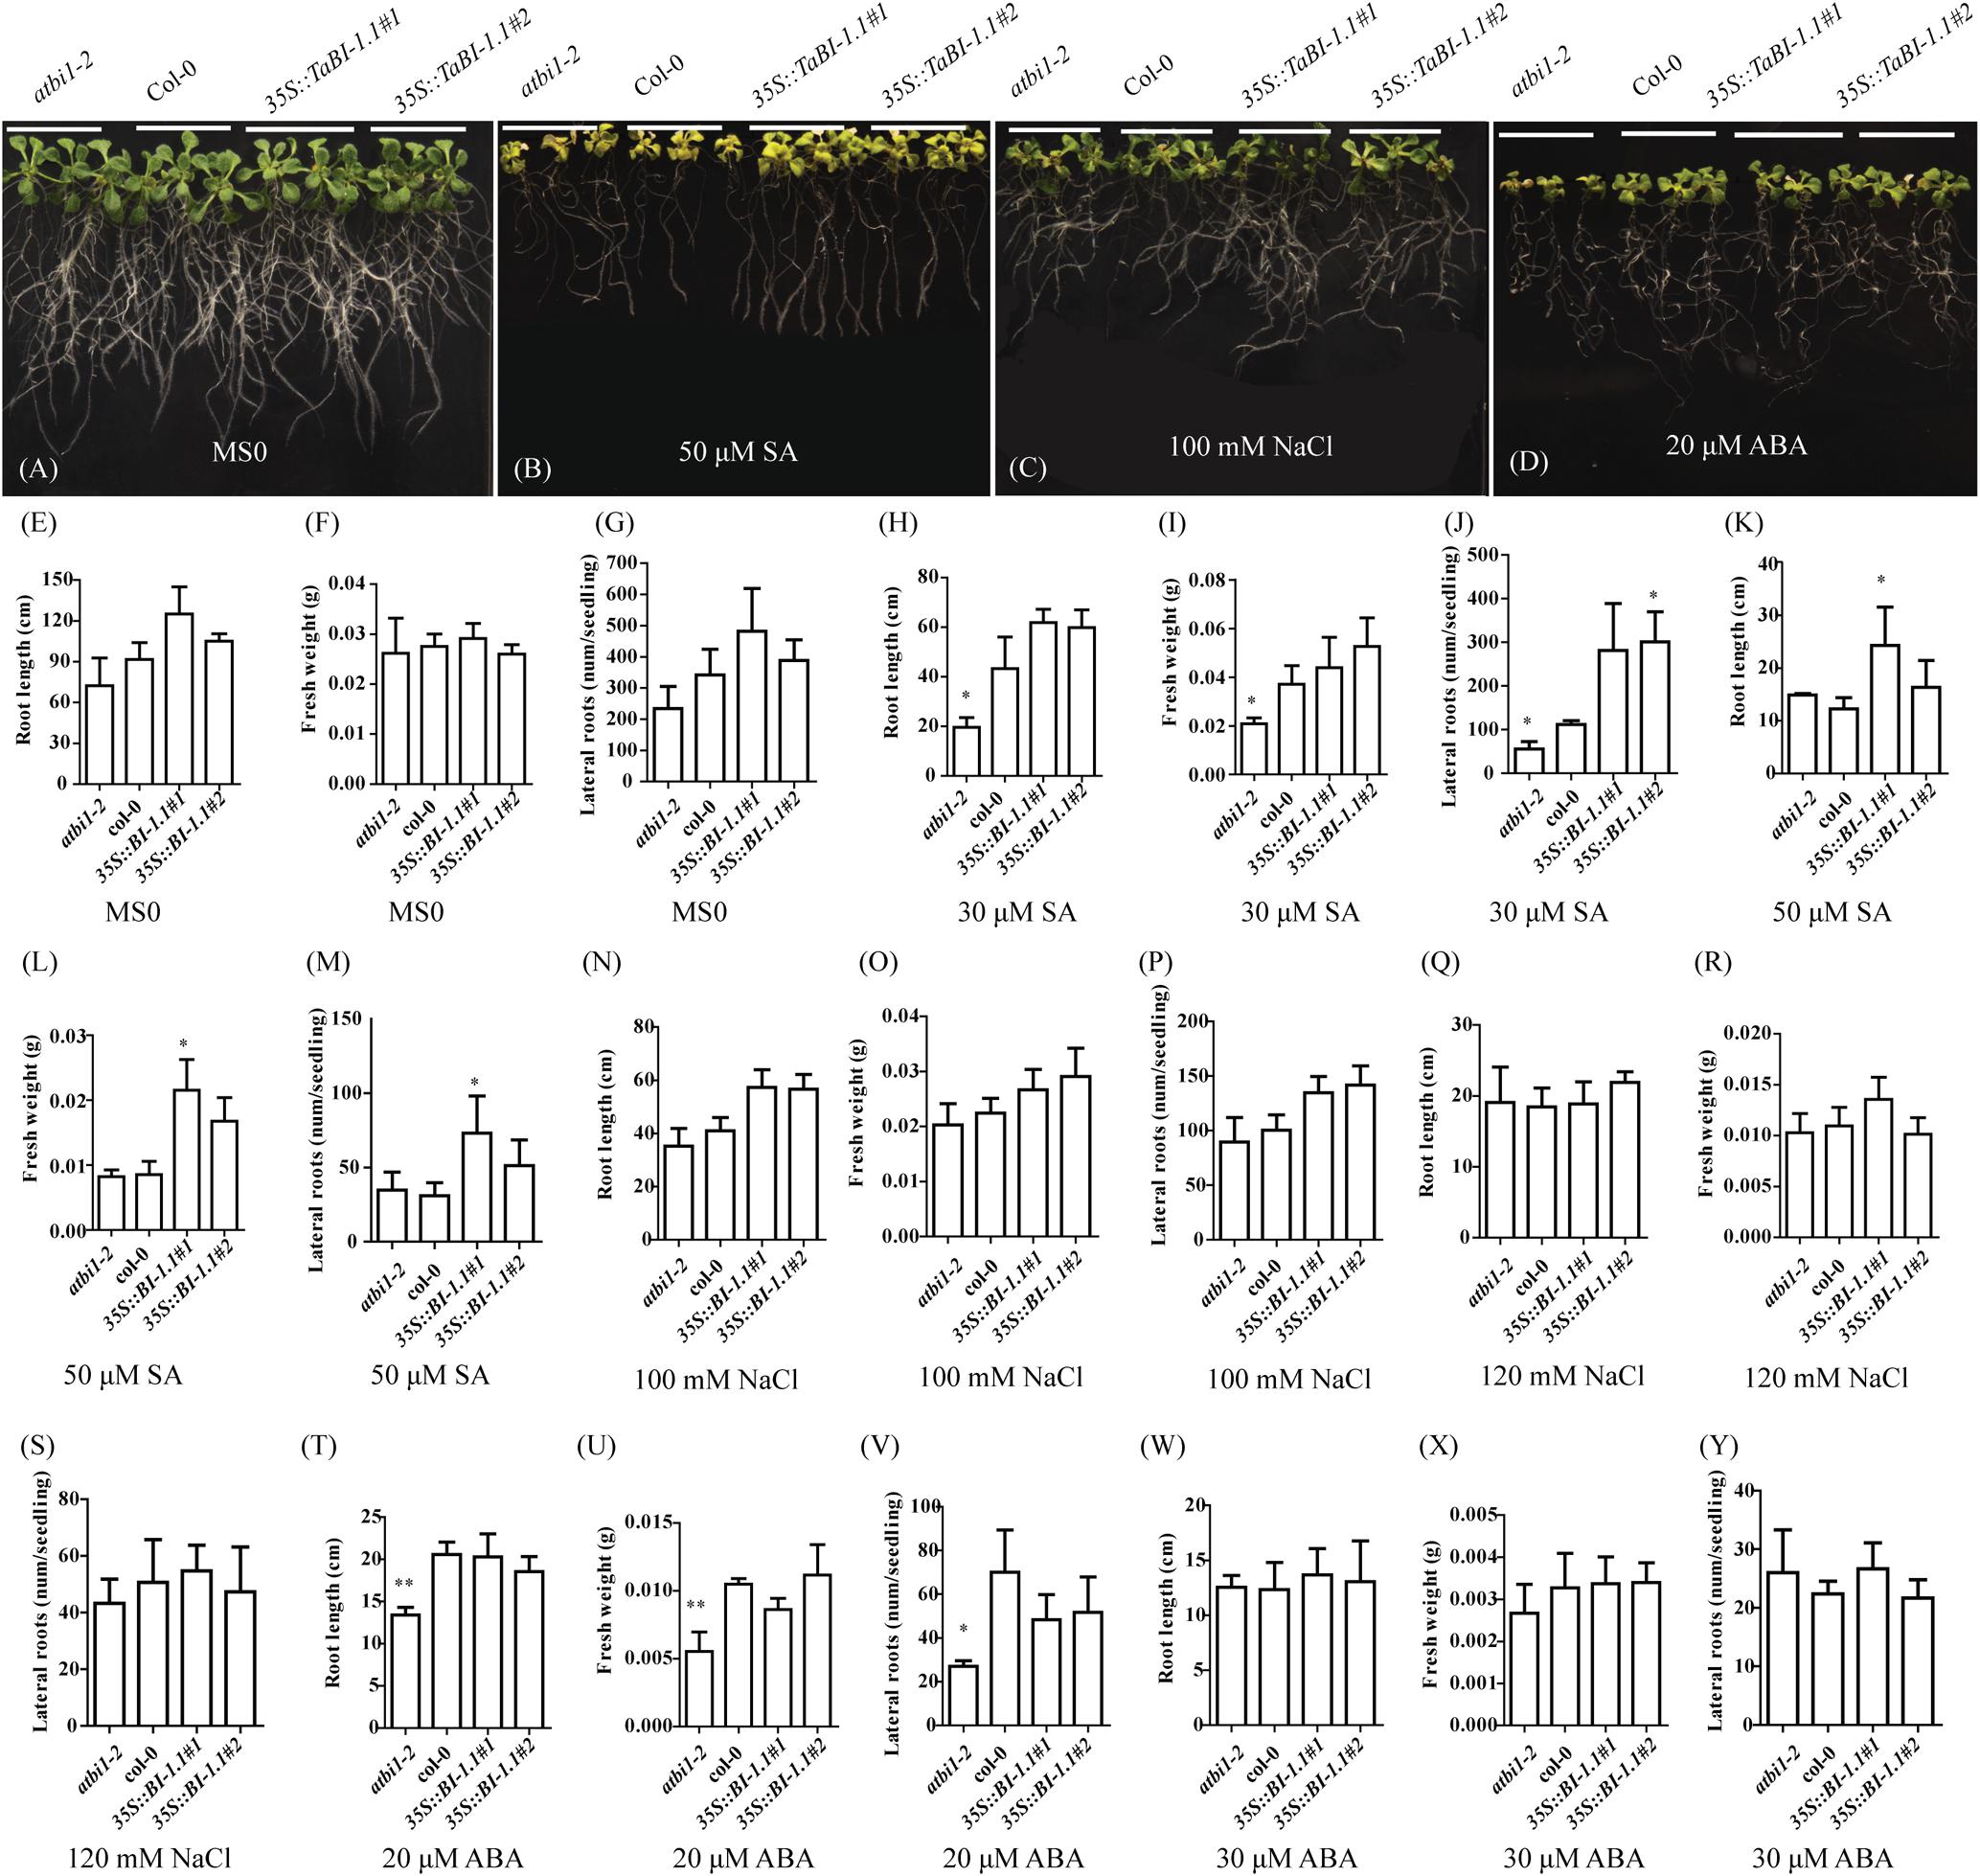
FIGURE 4. Statistical analysis of seedling root length, fresh weight, and lateral root numbers of atbi1-2, Col-0, and 35S::TaBI-1.1 transgenic Arabidopsis grown on MS media containing SA, NaCl, or ABA. Growth phenotype of atbi1-2, Col-0, and the two 35S::TaBI-1.1 transgenic seedlings on (A) MS0 medium, (B) MS medium containing 50 μM SA, (C) MS medium containing 100 mM NaCl, and (D) MS medium containing 20 μM ABA. After stratification, seedlings were grown in MS0 medium for 4 days in a horizontal position and then transported to MS media containing different concentrations of SA, NaCl, and ABA and grown for 13 days in a vertical position. These experiments were repeated with nine biological replicates, and the photographs show three representative seedlings of four genotypes. Statistical analysis of the root length of atbi1-2, Col-0, and the two 35S::TaBI-1.1 transgenic lines on MS0 (E), MS media containing 30 μM SA (H), 50 μM SA (K), 100 mM NaCl (N), 120 mM NaCl (Q), 20 μM ABA (T), and 30 μM ABA (W). Statistical analysis of the fresh weight of atbi1-2, Col-0, and the two 35S::TaBI-1.1 transgenic lines on MS0 (F), MS media containing 30 μM SA (I), 50 μM SA (L), 100 mM NaCl (O), 120 mM NaCl (R), 20 μM ABA (U), and 30 μM ABA (X). Statistical analysis of the root length of atbi1-2, Col-0, and the two 35S::TaBI-1.1 transgenic lines on MS0 (G), MS media containing 30 μM SA (J), 50 μM SA (M), 100 mM NaCl (P), 120 mM NaCl (S), 20 μM ABA (V), and 30 μM ABA (Y). Error bars indicate the SDs. The data represent the means ± SDs of nine independent biological replicates. Asterisks indicate significant differences (∗P < 0.05 and ∗∗P < 0.01) compared with Col-0 (Student’s t-test).
Additionally, we examined the phenotype of seedlings grown on NaCl- and ABA-containing MS medium. No significant differences were observed among plants grown on 100 and 120 mM NaCl-containing MS medium (Figures 4C,N–S). Following treatment with 20 μM ABA, the degree of malformation of atbi1-2 was clearly much more severe than that of Col-0 and 35S::TaBI-1.1 plants (Figure 4D). According to the statistical analyses, atbi1-2 exhibited significant differences from Col-0 in root length, fresh weight, and lateral root number, indicating greater sensitivity to ABA (Figures 4T–V). However, no obvious differences in root length, fresh weight, or lateral root numbers were observed in response to the 30 μM ABA treatment (Figures 4W–Y). Thus, TaBI-1.1 transgenic Arabidopsis exhibited decreased sensitivity to high concentrations of SA, and the atbi1-2 mutant exhibited increased sensitivity to ABA.
We further studied the sensitivity of TaBI-1.1 to ABA during germination. The percentage of germinated seeds was recorded every 12 h on medium with different concentrations of ABA. On MS0 medium, Col-0, atbi1-2, and 35S::TaBI-1.1 transgenic Arabidopsis plants showed similar germination rates (Figure 5A). On medium containing 0.5 μM ABA, the two transgenic lines germinated significantly faster than Col-0 and atbi1-2 (Figure 5B). No significant difference was observed on medium containing 1 μM ABA (Figure 5C). On medium containing 2 μM ABA, Col-0 and the two transgenic lines also germinated slightly faster than atbi1-2 (Figure 5D). Based on these results, TaBI-1.1 transgenic Arabidopsis exhibited decreased sensitivity to ABA.
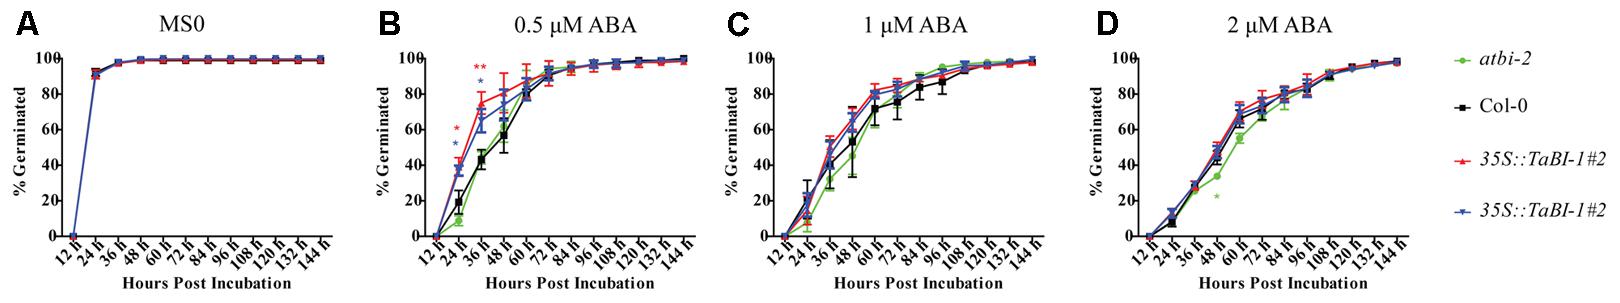
FIGURE 5. TaBI-1.1 transgenic Arabidopsis exhibit decreased sensitivity to ABA during germination. Germination of atbi1-2, Col-0, and 35S::TaBI-1.1 transgenic Arabidopsis on MS0 medium (A) or medium containing 0.5 μM ABA (B), 1 μM ABA (C), or 2 μM ABA (D). The vertical coordinates represent the percentages of germinated seeds, and the horizontal coordinates represent hours post-incubation. The number of germinated seeds was recorded every 12 h post-incubation. Error bars indicate the SDs. The data represent the means ± SDs of three independent biological replicates. Asterisks indicate significant differences (∗P < 0.05 and ∗∗P < 0.01) compared with Col-0 (Student’s t-test).
RNA-Seq Analysis of the Constitutive Expression of TaBI-1.1 in Arabidopsis
We conducted an RNA-seq analysis of 35S::TaBI-1.1#1 and Col-0 plants to obtain a better understanding of TaBI-1.1 function. Forty-eight up-regulated genes and 58 down-regulated genes were identified and used to create a heat map (Supplementary Figure S1). Based on the fold change [false discovery rate (FDR) ≤ 0.05], differentially expressed genes were categorized into functional groups using Gene Ontology (GO) analyses. More than 30 functionally enriched GO terms were identified for up-regulated and down-regulated genes, and the top 30 enriched GO terms were shown in Figure 6. For up-regulated genes, the distribution of enriched GO terms focused on biological processes related to resistance to biotic stresses, the cellular immune response, and SA synthesis and metabolism. The top 10 key GO terms were defense response, response to an external stimulus, response to a biotic stimulus, response to an external biotic stimulus, multi-organism process, response to another organism, defense response to another organism, response to stress, single-organism metabolic process, and response to chemicals (Figure 6A). For down-regulated genes, the distribution of enriched GO terms focused on the cellular components, and the top three terms were cellular components, membrane, and cell periphery (Figure 6B). No substantially enriched GO terms were related to biological processes. Seven up-regulated genes and three down-regulated genes were selected for qRT-PCR experiments to verify the accuracy of the RNA-seq analysis. These genes include PLANT CADMIUM RESISTANCE 1 (PCR1), CELL WALL-ASSOCIATED KINASE 1 (WAK1), LATE UPREGULATED IN RESPONSE TO HYALOPERONOSPORA PARASITICA (LURP1), PR1, LIPOXYGENASE 2 (LOX2), PEROXIDASE 34 (PRX34), HOMOLOG OF RPW8 4 (HR4), INDOLE-3-ACETIC ACID INDUCIBLE 19 (IAA19), GAST1 PROTEIN HOMOLOG 4 (GASA4), and PLASMA MEMBRANE INTRINSIC PROTEIN 3 (PIP3). The qRT-PCR results were consistent with the RNA-seq analysis. Higher expression levels of PCR1, WAK1, LURP1, PR1, LOX2, PRX34, and HR4 were detected in 35S::TaBI-1.1 plants than in Col-0 and were increased by 4.9-, 3.3-, 2.6-, 7.9-, 33-, 1.7- and 1.7-fold, respectively (Figure 6C). Lower expression levels of GASA4, IAA19, and PIP3 were detected in 35S::TaBI-1.1 plants than in Col-0, reaching 0.7-, 0.3- and 0.6-fold, respectively (Figure 6D).
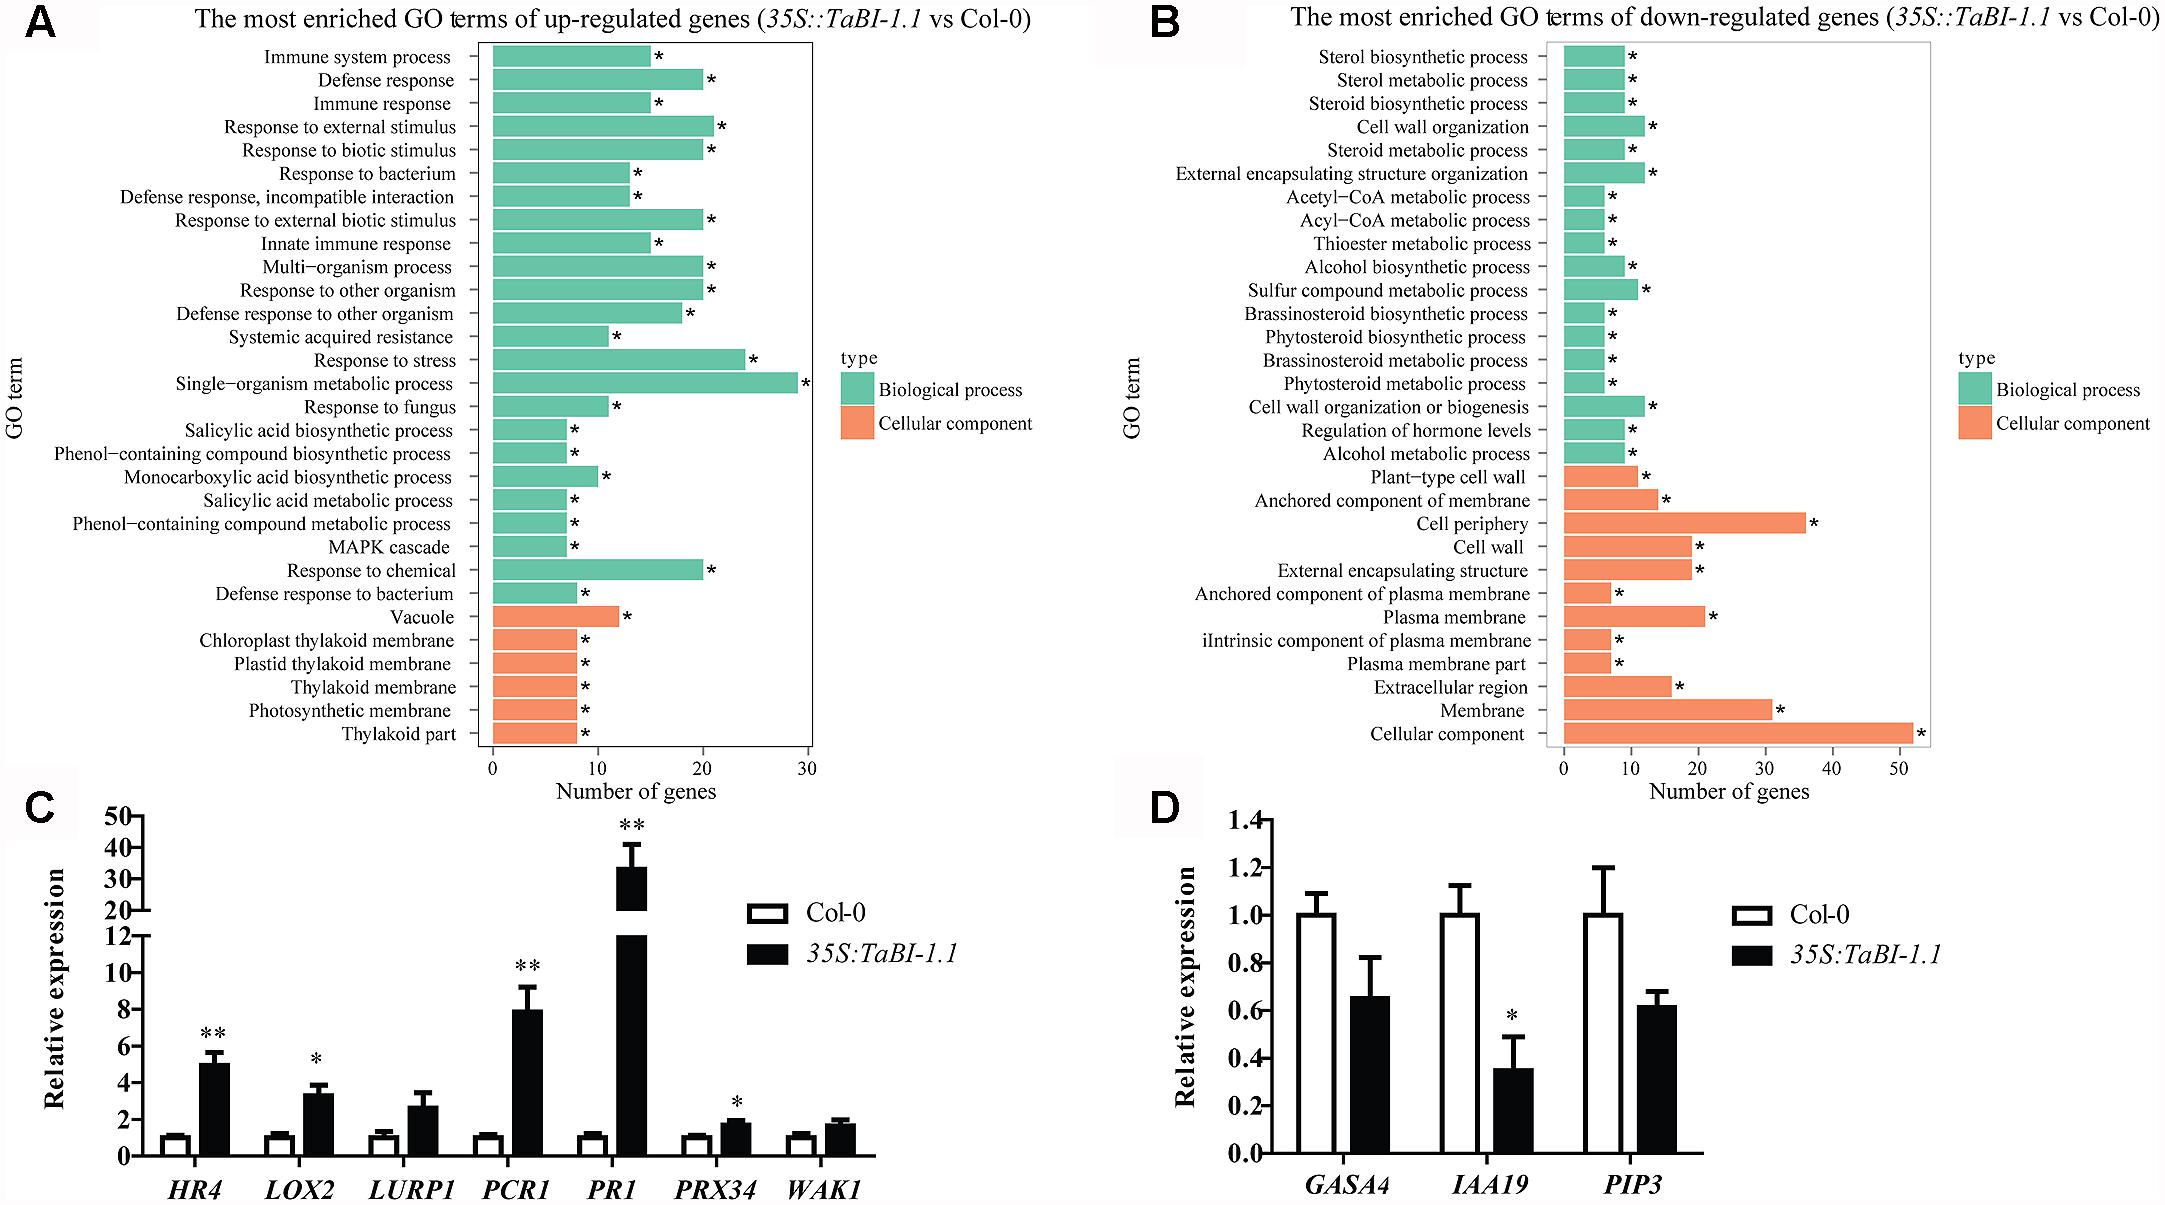
FIGURE 6. The enrichment of GO terms for genes that were differentially expressed between 35S::TaBI-1.1 and Col-0 was analyzed using RNA-seq. The most enriched GO terms of up-regulated genes (A) and down-regulated genes (B) in 35S::TaBI-1.1 compared with Col-0 (35S::TaBI-1.1 vs. Col-0). Vertical coordinates represent enriched GO terms, and horizontal coordinates represent the numbers of differentially expressed genes for these GO terms. The green columns represent the GO terms for biological processes, and the orange columns represent the GO terms for cellular components. The asterisk “∗” indicates significantly enriched GO terms. (C) qRT-PCR analysis of seven up-regulated genes in 35S::TaBI-1.1 vs. Col-0. (D) qRT-PCR analysis of three down-regulated genes in 35S::TaBI-1.1 vs. Col-0. Vertical coordinates represent fold changes, and horizontal coordinates represent different genes. The relative expression levels of 10 genes in Col-0 were set to “1.” Arabidopsis actin2 was used as a reference. Error bars indicate the SDs. The data represent the means ± SD of three biological replications. Asterisks (∗ and ∗∗) indicate significant differences (P < 0.05 and P < 0.01) compared with Col-0 (Student’s t-test).
A Kyoto Encyclopaedia of Genes and Genomes (KEGG) enrichment analysis of differentially expressed genes was presented as a scatter diagram. The enrichment factor, q-value, and the number of genes that were enriched in a pathway were used to measure the degree of enrichment. A greater enrichment factor represents a higher degree of enrichment. More than 20 KEGG-enriched pathways were observed for up-regulated genes. The top 20 enriched pathways for the up-regulated genes were shown, with photosynthesis as the most obvious enriched pathway (Figure 7A). The enrichment factor for photosynthesis reached 0.09, and the q-value was approximately 0. In contrast, the KEGG-enriched pathways for the down-regulated genes were not as obvious, and only six pathways with lower enrichment factors were identified in the KEGG enrichment analysis (Figure 7B). Thus, TaBI-1.1 was involved in responses to biotic stresses and performed its defense function mainly by up-regulating gene expression.
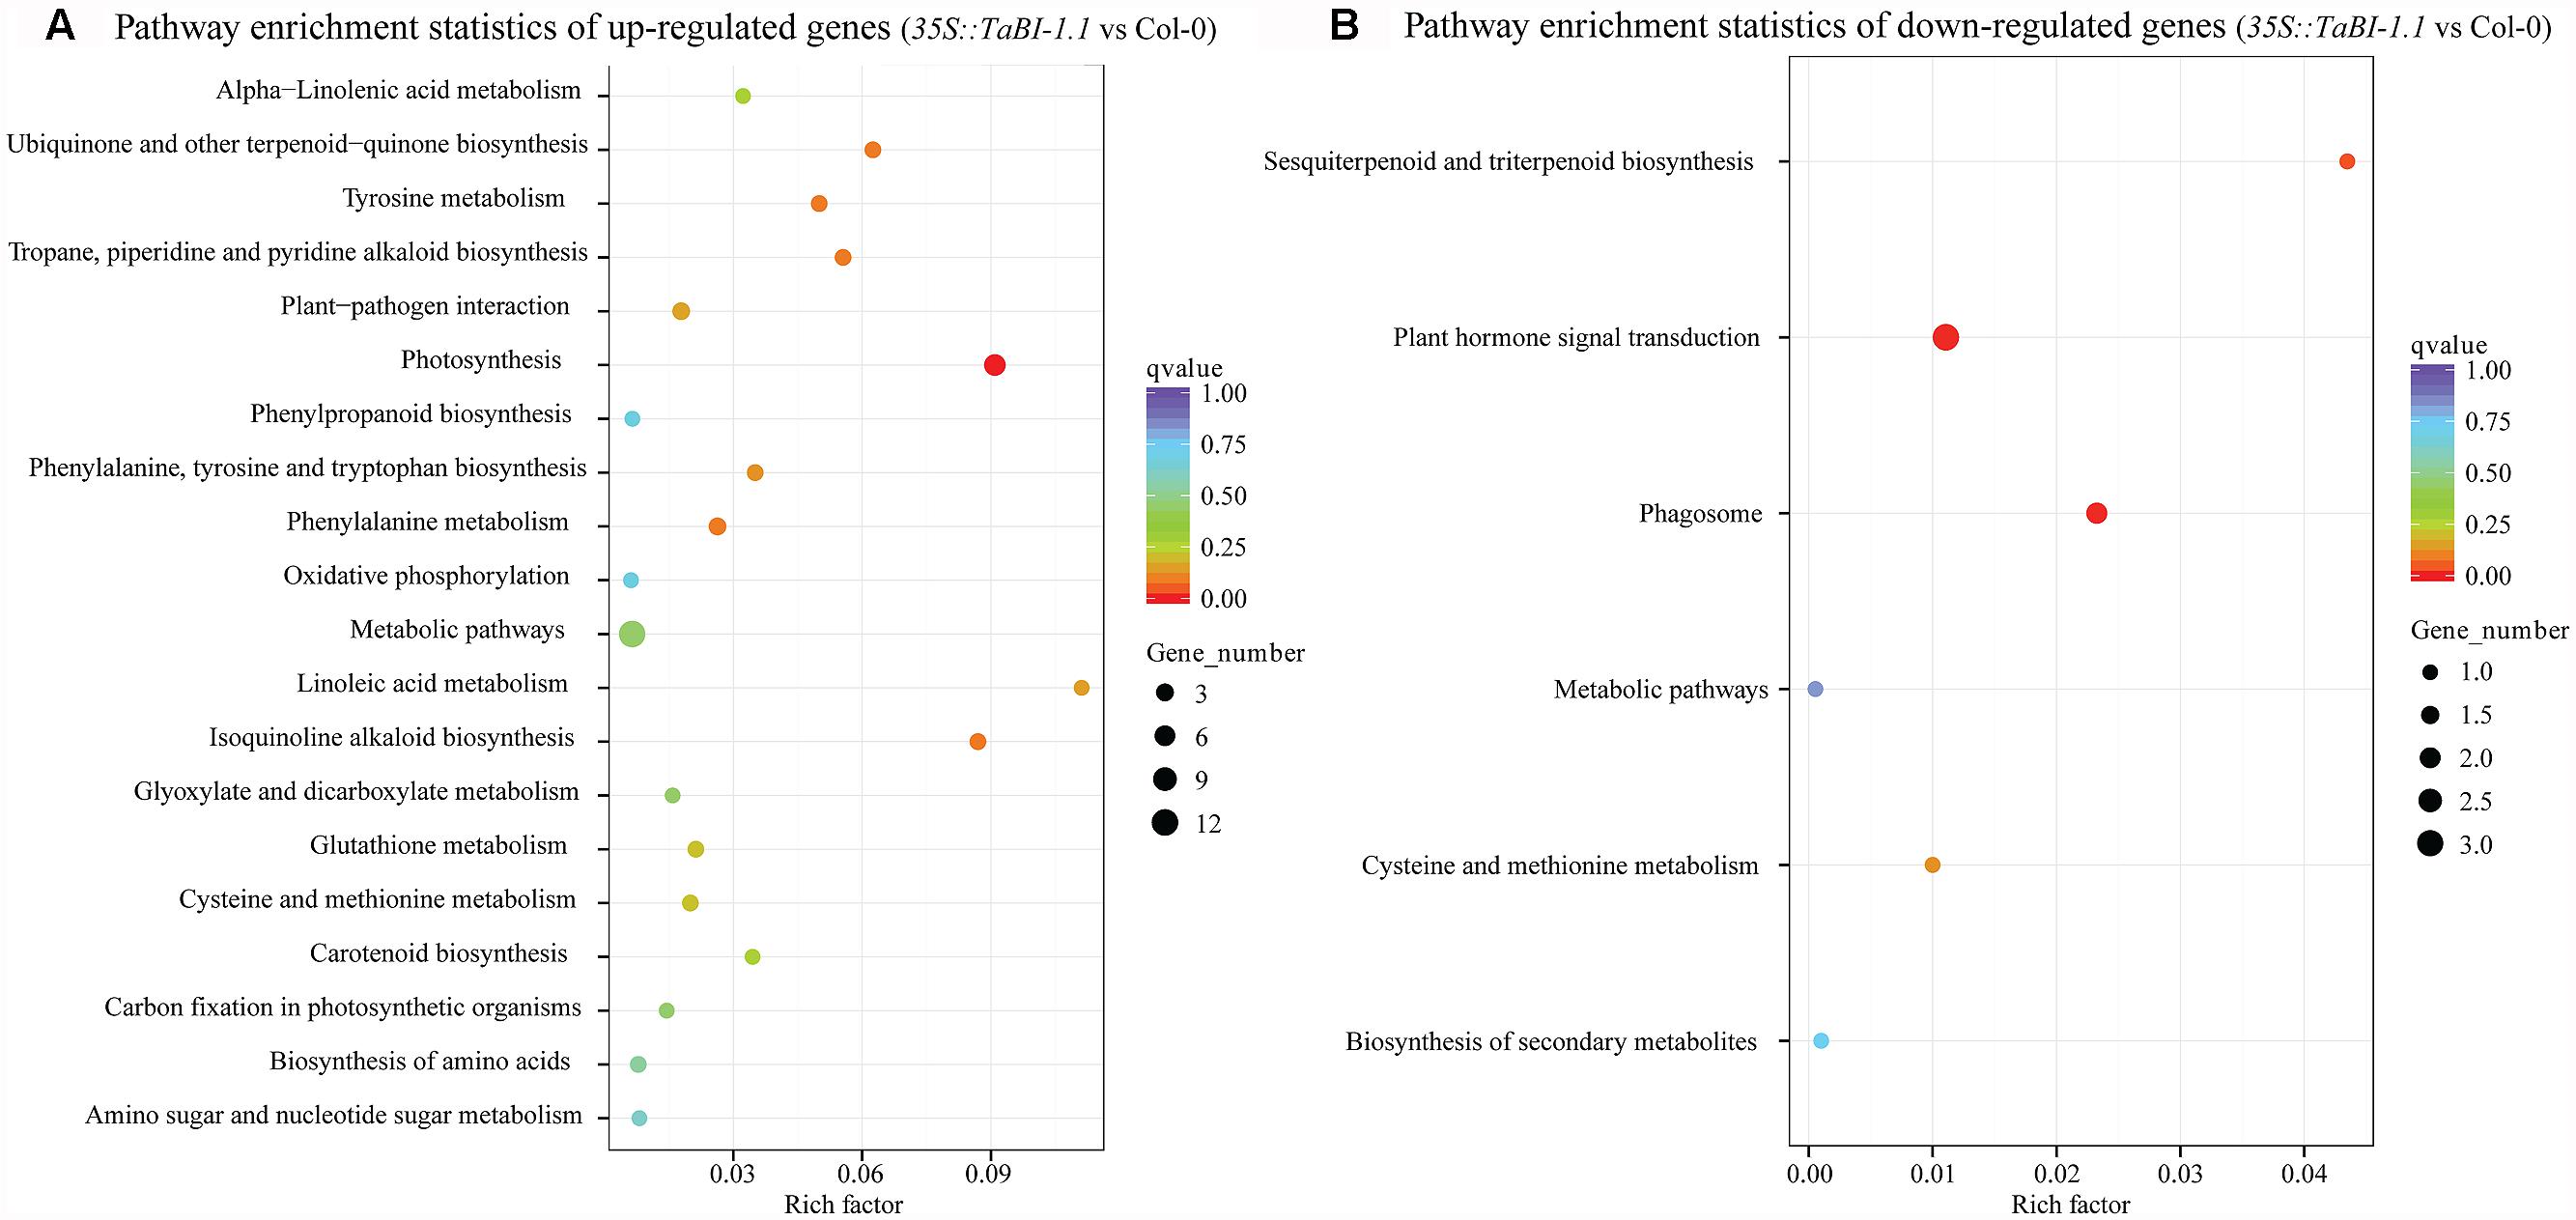
FIGURE 7. KEGG enrichment analysis of differentially expressed genes between 35S::TaBI-1.1 and Col-0. The pathway enrichment statistics of up-regulated genes (A) and down-regulated genes (B) in 35S::TaBI-1.1 vs. Col-0. Vertical coordinates represent enriched pathways, and horizontal coordinates represent enrichment factors. The size of each point represents the number of differentially expressed genes in the pathway, and the color of the point represents the q-value.
TaBI-1.1 Interacted with TaPIP1 and Was Co-localized with TaPIP1 at the ER Membrane
TaBI-1.1 was placed in the PGBKT7 (BD) vector and used as the bait protein to screen a wheat cDNA library in the yeast two-hybrid assay to further explore the cellular mechanisms by which TaBI-1.1 regulates the stress response. As a result, one candidate interacting partner was identified, the aquaporin TaPIP1. Yeast two-hybrid and pull-down assays were used to determine the interaction between TaBI-1.1 and TaPIP1 in vivo and in vitro.
A BD vector fusing TaBI-1.1 (BD-TaBI-1.1) and a pGADT7 (AD) vector fusing TaPIP1 (AD-TaPIP1) were transformed into yeast cells. Only the yeast cells transformed with BD-TaBI-1.1 and AD-TaPIP1 were able to grow on a selective medium that lacked Trp, Leu, His, and Ade (SD/-Trp-Leu-Ade-His). In contrast, the transformants expressing BD-TaBI-1.1 and AD, BD and AD-TaPIP1 or BD and AD did not grow on the SD/-Trp-Leu-Ade-His medium. Switching the fusion vectors of TaBI-1.1 and TaPIP1 yielded the same results, indicating that TaBI-1.1 interacted with TaPIP1 in yeast cells (Figure 8A). The interaction was further confirmed using a pull-down assay (Figure 8B). TaBI-1.1 was cloned into the pColdTM TF expression vector to produce the recombinant protein TF-His-TaBI-1.1 in E. coli. The recombinant GST (glutathione S-transferase)-TaPIP1 protein was successfully produced in E. coli by cloning the sequence into the pGEX-4T-1 vector. In vitro pull-down assays showed that TF-His-TaBI-1.1 physically interacted with GST-TaPIP1, as shown in western blots using anti-His antibodies (Figure 8B).
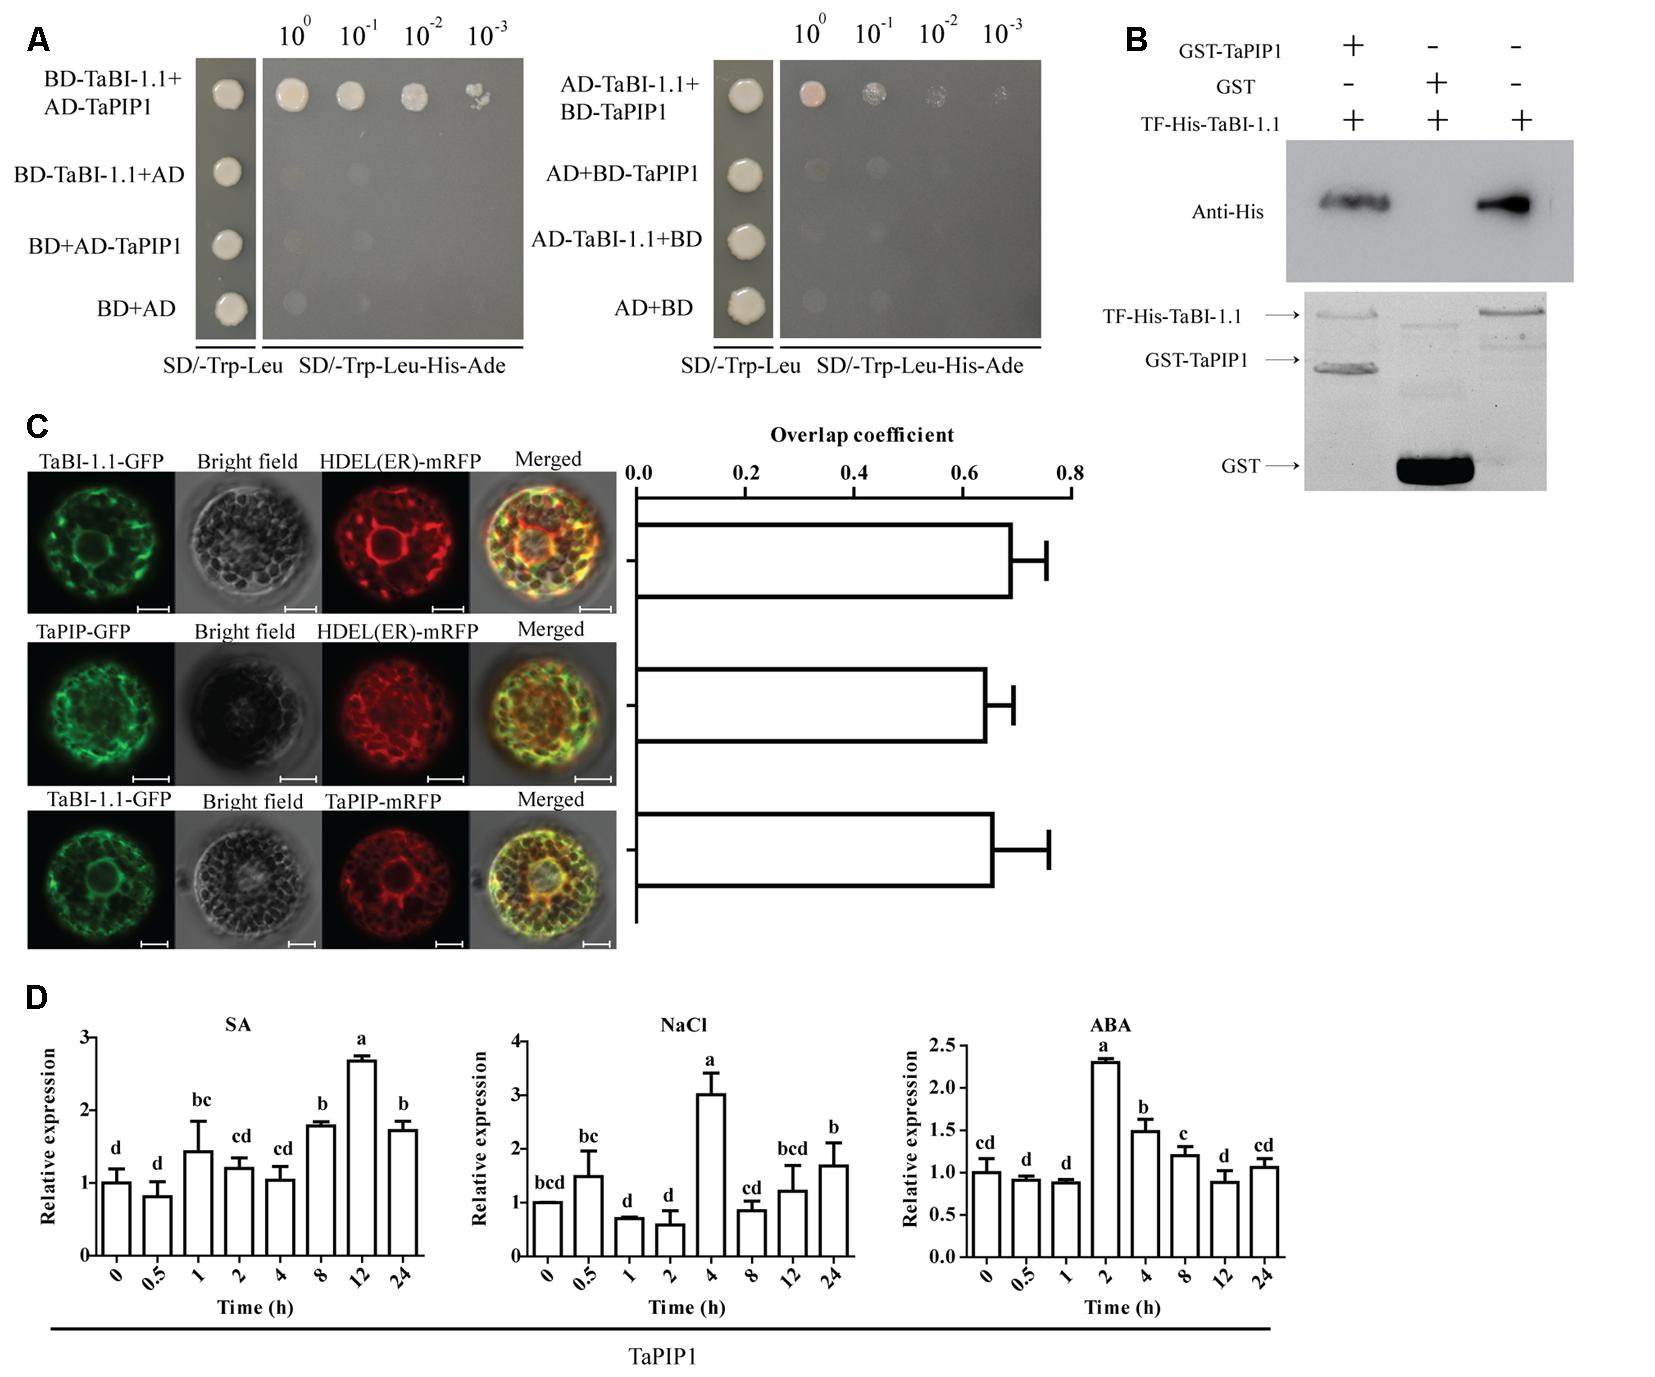
FIGURE 8. The interaction and subcellular localization of TaBI-1.1 and TaPIP1. (A) The interaction between TaBI-1.1 and TaPIP1 was measured using the yeast two-hybrid assay. Seven vector combinations were co-transformed into the yeast AH109 strain, and transformants were placed on SD/-Trp-Leu-His-Ade medium and grown for 4 days. (B) The interaction between TaBI-1.1 and TaPIP1 was measured using a pull-down assay. A western blot with an anti-His antibody was used to detect interactions, and the interaction between TF-His-TaBI-1.1 and GST was used as a control. (C) Co-localizations between TaBI-1.1-GFP and mRFP-HDEL, TaPIP1-GFP and mRFP-HDEL, TaBI-1.1-GFP and TaPIP1- mRFP in wheat protoplasts. The left panel shows the fluorescence of GFP, mRFP and the merged image. The right panel shows the levels of co-localization calculated from overlap coefficients obtained from at least 10 individual protoplasts. (D) Expression profiles of TaPIP1 after SA, NaCl, and ABA treatments for 0, 0.5, 1, 2, 4, 8, 12, and 24 h. Wheat actin was used as a reference. Vertical coordinates represent fold changes, and horizontal coordinates represent different time periods. Error bars indicate the SDs. The results represent the means ± SDs of three biological replicates. Different letters in bar graphs indicate significant differences.
AtBI-1 is localized to the ER membrane (Watanabe and Lam, 2009). We detected the co-localization of TaBI-1.1-GFP and mRFP-HDEL (an ER marker) in wheat protoplasts to determine the subcellular localization of TaBI-1.1 (Gomord et al., 1997). The overlap coefficient of GFP and mRFP fluorescence was 0.69, indicating that TaBI-1.1 was co-localized with HDEL at the ER membrane (Figure 8C). In view of the interaction between TaBI-1.1 and TaPIP1, we also detected co-localization between TaPIP1-GFP and mRFP-HDEL and co-localization between TaBI-1.1-GFP and TaPIP1-mRFP in wheat protoplasts (Figure 8C). The results showed that TaBI-1.1 and TaPIP1 were co-localized to the ER membrane.
The expression levels of TaPIP1 in response to multiple treatments were monitored by qRT-PCR. TaPIP1 expression was up-regulated by SA, NaCl and ABA treatments, reaching peak expression levels of ∼2.7-fold at 12 h, ∼3-fold at 4 h and ∼2.3-fold at 2 h, respectively, implying that TaPIP1 was probably involved in responses to biotic and abiotic stresses (Figure 8D).
TaPIP1 Increased the Resistance to Pst DC3000 Infection in Arabidopsis
To further investigate the potential functions of the interaction between TaBI-1.1 and TaPIP1, we generated the transgenic Arabidopsis that constitutively expressing TaPIP1 under the control of the CaMV 35S promoter. We selected two independent transgenic lines, lines 1 and 4 (35S::TaPIP1-1 and 35S::TaPIP1-2), with higher expression levels of TaPIP1 as confirmed by transcript analysis using qRT-PCR (Figure 9A). Based on the amino acids sequence analysis, AtPIP1;4 shares the highest identity with TaPIP1 in Arabidopsis and is required for cytoplasmic import of apoplastic H2O2 induced by the bacterial pathogen (Tian et al., 2016). In view of the up-regulation of TaPIP1 levels under SA treatment, we speculated that TaPIP1 may be also involved in response to pathogen infection. To test this idea, we examined the leaves phenotypes of TaPIP1 transgenic Arabidopsis under Pst DC3000 infection. Under the mock treatment, no differences were observed among leaves from Col-0 and the two transgenic lines (Figure 9B). After inoculation with Pst DC3000, we found obvious chlorotic symptoms on the leaves of Col-0, in contrast, chlorotic symptoms of two transgenic plants were milder (Figure 9C). To further confirm the increased resistance in TaPIP1 transgenic Arabidopsis, we measured the bacterial titer in leaves at 0 and 3 dpi. As shown in Figure 9D, there were no significant differences among Col-0 and the two transgenic lines in the initial inoculation amount, however, the bacterial titer was significantly lower in two TaPIP1 transgenic Arabidopsis compared with Col-0 at 3 dpi, indicating that pathogenic bacterial growth was greatly inhibited in TaPIP1 transgenic Arabidopsis. Therefore, TaBI-1.1 and TaPIP1 exhibited similar roles in response to Pst DC3000 infection, and we speculated that the interaction between TaBI-1.1 and TaPIP1 was probably involved in defense response.
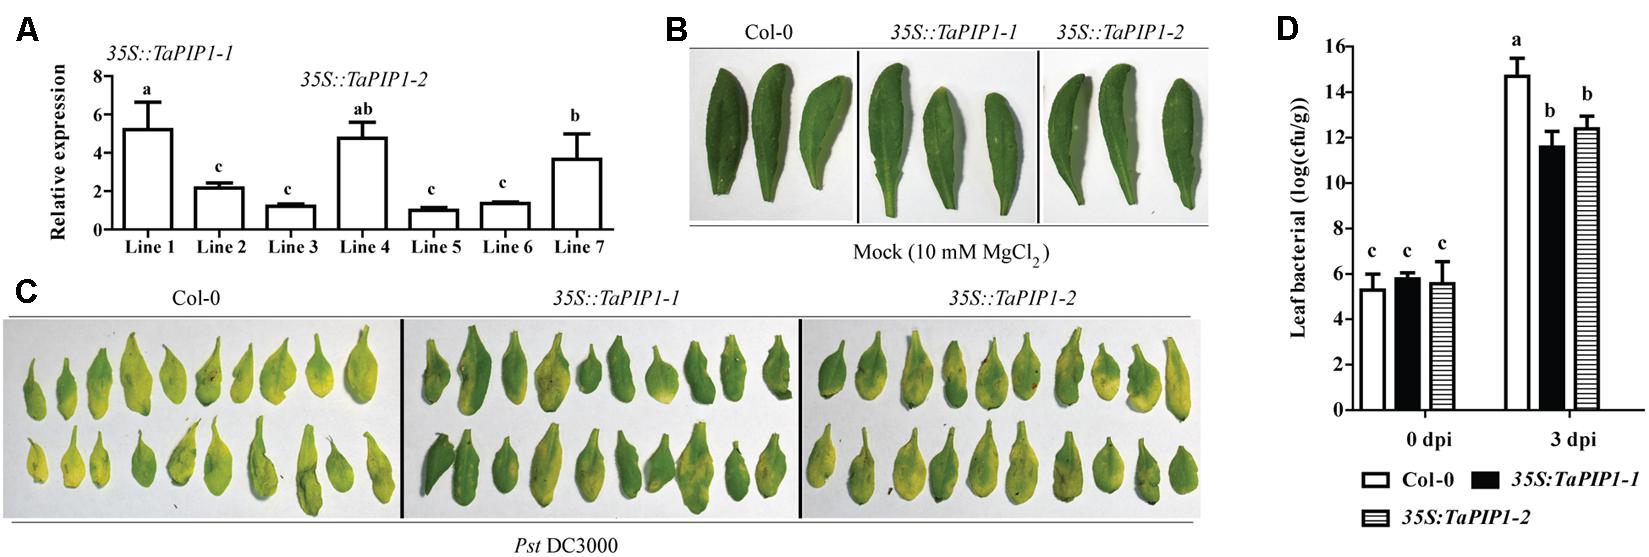
FIGURE 9. TaPIP1 transgenic Arabidopsis exhibited enhanced resistance to Pst DC3000. (A) qRT-PCR analysis of TaPIP1 transcripts in seven 35S::TaPIP1 transgenic lines. The line 5 with the lowest expression level was set to “1.” Bacterial defense phenotypes on 4-week-old Col-0, 35S::TaPIP1-1, and 35S::TaPIP1-2 plant leaves exposed to 10 mM MgCl2 (mock) (B) and Pst DC3000 (OD600 = 0.002) (C) observed at 3 dpi. (D) The bacterial titre (log10) of Col-0, 35S::TaPIP1-1, and 35S::TaPIP1-2 leaves at 0 and 3 dpi with Pst DC3000 (OD600 = 0.002). Arabidopsis actin2 was used as a reference. Error bars indicate SDs. The data represent the means ± SDs of three independent biological replicates. Different letters in bar graphs indicate significant differences.
Discussion
Salicylic acid is a key signal in disease resistance, inducing local acquired resistance (LAR) and SAR, and leads to the increased expression of many defense proteins, including PR proteins. The expression of PR genes is positively correlated with SA accumulation and pathogen resistance. PR1 is one of the most important marker genes in SA-mediated disease resistance. In this study, TaBI-1.1 transgenic Arabidopsis showed a higher SA level, higher PR1 expression level, and enhanced resistance to Pst DC3000 (Figure 2). SA biosynthetic process and SA metabolic process among the GO terms were significantly enriched in the RNA-seq analysis (Figure 7). Thus, TaBI-1.1 positively regulates the SA signal and modulates the SA-mediated immune response. PR1 expression was slightly increased in the atbi1-2 mutant following treatment with Pst DC3000, and the extent of the increase of PR1 expression in atbi1-2 was significantly lower than that in Col-0 (Figure 2F). The SA level in atbi1-2 was also lower than that in Col-0 under the Pst DC3000 treatment. These results support the hypothesis that atbi1-2 increases the susceptibility to Pst DC3000 (Figure 2C), suggesting that AtBI-1 may also be involved in SA-mediated resistance to Pst DC3000 and that TaBI-1.1 may be conserved with Arabidopsis BI-1 and plays a role in the immune response. However, no significant differences in PR1 expression and SA levels were observed between atbi1-2 and Col-0 under mock treatment or at 0 dpi (Figure 2). Considering the increase in PR1 expression and SA levels in TaBI-1.1 transgenic Arabidopsis, we suggest that PR1 is not modulated by AtBI-1 alone and that many other interactions may compensate for the deficiency caused by the deletion of AtBI-1 in atbi1-2 plants. This compensatory mechanism may be the reason why no significant differences were detected between atbi1-2 and Col-0 plants in the control group. TaBI-1 is involved in the response to Pst. TaBI-1.1 expression was intensely induced in wheat in response to the Fg treatment, and it enhanced the resistance to Pst DC3000 in Arabidopsis (Figure 2). Thus, TaBI-1 may exhibit broad-spectrum pathogen resistance.
In plants, SA is synthesized in plastids from chorismate via two routes. One route is mediated by ICS, which is believed to be responsible for >90% of SA synthesized during the activation of the stress response. The other route uses the phenylalanine ammonia-lyase (PAL)-mediated pathway (Kumar, 2014). Arabidopsis encodes two ICS enzymes, ICS1 and ICS2. SA production and pathogen resistance are severely compromised in mutants lacking functional ICS1 (Nawrath and Métraux, 1999). EDS1 is not only required for SA biosynthesis but also promotes the cell death program characteristic of the HR. The absence of EDS1 strongly reduces the HR lesion size and ROS accumulation (Rustérucci et al., 2001). In our study, the expression levels of ICS1, EDS1, and PR genes were significantly up-regulated in TaBI-1.1 transgenic Arabidopsis compared with the levels in Col-0 plants in the control group, indicating that TaBI-1.1 enhanced SA synthesis (Figure 3). The SA level in TaBI-1.1 transgenic Arabidopsis was significantly higher than in Col-0 after Pst DC3000 infection (Figure 2). Therefore, we hypothesize that the increase in the SA level may be correlated with ICS1 and EDS1 expression due to the regulation by TaBI-1.1.
Several additional signals directly or indirectly interplay with SA in defense response. SA level are closely connected to ROS production which is involved both upstream and downstream SA signals in response to stress (Herreravásquez et al., 2015). However, an ambivalent effect of SA in promoting ROS accumulation and ROS scavenging has been found in several stress models (Mou et al., 2003; Mateo et al., 2006; Herreravásquez et al., 2015). During early events of signals, SA promotes ROS accumulation which is an essential signal for defense response (Garretón et al., 2002; Lee et al., 2010). Nevertheless, high concentration of exogenous SA exacerbates ROS accumulation and even causes PCD by enhancing H2O2 production and oxidative damage (Rao and Davis, 1999). Overexpressing AtBI-1 in tobacco BY-2 cells suppresses H2O2- or SA-mediated cell death (Kawai-Yamada et al., 2004). Human BI-1 modulates ER stress-induced ROS accumulation (Hyung-Ryong et al., 2009). TaBI-1.1 is an ER-resident protein (Figure 8), and constitutive expression of TaBI-1.1 exhibited an alleviation of damage induced by high concentration of SA in Arabidopsis (Figure 4). Therefore, TaBI-1.1 may enhance the tolerance to oxidative stress induced by high concentration of SA on the ER membrane.
Pathogenic infections can trigger a HR in plants, including the production of an oxidative burst, and thereby the rapid PCD in the region surrounding the infection. The suppression of TaBI-1 transcripts could partially provoke cell death during the wheat stripe rust interaction (Wang et al., 2012). Barley BI-1 functions in regulating cell death during interactions with different kinds of plant pathogens (Eichmann et al., 2004, 2010; Babaeizad et al., 2009). BI-1 as a conserved cell death regulator appears very early in the evolution of eukaryotes and expresses in various organisms. TaBI-1.1 was intensively induced by Fg treatment (Supplementary Table S1), suggesting a possible role of TaBI-1.1 in the cell death regulation during the interaction with Fg. The transcripts of TaBI-1.1 was detected in various wheat tissues (Figure 1I), indicating that it functions as a basal regulator in plants. This finding is in consistent with the ubiquitous expression of BI-1 genes in previous reports (Wang et al., 2012).
Forty-eight up-regulated genes were identified in the RNA-seq analysis (Supplementary Figure S1). The GO terms for the up-regulated genes were mostly enriched in immune response-related processes (Figure 6), and the KEGG analysis was enriched in the plant-pathogen interaction and the biosynthesis of secondary metabolite pathways (Figure 7). The up-regulated genes exhibited a greater fold enrichment than down-regulated genes, and the results of the GO and KEGG analyses support the phenotype of TaBI-1.1 in disease resistance (Figure 2), indicating that TaBI-1.1 probably enhances resistance to Pst DC3000 by up-regulating gene expression. Seven up-regulated genes related to biotic or abiotic stresses were selected to test the accuracy of the RNA-seq analysis using qRT-PCR. The HR4 gene is related to bacterial interaction and the hormone response (Saenz-Mata and Jimenez-Bremont, 2012). LOX2 is involved in the JA-regulated defense pathway and suppresses the expression of ABA1 (Pineda et al., 2012). LURP1 is required for defense against Hyaloperonospora parasitica, and the resistance to this pathogen is mediated by the R-proteins RPP4 and RPP5 (Knoth and Eulgem, 2008). Arabidopsis plants overexpressing AtPCR1 exhibit increased Cd resistance, and the reduced AtPCR1 expression was more sensitive to Cd (Song et al., 2004). PRX34 knockdown lines exhibit diminished activation of Flg22-activated genes after Flg22 treatment, and the diminished expression of PRX34 reduced ROS and callose deposition in response to microbe-associated molecular patterns (MAMPs) (Daudi et al., 2012). WAK1, a receptor for OGs (oligogalacturonides), exerts a positive effect on the OG-triggered expression of defense genes and the production of an oxidative burst (Gramegna et al., 2016). Higher expression levels of these genes were detected in TaBI-1.1 transgenic Arabidopsis, and the fold changes were almost consistent with the results of the RNA-seq analysis, suggesting that TaBI-1.1 probably plays an important role in responses to biotic and abiotic stresses by up-regulating the expression of these genes. However, down-regulated genes were significantly enriched in hormone regulation processes rather than responses to biotic stresses. GASA4 plays a role in promoting the gibberellic acid (GA) response and the regulation of redox activity, and is up-regulated by GA in dividing cells (Aubert et al., 1998; Rubinovich and Weiss, 2010). IAA19 is rapidly induced by indole acetic acid (IAA) or brassinolide (BL), partially via the activation of the auxin response element (Nakamura et al., 2004). BZR1, a key transcription factor involved in brassinosteroid (BR) signaling, directly binds to the promoters of IAA19 and ARF7, which is helpful to establish and maintain the morphology of Arabidopsis seedlings grown in the dark (Zhou et al., 2013). In addition, the PIP3 (PIP2;7) gene, which is down-regulated in TaBI-1.1 transgenic Arabidopsis, is involved in negatively regulating salt stress (Pou et al., 2016), suggesting that TaBI-1.1 transgenic Arabidopsis has the potential to exhibit enhanced salt tolerance.
Abscisic acid is the central regulator in abiotic stress response and coordinates an array of functions to enable plants to cope with various stresses (Sah et al., 2016). In this work, TaBI-1.1 expression was up-regulated by SA and down-regulated by ABA (Figure 1). During the germination and seedling stages, TaBI-1.1 transgenic Arabidopsis exhibited decreased sensitivity to ABA, and atbi1-2 showed the opposite phenotype as transgenic plants (Figure 4), indicating that both TaBI-1.1 and AtBI-1 functions negatively in ABA signals. The expression levels of CaBI-1 and TaBI-1 have been reported to be up-regulated by exogenous ABA (Wang et al., 2012). Clearly, the expression of TaBI-1.1 observed in response to the ABA treatment differs from that of CaBI-1 and TaBI-1. The possible reasons may be that there are some different expression patterns for BI-1 under ABA treatment in different plant species, and different growth stages and ABA concentrations have different impacts on BI-1 expression. CaBI-1 expression in leaves is up-regulated by high salinity, similar to the results for TaBI-1.1. Thus, BI-1, a conserved cytoprotective protein in plants, may exhibit a variety of functions in different species grown under abiotic stresses.
AtBI-1 modulates ER stress-mediated PCD (Watanabe and Lam, 2008). The loss of function of Ss-Bi1 increases sensitivity to heat stress and ER stress (Yu et al., 2015). Human BI-1 regulates ER stress-associated ROS accumulation (Hyung-Ryong et al., 2009). BI-1, an ER-resident transmembrane protein, is highly conserved in plants and mammals. As AtBI-1 and TaBI-1.1 are both localized to the ER membrane, we hypothesize that TaBI-1.1 may also be involved in the response to ER stress (Figure 8). TaPIP1, a protein that interacts with TaBI-1.1, is also localized to the ER membrane. More importantly, the two proteins are co-localized to the ER membrane, indicating that the interaction between TaBI-1.1 and TaPIP1 may occur in the ER membrane. PIP is a subgroup of aquaporins (AQPs) that is conserved across numerous plant species (Kaldenhoff and Fischer, 2006). Based on accumulating evidence, AQP responds to various stresses. For instance, overexpression of TaAQP8 in tobacco increases tolerance to salt stress by retaining a high K+/Na+ ratio and high Ca2+ content and enhances the antioxidant system to reduce H2O2 accumulation and membrane damage (Hu et al., 2012). Transgenic rice plants overexpressing an aquaporin RWC3 (OsPIP1;3) exhibit higher root osmotic hydraulic conductivity (Lp), leaf water potential and relative cumulative transpiration in response to a polyethylene glycol (PEG) treatment (Lian et al., 2004). The ortholog of TaPIP1 in Arabidopsis, AtPIP1;4, was shown to be involved in responses to both abiotic and biotic stresses. Overexpression of AtPIP1;4 enhances water flow and facilitates germination in response to cold stress (Jang et al., 2007). TaPIP1 is induced by NaCl, ABA and H2O2 treatments, and overexpression of TaPIP1 in transgenic Arabidopsis confers salt tolerance during germination stage and up-regulates the expression of a number of stress-associated genes (Han et al., 2014). TaBI-1.1 was induced by NaCl treatment and down-regulated under ABA treatment, and constitutive expression of TaBI-1.1 didn’t show significant salt tolerance and decreased the sensitivity to ABA in Arabidopsis (Figures 1, 4, 5), indicating that TaBI-1.1 and TaPIP1 may play opposite roles in response to ABA signals and exhibit different functions under salt tolerance. AtPIP1;4 mediates the translocation of externally applied H2O2 from the apoplast to the cytoplasm, which is required for the cytoplasmic import of pathogen-associated molecular pattern (PAMP)-induced apoplastic H2O2, indicating its pivotal role in apo-cytoplastic signal transduction in immunity pathways (Tian et al., 2016). ROS and SA could act synergistically in a signal amplification loop in defense response. In this study, both TaBI-1.1 and TaPIP1 expression levels were up-regulated under SA treatment and enhanced the resistance to Pst DC3000 infection (Figures 1, 2, 8D, 9), implying TaBI-1.1 and TaPIP1 exhibited similar roles in response to pathogen infection. Based on these results, we hypothesize that TaPIP1 as an ER membrane channel protein may function in the translocation of ROS, and TaBI-1.1 mediates the signal amplification loop of ROS and SA by interacting with TaPIP1 in defense response. Nevertheless, the mechanism of the interaction in biological processes are unable to be determined, and additional investigations are required.
Author Contributions
Z-SX coordinated the project, conceived and designed the experiments, and edited the manuscript. P-PL performed the experiments and wrote the first draft. T-FY conducted the bioinformatic work and performed the experiments. W-JZ revised and edited the manuscript. MC and Y-JX contributed with valuable discussions. JC and Y-BZ provided the analytical tools and managed the reagents. Y-ZM coordinated the project. All authors have read and approved the final manuscript.
Funding
This research was financially supported by the National Key Research and Development Program of China (2016YFD0100600), the National Transgenic Key Project of the Ministry of Agriculture of China (2018ZX08009100), the National Natural Science Foundation of China (31371620), and the Fundamental Research Funds for the Central Universities (2014YB079).
Conflict of Interest Statement
The authors declare that the research was conducted in the absence of any commercial or financial relationships that could be construed as a potential conflict of interest.
Acknowledgments
The authors are grateful to Dr. Li-Li Huang (College of Plant Protection, Northwest A&F University) for providing Pst DC3000 and Dr. Jian-Min Wan (Chinese Academy of Agricultural Sciences) for the vector of mRFP-HDEL.
Supplementary Material
The Supplementary Material for this article can be found online at: https://www.frontiersin.org/articles/10.3389/fpls.2018.00020/full#supplementary-material
Footnotes
References
Ameisen, J. C. (2002). On the origin, evolution, and nature of programmed cell death: a timeline of four billion years. Cell Death Differ. 9, 367–393. doi: 10.1038/sj.cdd.4400950
Aubert, D., Chevillard, M., Dorne, A. M., Arlaud, G., and Herzog, M. (1998). Expression patterns of GASA genes in Arabidopsis thaliana: the GASA4 gene is up-regulated by gibberellins in meristematic regions. Plant Mol. Biol. 36, 871–883. doi: 10.1023/A:1005938624418
Babaeizad, V., Imani, J., Kogel, K. H., Eichmann, R., and Huckelhoven, R. (2009). Over-expression of the cell death regulator BAX inhibitor-1 in barley confers reduced or enhanced susceptibility to distinct fungal pathogens. Theor. Appl. Genet. 118, 455–463. doi: 10.1007/s00122-008-0912-2
Bari, R., and Jones, J. D. (2008). Role of plant hormones in plant defence responses. Plant Mol. Biol. 69, 473–488. doi: 10.1007/s11103-008-9435-0
Bolduc, N., Ouellet, M., Pitre, F., and Brisson, L. (2003). Molecular characterization of two plant BI-1 homologues which suppress Bax-induced apoptosis in human 293 cells. Planta 216, 377–386.
Breckenridge, D. G., Germain, M., Mathai, J. P., Nguyen, M., and Shore, G. C. (2003). Regulation of apoptosis by endoplasmic reticulum pathways. Oncogene 22, 8608–8618. doi: 10.1038/sj.onc.1207108
Canet, J. V., Dobon, A., and Tornero, P. (2012). Non-recognition-of-BTH4, an Arabidopsis mediator subunit homolog, is necessary for development and response to salicylic acid. Plant Cell 24, 4220–4235. doi: 10.1105/tpc.112.103028
Chae, H. J., Kim, H. R., Chen, S., Godzik, A., Dickman, M., and Reed, J. C. (2003). Evolutionarily conserved cytoprotection provided by Bax Inhibitor-1 homologs from animals, plants, and yeast. Gene 323, 101–113. doi: 10.1016/j.gene.2003.09.011
Choi, C., Hwang, S. H., Fang, I. R., Kwon, S. I., Park, S. R., Ahn, I., et al. (2015). Molecular characterization of Oryza sativa WRKY6, which binds to W-box-like element 1 of the Oryza sativa pathogenesis-related (PR) 10a promoter and confers reduced susceptibility to pathogens. New Phytol. 208, 846–859. doi: 10.1111/nph.13516
Choi, D. S., Hwang, I. S., and Hwang, B. K. (2012). Requirement of the cytosolic interaction between PATHOGENESIS-RELATED PROTEIN10 and LEUCINE-RICH REPEAT PROTEIN1 for cell death and defense signaling in pepper. Plant Cell 24, 1675–1690. doi: 10.1105/tpc.112.095869
Clough, S. J., and Bent, A. F. (1998). Floral dip: a simplified method for Agrobacterium-mediated transformation of Arabidopsis thaliana. Plant J. 16, 735–743. doi: 10.1046/j.1365-313x.1998.00343.x
Daudi, A., Cheng, Z., O’Brien, J. A., Mammarella, N., Khan, S., Ausubel, F. M., et al. (2012). The apoplastic oxidative burst peroxidase in Arabidopsis is a major component of pattern-triggered immunity. Plant Cell 24, 275–287. doi: 10.1105/tpc.111.093039
Dong, X. (1998). SA, JA, ethylene, and disease resistance in plants. Curr. Opin. Plant Biol. 1, 316–323. doi: 10.1016/1369-5266(88)80053-0
Eichmann, R., Bischof, M., Weis, C., Shaw, J., Lacomme, C., Schweizer, P., et al. (2010). BAX INHIBITOR-1 is required for full susceptibility of barley to powdery mildew. Mol. Plant Microbe. Interact. 23, 1217–1227. doi: 10.1094/MPMI-23-9-1217
Eichmann, R., Schultheiss, H., Kogel, K. H., and Hückelhoven, R. (2004). The barley apoptosis suppressor homologue BAX inhibitor-1 compromises nonhost penetration resistance of barley to the inappropriate pathogen Blumeria graminis f. sp. tritici. Mol. Plant Microbe. Interact. 17, 484–490. doi: 10.1094/MPMI.2004.17.5.484
Garretón, V., Carpinelli, J., Jordana, X., and Holuigue, L. (2002). The as-1 promoter element is an oxidative stress-responsive element and salicylic acid activates it via oxidative species. Plant Physiol. 130, 1516. doi: 10.1104/pp.009886
Gomord, V., Denmat, L. A., Hawes, C., and Faye, L. (1997). The C-terminal HDEL sequence is sufficient for retention of secretory proteins in the endoplasmic reticulum (ER) but promotes vacuolar targeting of proteins that escape the ER. Plant J. 11, 313–325. doi: 10.1046/j.1365-313X.1997.11020313.x
Gramegna, G., Modesti, V., Savatin, D. V., Sicilia, F., Cervone, F., and De Lorenzo, G. (2016). GRP-3 and KAPP, encoding interactors of WAK1, negatively affect defense responses induced by oligogalacturonides and local response to wounding. J. Exp. Bot. 67, 1715–1729. doi: 10.1093/jxb/erv563
Grant, M., Brown, I., Adams, S., Knight, M., Ainslie, A., and Mansfield, J. (2000). The RPM1 plant disease resistance gene facilitates a rapid and sustained increase in cytosolic calcium that is necessary for the oxidative burst and hypersensitive cell death. Plant J. 23, 441–450. doi: 10.1046/j.1365-313x.2000.00804.x
Han, J., Zhang, W., Sun, L., Su, Q., Ji, J., Cui, F., et al. (2014). TaPIP1 and TaNAS1 involved in response to abiotic stresses. in Proceedings of the Academic Annual Meeting of Crop Science Society of China, Beijing, 29–30.
Herreravásquez, A., Salinas, P., and Holuigue, L. (2015). Salicylic acid and reactive oxygen species interplay in the transcriptional control of defense genes expression. Front. Plant Sci. 6:171. doi: 10.3389/fpls.2015.00171
Horváth, E., Szalai, G., and Janda, T. (2007). Induction of abiotic stress tolerance by salicylic acid signaling. J. Plant Growth Regul. 26, 290–300. doi: 10.1007/s00344-007-9017-4
Hu, W., Yuan, Q., Wang, Y., Cai, R., Deng, X., Wang, J., et al. (2012). Overexpression of a wheat aquaporin gene, TaAQP8, enhances salt stress tolerance in transgenic tobacco. Plant Cell Physiol. 53, 2127–2141. doi: 10.1093/pcp/pcs154
Hyung-Ryong, K., Geum-Hwa, L., Eun Yi, C., Soo-Wan, C., Taeho, A., and Han-Jung, C. (2009). Bax inhibitor 1 regulates ER-stress-induced ROS accumulation through the regulation of cytochrome P450 2E1. J. Cell Sci. 122, 1126–1133. doi: 10.1242/jcs.038430
Ihara-Ohori, Y., Nagano, M., Muto, S., Uchimiya, H., and Kawai-Yamada, M. (2007). Cell death suppressor Arabidopsis bax inhibitor-1 is associated with calmodulin binding and ion homeostasis. Plant Physiol. 143, 650–660. doi: 10.1104/pp.106.090878
Isbat, M., Zeba, N., Kim, S. R., and Hong, C. B. (2009). A BAX inhibitor-1 gene in Capsicum annuum is induced under various abiotic stresses and endows multi-tolerance in transgenic tobacco. J. Plant Physiol. 166, 1685–1693. doi: 10.1016/j.jplph.2009.04.017
Ishikawa, T., Aki, T., Yanagisawa, S., Uchimiya, H., and Kawai-Yamada, M. (2015). Overexpression of BAX INHIBITOR-1 links plasma membrane microdomain proteins to stress. Plant Physiol. 169, 1333–1343. doi: 10.1104/pp.15.00445
Ishikawa, T., Takahara, K., Hirabayashi, T., Matsumura, H., Fujisawa, S., Terauchi, R., et al. (2010). Metabolome analysis of response to oxidative stress in rice suspension cells overexpressing cell death suppressor Bax inhibitor-1. Plant Cell Physiol. 51, 9–20. doi: 10.1093/pcp/pcp162
Ishikawa, T., Watanabe, N., Nagano, M., Kawai-Yamada, M., and Lam, E. (2011). Bax inhibitor-1: a highly conserved endoplasmic reticulum-resident cell death suppressor. Cell Death Differ. 18, 1271–1278. doi: 10.1038/cdd.2011.59
Jang, J. Y., Lee, S. H., Rhee, J. Y., Chung, G. C., Ahn, S. J., and Kang, H. (2007). Transgenic Arabidopsis and tobacco plants overexpressing an aquaporin respond differently to various abiotic stresses. Plant Mol. Biol. 64, 621–632. doi: 10.1007/s11103-007-9181-8
Kaldenhoff, R., and Fischer, M. (2006). Functional aquaporin diversity in plants. Biochim. Biophys. Acta 1758, 1134–1141. doi: 10.1016/j.bbamem.2006.03.012
Kawai-Yamada, M., Ohori, Y., and Uchimiya, H. (2004). Dissection of Arabidopsis Bax inhibitor-1 suppressing Bax-, hydrogen peroxide-, and salicylic acid-induced cell death. Plant Cell 16, 21–32. doi: 10.1105/tpc.014613
Kawai-Yamada, M., and Uchimiya, H. (2001). Mammalian Bax-induced plant cell death can be down-regulated by overexpression of Arabidopsis Bax Inhibitor-1 (AtBI-1). Proc. Natl. Acad. Sci. U.S.A. 98, 12295–12300. doi: 10.1073/pnas.211423998
King, E. O., Ward, M. K., and Raney, D. E. (1954). Two simple media for the demonstration of pyocyanin and fluorescin. J. Lab. Clin. Med. 44, 301–307.
Knoth, C., and Eulgem, T. (2008). The oomycete response gene LURP1 is required for defense against Hyaloperonospora parasitica in Arabidopsis thaliana. Plant J. 55, 53–64. doi: 10.1111/j.1365-313X.2008.03486.x
Kumar, D. (2014). Salicylic acid signaling in disease resistance. Plant Sci. 228, 127–134. doi: 10.1016/j.plantsci.2014.04.014
Lam, E., Kato, N., and Lawton, M. (2001). Programmed cell death, mitochondria and the plant hypersensitive response. Nature 411, 848–853. doi: 10.1038/35081184
Lee, G. H., Lee, H. Y., Li, B., Kim, H. R., and Chae, H. J. (2014). Bax inhibitor-1-mediated inhibition of mitochondrial Ca2+ intake regulates mitochondrial permeability transition pore opening and cell death. Sci. Rep. 4:5194. doi: 10.1038/srep05194
Lee, S., Kim, S. G., and Park, C. M. (2010). Salicylic acid promotes seed germination under high salinity by modulating antioxidant activity in Arabidopsis. New Phytol. 188, 626–637. doi: 10.1111/j.1469-8137.2010.03378.x
Lian, H. L., Yu, X., Ye, Q., Ding, X., Kitagawa, Y., Kwak, S. S., et al. (2004). The role of aquaporin RWC3 in drought avoidance in rice. Plant Cell Physiol. 45, 481–489. doi: 10.1093/pcp/pch058
Liu, P., Xu, Z. S., Lu, P. P., Hu, D., Chen, M., Li, L. C., et al. (2013). A wheat PI4K gene whose product possesses threonine autophophorylation activity confers tolerance to drought and salt in Arabidopsis. J. Exp. Bot. 64, 2915–2917. doi: 10.1093/jxb/ert133
Marion, J., Bach, L., Bellec, Y., Meyer, C., Gissot, L., and Faure, J. D. (2008). Systematic analysis of protein subcellular localization and interaction using high-throughput transient transformation of Arabidopsis seedlings. Plant J. 56, 169–179. doi: 10.1111/j.1365-313X.2008.03596.x
Mateo, A., Funck, D., Mühlenbock, P., Kular, B., Mullineaux, P. M., and Karpinski, S. (2006). Controlled levels of salicylic acid are required for optimal photosynthesis and redox homeostasis. J. Exp. Bot. 57, 1795–1807. doi: 10.1093/jxb/erj196
Matsumura, H., Nirasawa, S., Kiba, A., Urasaki, N., Saitoh, H., Ito, M., et al. (2003). Overexpression of Bax inhibitor suppresses the fungal elicitor-induced cell death in rice (Oryza sativa L.) cells. Plant J. 33, 425–434. doi: 10.1046/j.1365-313X.2003.01639.x
Morel, J.-B., and Dangl, J. L. (1997). The hypersensitive response and the induction of cell death in plants. Cell Death Differ. 4, 671–683. doi: 10.1038/sj.cdd.4400309
Mou, Z., Fan, W., and Dong, X. (2003). Inducers of plant systemic acquired resistance regulate NPR1 function through redox changes. Cell 113, 935–944. doi: 10.1016/S0092-8674(03)00429-X
Murashige, T., and Skoog, F. (1962). A revised medium for rapid growth and bio assays with tobacco tissue cultures. Physiol. Plant. 15, 473–497. doi: 10.1111/j.1399-3054.1962.tb08052.x
Nagano, M., Ihara-Ohori, Y., Imai, H., Inada, N., Fujimoto, M., Tsutsumi, N., et al. (2009). Functional association of cell death suppressor, Arabidopsis Bax inhibitor-1, with fatty acid 2-hydroxylation through cytochrome b(5). Plant J. 58, 122–134. doi: 10.1111/j.1365-313X.2008.03765.x
Nakamura, A., Higuchi, K., Goda, H., Fujiwara, M. T., Sawa, S., Koshiba, T., et al. (2004). Brassinolide induces IAA5, IAA19, and DR5, a synthetic auxin response element in Arabidopsis, implying a cross talk point of brassinosteroid and auxin signaling. Plant Physiol. 133, 1843–1853. doi: 10.1104/pp.103.030031
Nawrath, C., and Métraux, J.-P. (1999). Salicylic acid induction–deficient mutants of Arabidopsis express PR-2 and PR-5 and accumulate high levels of camalexin after pathogen inoculation. Plant Cell 11, 1393–1404. doi: 10.2307/3870970
Ohshima, M., Itoh, H., Matsuoka, M., Murakami, T., and Ohashi, Y. (1990). Analysis of stress-induced or salicylic acid-induced expression of the pathogenesis-related 1a protein gene in transgenic tobacco. Plant Cell 2, 95–106. doi: 10.1105/tpc.2.2.95
Peng, X., Hu, Y., Tang, X., Zhou, P., Deng, X., Wang, H., et al. (2012). Constitutive expression of rice WRKY30 gene increases the endogenous jasmonic acid accumulation, PR gene expression and resistance to fungal pathogens in rice. Planta 236, 1485–1498. doi: 10.1007/s00425-012-1698-7
Pieterse, C. M. J., and van Loon, L. C. (1999). Salicylic acid-independent plant defence pathways. Trends Plant Sci. 4, 52–58. doi: 10.1016/S1360-1385(98)01364-8
Pineda, A., Zheng, S. J., van Loon, J. J., and Dicke, M. (2012). Rhizobacteria modify plant-aphid interactions: a case of induced systemic susceptibility. Plant Biol. 14(Suppl. 1), 83–90. doi: 10.1111/j.1438-8677.2011.00549.x
Pou, A., Jeanguenin, L., Milhiet, T., Batoko, H., Chaumont, F., and Hachez, C. (2016). Salinity-mediated transcriptional and post-translational regulation of the Arabidopsis aquaporin PIP2;7. Plant Mol. Biol. 92, 1–14. doi: 10.1007/s11103-016-0542-z
Rao, M. V., and Davis, K. R. (1999). Ozone-induced cell death occurs via two distinct mechanisms in Arabidopsis : the role of salicylic acid. Plant J. 17, 603–614. doi: 10.1046/j.1365-313X.1999.00400.x
Reape, T. J., and Mccabe, P. F. (2010). Apoptotic-like regulation of programmed cell death in plants. Apoptosis 15, 249–256. doi: 10.1007/s10495-009-0447-2
Rubinovich, L., and Weiss, D. (2010). The Arabidopsis cysteine-rich protein GASA4 promotes GA responses and exhibits redox activity in bacteria and in planta. Plant J. 64, 1018–1027. doi: 10.1111/j.1365-313X.2010.04390.x
Rustérucci, C., Aviv, D. H., Holt, B. F., Dangl, J. L., and Parker, J. E. (2001). The disease resistance signaling components EDS1 and PAD4 are essential regulators of the cell death pathway controlled by LSD1 in Arabidopsis. Plant Cell 13, 2211–2224. doi: 10.1105/tpc.13.10.2211
Ryals, J. A., Neuenschwander, U. H., Willits, M. G., Molina, A., Steiner, H. Y., and Hunt, M. D. (1996). Systemic acquired resistance. Plant Cell 8, 1809–1819. doi: 10.1105/tpc.8.10.1809
Saenz-Mata, J., and Jimenez-Bremont, J. F. (2012). HR4 gene is induced in the Arabidopsis-Trichoderma atroviride beneficial interaction. Int. J. Mol. Sci. 13, 9110–9128. doi: 10.3390/ijms13079110
Sah, S. K., Reddy, K. R., and Li, J. (2016). Abscisic acid and abiotic stress tolerance in crop plants. Front. Plant Sci. 7:571. doi: 10.3389/fpls.2016.00571
Sanchez, P., De torres Zabala, M., and Grant, M. (2000). AtBI-1, a plant homologue of Bax Inhibitor-1, suppresses Bax-induced cell death in yeast and is rapidly upregulated during wounding and pathogen challenge. Plant J. 21, 393–399. doi: 10.1046/j.1365-313x.2000.00690.x
Song, W. Y., Martinoia, E., Lee, J., Kim, D., Kim, D. Y., Vogt, E., et al. (2004). A novel family of cys-rich membrane proteins mediates cadmium resistance in Arabidopsis. Plant Physiol. 135, 1027–1039. doi: 10.1104/pp.103.037739
Tateda, C., Zhang, Z., Shrestha, J., Jelenska, J., Chinchilla, D., and Greenberg, J. T. (2014). Salicylic acid regulates Arabidopsis microbial pattern receptor kinase levels and signaling. Plant Cell 26, 4171–4187. doi: 10.1105/tpc.114.131938
Tian, S., Wang, X., Li, P., Wang, H., Ji, H., Xie, J., et al. (2016). Plant Aquaporin AtPIP1;4 Links Apoplastic H2O2 induction to disease immunity pathways. Plant Physiol. 171, 1635–1650. doi: 10.1104/pp.15.01237
Van Loon, L. C. (1998). Induced resistance in plants and the role of pathogenesis-related proteins. Eur. J. Plant Pathol. 103, 753–765. doi: 10.1023/A:1008638109140
Wang, X., Tang, C., Huang, X., Li, F., Chen, X., Zhang, G., et al. (2012). Wheat BAX inhibitor-1 contributes to wheat resistance to Puccinia striiformis. J. Exp. Bot. 63, 4571–4584. doi: 10.1093/jxb/ers140
Watanabe, N., and Lam, E. (2008). BAX inhibitor-1 modulates endoplasmic reticulum stress-mediated programmed cell death in Arabidopsis. J. Biol. Chem. 283, 3200–3210. doi: 10.1074/jbc.M706659200
Watanabe, N., and Lam, E. (2009). Bax inhibitor-1, a conserved cell death suppressor, is a key molecular switch downstream from a variety of biotic and abiotic stress signals in plants. Int. J. Mol. Sci. 10, 3149–3167. doi: 10.3390/ijms10073149
Weis, C., Pfeilmeier, S., Glawischnig, E., Isono, E., Pachl, F., Hahne, H., et al. (2013). Co-immunoprecipitation-based identification of putative BAX INHIBITOR-1-interacting proteins involved in cell death regulation and plant-powdery mildew interactions. Mol. Plant Pathol. 14, 791–802. doi: 10.1111/mpp.12050
Wiermer, M., Feys, B. J., and Parker, J. E. (2005). Plant immunity: the EDS1 regulatory node. Curr. Opin. Plant Biol. 8, 383–389. doi: 10.1016/j.pbi.2005.05.010
Wildermuth, M. C., Dewdney, J., Wu, G., and Ausubel, F. M. (2001). Isochorismate synthase is required to synthesize salicylic acid for plant defence. Nature 414, 562–565. doi: 10.1038/35107108
Xu, Q., and Reed, J. C. (1998). Bax inhibitor-1, a mammalian apoptosis suppressor identified by functional screening in yeast. Mol. Cell 1, 337–346. doi: 10.1016/S1097-2765(00)80034-9
Yu, Y., Xiao, J., Yang, Y., Bi, C., Qing, L., and Tan, W. (2015). Ss-Bi1 encodes a putative BAX inhibitor-1 protein that is required for full virulence of Sclerotinia sclerotiorum. Physiol. Mol. Plant Pathol. 90, 115–122. doi: 10.1016/j.pmpp.2015.04.005
Keywords: Bax inhibitor-1, SA, Pst DC3000, biotic stress, TaPIP1, wheat
Citation: Lu P-P, Yu T-F, Zheng W-J, Chen M, Zhou Y-B, Chen J, Ma Y-Z, Xi Y-J and Xu Z-S (2018) The Wheat Bax Inhibitor-1 Protein Interacts with an Aquaporin TaPIP1 and Enhances Disease Resistance in Arabidopsis. Front. Plant Sci. 9:20. doi: 10.3389/fpls.2018.00020
Received: 25 October 2017; Accepted: 05 January 2018;
Published: 22 January 2018.
Edited by:
Péter Poór, University of Szeged, HungaryCopyright © 2018 Lu, Yu, Zheng, Chen, Zhou, Chen, Ma, Xi and Xu. This is an open-access article distributed under the terms of the Creative Commons Attribution License (CC BY). The use, distribution or reproduction in other forums is permitted, provided the original author(s) or licensor are credited and that the original publication in this journal is cited, in accordance with accepted academic practice. No use, distribution or reproduction is permitted which does not comply with these terms.
*Correspondence: Zhao-Shi Xu, eHV6aGFvc2hpQGNhYXMuY24= Ya-Jun Xi, eGl5YWp1bjIwMDJAMTI2LmNvbQ==
†These authors have contributed equally to this work.