 Audrey Kelner
 Nuno Leitão
 Mireille Chabaud
 Myriam Charpentier
 Fernanda de Carvalho-Niebel
- 1Laboratory of Plant Microbe Interactions, Université de Toulouse, Institut National de la Recherche Agronomique, Centre National de la Recherche Scientifique, Castanet-Tolosan, France
- 2Department of Cell and Developmental Biology, John Innes Centre, Norwich, United Kingdom
Spatiotemporal changes in cellular calcium (Ca2+) concentrations are essential for signal transduction in a wide range of plant cellular processes. In legumes, nuclear and perinuclear-localized Ca2+ oscillations have emerged as key signatures preceding downstream symbiotic signaling responses. Förster resonance energy transfer (FRET) yellow-based Ca2+ cameleon probes have been successfully exploited to measure the spatiotemporal dynamics of symbiotic Ca2+ signaling in legumes. Although providing cellular resolution, these sensors were restricted to measuring Ca2+ changes in single subcellular compartments. In this study, we have explored the potential of single fluorescent protein-based Ca2+ sensors, the GECOs, for multicolor and simultaneous imaging of the spatiotemporal dynamics of cytoplasmic and nuclear Ca2+ signaling in root cells. Single and dual fluorescence nuclear and cytoplasmic-localized GECOs expressed in transgenic Medicago truncatula roots and Arabidopsis thaliana were used to successfully monitor Ca2+ responses to microbial biotic and abiotic elicitors. In M. truncatula, we demonstrate that GECOs detect symbiosis-related Ca2+ spiking variations with higher sensitivity than the yellow FRET-based sensors previously used. Additionally, in both M. truncatula and A. thaliana, the dual sensor is now able to resolve in a single root cell the coordinated spatiotemporal dynamics of nuclear and cytoplasmic Ca2+ signaling in vivo. The GECO-based sensors presented here therefore represent powerful tools to monitor Ca2+ signaling dynamics in vivo in response to different stimuli in multi-subcellular compartments of plant cells.
Introduction
Divalent calcium (Ca2+) ions are versatile second messengers regulating many biological processes in eukaryotic and prokaryotic cells (Dodd et al., 2010; Domínguez et al., 2015). In plants, Ca2+ mediates developmental and physiological responses to various biotic and abiotic environmental cues (McAinsh and Pittman, 2009; Dodd et al., 2010; Kudla et al., 2010; Stael et al., 2012). Stimuli-induced Ca2+ releases result in transient or repetitive oscillations, distinct in their frequency, amplitude, duration, and spatial distribution. The sensing and decoding of these so-called Ca2+ signatures (McAinsh and Pittman, 2009) by Ca2+-binding proteins assure the transduction of the signal to downstream transcriptional and metabolic responses (Galon et al., 2010; Reddy et al., 2011; Whalley and Knight, 2013).
The analysis of Ca2+ signatures and their contribution to signaling in different cellular compartments requires tools adapted for monitoring Ca2+ dynamics with high spatial and temporal resolution. Bioluminescent aequorin-based probes can successfully quantify variations in Ca2+ signaling in plants, but their low light emission limits the spatiotemporal resolution of these responses during imaging (Knight et al., 1991; McCombs and Palmer, 2008). Cellular resolution can be achieved by the use of fluorescent dyes and genetically-encoded Ca2+ indicators (GECIs), consisting of fluorescent proteins (FPs) fused to sensor domains. Compared to fluorescent dyes, GECIs have the advantage of being accessible to any cell type and offer the possibility of measuring Ca2+ variations in subcellular compartments, by specific targeting of the sensor. The most popular GECI sensors are the ratiometric Förster Resonance Energy Transfer (FRET)-based Yellow Cameleons (YCs) composed of a fluorescent donor-acceptor pair, respectively, CFP and YFP, linked by a calmodulin (CaM) and the CaM-binding peptide of myosin light-chain kinase M13 (Miyawaki et al., 1997; Allen et al., 1999). Upon Ca2+ binding to CaM, CaM and M13 interact which triggers protein conformational changes that result in increased FRET between the donor-acceptor pair. More recently, improved FRET-based pairs or hybrid sensors such as BRET (bioluminescent aequorin coupled with a FP) have been engineered and successfully used in plants (Rodriguez-Garcia et al., 2014; Xiong et al., 2014; Bajar et al., 2016).
Targeting FRET-based probes to different subcellular compartments revealed precise Ca2+ variations in different organelles, including the nucleus, the endoplasmic reticulum, the chloroplast, peroxisomes, and mitochondria (Iwano et al., 2009; Sieberer et al., 2009; Costa et al., 2010; Krebs et al., 2012; Loro et al., 2012, 2016; Stael et al., 2012; Bonza et al., 2013). The Ca2+ dynamics in specific compartments are likely to reflect the differential activation of Ca2+ channels and the contribution of diverse intra and extracellular Ca2+ stores in the control of specific functions, such as gene transcription (Ranty et al., 2012). A number of stimuli activates Ca2+ responses simultaneously in different subcellular compartments (van Der Luit et al., 1999; Wood et al., 2001). As such, in legumes, the perception of diffusible nodulation (Nod) and mycorrhizal (Myc) factors released by nitrogen-fixing bacteria and arbuscular mycorrhiza (AM), fungi respectively, induces calcium oscillations in the nucleus and adjacent cytoplasm (Ehrhardt et al., 1996; Miwa et al., 2006a; Sieberer et al., 2009). Symbiotic calcium spiking was monitored using fluorescent dyes, cytoplasmic FRET-based YC probes (Ehrhardt et al., 1996; Catoira et al., 2000; Wais et al., 2000; Shaw and Long, 2003; Miwa et al., 2006a,b; Kosuta et al., 2008) or nuclear-tagged YFP-FRET probes (Sieberer et al., 2009, 2012; Chabaud et al., 2011; Genre et al., 2013; Sun et al., 2015). Although monitored independently, cytoplasmic and nuclear Ca2+ responses were hypothesized to be synchronized based on their relative time period. Nod factors (NF), consisting of lipo-chitooligosaccharides, and AM fungi chitin oligomers (COs), both induce Ca2+ spiking, essential for the transduction of downstream symbiotic signaling in the nucleus (Zipfel and Oldroyd, 2017). More recently, major components involved in the generation of Ca2+ spiking were identified in legumes. In the model legume Medicago truncatula, the potassium channel DMI1 (Ané et al., 2004), the Ca2+-ATPase MCA8 (Capoen et al., 2011), and CNGC15 Ca2+ channels (Charpentier et al., 2016), are required for the generation of symbiotic Ca2+ oscillations (Granqvist et al., 2012; Charpentier and Oldroyd, 2013; Charpentier et al., 2016). Interestingly, they all locate to both the outer nuclear membrane (ONM) and the inner nuclear membrane (INM) (Capoen et al., 2011; Charpentier et al., 2016). This observation raises the issue of the direction of the observed Ca2+ release. Ca2+ could be simultaneously released across the INM and the ONM or, sequentially, through the INM or the ONM to the nucleoplasm and cytoplasm, respectively. Thus, simultaneous investigation of nuclear and cytoplasmic Ca2+ dynamics is required to gain information on the origin of the specific symbiotic factor-induced nuclear Ca2+ signals, and clarify the spatial activation of the ion channels.
Recent studies in animal cells revealed that highly sensitive Ca2+ GECI sensors can discriminate stimulus-dependent directional propagation of Ca2+ signals (Nakao et al., 2015). These improved GECIs, called GECOs (for GECIs for optical imaging) are circularly permuted single fluorescent intensiometric Ca2+-sensing proteins with a CaM and a M13 peptide domains. Upon Ca2+ binding, changes in protein conformation result in a visible increase in its fluorescence intensity (Zhao et al., 2011). GECOs have to date only been targeted to the cytoplasm to study Ca2+ signaling in plant cells (Ngo et al., 2014; Keinath et al., 2015; Wang et al., 2015; Tunc-Ozdemir and Jones, 2017; Waadt et al., 2017). However, the available palette of GECO fluorescent protein colors now opens the possibility of concomitantly imaging Ca2+-signaling in different compartments of plant cells (Zhao et al., 2011). Moreover, improved GECO versions were generated through directed evolution and screened for higher intensity signal change upon Ca2+ binding, but not yet used in plants (Zhao et al., 2011; Wu et al., 2013).
In this study, we generated dual Ca2+ sensors that simultaneously monitor the Ca2+ dynamics in the nucleus and cytoplasm, by targeting highly sensitive GECO Ca2+ sensors to these subcellular compartments. We demonstrated that the new dual GECO sensors are powerful tools to concomitantly monitor in vivo Ca2+ dynamics in adjacent nuclear and cytoplasmic compartments of both M. truncatula and Arabidopsis roots in response to both biotic and abiotic signals. We unraveled that the symbiotic Nod factor-induced nuclear calcium oscillations preferentially start in the nucleus. Additionally the dual GECO sensor revealed that biotic and abiotic stimuli trigger distinct cytoplasmic and nuclear Ca2+ dynamics in A. thaliana root cells.
Results
The Highly Sensitive GECO Sensor Enables Real-Time Visualization of Nuclear Ca2+ Spiking in M. truncatula
In order to evaluate the performance of GECO as a Ca2+ sensor for the symbiotic factor-induced nuclear Ca2+ oscillations in M. truncatula, we designed a compatible binary vector to constitutively express the red fluorescence R-GECO1 (Zhao et al., 2011) in the nucleus of plant cells (Figure S1). This construct, referred to as NR-GECO1, comprises a viral SV40 nuclear localization signal (NLS) fused to the R-GECO1 and driven by the double CAMV 35S promoter (2xp35S) (Figure S1), and was used together with the previously characterized yellow fluorescence cameleon sensors NUP-YC2.1 (Sieberer et al., 2009) and NLS-YC3.6 (Krebs et al., 2012) to generate M. truncatula composite plants via Agrobacterium rhizogenes-mediated transformation. Confocal laser scanning microscopy (CLSM) revealed that both the NR-GECO1 and the two cameleon sensors were targeted to the nuclear compartment of M. truncatula root cells (Figure S2). NR-GECO1 fluorescence was undetectable in the cytoplasm, and appeared homogeneously distributed within the nucleus (Figure S2A).
Symbiosis-related nuclear Ca2+ responses were assessed in the nucleus of growing root hair cells using CLSM (Figure S3). The basal fluorescence signal intensity was recorded for 5–10 min for each sensor before treatment of roots with purified Sinorhizobium meliloti NFs (10−9 M) (Figures 1A,C,E). Following NF application, sustained Ca2+ spikes were observed within the nucleus of cells transformed with the three sensors (Figures 1B,D,F). They all generated comparable patterns of NF-induced Ca2+ spiking, with spike periodicity of about 100–120 s (Figure 1G).
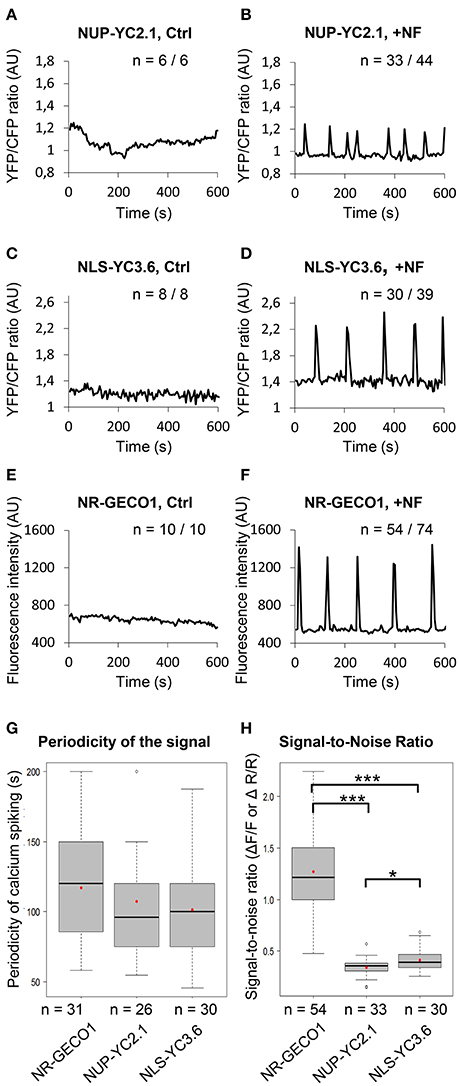
Figure 1. NR-GECO1 displays higher Ca2+ signal-to-noise ratio than previously used cameleon sensors. (A–F) Representative profiles obtained with the FRET probes NUP-YC2.1 (A,B), NLS-YC3.6 (C,D), and the single NR-GECO1 sensor (E,F) before (Ctrl) and after Nod Factor (+NF) addition. n represents the number of individual root hair cells analyzed from 2 to 3 independent experiments (AU, Arbitrary Units). Note that the y-axis scales are different for each sensor. (G,H) Calcium spiking periodicity (G) and signal-to-noise ratio (H) was calculated for each individual sensor. in vivo Signal-to-noise ratio (SNR) in (H) represents signal amplitude changes during calcium spiking and was calculated using fluorescence intensity values (ΔF/F) for NR-GECO1 and YFP/CFP ratio (ΔR/R) values for the cameleon sensors. Box plots represent first and third quartile (horizontal box sides), minimum and maximum (outside whiskers), median (central lines), and mean (solid red circle) values. A one-way ANOVA followed by a Tukey honest significant (HSD) test of the values after a Box-Cox transformation (λ = 0.0606) did not reveal statistical differences between the three groups (p > 0.05) in (G). A Kruskal-Wallis test revealed statistical difference between the groups in (H) (*p < 0.05 and ***p < 0.001).
To evaluate whether NR-GECO1 was suitable for detecting other Ca2+ responses in M. truncatula, we challenged M. truncatula composite plants and root organ cultures (ROCs) with tetra-chitooligosaccharides (CO4) previously shown to elicit nuclear Ca2+ oscillations (Genre et al., 2013; Sun et al., 2015). Similarly to NFs, NR-GECO1 allowed the detection of CO4-induced nuclear Ca2+ spiking in both composite plants and ROCs (Figure S4). As previously observed with a cameleon probe (Genre et al., 2013), the NF receptor nfp mutant no longer exhibited NF-elicited Ca2+ spiking but still displayed CO4-induced Ca2+ spiking responses (Figures S4E–G). Taken together, NR-GECO1 can efficiently measure symbiosis-related nuclear Ca2+ spiking responses in M. truncatula roots.
To investigate sensor performance, we compared the maximum signal change to the basal fluorescence signal (before the spike), by calculating the signal-to-noise ratio (SNR) values for each individual probe. The fractional fluorescence changes (ΔF/F) for NR-GECO1 and the fractional ratio changes (ΔR/R) for the cameleon sensors were measured as described (Figure S3B and Material and Methods), from a high number of individual root hairs. FRET-based probes exhibited rather similar dynamic changes, although NLS-YC3.6 appeared to be slightly superior to NUP-YC2.1 with mean SNR values of 0.41 and 0.34, respectively (Figure 1H). However, there was a striking difference in the dynamic responses observed between the nuclear NR-GECO1 and the cameleon sensors with a mean SNR value of 1.27 (Figure 1H). Thus, NR-GECO1 allows monitoring of NF-induced nuclear Ca2+ spiking with a greater sensitivity than the cameleon sensors. Our results confirm the previously described higher sensitivity of the cytoplasmic R-GECO1 in comparison to the YC3.6, in response to the ATP-induced Ca2+ signals in A. thaliana roots (Keinath et al., 2015). Additionally, using CLSM, NR-GECO1 allowed real time visualization of the Ca2+ changes in contrast to the cameleon probe for which the YFP/CFP fluorescent ratio have to be calculated from a pre-selected region of interest (ROI) (Figure S5 and Movies S1, S2). Thus, in comparison to cameleon sensors, NR-GECO1 has a higher dynamic range, which greatly facilitates the rapid monitoring of cell-autonomous dynamics of Ca2+ spiking in various M. truncatula root hair and non-hair cells.
A Dual GECO Sensor for Simultaneously Monitoring Ca2+ Signals in Both Nuclear and Cytoplasmic Compartments of M. truncatula Root Cells
Taking advantage of the high sensitivity of GECOs, we generated a dual fluorescence color sensor for imaging Ca2+ signal dynamics simultaneously in the cytoplasm and the nuclear compartments of the same root hair cell. We therefore combined the nuclear-tagged red GECO1 and the cytoplasmic green GECO1 in a single construct (Figure S1). In this dual sensor, both the nuclear red and cytoplasmic green GECOs (NRCG-GECO1) are driven by 2xp35S promoters. CLSM imaging revealed the dual labeling of nuclear and cytoplasmic compartments of M. truncatula epidermal cells (Figure 2A). In a non-spiking state (Figure 2A), the red and green fluorescence proteins are found, respectively, in the nuclear and cytoplasmic regions demonstrating the correct targeting of the GECO to the expected subcellular compartments. However, during a Ca2+ spike a merged orange-to-yellow fluorescence signal is observed in the nuclear region, due to the acquisition of increased nuclear R-GECO1 and perinuclear green G-GECO1 fluorescence signals (Figure 2B).
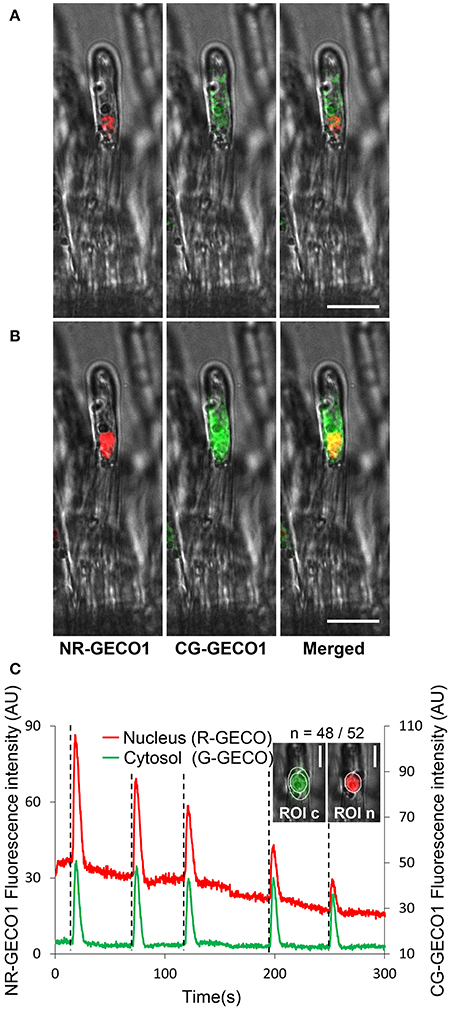
Figure 2. A dual GECO Ca2+ sensor targeted to both nuclear and cytoplasmic subcellular compartments reveals coordinated oscillatory Ca2+ responses. (A,B) Subcellular localization of the dual NRCG-GECO1 sensor in M. truncatula root hair cells. Confocal fluorescent images of NRCG-GECO1 sensor before (A) and during a spike (B) are represented as separated red, green, and merged images with respective bright fields. (C) Relative fluorescence intensity traces of NR-GECO1 (red) and CG-GECO1 (green) at 0.25 s intervals from ROIs selected around the nuclear (ROI n) and peri-nuclear cytoplasmic (ROI c) regions of a M. truncatula root hair treated with a 10−9 M Nod Factor (+NF) solution. Dotted lines mark the initiation of a spike, n corresponds to the number of root hairs responding positively/total number of analyzed root hairs. Data were collected from two biological experiments. Scale bars represent 20 μm (A,B) and 10 μm (C).
Imaging conditions were set up to avoid crossover between fluorescence emissions of the two probes. The excitation of G-GECO1 and R-GECO1 is achieved using an argon 488 nm laser and a 561 nm diode, respectively, and emission is detected in the respective fluorescence window ranges of 500–550 and 580–643 nm (Zhao et al., 2011). By using the optimum excitation parameters for G-GECO1 (488 nm excitation, Figure S6A), the green cytoplasmic fluorescence was clearly observed in the expected 500–550 nm emission window in NF-treated M. truncatula root hairs. However, a slight bleed-through of the G-GECO1 was observed in the R-GECO1 emission window of 580–643 nm protein. To avoid this, we therefore reduced the fluorescence window emission range for R-GECO1 from 580–643 to 600–643 nm. Importantly, no bleed-through of the R-GECO1 was observed in the G-GECO1 500–550 nm emission window. Thus, the dual NRCG-GECO1 sensor expressed in transformed roots of M. truncatula composite plants was able to monitor concomitant nuclear and cytoplasmic Ca2+ spiking in an individual NF-treated root hair (Figure 2C). Similar coordinated Ca2+ responses in the two subcellular compartments were monitored in M. truncatula transgenic roots treated with CO4 (Figure S7A). To ensure the specificity of these responses, we used the dual NRCG-GECO1 sensor in the dmi1 and dmi3 mutants (Catoira et al., 2000; Arrighi et al., 2006). As expected, coordinated NF-elicited Ca2+ spiking was only observed in the dmi3 mutant (Figure S7). Taken together, the dual NRCG-GECO1 Ca2+ sensor targets GECO fluorescent proteins to two subcellular compartments and is suitable for co-imaging of specific Ca2+ responses in real time in two distinct subcellular compartments without fluorescence bleed-through.
Ca2+ Spiking Preferentially Initiates in the Nucleus of Medicago Root Hairs Responding to Symbiotic Nod Factors
The dual sensor made it possible to simultaneously visualize highly coordinated Ca2+ signals in both nuclear and cytoplasmic compartments and therefore resolve the initiation dynamics of the symbiotic factor-induced nuclear Ca2+ spiking. To increase temporal resolution, we reduced the image acquisition intervals to below 0.5 s. A qualitative frame-by-frame analysis illustrated the rise in both red and green fluorescence of respective GECOs during a single spike (Figure 3A). The selection of regions of interest (ROI) in the nucleoplasm and in different cytoplasmic-associated areas allowed us to precisely follow the progressive rise in fluorescence intensity of the sensors over time (Figures 3B,C). In both compartments, the start of a Ca2+ spike was recognized by a steep increase in fluorescence intensity to baseline fluorescence levels (Figures 3B–D). These analyzes revealed a strong Ca2+ rise in the nucleus and in the nuclear periphery, followed by sequential signal propagation toward the root hair tip (Figures 3B,C). To further evaluate the dynamics of Ca2+ spiking initiation in the perinuclear region, we simultaneously recorded fluorescence data from nuclear NR-GECO1 and cytoplasmic CG-GECO1 from delimited ROI zones (Figure 3B) of individual NF-treated root hairs. The precise time for peak initiation (t1) for both GECO probes was compared by calculating the Δt1 value (CG-GECO1t1-NR-GECO1t1) for a large number of individual root hairs (Figure 4A). These analyses revealed that the majority of Ca2+ spiking (65%) initiated primarily and significantly in the nuclear compartment, while only 2% initiated first in the cytosol. In 30% of the cases, it was not possible to clearly distinguish differences between the Ca2+ spiking initiation sites.
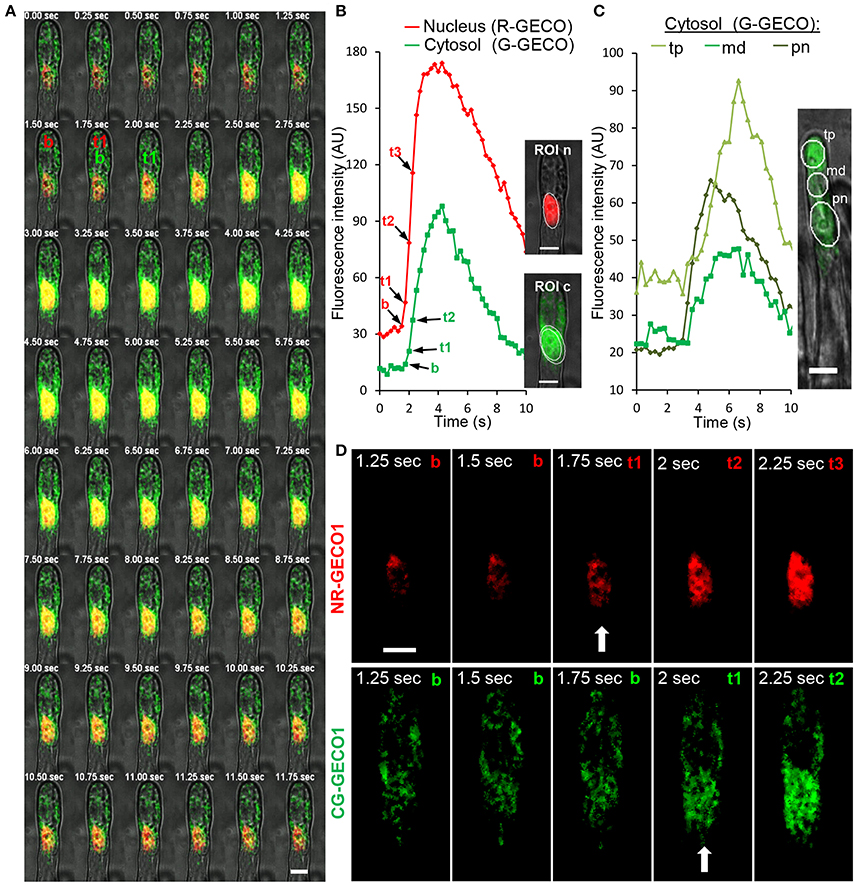
Figure 3. Spatiotemporal dynamics of Ca2+ spiking in nuclear and cytoplasmic compartments of a M. truncatula root hair responding to NFs. (A) A sequential frame-by-frame co-imaging (0.25 s intervals) of nuclear-targeted NR-GECO1 and cytosolic CG-GECO1 revealed coordinated responses during a single Ca2+ spike. (B) Relative fluorescence intensity traces of NR-GECO1 (red) and CG-GECO1 (green) from ROIs selected around the nuclear (ROI n) and perinuclear cytoplasmic (ROI c) regions. Images on the right represent the maximum projection of respective fluorescence images merged with bright field. (C) Relative fluorescence intensity (0.3 s intervals) of CG-GECO1 in selected cytoplasmic regions of interest in the perinuclear (pn), middle (md), or root hair tip (tp) regions during a NF-triggered Ca2+ spike. (D) Close view of selected fluorescence frames shown in (A). Time points representing baseline fluorescence [b in (A,B,D)], the start of the spike [t1 and arrow (A,B,D)], and subsequent spike rise time points [t2 and t3 in (A,B,D)] are indicated for NR-GECO1 and CG-GECO1. Scale bars represent 10 μm.
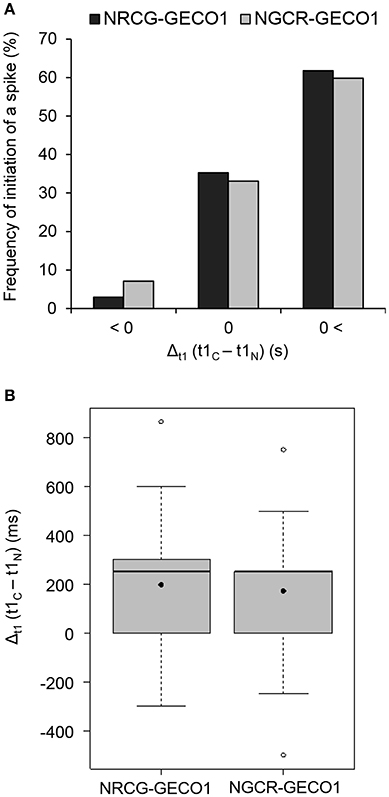
Figure 4. Monitoring NF-elicited Ca2+ signaling with dual GECO sensors reveals a preferential Ca2+ spike start in the nuclear compartment. Time values corresponding to the start of individual spikes (t1, illustrated in Figure 3B) were collected for each sensor and used to calculate the relative delay in the start of a spike. The time interval (Δt1 in s), between peak start measured by sensors, was calculated by subtracting nuclear t1 from cytoplasmic t1-values (t1C-t1N). A Δt1 value below 0 indicates a cytoplasmic-to-nucleus spike start (C → N), a Δt1-value close to 0 indicates coordinated cytoplasmic and nuclear spike start (C = N), and a positive Δt1-value indicates a nucleus-to-cytoplasmic spike start (C←N). These analyses were done with n = 68 (NRCG-GECO1) and n = 127 (NGCR-GECO1) individual spikes from 26 or 24 individual nuclei, respectively. (A) Frequency of the individual spikes showing C → N, C = N, and C←N patterns in the dual NRCG-GECO1 (dark gray) and NGCR-GECO1 (light gray) sensors. No significant differences were found between the sensors (p > 0.05, chi-square test of goodness-of-fit). Frequency distribution within the different categories (C → N, C = N, and C←N), for each dual sensor, is significantly different and not due to a random distribution (1/3 of observations in each category, p < 0.001, chi-square test of goodness-of-fit). (B) Time interval between spike start (Δt1 in ms) measured for each dual sensor. Average/median values for NRCG-GECO1 and NGCR-GECO1 of 197/250 and 174/250 ms, respectively, are not significantly different. Box plots represent first and third quartile (horizontal box sides), minimum and maximum (outside whiskers), median (central lines), and mean (solid black circle).
To exclude intrinsic differences between the sensors in the targeted compartments we generated a reverse dual sensor expressing R-GECO1 in the cytoplasm and the G-GECO1 in the nucleus (Figures S1, S8). Using the dual NGCR-GECO1 sensor we confirmed the preferential initiation of Ca2+ spiking in the nuclear compartment (Figure 4A). The time interval (Δt1) for the initiation of a spike between the nuclear and cytoplasmic compartments was similar for both dual sensors (Figure 4B), with median values of 250 ms. Taken together, the dual GECO1 Ca2+ sensors generated here allowed us to measure coordinated Ca2+ responses in different subcellular compartments of individual cells (Movies S3, S4) and to demonstrate that Ca2+ spiking primarily initiates in the nuclear compartment of root hair cells responding to rhizobial Nod factors.
Ca2+ Signal Dynamics in Both Nuclear and Cytoplasmic Compartments in A. thaliana Root Elongation Zone Cells
To investigate the use of the dual sensor in plant species other than M. truncatula, we stably transformed A. thaliana with the NRCG-GECO1.2 sensor (Figure S1) comprising improved versions of R-GECO1 and G-GECO1 (Zhao et al., 2011; Wu et al., 2013). Stable transgenic lines were propagated until the T3 generation under hygromycin selection and selected for expression of the dual sensor. CLSM imaging of A. thaliana roots demonstrated that CG-GECO1.2 and NR-GECO1.2 localized to the cytoplasmic and nucleoplasmic compartments, respectively (Figure S9). The stable transgenic line is phenotypically like wild type plants, indicating that the constitutive expression of the sensor does not interfere with cellular Ca2+ signaling and homeostasis (Figure S9). In A. thaliana roots transformed with aequorin or cameleon YC3.6, several studies have reported that biotic and abiotic stimuli induce Ca2+ release. As such, chitin, NaCl, ATP, and cold stress have been shown to induce Ca2+ release in the root elongation zone (Kiegle et al., 2000; Tanaka et al., 2010; Keinath et al., 2015). However, the subcellular dynamics of these stimuli-induced Ca2+ releases is lacking.
To monitor the dynamics of cytoplasmic vs. nucleoplasmic Ca2+ release in response to chitooctaose (CO8), NaCl, ATP and cold stress, we focused our study on the root epidermal cells of the elongation zone. Treating 5 day-old roots with CO8 to a final concentration of 10−7 M elicited an increase in cytoplasmic Ca2+ within 2 min of application in 73% of the plants tested (8/11 plants) (Figures 5A–C). Ca2+ release was detected only in the cytoplasmic region without any propagation to the nucleoplasm. The Ca2+ signature was characterized by a sharp increase followed by progressive smaller oscillations returning to baseline levels over a period of 15 min (Figure 5B). The Ca2+ signal was not detected after treatment with the buffer control (Figures 5D–F). Similarly, ATP to a final concentration of 100 μM induced a specific cytoplasmic Ca2+ release 7 min after application (Figure S10).
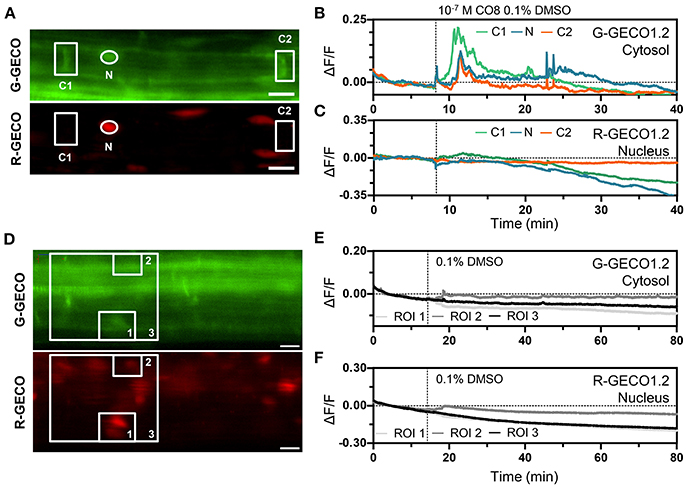
Figure 5. The dual Ca2+ sensor reports Ca2+ dynamics to CO8. (A–C) Representative Ca2+ signals induced by 10−7 M CO8 in a 5-day-old Arabidopsis root (elongation zone) expressing the dual Ca2+ reporter NRCG-GECO1.2 [(A), G-GECO1.2 channel (top); R-GECO1.2 channel (bottom)]. (B,C) Normalized fluorescence intensities in the G-GECO1.2 channel (B) and the R-GECO1.2 channel (C) of the ROIs marked in (A) (n = 8/11 plants). (D,F) 0.1% DMSO did not induce Ca2+ signals in a 5-day-old root (elongation zone) expressing the dual Ca2+ reporter NRCG-GECO1.2 [(D), G-GECO1.2 channel (top); R-GECO1.2 channel (bottom)]. (E,F) Normalized fluorescence intensities in the G-GECO1.2 channel (E) and the R-GECO1.2 channel (F) of the ROIs marked in (D) (n = 4 plants). Dashed vertical lines mark the moment of CO8 and DMSO application. Scale bars represent 20 μm.
The ATP-induced Ca2+ signature was similar to the CO8-induced Ca2+ release with a sharp peak followed by smaller oscillations, although their frequencies differed (0.6 min−1 for CO8 and 1.94 min−1 in the case of ATP) (Figure S10). In contrast to CO8 and ATP, which induced a specific cytoplasmic Ca2+ response with an oscillatory pattern, NaCl and cold induced Ca2+ release in both the cytoplasmic and nucleoplasmic compartments (Figures 6, 7, Movies S5, S6). Each of these stimuli induced a transient Ca2+ release first in the cytoplasm followed by a transient Ca2+ increase in the nucleoplasm (Figures 6, 7). However, the dynamics of each nucleoplasmic Ca2+ increase differ in their amplitudes and timing of activation. Cold shock induced a transient nucleoplasmic Ca2+ release 20 to 30 s after the cytoplasmic Ca2+ response (Figure 7). In contrast, NaCl treatment induced a Ca2+ response in the nucleus 2–3 s after cytoplasmic Ca2+ release (Figure 6). Additionally, the amplitude of NaCl-induced nucleoplasmic Ca2+ release is higher than the cytoplasmic Ca2+ release, which contrasts with the cold-induced nucleoplasmic Ca2+ signal, which is lower than the cytoplasmic Ca2+ signal. The differences in timing of activation and amplitude of the Ca2+ signals between both compartments strongly suggest that cold and NaCl induce distinct cytoplasmic and nucleoplasmic Ca2+ signals. The nucleoplasmic response might be a consequence of the cytoplasmic Ca2+ release, or induced independently. All together our results demonstrate that the dual sensor can effectively monitor Ca2+ dynamics simultaneously in the cytoplasm and nuclear regions in A. thaliana roots cells, and identify various Ca2+ signatures generated in response to biotic and abiotic stimuli.
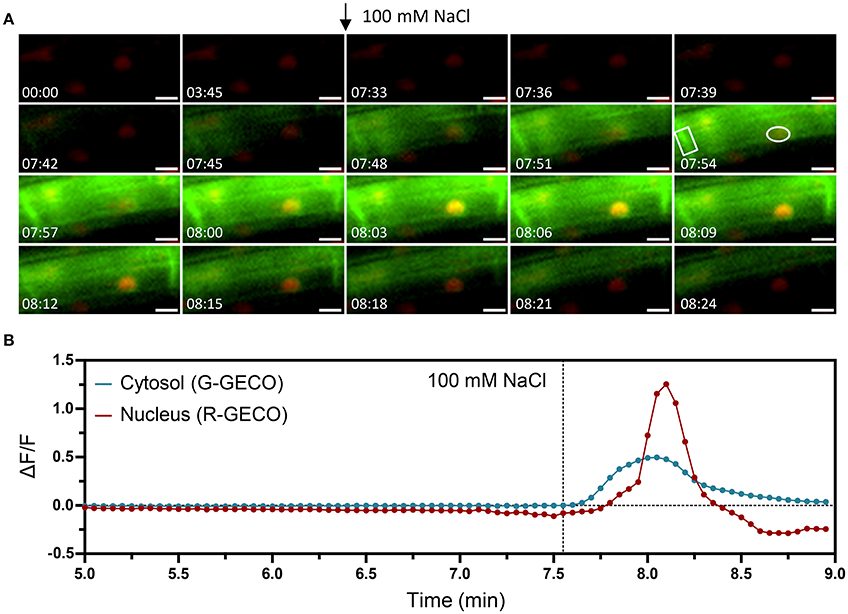
Figure 6. Nuclear and cytosolic Ca2+ signals in response to 100 mM NaCl. Ca2+ signals induced by salt stress in a 6-day-old Arabidopsis root (elongation zone) expressing the dual Ca2+ reporter NRCG-GECO1.2. (A) Time-lapse images overlaying the G-GECO1.2 channel (green) and the R-GECO1.2 (red) showing the progression of the salt-induced signal through a cell (timestamps are in minutes and seconds and treatment application is marked with an arrow). (B) Normalized fluorescence intensities in the cytosol quantified in the G-GECO1.2 channel (blue) and in the nucleus quantified in the R-GECO1.2 channel (red). The areas quantified are marked in (A). Dashed vertical line marks the moment of treatment with NaCl to a final concentration of 100 mM (n = 7/8 plants). Scale bars represent 10 μm.
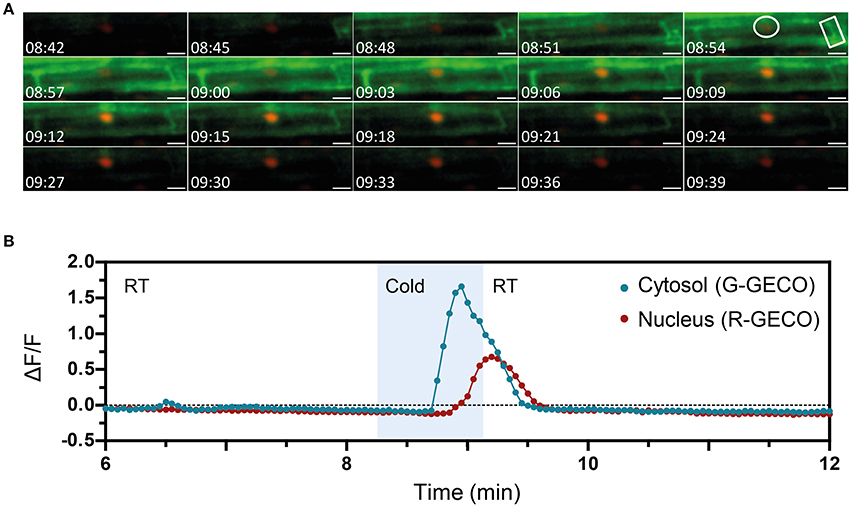
Figure 7. The nuclear and cytosolic Ca2+ signals in response to cold are distinct. Ca2+ signals induced by cold treatment in a 6-day-old Arabidopsis root (elongation zone) expressing the dual Ca2+ reporter NRCG-GECO1.2. (A) Time-lapse images overlaying the G-GECO1.2 channel (green) and the R-GECO1.2 (red) showing the progression of the cold-induced signal through a cell (timestamps are in minutes and seconds). Cold was perfused between 08:15 and 09:09. (B) Normalized fluorescence intensities in the cytosol quantified in the G-GECO1.2 channel (blue) and in the nucleus quantified in the R-GECO1.2 channel (red). The areas quantified are marked in (A). Area shaded in blue corresponds to the period of cold perfusion (n = 4 plants). Scale bars represent 50 μm.
Discussion
Recent years have witnessed powerful advances in genetically-encoded fluorescent Ca2+ sensors, notably with the development of single fluorescent protein GECIs, the GECOs (Zhao et al., 2011). These sensors were engineered to emit fluorescence at different wavelengths, thus enabling multicolor and multiparameter imaging in eukaryotic cells (Zhao et al., 2011; Ngo et al., 2014; Odaka et al., 2014; Waadt et al., 2017). Moreover, the GECOs have a higher sensitivity compared to the FRET-based cameleon YC3.6 (Keinath et al., 2015), which we confirmed in response to symbiotic factors in M. truncatula roots. The availability of multicolor Ca2+ sensors with greater dynamic ranges increases the possibility of exploring Ca2+ dynamics at the subcellular level and, notably, the interconnection between Ca2+ releases from different compartments. As such, the relation between cytoplasmic and nuclear Ca2+ signals, which remains unclear at the cellular level in planta, can now be addressed with increased resolution. Thus, we took advantage of the separate fluorescence emission windows of G-GECO (500–550 nm) and R-GECO (600–643 nm) to simultaneously assess Ca2+ dynamics in those contiguous cellular compartments. By targeting each of them to either the cytoplasm or the nucleoplasm, we developed the new dual sensors, NRCG-GECO1, NGCR-GECO1, and NRCG-GECO1.2 that allowed the simultaneous monitoring of nuclear and cytoplasmic Ca2+ dynamics in M. truncatula and A. thaliana root cells in response to biotic and abiotic stimuli. Despite the different association rates (Kon) of R-GECO and G-GECO (Zhao et al., 2011), these values are in the order of 109-1015 M−1·s−1, which means that binding of either sensor to Ca2+ occurs faster than image capture. Therefore, any differences observed in the response times between the nucleus and the cytosol are intrinsically biological.
In legume symbioses, nitrogen-fixing rhizobial NF and mycorrhizal factors induce Ca2+ oscillations in perinuclear and nuclear compartments. Although the importance of cytoplasmic Ca2+-mediated signal transduction is unknown, nuclear-localized Ca2+ is essential to activate a nuclear-localized Ca2+ and calmodulin-dependent kinase (CCaMK), that assures downstream transcriptional regulation of endosymbiotic programs (Zipfel and Oldroyd, 2017). Due to the lack of resolution, nuclear Ca2+ oscillations appeared synchronized between the nucleoplasm and the adjacent cytoplasmic region (Capoen et al., 2011). Furthermore, the ion channels and pump required to generate the symbiotic factor-induced Ca2+ oscillations were reported to localize to both the INM and ONM, although preferential localization of DMI1 to the INM was demonstrated (Capoen et al., 2011; Charpentier et al., 2016). Thus, the nuclear Ca2+ oscillations could start simultaneously or specifically from either nuclear membrane (Capoen et al., 2011). Using the NRCG-GECO1 and NGCR-GECO1 sensors, we demonstrated that Ca2+ release initiates inside the nucleoplasm in the majority of M. truncatula root hair cells elicited by NFs. This result unravels that the ion channels are activated first at the INM. This further suggests that the secondary messenger activating CNGC15 or DMI1 must either diffuse via the nucleopores or be produced inside the nucleus. Several nucleoporin mutants have been shown to be impaired in the generation of the nuclear Ca2+ oscillations in a temperature sensitive manner (Kanamori et al., 2006; Saito et al., 2007; Groth et al., 2010). However, their precise roles in this regulation remains unclear. Although the nucleoporins have been proposed to regulate the trafficking of the ion channels to the INM, our results suggest that they might be involved in the trafficking of the secondary messenger or proteins required for the activation of nuclear calcium oscillations.
Our studies further revealed the advantage of the dual GECO sensor to monitor subcellular Ca2+ dynamics in adjacent cytoplasm and nucleoplasm compartments of A. thaliana cells. By using a stably transformed dual sensor line we compared the dynamics of Ca2+ simultaneously in the cytoplasm and nucleoplasm of epidermal cells of the root elongation zone in response to diverse stimuli. We demonstrated that different stimuli (CO8, NaCl, ATP and cold shock) can generate, within the same cell type, diverse Ca2+ responses in the cytoplasmic and nucleoplasmic compartments. Notably, CO8 and ATP trigger cytoplasmic-associated oscillatory Ca2+ releases that do not diffuse to the nucleoplasm, suggesting that Ca2+ buffering proteins or Ca2+ uptake mechanisms are rapidly recruited or activated, respectively, to avoid Ca2+ diffusion into the nucleus. Interestingly, the ATP-induced Ca2+ signals in root cells of the elongation zone differ from a previous study showing dual cytoplasmic and nuclear Ca2+ releases (Krebs et al., 2012). This discrepancy might be due to the analysis of distinct root cells displaying specific ATP-induced Ca2+ responses, as the same stimulus can elicit different cell type-specific Ca2+ signatures (Kiegle et al., 2000). These findings further highlight the importance of monitoring Ca2+ dynamics in the same cell type to aptly compare stimuli-induced Ca2+ signatures and correlate the Ca2+ signature to a biological response. In contrast to CO8 and ATP, cold- and NaCl-induced transient Ca2+ signals first in the cytoplasm and then in the nucleoplasm. However, the NaCl- and cold-induced Ca2+ signatures in both compartments differ in amplitude and timing of activation, suggesting the involvement of different channels and/or pumps. Notably, the NaCl-induced nucleoplasmic Ca2+ signal was observed earlier (within 2 s) than the cold-induced Ca2+ signal (within 25 s), following the cytoplasmic Ca2+ release. Moreover, The NaCl-induced nucleoplasmic Ca2+ signal had a higher amplitude than the cytoplasmic Ca2+ signal, which contrasts with the cold-induced Ca2+ signal, smaller in amplitude. These results support the induction of nuclear Ca2+ signals independently of the cytoplasmic Ca2+ release, as implied by a recent study regarding the NaCl-induced cytoplasmic/nuclear Ca2+ dynamics (Huang et al., 2017). Alternatively, the cytoplasmic Ca2+ release might be contributing to the generation of the nuclear Ca2+ signal either by diffusion or by triggering a Ca2+-induced Ca2+ release mechanism at the nuclear envelope.
In summary, the cytoplasmic and nucleoplasmic dual sensors developed in this work are powerful tools to analyze the subcellular Ca2+ dynamics between the cytoplasm and nucleus in planta. These sensors will unequivocally be of interest in exploring Ca2+-mediated signaling in response to diverse stimuli in different plant species.
Materials and Methods
DNA Constructs
The single and dual GECO Ca2+ sensor constructs (Figure S1) were assembled using Golden Gate cloning. All GECO1.0 sensors were cloned under the control of the double cauliflower mosaic virus 35S promoter (2xp35S) and the 35S terminator in the Golden Gate compatible vector pCambiaCR1 ΔDsRed (Fliegmann et al., 2016) kindly provided by C. Rosenberg (LIPM). PCR amplification of the individual sequence modules was done using Phusion Taq high fidelity DNA polymerase (New England Biolabs) and respective DNA templates and primer pairs are listed in Table S1. Amplified DNA fragments flanked by BsaI and specific cohesive protruding ends were cloned into pBlueScript II (Agilent) and validated by sequencing before being used in Golden Gate assembly reactions (Engler and Marillonnet, 2014). All level 0 modules used in the dual NRCG-GECO1.2 sensor were synthesized by Life Technologies™ (ThermoFisher Scientific). All assembled Golden Gate binary vectors were verified by PCR, DNA sequencing and restriction digestion before transformation into Agrobacterium. The cameleon Ca2+ sensors NUP-YC2.1 and NLS-YC3.6 used here were previously generated in Sieberer et al. (2009) and Krebs et al. (2012).
Plant Material and Bacterial Strains
Four M. truncatula cv Jemalong A17 lines were used in this study: the wild type and the symbiotic mutants nfp-2 (Arrighi et al., 2006) dmi1-1 and dmi3-1 (Catoira et al., 2000; Wais et al., 2000). M. truncatula seeds were scarified with sulfuric acid, then surface-sterilized prior to germination and grown on inverted soft Campbel agar plates (http://www.noble.org/medicagohandbook). Arabidopsis seeds were surface-sterilized in 1.5% bleach for 15 min, followed by five washes in sterile water, and then plated in Murashige and Skoog (MS) solid medium (1% sucrose). After 3–5 days at 4°C, plates were moved to a growth cabinet (23°C, 16-h photoperiod, and 300 μmol·m−2·s−1 light intensity) for germination and growth. The Escherichia coli DH5α strain was used for plasmid propagation, the A. rhizogenes Arqua1 strain (Quandt et al., 1993) strain for the generation M. truncatula composite plants and the A. tumefaciens GV3101 (Koncz and Schell, 1986) strain for stable transformation of A. thaliana.
Generation and in Vitro Culture of Agrobacterium-Transformed M. truncatula and A. thaliana
A. rhizogenes-mediated transformation hairy root transformation of M. truncatula was performed as described in Boisson-Dernier et al. (2001) with minor modifications. Germinated seedlings were sectioned ~3 mm from the root tip and inoculated with a 3–4 μL drop of A. rhizogenes bacterial suspension adjusted to an OD600nm of 1 in water. Inoculated seedlings were placed on Fahraeus/agar plates supplemented with 0.5 mM ammonium nitrate and kanamycin (25 mg.L−1). Plates were partially sealed with parafilm to allow crucial gas exchanges and placed in a 20°C growth chamber (16-h photoperiod and a light intensity of 70 μE·m−2·s−1) for 1 week before transferring to 25°C. About 2 weeks-post-inoculation, kanamycin-resistant composite plants were transferred to a beaker containing sterile water supplemented with 200 mg·L−1 augmentin (amoxicillin:clavulanic acid [5:1], GlaxoSmithKline), and incubated for at least 30 min, in order to reduce the growth of A. rhizogenes. Plants were rinsed twice before being transferred to square plates containing a nitrogen-free modified Fahraeus medium with 0.5% [w/v] phytagel (Sigma-Aldrich) and supplemented with 50 nM 2-amino-ethoxyvinyl-Gly (AVG), adapted for in vivo microscopic observations as described in Fournier et al. (2008). Transgenic roots were covered with a sterile, gas-permeable and transparent plastic film (Lumox film, Starsted) that allows the use of water-immersion objectives during imaging. Square plates with composite plants were slightly tilted to encourage the growth of the roots along the plastic film. The lower part of the square plate was wrapped in black plastic to protect the roots from light. M. truncatula ROCs expressing the NR-GECO1 sensor were obtained from transgenic composite plants as described by Boisson-Dernier et al. (2001). ROCs were cultured on M medium (Boisson-Dernier et al., 2001) and propagated vertically until used for microscopy observations.
A. thaliana stable transgenic plants were generated using the floral dip method (Clough and Bent, 1998) and selected in 50 μg·mL−1 hygromycin B.
Selection and Symbiotic Treatments of M. truncatula Transformed Roots
Kanamycin-resistant A. rhizogenes-transformed composite plants or ROCs transformed with cameleon or GECO1 constructs were screened for expression of the respective fluorescent sensors using fluorescence stereomicroscopes (Leica MZFLIII and Zeiss axiozoom V16) and a Zeiss Axiophot epifluorescent microscope. Selection of transgenic roots was done using filters adapted to detect yellow/green YFP/GFP (excitation: 470–510 nm; emission: 525–575 nm) or red mApple (excitation: 577–587 nm, emission: 620–680 nm) fluorescent proteins from the different cameleon or GECO1 sensors. Only composite plants with fluorescent transgenic roots were transferred to plates containing nitrogen-free modified 0.5% [w/v] phytagel Fahraeus medium for imaging 3–5 days later. Transgenic roots lying on the medium and covered by a gas-permeable film were treated with 1 to 2 mL of a freshly diluted aqueous solution of purified S. meliloti NFs (10−9 M) or CO4 (10−5 M or 10−7 M) that were added to plates between the plastic film and the medium with the help of a micropipette. In the case of ROCs, imaging was performed with excised root sections that were mounted between a slide and a cover slip. Confocal imaging was performed before treatments to assess the background fluorescence levels, and then initiated about 5 min after treatment for a total period of up to 1 h.
Confocal Imaging of Calcium Responses in Transgenic M. truncatula and Arabidopsis Roots
The comparison between the nuclear NR-GECO1, the NUP-YC2.1 and the NLS-YC3.6 Yellow Cameleon sensors was performed using a Leica TCS SP2 AOBS confocal laser-scanning microscope equipped with a long-distance 40x water-immersion objective (HCX Apo L 0.80). The 458 nm argon laser was used to excite the CFP of the cameleon sensors (pinhole diameter at 4 Airy units). Fluorescence emission was collected in the 470–500 nm range for CFP and 530–570 nm range for YFP. Images were acquired at 5 s intervals from 5 to 60 min either before or after treatment with a 512 × 512 pixels resolution. The 561 nm diode was used to excite the mApple red fluorescence protein of the NR-GECO1 sensor (pinhole diameter at 3 Airy units) and fluorescence was visualized in the specific 580 to 643 nm emission window. The laser intensity used for the cameleon probes (80% power setting, Sieberer et al., 2009) was reduced to 20% for monitoring Ca2+ responses with the NR-GECO1 sensor in order to avoid photo bleaching of the red fluorescence during long acquisitions. Confocal imaging of transgenic roots expressing the dual NRCG-GECO1 and NGCR-GECO1 sensors was done using a beam-splitter Leica TCS SP8 AOBS confocal laser-scanning microscope equipped with a 25x water-immersion objective. The 488 nm argon laser was used to excite the G-GECO1 and the 561 nm diode to excite the R-GECO1. Fluorescent images were recorded simultaneously for NRCG-GECO1 and NGCR-GECO1, using emission windows of 500–550 nm and 600–643 nm for G-GECO1 and R-GECO1 signals, respectively. Fluorescence emission ranges were specifically set for each fluorescent protein in order to avoid overlap between the G-GECO1 and R-GECO1 signals, as detailed in Figure S6. Images were acquired in 200 to 500 ms intervals with a scanning resolution of 512 × 128 pixel. Images were acquired using the Leica confocal software.
The subcellular localization of the GECO1.2 Ca2+ reporters was assessed in 6-day-old roots by CLSM using a Zeiss LSM 780 equipped with a 25x/0.8 water objective. G-GECO1.2 was excited at 488 nm and the emitted light was captured between 463 and 500 nm. R-GECO1.2 was excited at 561 nm and emitted fluorescence captured in the 571–640 nm range. For Ca2+ imaging, plants were analyzed 5–6 days after germination and carefully mounted in a perfusing (cold treatment) or non-perfusing chamber. Perfusion of cold media was performed using a RC-21BR chamber (Warner Instruments). For ATP, CO8, and NaCl treatments, the elicitors were applied at a 10x concentration to an open chamber made with cover glass and sealed with vacuum grease. After mounting in liquid MS (1% sucrose), samples were incubated at room temperature for at least 15 min before imaging. Ca2+ imaging was performed using a Nikon ECLIPSE FN1. The fluorophores were excited at a wavelength of 470 ± 24 nm. Emitted fluorescence was separated by an image splitter and passed through an emission filter of 520 ± 40 nm for G-GECO1.2, and 632 ± 60 nm for R-GECO1.2 (Optosplit, Cairn Research, UK). Images were collected every 2 or 3 s.
Image Analysis
Processing, final cropping, and mounting of the Medicago images were performed using Fiji. The fluorescence, merged images and Supplementary time-lapse movies were obtained after applying a median filter of 2 pixel radius to fluorescence image series. Intensity data was calculated from selected ROI, delimited in individual root hairs within the nuclear region (for nuclear-localized sensors) or tailored in the perinuclear, middle or root hair tip regions (for cytoplasmic sensors). To quantify relative Ca2+ spiking amplitudes, the average fluorescence for each ROI was calculated and used to determine the SNR of individual spikes collected from independent roots and biological experiments. The SNR of a given spike measures the difference between the fluorescence baseline and the maximum fluorescence peak value. The SNR values of individual spikes were obtained by calculating the ΔF/F (Fmax-Fmin/Fmin) or ΔR/R (Rmax-Rmin/Rmin), in which Fmax and Rmax correspond to the maximum fluorescence value or ratio change of a spike and Fmin and Rmin correspond to the data point before the onset of a spike.
For image processing of the Arabidopsis data the following steps were conducted using ImageJ 1.48v: background subtraction, registration using MultiStackReg v1.45 (http://bradbusse.net/sciencedownloads.html), and application of a lookup table. Image data were obtained from processed images using Time Series Analyzer V3_2 (https://imagej.nih.gov/ij/plugins/time-series.html). Normalized datasets (ΔF/F) were calculated as (F–F0)/F0, where F0 represent the average of at least 2 min of baseline values (before treatment).
Statistical Analyses
Statistical analyses were performed using R (http://r-project.org). Data were evaluated for normality with the Shapiro-Wilk test and homogeneity of variance with Levenne or Bartlett tests. Parametric (ANOVA) or non-parametric (Kruskal-Wallis) statistical tests were used, respectively, for normally-distributed data and non normally-distributed data. Signal periodicity values of calcium sensors were first transformed into normality using Box-Cox (λ = 0.0606), before statistical analysis using one-way ANOVA followed by Tukey honest difference (HSD) tests. Statistical analysis of signal-to-baseline ratio was done using the non-parametrical Kruskal-Wallis test. For the dual GECO sensors, statistical analyses of the start of a calcium spike was done using a chi-square test (p < 0.05) to (i) compare the frequency of observations in each category to an expected frequency of 1/3 per category if the distribution was random and (ii) to compare the number of observations per category for each sensor grouped in a contingency table.
Author Contributions
MyC and FdC-N: conceived the project; AK, NL, MyC, and FdC-N: designed the experiments; AK: performed the M. truncatula and NL: the A. thaliana experiments; MiC: contributed to the NLS-R-GECO1 in ROCs experiments; AK and NL: prepared the figures; AK, NL, MyC, and FdC-N: wrote the manuscript; MyC and FdC-N: are co-responsible for the work.
Conflict of Interest Statement
The authors declare that the research was conducted in the absence of any commercial or financial relationships that could be construed as a potential conflict of interest.
Acknowledgments
We thank David Barker and Joelle Fournier for critical reading of the manuscript, Christian Mazars and Martin Parniske for valuable discussions, Lisa Frances for contributing to the cloning of the R-GECO1 version, Fabienne Maillet for kindly providing purified S. meliloti NFs, and Charles Rosemberg for the pCambia Golgen Gate vectors. The CMV-NLS-R-GECO (Addgene plasmid #32447) and CMV-G-GECO1.0 (Addgene plasmid #32462) were generated and provided by Robert Campbell via Addgene, while the YC3.6 construct was kindly provided by Melanie Krebs and Karin Schumacher. AK was supported by a Ph.D. grant of the French Ministry of Education and Research, NL was supported by a Ph.D. studentship from the John Innes Foundation. MyC was supported by BBSRC (BB/P007112/1) and John Innes Centre, and FdC-N lab work was supported by the ANR COME-IN (grant no. ANR-14-CE35-0007-01) and TULIP (grant no. ANR-10-LABX-41) grants.
Supplementary Material
The Supplementary Material for this article can be found online at: https://www.frontiersin.org/articles/10.3389/fpls.2018.00245/full#supplementary-material
References
Allen, G. J., Kwak, J. M., Chu, S. P., Llopis, J., Tsien, R. Y., Harper, J. F., et al. (1999). Cameleon calcium indicator reports cytoplasmic calcium dynamics in Arabidopsis guard cells. Plant J. 19, 735–747. doi: 10.1046/j.1365-313x.1999.00574.x
Ané, J. M., Kiss, G. B., Riely, B. K., Penmetsa, R. V., Oldroyd, G. E., Ayax, C., et al. (2004). Medicago truncatula DMI1 required for bacterial and fungal symbioses in legumes. Science 303, 1364–1367. doi: 10.1126/science.1092986
Arrighi, J. F., Barre, A., Ben Amor, B., Bersoult, A., Soriano, L. C., Mirabella, R. F., et al. (2006). The Medicago truncatula lysin [corrected] motif-receptor-like kinase gene family includes NFP and new nodule-expressed genes. Plant Physiol. 142, 265–279. doi: 10.1104/pp.106.084657
Bajar, B. T., Wang, E. S., Zhang, S., Lin, M. Z., and Chu, J. (2016). A guide to fluorescent protein FRET Pairs. Sensors 16:1488. doi: 10.3390/s16091488
Boisson-Dernier, A., Chabaud, M., Garcia, F., Bécard, G., Rosenberg, C., and Barker, D. G. (2001). Agrobacterium rhizogenes-transformed roots of Medicago truncatula for the study of nitrogen-fixing and endomycorrhizal symbiotic associations. Mol. Plant Microbe Interact. 14, 695–700. doi: 10.1094/MPMI.2001.14.6.695
Bonza, M. C., Loro, G., Behera, S., Wong, A., Kudla, J., and Costa, A. (2013). Analyses of Ca2+ accumulation and dynamics in the endoplasmic reticulum of Arabidopsis root cells using a genetically encoded Cameleon sensor. Plant Physiol. 163, 1230–1241. doi: 10.1104/pp.113.226050
Capoen, W., Sun, J., Wysham, D., Otegui, M. S., Venkateshwaran, M., Hirsch, S., et al. (2011). Nuclear membranes control symbiotic calcium signaling of legumes. Proc. Natl. Acad. Sci. U.S.A. 108, 14348–14353. doi: 10.1073/pnas.1107912108
Catoira, R., Galera, C., de Billy, F., Penmetsa, R. V., Journet, E. P., Maillet, F., et al. (2000). Four genes of Medicago truncatula controlling components of a nod factor transduction pathway. Plant Cell 12, 1647–1666. doi: 10.1105/tpc.12.9.1647
Chabaud, M., Genre, A., Sieberer, B. J., Faccio, A., Fournier, J., Novero, M., et al. (2011). Arbuscular mycorrhizal hyphopodia and germinated spore exudates trigger Ca2+ spiking in the legume and nonlegume root epidermis. New Phytol. 189, 347–355. doi: 10.1111/j.1469-8137.2010.03464.x
Charpentier, M., and Oldroyd, G. E. (2013). Nuclear calcium signaling in plants. Plant Physiol. 163, 496–503. doi: 10.1104/pp.113.220863
Charpentier, M., Sun, J., Vaz Martins, T., Radhakrishnan, G. V., Findlay, K., Soumpourou, E., et al. (2016). Nuclear-localized cyclic nucleotide-gated channels mediate symbiotic calcium oscillations. Science 352, 1102–1105. doi: 10.1126/science.aae0109
Clough, S. J., and Bent, A. F. (1998). Floral dip: a simplified method for Agrobacterium-mediated transformation of Arabidopsis thaliana. Plant J. 16, 735–743.
Costa, A., Drago, I., Behera, S., Zottini, M., Pizzo, P., Schroeder, J. I., et al. (2010). H2O2 in plant peroxisomes: an in vivo analysis uncovers a Ca(2+)-dependent scavenging system. Plant J. 62, 760–772. doi: 10.1111/j.1365-313X.2010.04190.x
Dodd, A. N., Kudla, J., and Sanders, D. (2010). The language of calcium signaling. Annu. Rev. Plant Biol. 61, 593–620. doi: 10.1146/annurev-arplant-070109-104628
Domínguez, D. C., Guragain, M., and Patrauchan, M. (2015). Calcium binding proteins and calcium signaling in prokaryotes. Cell Calcium 57, 151–165. doi: 10.1016/j.ceca.2014.12.006
Ehrhardt, D. W., Wais, R., and Long, S. R. (1996). Calcium spiking in plant root hairs responding to Rhizobium nodulation signals. Cell 85, 673–681. doi: 10.1016/S0092-8674(00)81234-9
Engler, C., and Marillonnet, S. (2014). Golden gate cloning. Methods Mol. Biol. 1116, 119–131. doi: 10.1007/978-1-62703-764-8_9
Fliegmann, J., Jauneau, A., Pichereaux, C., Rosenberg, C., Gasciolli, V., Timmers, A. C., et al. (2016). LYR3, a high-affinity LCO-binding protein of Medicago truncatula, interacts with LYK3, a key symbiotic receptor. FEBS Lett. 590, 1477–1487. doi: 10.1002/1873-3468.12191
Fournier, J., Timmers, A. C., Sieberer, B. J., Jauneau, A., Chabaud, M., and Barker, D. G. (2008). Mechanism of infection thread elongation in root hairs of Medicago truncatula and dynamic interplay with associated rhizobial colonization. Plant Physiol. 148, 1985–1995. doi: 10.1104/pp.108.125674
Galon, Y., Finkler, A., and Fromm, H. (2010). Calcium-regulated transcription in plants. Mol. Plant 3, 653–669. doi: 10.1093/mp/ssq019
Genre, A., Chabaud, M., Balzergue, C., Puech-Pagès, V., Novero, M., Rey, T., et al. (2013). Short-chain chitin oligomers from arbuscular mycorrhizal fungi trigger nuclear Ca2+ spiking in Medicago truncatula roots and their production is enhanced by strigolactone. New Phytol. 198, 190–202. doi: 10.1111/nph.12146
Granqvist, E., Wysham, D., Hazledine, S., Kozlowski, W., Sun, J., Charpentier, M., et al. (2012). Buffering capacity explains signal variation in symbiotic calcium oscillations. Plant Physiol. 160, 2300–2310. doi: 10.1104/pp.112.205682
Groth, M., Takeda, N., Perry, J., Uchida, H., Dräxl, S., Brachmann, A., et al. (2010). NENA, a Lotus japonicus homolog of Sec13, is required for rhizodermal infection by arbuscular mycorrhiza fungi and rhizobia but dispensable for cortical endosymbiotic development. Plant Cell 22, 2509–2526. doi: 10.1105/tpc.109.069807
Huang, F., Luo, J., Ning, T., Cao, W., Jin, X., Zhao, H., et al. (2017). Cytosolic and nucleosolic calcium signaling in response to osmotic and salt stresses are independent of each other in roots of Arabidopsis seedlings. Front. Plant Sci. 8:1648. doi: 10.3389/fpls.2017.01648
Iwano, M., Entani, T., Shiba, H., Kakita, M., Nagai, T., Mizuno, H., et al. (2009). Fine-tuning of the cytoplasmic Ca2+ concentration is essential for pollen tube growth. Plant Physiol. 150, 1322–1334. doi: 10.1104/pp.109.139329
Kanamori, N., Madsen, L. H., Radutoiu, S., Frantescu, M., Quistgaard, E. M., Miwa, H., et al. (2006). A nucleoporin is required for induction of Ca2+ spiking in legume nodule development and essential for rhizobial and fungal symbiosis. Proc. Natl. Acad. Sci. U.S.A. 103, 359–364. doi: 10.1073/pnas.0508883103
Keinath, N. F., Waadt, R., Brugman, R., Schroeder, J. I., Grossmann, G., Schumacher, K., et al. (2015). Live cell imaging with R-GECO1 sheds light on flg22- and chitin-induced transient [Ca(2+)]cyt patterns in Arabidopsis. Mol. Plant 8, 1188–1200. doi: 10.1016/j.molp.2015.05.006
Kiegle, E., Moore, C. A., Haseloff, J., Tester, M. A., and Knight, M. R. (2000). Cell-type-specific calcium responses to drought, salt and cold in the Arabidopsis root. Plant J. 23, 267–278. doi: 10.1046/j.1365-313x.2000.00786.x
Knight, M. R., Campbell, A. K., Smith, S. M., and Trewavas, A. J. (1991). Transgenic plant aequorin reports the effects of touch and cold-shock and elicitors on cytoplasmic calcium. Nature 352, 524–526. doi: 10.1038/352524a0
Koncz, C., and Schell, J. (1986). The promoter of TL-DNA gene 5 controls the tissue-specific expression of chimaeric genes carried by a novel type of Agrobacterium binary vector. Mol. Gen. Genet. 204, 383–396. doi: 10.1007/BF00331014
Kosuta, S., Hazledine, S., Sun, J., Miwa, H., Morris, R. J., Downie, J. A., et al. (2008). Differential and chaotic calcium signatures in the symbiosis signaling pathway of legumes. Proc. Natl. Acad. Sci. U.S.A. 105, 9823–9828. doi: 10.1073/pnas.0803499105
Krebs, M., Held, K., Binder, A., Hashimoto, K., Den Herder, G., Parniske, M., et al. (2012). FRET-based genetically encoded sensors allow high-resolution live cell imaging of Ca2+ dynamics. Plant J. 69, 181–92. doi: 10.1111/j.1365-313X.2011.04780.x
Kudla, J., Batistic, O., and Hashimoto, K. (2010). Calcium signals: the lead currency of plant information processing. Plant Cell 22, 541–563. doi: 10.1105/tpc.109.072686
Loro, G., Drago, I., Pozzan, T., Schiavo, F. L., Zottini, M., and Costa, A. (2012). Targeting of Cameleons to various subcellular compartments reveals a strict cytoplasmic/mitochondrial Ca2+ handling relationship in plant cells. Plant J. 71, 1–13. doi: 10.1111/j.1365-313X.2012.04968.x
Loro, G., Wagner, S., Doccula, F. G., Behera, S., Weinl, S., Kudla, J., et al. (2016). Chloroplast-specific in vivo Ca2+ imaging using yellow cameleon fluorescent protein sensors reveals organelle-autonomous Ca2+ signatures in the stroma. Plant Physiol. 171, 2317–2330. doi: 10.1104/pp.16.00652
McAinsh, M. R., and Pittman, J. K. (2009). Shaping the calcium signature. New Phytol. 181, 275–294. doi: 10.1111/j.1469-8137.2008.02682.x
McCombs, J. E., and Palmer, A. E. (2008). Measuring calcium dynamics in living cells with genetically encodable calcium indicators. Methods 46, 152–159. doi: 10.1016/j.ymeth.2008.09.015
Miwa, H., Sun, J., Oldroyd, G. E., and Downie, J. A. (2006a). Analysis of calcium spiking using a cameleon calcium sensor reveals that nodulation gene expression is regulated by calcium spike number and the developmental status of the cell. Plant J. 48, 883–894. doi: 10.1111/j.1365-313X.2006.02926.x
Miwa, H., Sun, J., Oldroyd, G. E., and Downie, J. A. (2006b). Analysis of Nod-factor-induced calcium signaling in root hairs of symbiotically defective mutants of Lotus japonicus. Mol. Plant Microbe Interact. 19, 914–923. doi: 10.1094/MPMI-19-0914
Miyawaki, A., Llopis, J., Heim, R., McCaffery, J. M., Adams, J. A., Ikura, M., et al. (1997). Fluorescent indicators for Ca2+ based on green fluorescent proteins and calmodulin. Nature 388, 882–887. doi: 10.1038/42264
Nakao, S., Wakabayashi, S., and Nakamura, T. Y. (2015). Stimulus-dependent regulation of nuclear Ca2+ signaling in cardiomyocytes: a role of neuronal calcium sensor-1. PLoS ONE 10:e0125050. doi: 10.1371/journal.pone.0125050
Ngo, Q. A., Vogler, H., Lituiev, D. S., Nestorova, A., and Grossniklaus, U. (2014). A calcium dialog mediated by the FERONIA signal transduction pathway controls plant sperm delivery. Dev Cell 29, 491–500. doi: 10.1016/j.devcel.2014.04.008
Odaka, H., Arai, S., Inoue, T., and Kitaguchi, T. (2014). Genetically-encoded yellow fluorescent cAMP indicator with an expanded dynamic range for dual-color imaging. PLoS ONE 9:e100252. doi: 10.1371/journal.pone.0100252
Quandt, H.-J., Pühler, A., and Broer, I. (1993). Transgenic root nodules of Vicia hirsuta: a fast and efficient system for the study of gene expression in indeterminate-type nodules. MPMI 6, 699–706. doi: 10.1094/MPMI-6-699
Ranty, B., Cotelle, V., Galaud, J. P., and Mazars, C. (2012). Nuclear calcium signaling and its involvement in transcriptional regulation in plants. Adv. Exp. Med. Biol. 740, 1123–1143. doi: 10.1007/978-94-007-2888-2_51
Reddy, A. S., Ali, G. S., Celesnik, H., and Day, I. S. (2011). Coping with stresses: roles of calcium- and calcium/calmodulin-regulated gene expression. Plant Cell 23, 2010–2032. doi: 10.1105/tpc.111.084988
Rodriguez-Garcia, A., Rojo-Ruiz, J., Navas-Navarro, P., Aulestia, F. J., Gallego-Sandin, S., Garcia-Sancho, J., et al. (2014). GAP, an aequorin-based fluorescent indicator for imaging Ca2+ in organelles. Proc. Natl. Acad. Sci. U.S.A. 111, 2584–2589. doi: 10.1073/pnas.1316539111
Saito, K., Yoshikawa, M., Yano, K., Miwa, H., Uchida, H., Asamizu, E., et al. (2007). NUCLEOPORIN85 is required for calcium spiking, fungal and bacterial symbioses, and seed production in Lotus japonicus. Plant Cell 19, 610–624. doi: 10.1105/tpc.106.046938
Shaw, S. L., and Long, S. R. (2003). Nod factor elicits two separable calcium responses in Medicago truncatula root hair cells. Plant Physiol. 131, 976–984. doi: 10.1104/pp.005546
Sieberer, B. J., Chabaud, M., Fournier, J., Timmers, A. C., and Barker, D. G. (2012). A switch in Ca2+ spiking signature is concomitant with endosymbiotic microbe entry into cortical root cells of Medicago truncatula. Plant J. 69, 822–830. doi: 10.1111/j.1365-313X.2011.04834.x
Sieberer, B. J., Chabaud, M., Timmers, A. C., Monin, A., Fournier, J., and Barker, D. G. (2009). A nuclear-targeted cameleon demonstrates intranuclear Ca2+ spiking in Medicago truncatula root hairs in response to rhizobial nodulation factors. Plant Physiol. 151, 1197–1206. doi: 10.1104/pp.109.142851
Stael, S., Wurzinger, B., Mair, A., Mehlmer, N., Vothknecht, U. C., and Teige, M. (2012). Plant organellar calcium signalling: an emerging field. J. Exp. Bot. 63, 1525–1542. doi: 10.1093/jxb/err394
Sun, J., Miller, J. B., Granqvist, E., Wiley-Kalil, A., Gobbato, E., Maillet, F., et al. (2015). Activation of symbiosis signaling by arbuscular mycorrhizal fungi in legumes and rice. Plant Cell 27, 823–838. doi: 10.1105/tpc.114.131326
Tanaka, K., Swanson, S. J., Gilroy, S., and Stacey, G. (2010). Extracellular nucleotides elicit cytosolic free calcium oscillations in Arabidopsis. Plant Physiol. 154, 705–719. doi: 10.1104/pp.110.162503
Tunc-Ozdemir, M., and Jones, A. M. (2017). Ligand-induced dynamics of heterotrimeric G protein-coupled receptor-like kinase complexes. PLoS ONE 12:e0171854. doi: 10.1371/journal.pone.0171854
van Der Luit, A. H., Olivari, C., Haley, A., Knight, M. R., and Trewavas, A. J. (1999). Distinct calcium signaling pathways regulate calmodulin gene expression in tobacco. Plant Physiol. 121, 705–714. doi: 10.1104/pp.121.3.705
Waadt, R., Krebs, M., Kudla, J., and Schumacher, K. (2017). Multiparameter imaging of calcium and abscisic acid and high-resolution quantitative calcium measurements using R-GECO1-mTurquoise in Arabidopsis. New Phytol. 216, 303–320. doi: 10.1111/nph.14706
Wais, R. J., Galera, C., Oldroyd, G., Catoira, R., Penmetsa, R. V., Cook, D., et al. (2000). Genetic analysis of calcium spiking responses in nodulation mutants of Medicago truncatula. Proc. Natl. Acad. Sci. U.S.A. 97, 13407–13412. doi: 10.1073/pnas.230439797
Wang, Y., Dindas, J., Rienmüller, F., Krebs, M., Waadt, R., Schumacher, K., et al. (2015). Cytosolic Ca(2+) Signals enhance the vacuolar ion conductivity of bulging Arabidopsis root hair cells. Mol. Plant 8, 1665–1674. doi: 10.1016/j.molp.2015.07.009
Whalley, H. J., and Knight, M. R. (2013). Calcium signatures are decoded by plants to give specific gene responses. New Phytol. 197, 690–693. doi: 10.1111/nph.12087
Wood, N. T., Haley, A., Viry-Moussaïd, M., Johnson, C. H., van der Luit, A. H., and Trewavas, A. J. (2001). The calcium rhythms of different cell types oscillate with different circadian phases. Plant Physiol. 125, 787–796. doi: 10.1104/pp.125.2.787
Wu, J., Liu, L., Matsuda, T., Zhao, Y., Rebane, A., Drobizhev, M., et al. (2013). Improved orange and red Ca2+ indicators and photophysical considerations for optogenetic applications. ACS Chem. Neurosci. 4, 963–972. doi: 10.1021/cn400012b
Xiong, T. C., Ronzier, E., Sanchez, F., Corratgé-Faillie, C., Mazars, C., and Thibaud, J. B. (2014). Imaging long distance propagating calcium signals in intact plant leaves with the BRET-based GFP-aequorin reporter. Front. Plant Sci. 5:43. doi: 10.3389/fpls.2014.00043
Zhao, Y., Araki, S., Wu, J., Teramoto, T., Chang, Y. F., Nakano, M., et al. (2011). An expanded palette of genetically encoded Ca2+ indicators. Science 333, 1888–1891. doi: 10.1126/science.1208592.
Keywords: Medicago truncatula, Arabidopsis thaliana, root symbiosis, root hairs, root elongation zone, calcium, GECO sensors, biotic and abiotic stimuli
Citation: Kelner A, Leitão N, Chabaud M, Charpentier M and de Carvalho-Niebel F (2018) Dual Color Sensors for Simultaneous Analysis of Calcium Signal Dynamics in the Nuclear and Cytoplasmic Compartments of Plant Cells. Front. Plant Sci. 9:245. doi: 10.3389/fpls.2018.00245
Received: 17 December 2017; Accepted: 12 February 2018;
Published: 27 February 2018.
Edited by:
Pascal Ratet, Centre National de la Recherche Scientifique (CNRS), FranceReviewed by:
Jiahui Wu, Weill Cornell Medical College, Cornell University, United StatesFrantisek Baluska, University of Bonn, Germany
Copyright © 2018 Kelner, Leitão, Chabaud, Charpentier and de Carvalho-Niebel. This is an open-access article distributed under the terms of the Creative Commons Attribution License (CC BY). The use, distribution or reproduction in other forums is permitted, provided the original author(s) and the copyright owner are credited and that the original publication in this journal is cited, in accordance with accepted academic practice. No use, distribution or reproduction is permitted which does not comply with these terms.
*Correspondence: Myriam Charpentier, bXlyaWFtLmNoYXJwZW50aWVyQGppYy5hYy51aw==
Fernanda de Carvalho-Niebel, ZmVybmFuZGEuZGUtY2FydmFsaG8tbmllYmVsQGlucmEuZnI=
†These authors have contributed equally to this work.