 Marianne Hoogmoed
 Victor O. Sadras
- South Australian Research and Development Institute, Adelaide, SA, Australia
Nitrogen dilution curves relate a crop’s critical nitrogen concentration (%Nc) to biomass (W) according to the allometric model %Nc = a W-b. This model has a strong theoretical foundation, and parameters a and b show little variation for well-watered crops. Here we explore the robustness of this model for water stressed crops. We established experiments to examine the combined effects of water stress, phenology, partitioning of biomass, and water-soluble carbohydrates (WSC), as driven by environment and variety, on the %Nc of wheat crops. We compared models where %Nc was plotted against biomass, growth stage and thermal time. The models were similarly scattered. Residuals of the %Nc - biomass model at anthesis were positively related to biomass, stem:biomass ratio, Δ13C and water supply, and negatively related to ear:biomass ratio and concentration of WSC. These are physiologically meaningful associations explaining the scatter of biomass-based dilution curves. Residuals of the thermal time model showed less consistent associations with these variables. The biomass dilution model developed for well-watered crops overestimates nitrogen deficiency of water-stressed crops, and a biomass-based model is conceptually more justified than developmental models. This has implications for diagnostic and modeling. As theory is lagging, a greater degree of empiricism might be useful to capture environmental, chiefly water, and genotype-dependent traits in the determination of critical nitrogen for diagnostic purposes. Sensitivity analysis would help to decide if scaling nitrogen dilution curves for crop water status, and genotype-dependent parameters are needed.
Introduction
Nitrogen dilution curves relate a crop’s critical nitrogen concentration (%Nc, the minimum nitrogen concentration required for maximum growth) to crop biomass (W). These curves are used in the diagnostics of crop nitrogen status and modeling, and have the form (Gastal et al., 2015):
where, b is a dimensionless parameter that represents the nitrogen dilution relative to crop biomass and a is the crop nitrogen concentration when W = 1 t ha-1. The theoretical foundations of this model are strong (Greenwood et al., 1990; Lemaire and Gastal, 1997). The dilution of nitrogen occurs because at the start of the growing season, biomass mostly consists of leaves with high proportion of metabolic tissue and high nitrogen concentration, but as the crop grows, relatively more structural tissue, i.e., stem with a smaller nitrogen concentration, is produced. In addition, shading of older leaves causes nitrogen relocation within the plant. Concentration of nitrogen in biomass (%N) is
where subscripts m and s indicate metabolic and structural tissue, respectively.
The nitrogen nutrition index, defined as the ratio between actual and critical nitrogen concentration from dilution curves, is a robust measure of crop nitrogen status (Gastal et al., 2015). For crop management, the nitrogen nutrition index is used directly (Neuhaus et al., 2017) or as a reference to calibrate spectral indices (Colaço and Bramley, 2018; Cossani and Sadras, 2018). However, most experiments used to derive nitrogen dilution curves have been conducted in well-watered crops (e.g., Justes et al., 1994) and this may have contributed to the consistency of the parameters in eq. (1) (Gastal et al., 2015). In potato and tall fescue where dilution curves have been derived from crops exposed to contrasting water supply, %Nc declined with water stress (Bélanger et al., 2001; Errecart et al., 2014). Understanding the influence of crop water status on %Nc is important, as using dilution curves from well-watered crops may over-estimate nitrogen deficits in water-stressed crops (Sadras and Lemaire, 2014). In addition, this is theoretically interesting as it connects the water and nitrogen economies of the crop.
Variation in nitrogen dilution curves for wheat has been reported that relates to phenological development, hence the attempts to model critical nitrogen against phenological stage (Angus, 2007; Yue et al., 2012; Zhao et al., 2014; Ratjen and Kage, 2016). Variation in allometric relations, between organs as well as between structural and labile carbohydrates, partially underlies the effect of phenology on nitrogen dilution curves (Gastal et al., 2015; Hoogmoed and Sadras, 2016; Yan et al., 2016).
The aim of this study was to examine the combined effects of water stress, phenology, partitioning of biomass, and water-soluble carbohydrates (WSC) on the critical nitrogen concentrations of wheat crops.
Materials and Methods
Site Description
Field trials were conducted over three growing seasons (May – November, 2014–2016) in South Australia. In 2014, trials were established at Hart (33°45 ‘S, 138°24 ‘E) and Turretfield (34°32 S, 138°47 ‘E). In 2015 and 2016 trials were conducted at Roseworthy (34°31 ‘S, 138°57 ‘E). These sites have a Mediterranean climate with hot and dry summer, and wet and mild winter. Daily weather data were collected from nearby Australian Bureau of Meteorology’s weather stations1. Soils were sandy loam (Dermosol) at Hart, calcareous loam (Calcarosol) at Roseworthy and loam over clay (Chromosol) at Turretfield (Isbell, 1996).
Trial Design
In 2014, we established a factorial experiment combining 4 varieties and 5 nitrogen rates in a randomized block design with 3 replicates. In 2015 and 2016, the variety by nitrogen factorial was grown under two water regimes: rainfed and irrigated. Crops were sown in the agronomically recommended window between 16 May and 30 June (Supplementary Table S1). Hereafter, “environment” refers to each of the six combinations of location, season, and water regimes.
We used four Australian cultivars: very early maturing Axe (Australian Grain Technologies), early maturity Mace (Australian Grain Technologies), and mid-long maturity Scout and Trojan (LongReach). Wheat was sown in plots of 10 m long, with six rows (25 cm spacing) and a sowing density of 210 plants m-2. Urea pellets were spread evenly in the plots by hand according to the following treatments: (1) 0 kg N ha-1; (2) 60 kg N ha-1 at seeding; (3) 120 kg N ha-1 split between seeding and tillering (GS20–23); (4) 180 kg N ha-1 split between seeding and tillering; (5) 240 kg N ha-1 split between seeding and tillering. At Hart in 2014, an additional treatment was included: (6) 180 kg N ha-1 split between seeding, tillering and stem elongation (GS31–32). In all cases, split applications were 50:50. In 2016 at Roseworthy, crops received 40 kg P ha-1 as superphosphate at sowing.
Soil Moisture and Nitrogen at Sowing
Soils were sampled just before sowing with hand auger or hydraulic soil corer to 0.6 m deep and separated into 0.2 m soil layers to determine water and nitrogen content. For each soil layer, moisture was determined gravimetrically in 10 g subsamples. The remainder of the fresh soil was dried at 40°C for 1 week and crushed to pass a 2 mm mesh. KCl extractable NO3--N and NH4+-N were measured in CSBP Soil and Plant Analysis Laboratory, Western Australia. Soil drying may have contributed to loss of N-NH3, which is a minor component of available nitrogen in our system.
Phenology, Biomass and Nitrogen
Phenological stage was recorded regularly using Zadoks’ scale (Zadoks et al., 1974). Shoot biomass was sampled four to six times between GS23 and GS69. Shoots were cut close to the soil surface with a hand sickle, in two segments of 50 cm in the two central rows of the plot. Samples were oven dried at 60°C until constant weight and then weighed. A dry subsample was separated into leaves, stems, and ears when they were present. The plant components were weighed and ground separately using a mill (Thomas Wiley® model 4, Swedesboro, NJ, United States) and analyzed for total nitrogen content by dry combustion (CSBP Soil and Plant Analysis Laboratory, Western Australia).
Stems from the anthesis samples were analyzed for WSC. Whole shoot samples of treatments that corresponded to %Nc were analyzed at anthesis for stable carbon isotope composition δ13C (‰). WSC and δ13C were analyzed by Environmental Analysis Laboratory, NSW, Australia. WSC was measured in a water extraction and then flow injection analysis using the alkaline ferricyanide decolouration method. δ13C was measured using a Thermo-Finnigan Delta V Plus Isotope Ratio Mass Spectrometer (IRMS). 13C discrimination (Δ13C) at anthesis was calculated as:
in which δair is the 13C composition of air (-8 ‰, Farquhar et al., 1989) and δsample is the 13C composition of the sample. Smaller Δ13C means a higher degree of water stress (Errecart et al., 2014; Sadras et al., 2016).
Statistical Analysis
Statistical analyses were performed in R (R Development Core Team, 2008). ANOVAs were performed using the Anova() function in the car package, and Tukey HSD post hoc tests used HSD.test() in the agricolae package. Model I, least square regression assuming only error in y, was performed using the lm() function. Model II, standardized major axes regression accounting for error in both x and y (Niklas, 1994) was performed using the sma() function in the smatr package. We used Model II where our aim was to derive parameters for allometric relations, as the parameters depend on the model (Niklas, 1994). Otherwise, when we only wanted to test for the magnitude of association, we used Model I as R2 is independent of the method.
Critical Nitrogen Concentration
Shoot N concentration (%Nshoot) was calculated using the relative weights of the plant components and their nitrogen concentrations:
where W is biomass, and %N the nitrogen concentration of the plant component. The %Nc at each sampling date was calculated for each environment and each variety following the method of Greenwood et al. (1990). For each sampling time and variety, biomass dry weight was compared among the nitrogen treatments using one-way-ANOVA. If differences among the nitrogen treatments were not significant, the data from that sampling date and variety were not used. This lack of nitrogen effect on biomass was verified in 42 out of 120 samples (30 sampling times × 4 varieties), and was likely related to high nitrogen available in soil at sowing in some trials (Supplementary Table S1). If differences were significant (P < 0.1), Duncan’s post hoc test was performed following Marino et al. (2004) to reduce the chance of type II error. The treatment with the highest mean biomass was identified. If more than one treatment resulted in similarly high biomass i.e., not significantly different (P > 0.1), the nitrogen treatment resulting in the lowest shoot nitrogen concentration was selected with corresponding %Nc and biomass.
Three models were used to describe nitrogen dilution: (1) the classical nitrogen dilution curve, that relates %Nc to biomass (biomass model hereafter); (2) a dilution curve that relates %Nc to thermal time from sowing with base temperature = 0°C (thermal time model); and (3) a categorical model where %Nc is related to growth stages (growth stage model). For the first two models, %Nc = a X-b curves were fit using standardized major axis regression, where X is either biomass (t ha-1) or thermal time (°C d). No curve was fitted for the growth stage model as the numerical scale neither has a true biological meaning nor is quantitative; instead, average %Nc and standard deviations were calculated for the data pooled in five growth stage intervals: 30–34, 35–39, 40–49, 50–59, and 60–69.
Residual Analysis
Residual analysis was used to explore drivers of scatter around the biomass and thermal time models. Residuals were calculated as the difference between the actual %Nc and the fitted curves. ANOVA was used to test for the effects of variety and environment on the residuals (Sadras and Moran, 2012; Badyaev et al., 2017). Model II regression was used to test for associations between the residuals of each nitrogen dilution model and the following variables (1) biomass, (2) mass fractions of leaf, stem and ear, (3) WSC concentration in stem and shoot, (4) Δ13C, (5) water supply calculated as available soil water at sowing plus rainfall and irrigation, (6) reference evapotranspiration ETo (Allen et al., 1998), and (7) water supply per unit ETo.
Results
Growing Conditions
Mineral soil nitrogen at sowing ranged from 34 to 345 kg ha-1 (Supplementary Table S1). Crop available water at sowing ranged from negligible to 83 mm in the top 0.6 m soil layer (Supplementary Table S1); dry soils at sowing are a common feature of these environments with dominant winter rainfall and unlikely rain during fallow (Sadras and Rodriguez, 2007). The 2014–2016 growing seasons differed in amount and distribution of precipitation, and in temperature (Figure 1). In 2015, seasonal precipitation started relatively late, and a hot and dry finish caused water deficit even in irrigated crops. In contrast, precipitation was above average and irrigation was applied only a few times early in 2016. Intensity of water deficit was further quantified with Δ13C and water budget in section Sources of scatter in the biomass model below.
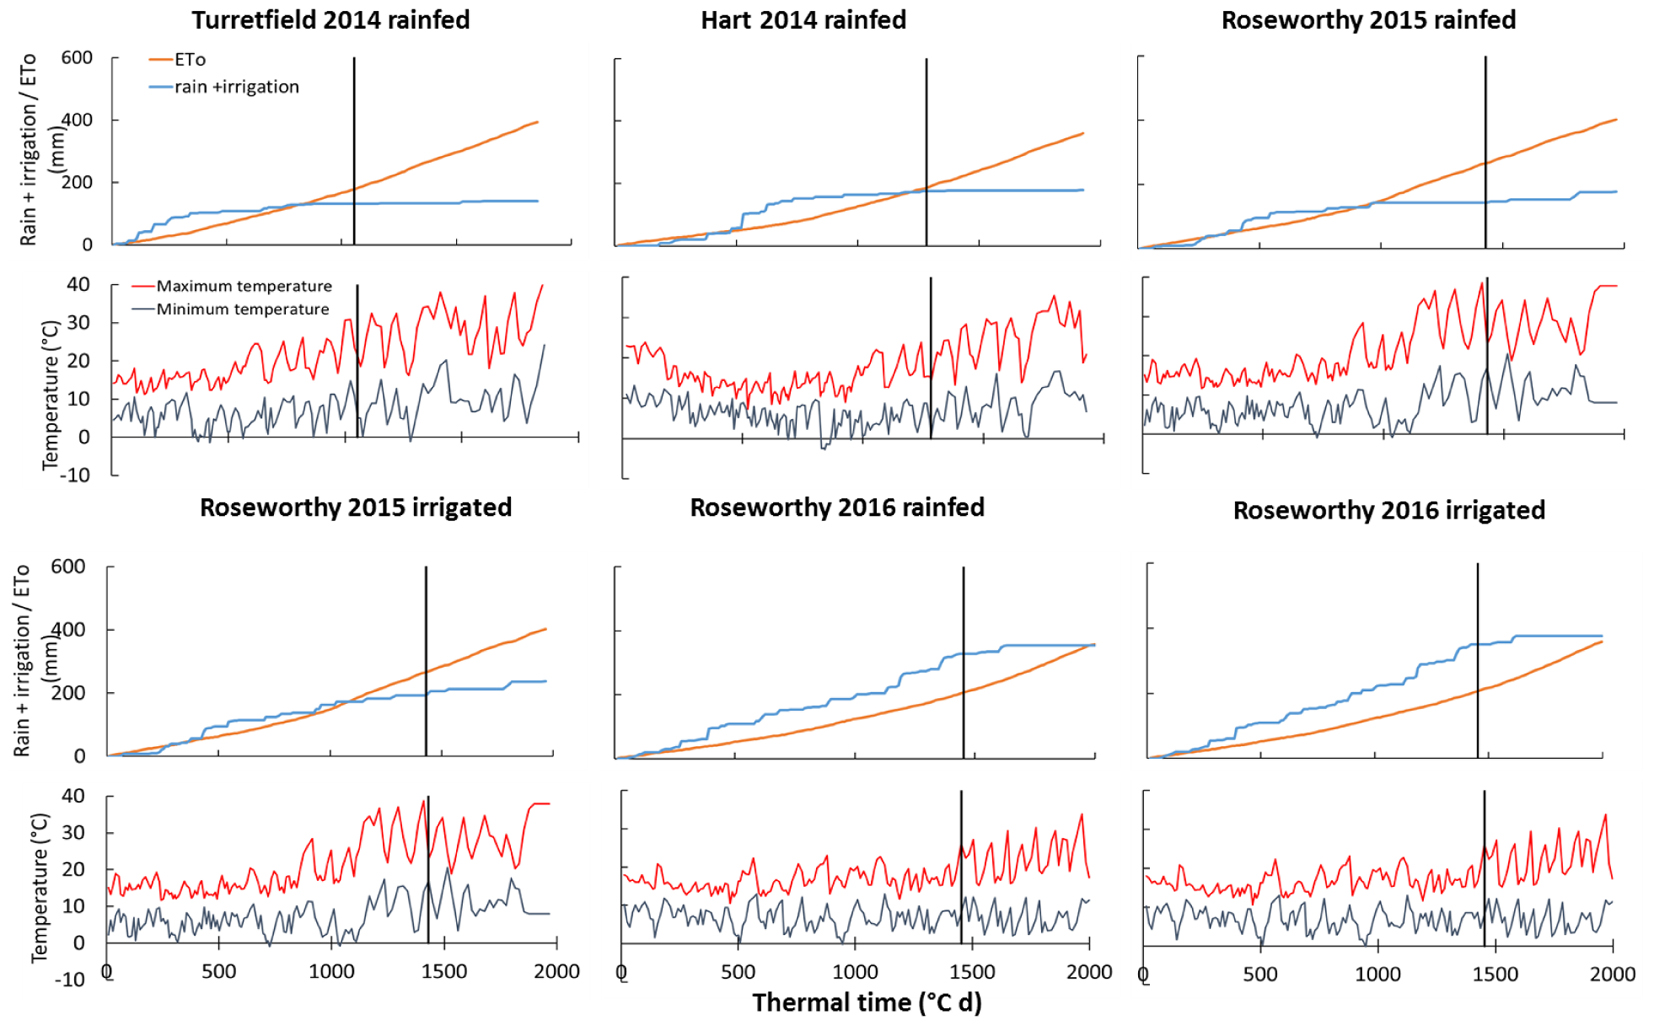
FIGURE 1. Cumulative reference evapotranspiration (ETo), cumulative rain and irrigation, and temperature against thermal time from sowing in six environments in South Australia. Vertical lines indicate anthesis sampling. ETo is calculated with the FAO-56 method (Allen et al., 1998).
Dynamics of Growth and Nitrogen Uptake
Across environments, nitrogen rate affected biomass of stem, leaf and ear (all P < 0.0001), and amount of nitrogen in each of these organs (all P < 0.0001). Variety affected leaf biomass (P < 0.0001), amount of nitrogen in stem (P < 0.05), and amount of nitrogen in leaf (P < 0.001). Figure 2 illustrates the effect of nitrogen rate and variety for biomass, and Figure 3 for nitrogen uptake, highlighting the larger effect of nitrogen rate on nitrogen uptake compared to biomass conducive to changes in nitrogen concentration, which are analyzed in the following sections.
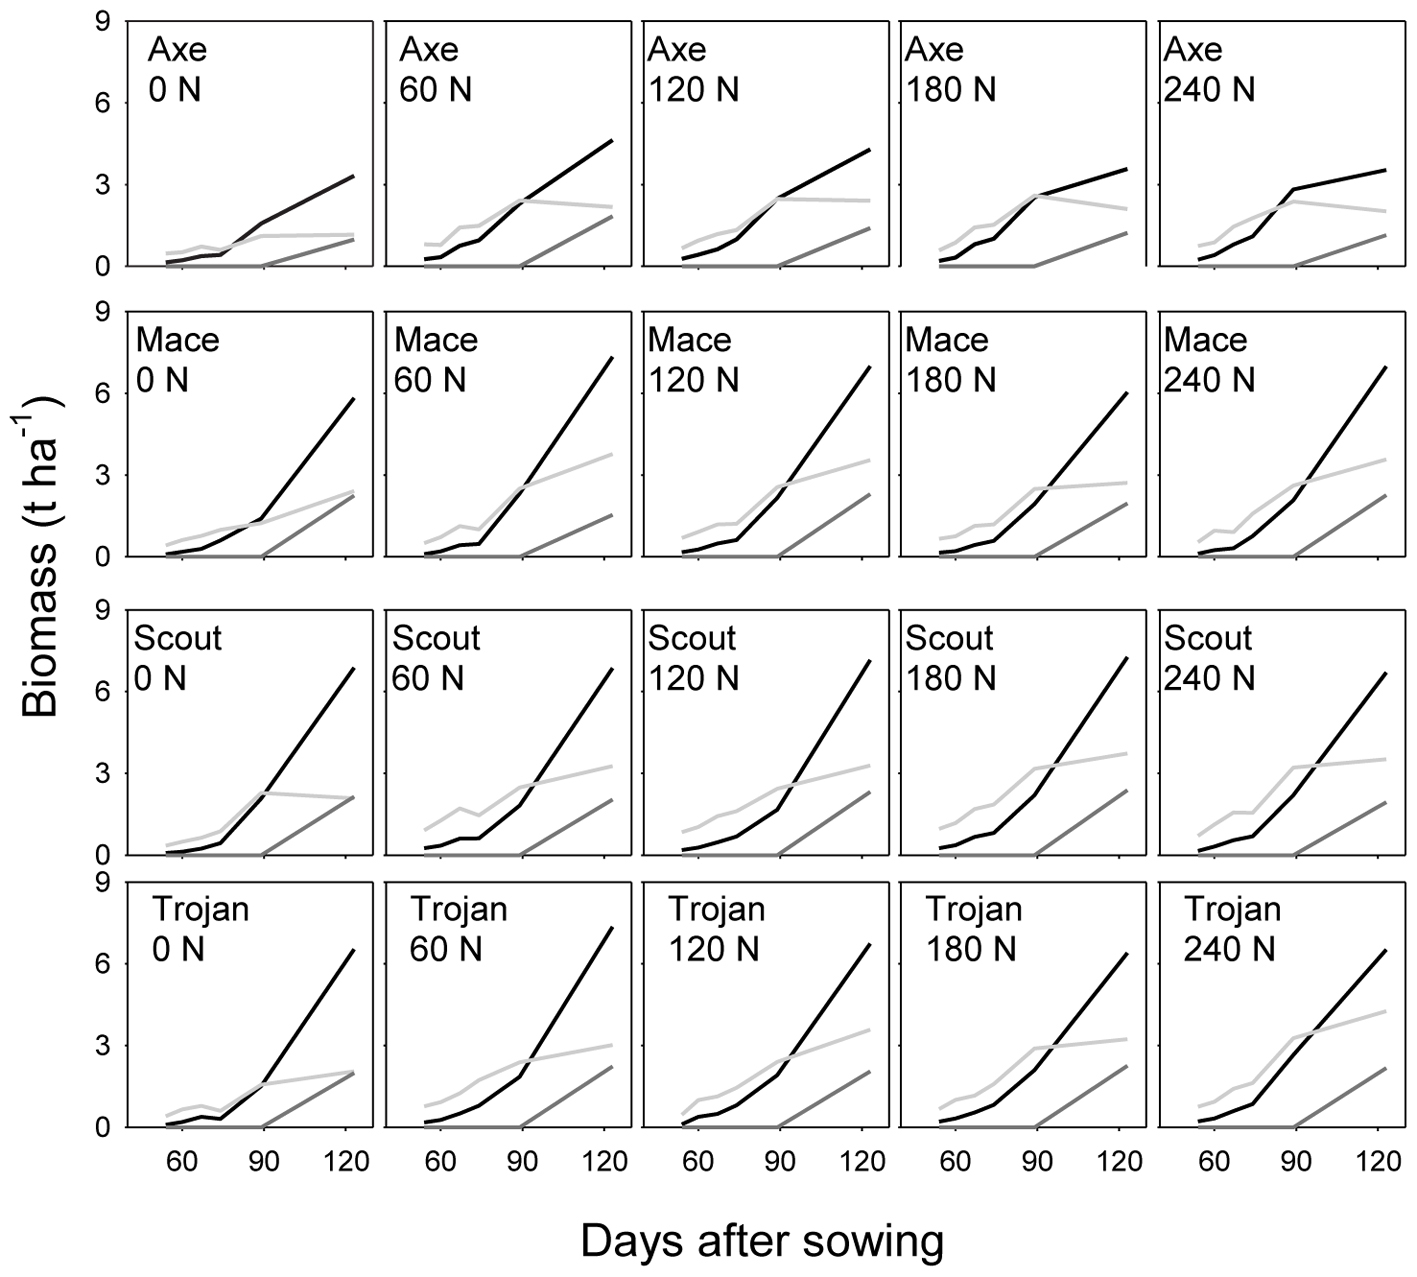
FIGURE 2. Dynamics of dry matter in leaf (light gray), stem (black), and ear (dark gray) for wheat crops in a factorial experiment combining four varieties and five rates of nitrogen fertilizer. Data from irrigated crops at Roseworthy, 2016.
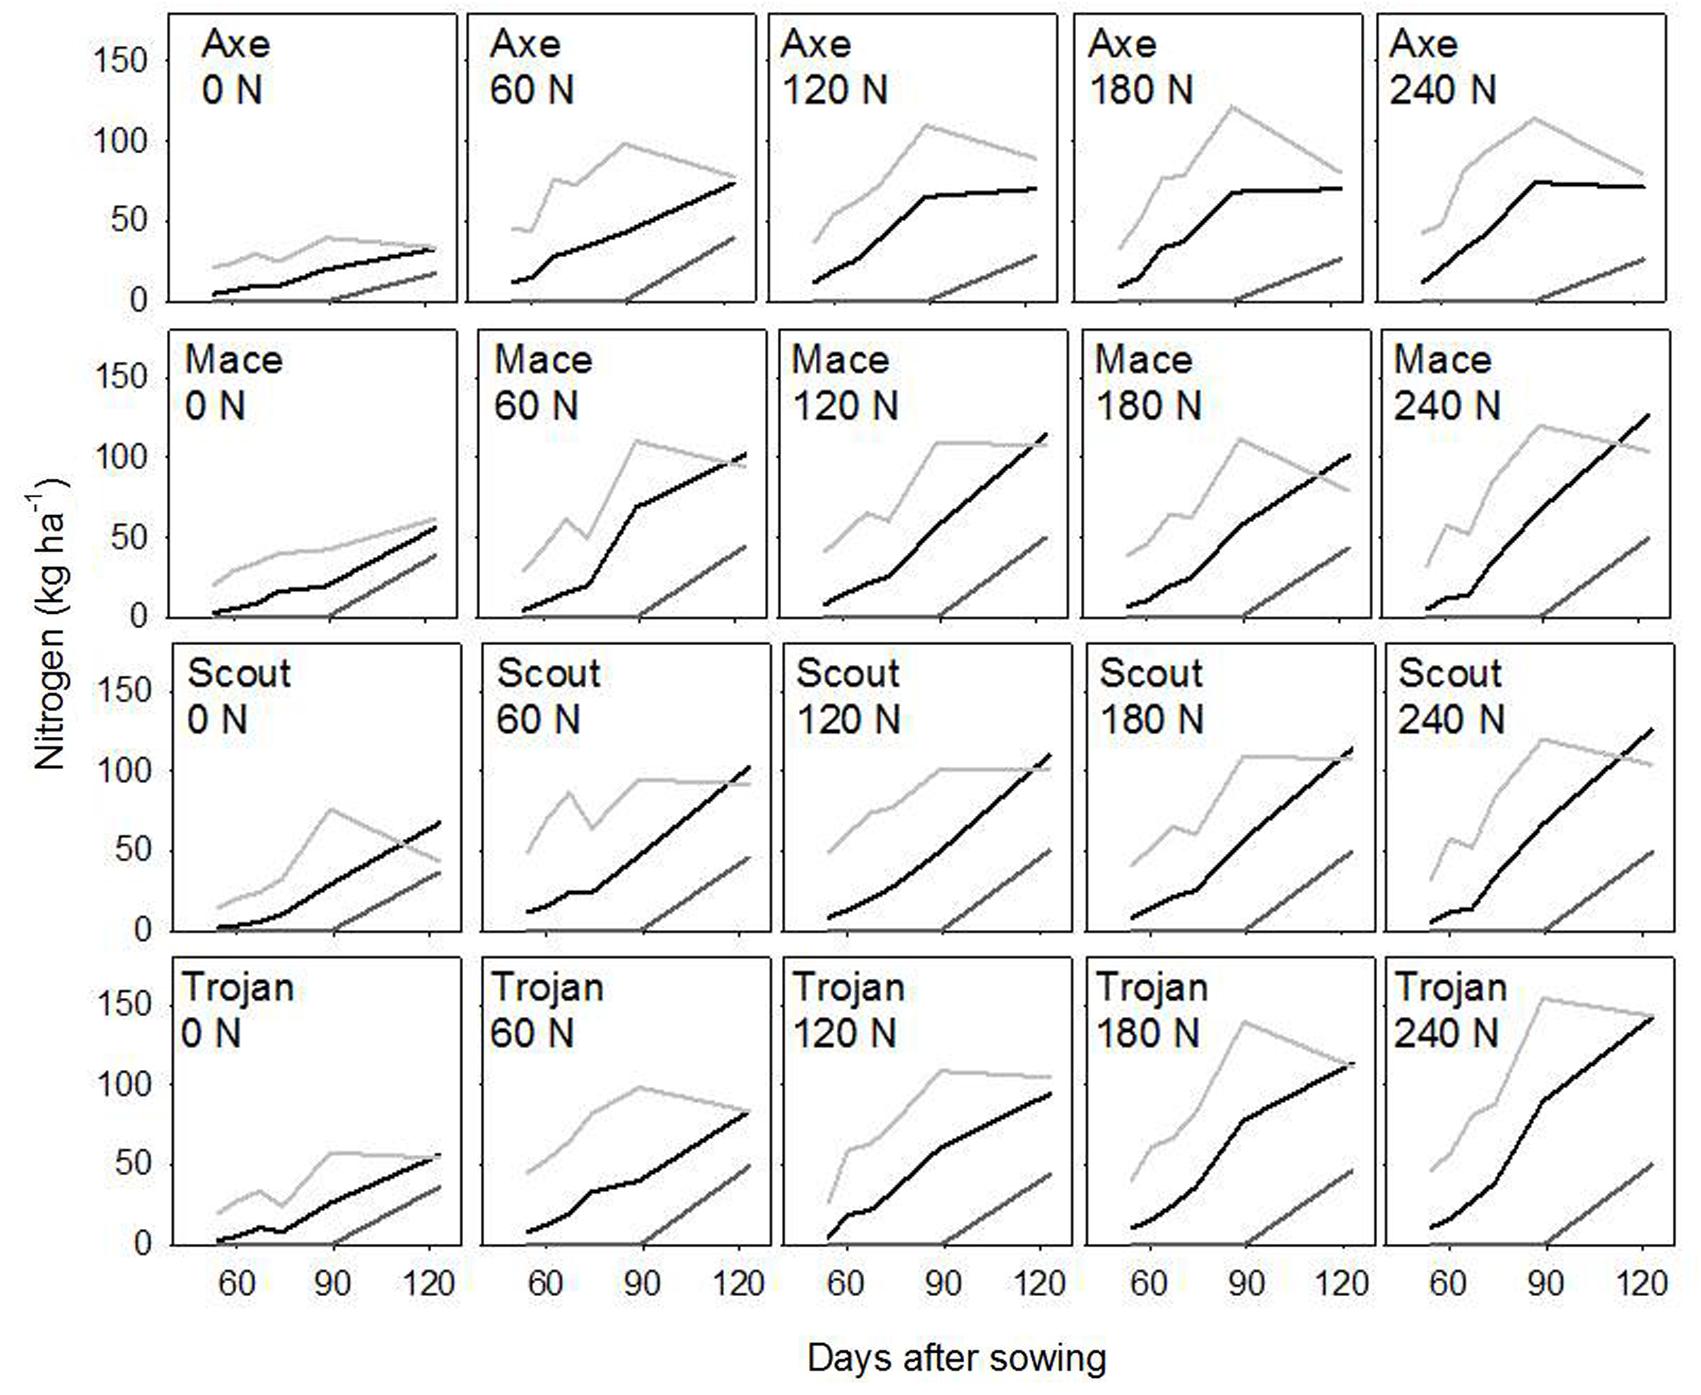
FIGURE 3. Dynamics of nitrogen uptake in leaf (light gray), stem (black), and ear (dark gray) for wheat crops in a factorial experiment combining four varieties and five rates of nitrogen fertilizer. Data from irrigated crops at Roseworthy, 2016.
Biomass Model
Fitting eq. (1) to our data returned a R2 = 0.77 (P < 0.0001), and showed substantial scatter with small standard errors in %Nc (Figure 4A). Across growing conditions, varieties, and crop stages, the median coefficient of variation of %Nc was 5.5%. Further, the coefficient of variation of %Nc was similar in the rainfed and irrigated experiments at Roseworthy in both seasons: 4.5% under irrigation vs. 4.0% under rainfed conditions in 2015, and 4.2% under irrigation vs. 4.0% under rainfed conditions in 2016. These relatively small errors together with the clustering of some experiments in Figure 4A indicate that crop and environmental factors were more likely sources of scatter. For example, the %Nc under severe water deficit in rainfed crops at Roseworthy 2015 (Figure 1) clustered below the dilution curve (filled blue circles in Figure 4A).
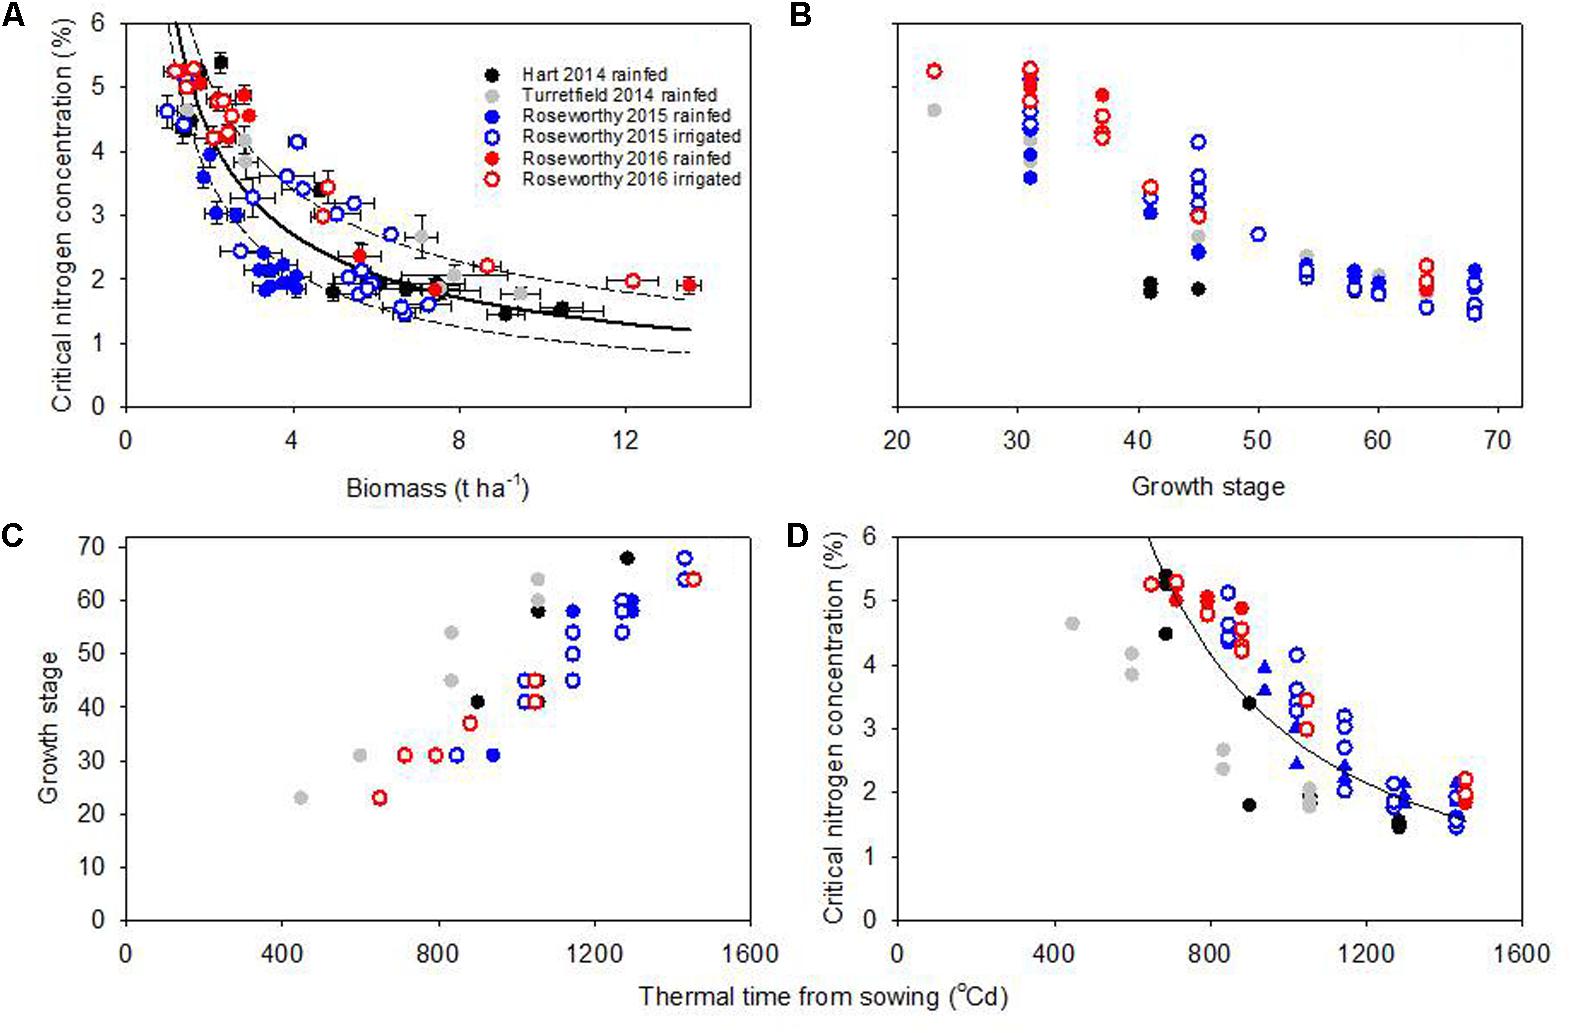
FIGURE 4. (A) Wheat critical nitrogen concentration vs. biomass, where the fitted model (solid line) is %Nc = 6.75 ∗ W-0.66 (R2 = 0.77, P < 0.0001) and the 95% confidence intervals (dotted lines) are %Nc = 7.61 ∗ W-0.58 (upper) and %Nc = 5.99 ∗ W-0.75 (lower). (B) Critical nitrogen concentration vs. Zadoks’ growth stage. (C) Relationship between growth stage and thermal time from sowing. (D) Critical nitrogen concentration vs. thermal time from sowing, where the fitted model is %Nc = 2.4∗105∗thermal time-1.64 (R2 = 0.82, P < 0.0001); the scatter of data did not allow to fit confidence intervals.
Growth Stage and Thermal Time Models
To analyze the impact of phenology on dilution curves we plotted %Nc against growth stage; the scatter was large at early stages, and seemed to diminish toward flowering (Figure 4B). Table 1 summarizes %Nc as average and standard deviation for selected developmental windows. As development related with thermal time (Figure 4C), we plotted %Nc against thermal time from sowing (Figure 4B). The R2 of 0.82 for the thermal time model was slightly better than that for the biomass model, but substantial scatter remained.
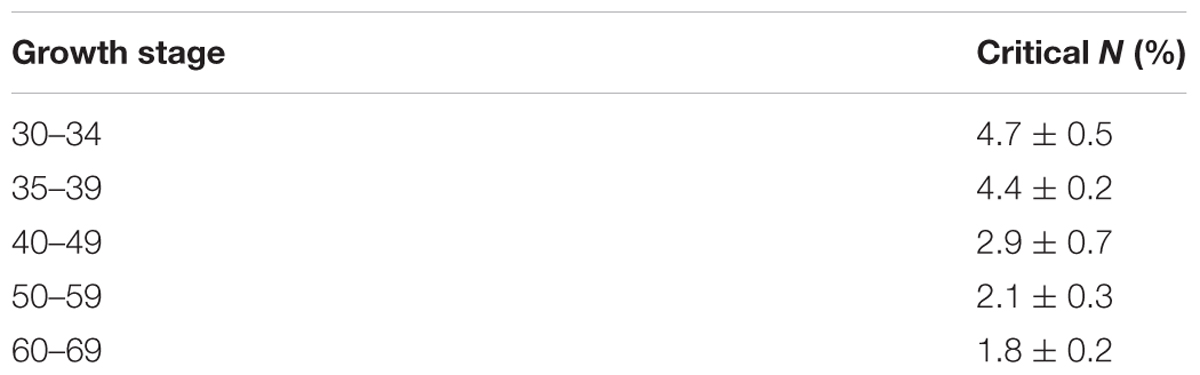
TABLE 1. Average (± standard deviation) critical nitrogen concentration of wheat for Zadoks’ growth stages from early stem elongation to anthesis (Zadoks et al., 1974).
Comparison of Scatter in Biomass and Thermal Time Models
Figure 5 compares the residuals for the biomass and thermal time models. Positive residuals indicate under-estimation and negative residuals an over-estimation of the actual %Nc relative to the fitted model. For both models, ANOVA of residuals revealed significant environmental effect (P < 0.0001), and lack of variety (P > 0.66) and variety-by-environment interaction (P > 0.81). For the biomass model, residuals were positive and moderate in most environments, except for rainfed crops at Roseworthy 2015, where residuals were strongly negative. For the thermal time model, the residuals were particularly large for rainfed crops at Turretfield 2014.
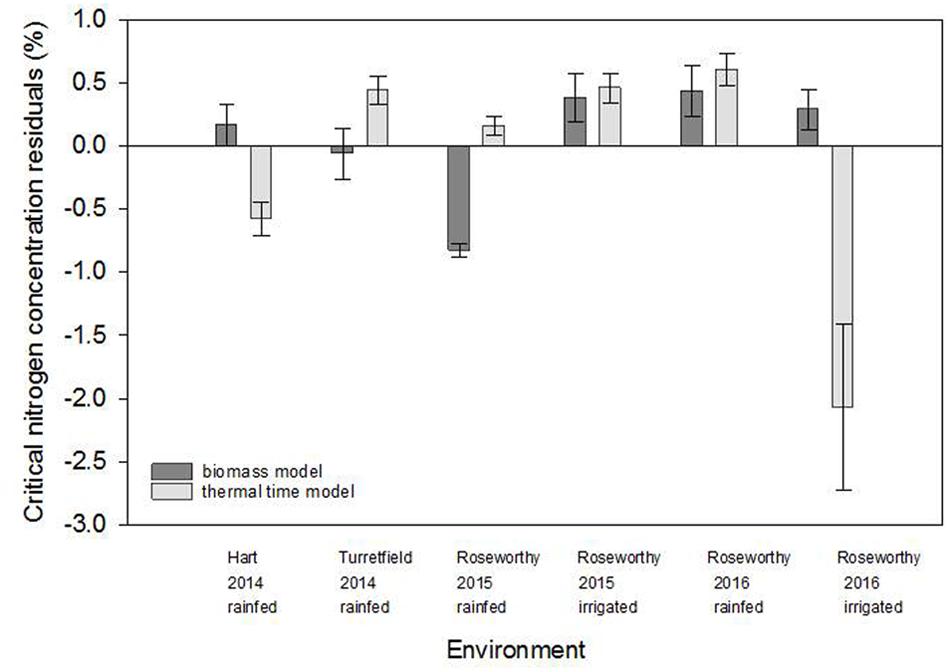
FIGURE 5. Comparison of residuals for the biomass and thermal time models in five environments resulting from combination of locations, seasons and water regimes. Values are means ± standard error.
Sources of Scatter in the Biomass Model
To further explore the sources of scatter in %Nc among the environments, we compared total biomass, and allocation of biomass to leaf, stem and ear. Maximum biomass at anthesis ranged from 3.7 t ha-1 for rainfed crops at Roseworthy 2015 to 10.5 t ha-1 for irrigated crops at Roseworthy 2016 (P < 0.01). Much of this variation was related to water, as biomass at anthesis related closely with both water supply and Δ13C (Table 2). The mass fractions of leaf, stem and ear at similar growth stages also differed among the environments and correlated with total biomass at GS31 and GS60–69 (Table 3). The mass fraction of stem correlated positively with total biomass, while mass fraction of leaf correlated negatively, except at anthesis where there was no correlation with leaf, and instead the mass fraction ear correlated negatively with total biomass. Residuals of critical nitrogen concentration at anthesis correlated positively with both biomass and mass fraction stem, and negatively with mass fraction ear (Figures 6A–C).
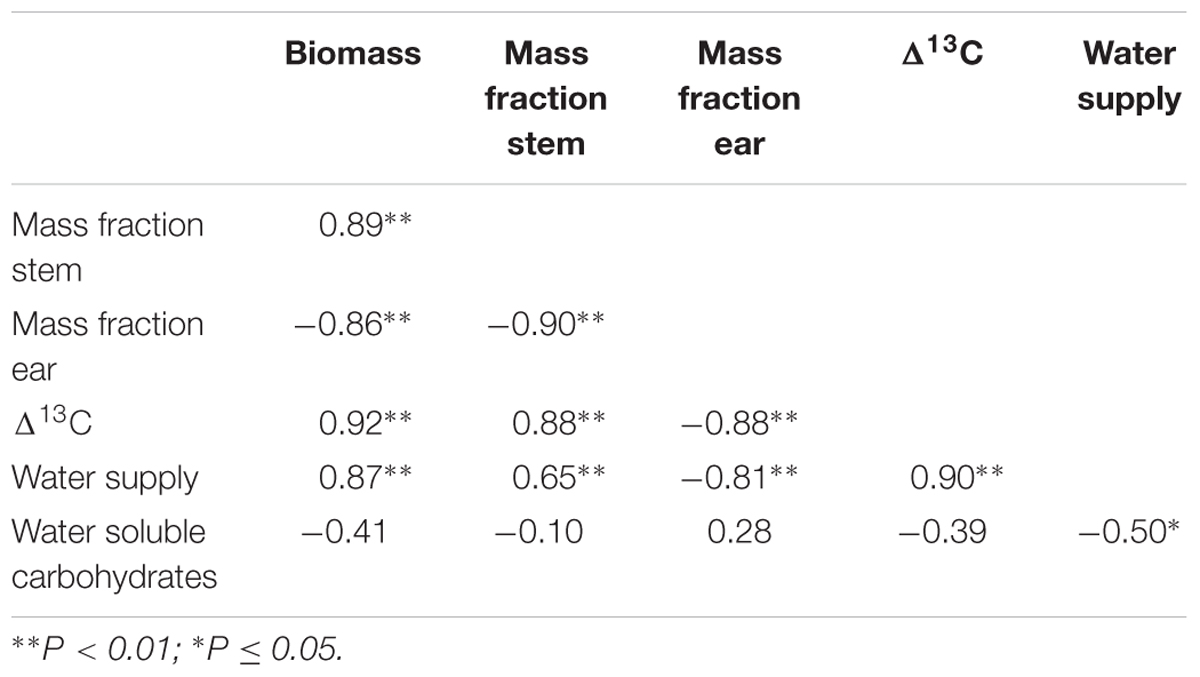
TABLE 2. Correlation matrix of crop traits at anthesis (biomass, mass stem fraction, mass ear fraction, Δ13C, concentration of water soluble carbohydrates) and environmental factor (water supply) that contributed to the scatter of the %Nc-biomass curve.
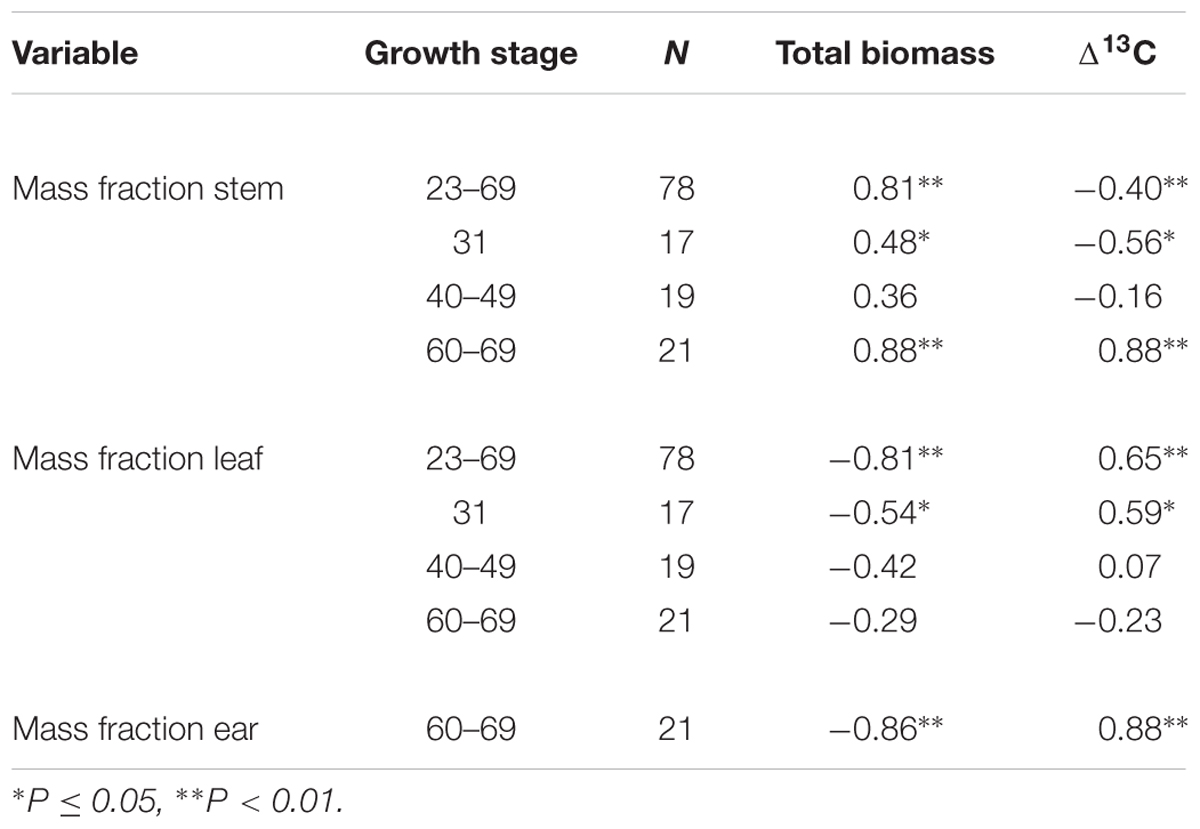
TABLE 3. Correlation coefficient (r) for leaf, stem and ear mass fraction with total biomass and Δ13C among the six environments.
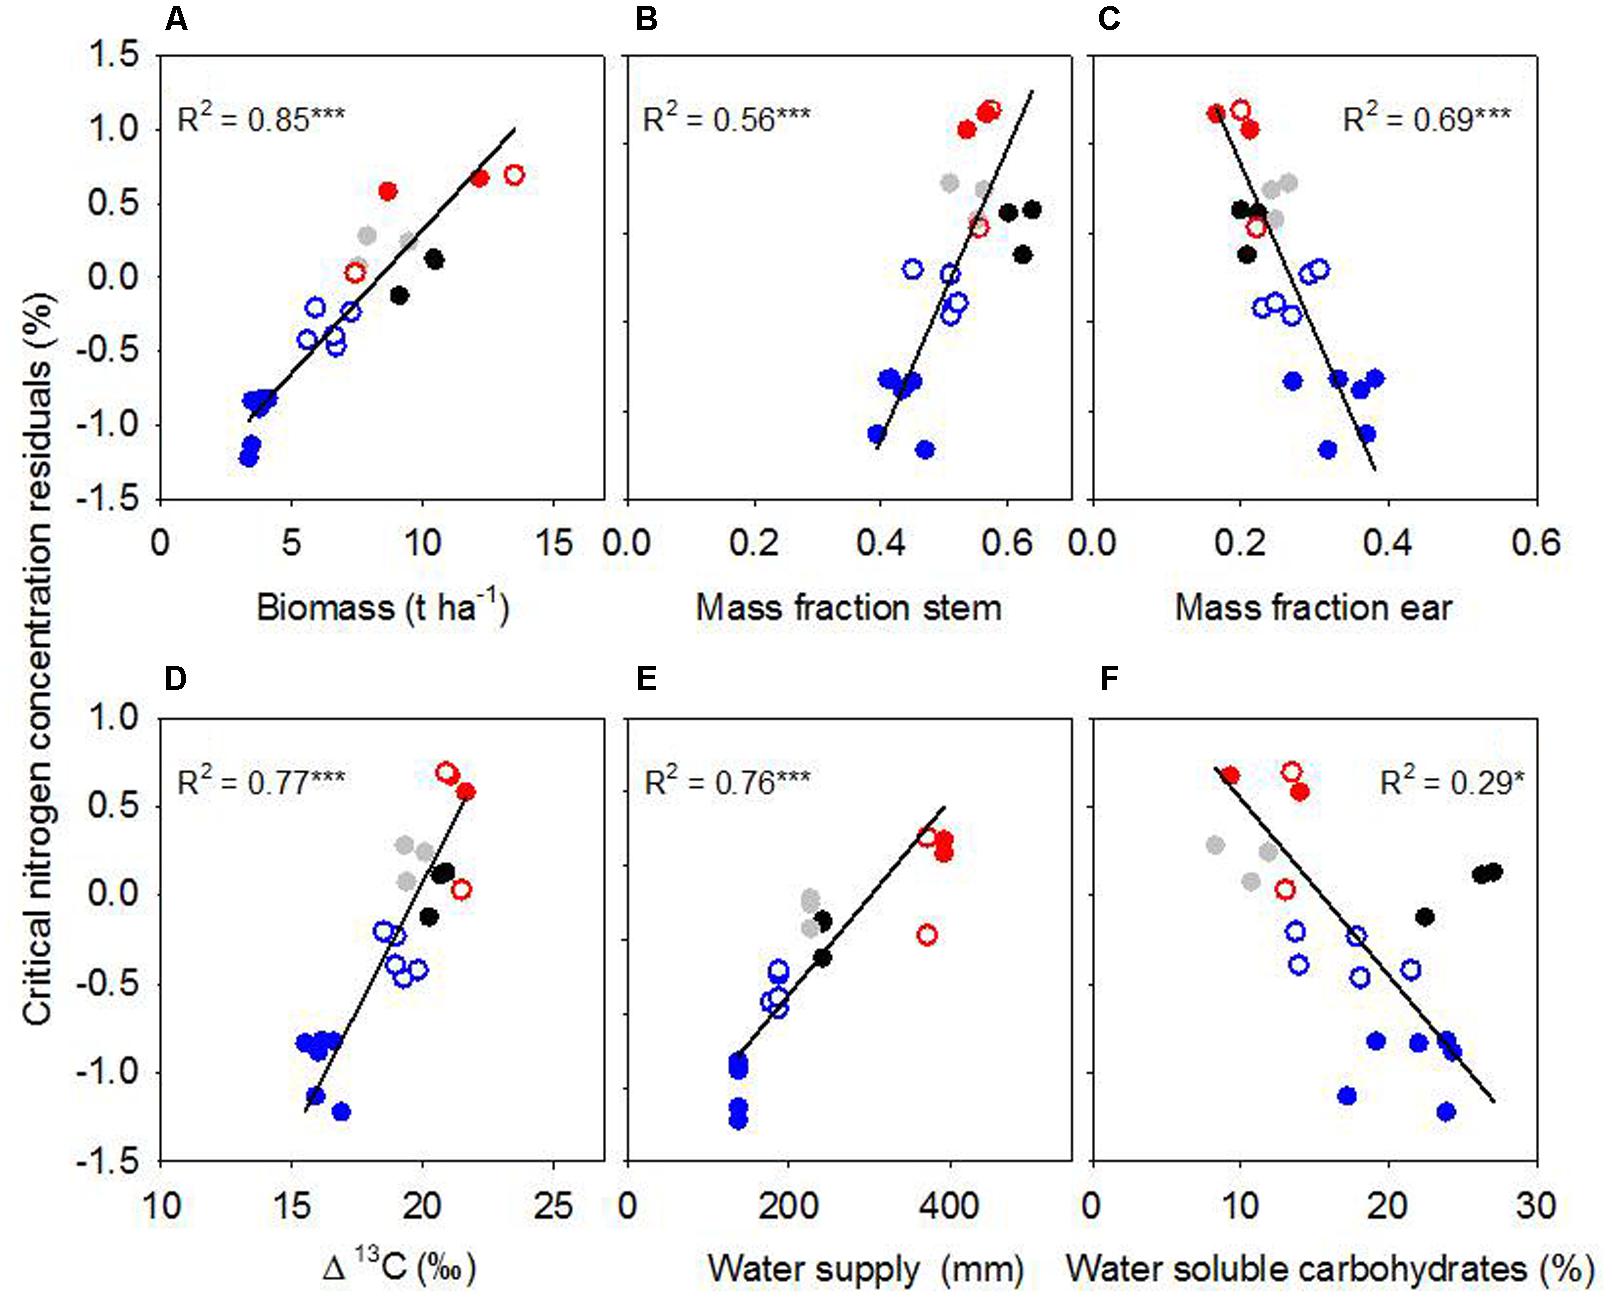
FIGURE 6. Residuals from the critical nitrogen concentration vs. biomass model at anthesis in relation to (A) biomass, (B) mass fraction stem, (C) mass fraction ear, (D) Δ13, (E) water supply, and (F) water-soluble carbohydrates in stem. Lines are Model II regressions, with ∗∗∗P < 0.001, ∗P < 0.05. Symbols: Hart 2014 rainfed (black); Turretfield 2014 rainfed (gray); Roseworthy 2015 rainfed (filled blue); Roseworthy 2015 irrigated (open blue); Roseworthy 2016 rainfed (filled red); Roseworthy 2016 irrigated (open red).
Crop water stress varied among the environments as indicated by the range of Δ13C from 21‰ for both irrigated and rainfed crops at Roseworthy 2016, to 15.9 ‰ in the most stressed crops at Roseworthy 2015 (P < 0.01) (Figure 6D). Water supply and Δ13C correlated, reinforcing the confidence in our coarse water budget (Table 2). Residuals of %Nc from the biomass model correlated positively with Δ13C and water supply and negatively with reference evapotranspiration (Figures 6D,E and Table 4).
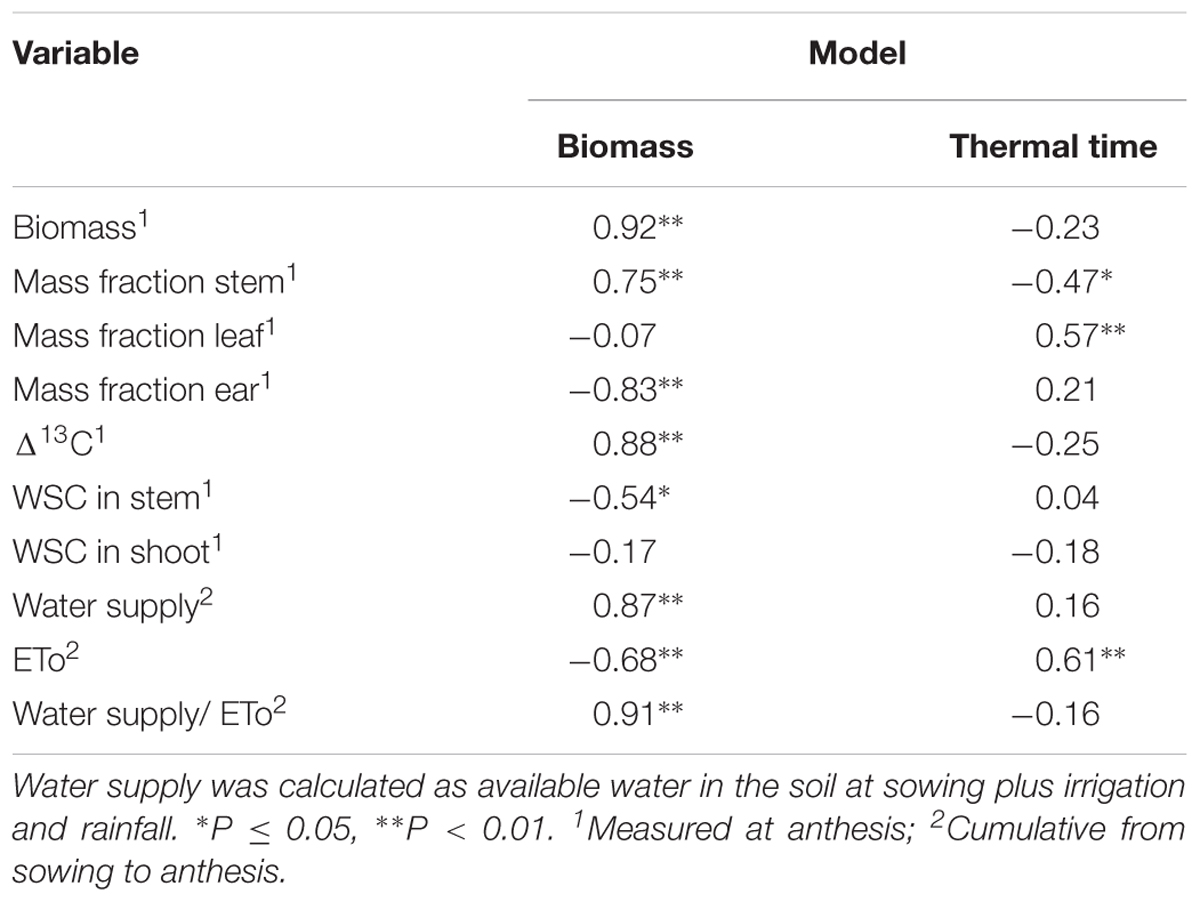
TABLE 4. Correlation coefficients (r) between residuals from biomass and thermal time nitrogen dilution models, and shoot biomass, mass fraction of stem, leaf, ear, concentration of water-soluble carbohydrates (WSC) in stem and shoot, Δ13C, water supply, cummulative reference evapotranspiration (ETo), and cummulative water supply per unit reference evapotranspiration.
Average WSC concentration in stem at anthesis differed among the environments, from 10.3% at Turretfield to 25.1% at Hart, both rainfed in 2014. Residuals from the biomass model correlated negatively with WSC (Figure 6F). WSC increased under water deficit as indicated by the relationship between WSC at anthesis and water supply (Table 2); the relationship between WSC and Δ13C was negative but did not reach significance (P = 0.08).
Sources of Scatter in the Thermal Time Model
With few exceptions, residuals for the thermal time model were weakly associated with the explanatory variables that correlated with the residuals from the biomass model (Table 4). For example, residuals from the thermal time model did not correlate with biomass, and correlations were weaker, and of opposite sign than those from the biomass model for stem mass fraction and ear mass fraction (Table 4). The consistent associations between residuals and water-related variables found for the biomass model were absent for the thermal time model, except for reference evapotranspiration (Table 4).
Discussion
We examined the combined effects of water stress, phenology, partitioning of biomass among organs, and partitioning between structural and WSC on the critical nitrogen concentration of wheat crops. Tight nitrogen dilution curves are often derived for well-watered crops, e.g., wheat (Justes et al., 1994) and maize (Plénet and Lemaire, 1999); larger scatter was observed in potato crops under variable water supply (Bélanger et al., 2001). Here we found scattered dilution curves for crops grown under varying water deficits (Figure 4A). We tested three nitrogen dilution models and, informed by physiological principles, used analysis of residuals to explore the sources of scatter in the biomass and thermal time models (Figures 5, 6 and Table 4). Small errors in %Nc (Figure 4A) combined with analysis of residuals supported the conclusion that the large scatter in biomass-based dilution curves was caused by physiologically meaningful drivers, particularly water supply and patterns of dry matter allocation (Figure 6).
Phenological Development
Phenology-dependent changes in allocation of biomass between metabolic and structural tissue (eq. 2) explain part of the scatter in the biomass model. Zhao et al. (2014) used a growth stage model to account for phenological development, but fitting curves to growth stages is not justified because the independent variable is nominal rather than quantitative. Instead, we analyzed critical nitrogen concentration against growth stage in a discrete model (Figure 4B and Table 1), and used a thermal time scale to fit a quasi-developmental model (Figures 4C,D) and analyze residuals (Figure 5 and Table 4). We still found a large spread of %Nc within growth stages, especially early in the season, and statistically similar scatter in the thermal time and biomass models (Figure 5). In the earlier growth stages (stem elongation to booting), the leaf : stem ratios changed more rapidly than in later growth stages (ear emergence and anthesis). Accuracy in determining phenology is important, for example any comparison between early (GS31) and late (GS37) stem elongation will incur a large effect on leaf : stem ratio and thus %Nc. Our average %Nc between GS31 and GS49 was higher than reported for winter wheat by Zhao et al. (2014) (and other references therein) but similar at anthesis (GS60–69).
Partitioning of Biomass
Beyond phenological stages, genetic and environmental factors affect partitioning of biomass with implications for nitrogen-biomass allometry (Niklas, 2004; Weiner, 2004; Poorter et al., 2012). Within growth stages, there was still a difference in mass fractions of leaf, stem and ear among the environments. Total biomass correlated positively with stem mass fraction and negatively with leaf mass fraction. Water stress affects wheat allometry (Kumakov et al., 2001; Ratjen et al., 2016). In our dataset, the mass fractions of stem and ear correlated best with Δ13C at anthesis, with a decrease in stem, and an increase in ear mass fraction with increasing water stress, but no change in leaf mass fraction. Kumakov et al. (2001) found a similar result in wheat, and Poorter et al. (2012) found the same trend in a meta-analysis of intra-specific variation and environmental control of biomass partitioning. In contrast, Ratjen et al. (2016) found an increase in stem growth rate relative to leaf growth rate under water stress during stem elongation. Importantly, allocation of biomass to ear and stem, but not to leaf, explained a significant proportion of the scatter in the biomass model (Figures 6B,C and Table 4). Allocation of biomass to leaf was, however, a factor accounting for some of the scatter in the thermal time model (Table 4), highlighting again the interplay between phenology and biomass partitioning.
Water Stress and Water-Soluble Carbohydrates
As expected from theory (Sadras and Lemaire, 2014; Hoogmoed and Sadras, 2016) and empirical evidence in other species (Bélanger et al., 2001; Errecart et al., 2014), we found that the critical nitrogen concentration of wheat was lower under water stress, and with high concentration of WSC (Figure 6). Three independent water-related variables associated with the residuals of the biomass model: Δ13C, water supply and reference evapotranspiration (Figure 6 and Table 4). Further, the strong correlation between biomass and Δ13C (Table 2) indicates the association between residuals and biomass (Figure 6A) was likely mediated by the effect of water deficit on biomass. Our dilution curve thus returned lower critical nitrogen compared with the original curve for well-watered wheat in France (Justes et al., 1994). Dilution curves for winter wheat in China (Yin et al., 2018) and for spring wheat in Canada (Ziadi et al., 2010) were also below the original curve for well-watered crops, and this is partially attributable to water deficit.
Under our experimental conditions, concentration of WSC increased under water deficit. Previous studies showed that stress decreased (Foulkes et al., 2002, 2007; Ehdaie et al., 2006; Rebetzke et al., 2008) or increased WSC (Zhu et al., 2009; Saint Pierre et al., 2010). In our study, the association between residuals of the biomass model and water supply was partially mediated by the effects of water supply on WSC. Our experiment confirmed our early prediction of smaller critical nitrogen concentration in crops where genotype, environment and their interaction favor high storage of labile carbohydrates (Hoogmoed and Sadras, 2016).
Statistical, Agronomic and Modeling Implications
Studies of nitrogen dilution curves rarely specify the method used to fit curves; but whether regressions are fitted with Model I (least squares) or Model II (standardized maximum axis), is unimportant in close-fitting relationships as parameters are similar if R2 is high (Niklas, 1994), which is usually the case (Justes et al., 1994; Plénet and Lemaire, 1999). Where the growing conditions scatter dilution curves, as in this study, Model II should be used (Niklas, 1994) and reporting confidence intervals of parameters would be useful for comparisons (Figure 4A, see also Zhao et al., 2014).
The water-driven scatter in nitrogen dilution curves has agronomic and modeling implications. In both cases, sensitivity analysis would help to decide if adjustments to capture the effect of water deficit are necessary. In Mediterranean-type environments, unreliable seasonal rainfall is a large source of uncertainty that favors a conservative approach to nitrogen fertilization in risk-averse farmers (Monjardino et al., 2013). This uncertainty in rainfall and yield provides an agronomic background to evaluate the errors in estimating crop nitrogen status using alternative dilution curves. In this context, locally estimated critical nitrogen for particular phenostages could be useful.
Conclusion
The %Nc -biomass dilution curve developed for well-watered crops would overestimate nitrogen deficiency of water-stressed wheat. The effects of water deficit on critical nitrogen concentration at anthesis are likely mediated by two changes in allocation of carbon: between stem and ear, and between structural and labile, as indicated by the increase in WSC with stress. The causal connections between water stress and these two aspects of carbon allocation deserve refined investigation. Biomass-based models are conceptually superior to developmental-based models, as both showed statistically similar scatter but the former has a stronger theoretical foundation, reinforced by the close relationships between model residuals and physiologically meaningful factors. Conceptually, nitrogen-biomass dilution curves need to account for genotypic and environmental sources of variation in biomass allocation, including phenology and WSC.
Author Contributions
MH carried out the experiments, analyzed and interpreted the data, and wrote the manuscript. VS designed the study, analyzed and interpreted the data, and wrote the manuscript.
Funding
The Grains Research and Development Corporation funded this work (Grant DAS00147).
Conflict of Interest Statement
The authors declare that the research was conducted in the absence of any commercial or financial relationships that could be construed as a potential conflict of interest.
Acknowledgments
We thank Sarah Noack, Barry Mudge, Peter Hooper, Rob Wheeler, and Andreas Neuhaus for useful discussions and help with field trials, and Mariano Cossani for comments on the manuscript. We thank the many seasonal workers for their hard work in the field and lab. VS is affiliate member of the University of Adelaide, School of Agriculture, Food and Wine.
Supplementary Material
The Supplementary Material for this article can be found online at: https://www.frontiersin.org/articles/10.3389/fpls.2018.00406/full#supplementary-material
Footnotes
References
Allen, R. G., Pereira, L. S., Raes, D., and Smith, M. (1998). Crop Evapotranspiration: Guidelines for Computing Crop Water Requirements. Rome: FAO.
Angus, J. F. (2007). “Should nitrogen dilution curves be expressed in relation to biomass or development?,” in Towards a Better Efficiency in N Use, eds A. Bosch, M. R. Teira, and J. M. Vilar (Lleida: Editorial Milenio), 305–308.
Badyaev, A. V., Potticary, A. L., and Morrison, E. S. (2017). Most colorful example of genetic assimilation? exploring the evolutionary destiny of recurrent phenotypic accommodation. Am. Nat. 190, 266–280. doi: 10.1086/692327
Bélanger, G., Walsh, J. R., Richards, J. E., Milburn, P. H., and Ziadi, N. (2001). Critical nitrogen curve and nitrogen nutrition index for potato in eastern Canada. Am. J. Potato Res. 78, 355–364. doi: 10.1007/BF02884344
Colaço, A. F., and Bramley, R. G. V. (2018). Do crop sensors promote improved nitrogen management in grain crops? Field Crop Res. 218, 126–140. doi: 10.1016/j.fcr.2018.01.007
Cossani, C. M., and Sadras, V. O. (2018). Water-nitrogen co-limitation in grain crops. Adv. Agron. 150 (in press). Available at: https://www.elsevier.com/books/advances-in-agronomy/sparks/978-0-12-815175-4
Ehdaie, B., Alloush, G. A., Madore, M. A., and Waines, J. G. (2006). Genotypic variation for stem reserves and mobilization in wheat: II. Postanthesis changes in internode water-soluble carbohydrates. Crop Sci. 46, 2093–2103. doi: 10.2135/cropsci2006.01.0013
Errecart, P. M., Agnusdei, M. G., Lattanzi, F. A., Marino, M. A., and Berone, G. D. (2014). Critical nitrogen concentration declines with soil water availability in tall fescue. Crop Sci. 54, 318–330. doi: 10.2135/cropsci2013.08.0561
Farquhar, G. D., Ehleringer, J. R., and Hubick, K. T. (1989). Carbon isotope discrimination and photosynthesis. Annu. Rev. Plant Physiol. Plant Mol. Biol. 40, 503–537. doi: 10.1146/annurev.pp.40.060189.002443
Foulkes, M. J., Scott, R. K., and Sylvester-Bradley, R. (2002). The ability of wheat cultivars to withstand drought in UK conditions: formation of grain yield. J. Agric. Sci. 138, 153–169. doi: 10.1017/S0021859601001836
Foulkes, M. J., Sylvester-Bradley, R., Weightman, R., and Snape, J. W. (2007). Identifying physiological traits associated with improved drought resistance in winter wheat. Field Crop Res. 103, 11–24. doi: 10.1016/j.fcr.2007.04.007
Gastal, F., Lemaire, G., Durand, J. L., and Louarn, G. (2015). “Quantifying crop responses to nitrogen and avenues to improve nitrogen-use efficiency,” in Crop Physiology: Applications for Genetic Improvement and Agronomy, eds V. O. Sadras and D. F. Calderini (San Diego, CA: Academic Press), 161–206.
Greenwood, D. J., Lemaire, G., Gosse, G., Cruz, P., Draycott, A., and Neeteson, J. J. (1990). Decline in percentage N of C3 and C4 crops with increasing plant mass. Ann. Bot. 66, 425–436. doi: 10.1093/oxfordjournals.aob.a088044
Hoogmoed, M., and Sadras, V. O. (2016). The importance of water-soluble carbohydrates in the theoretical framework for nitrogen dilution in shoot biomass of wheat. Field Crop Res. 193, 196–200. doi: 10.1016/j.fcr.2016.04.009
Justes, E., Mary, B., Meynard, J. M., Machet, J. M., and Thelierhuche, L. (1994). Determination of a critical nitrogen dilution curve for winter wheat crops. Ann. Bot. 74, 397–407.
Kumakov, V. A., Evdokimova, O. A., and Buyanova, M. A. (2001). Dry matter partitioning between plant organs in wheat cultivars differing in productivity and drought resistance. Russ. J. Plant Physiol. 48, 359–363. doi: 10.1023/A:1016670501685
Lemaire, G., and Gastal, F. (1997). “N uptake and distribution in plant canopies,” in Diagnosis of the Nitrogen Status in Crops, ed. G. Lemaire (Berlin: Springer-Verlag), 3–41. doi: 10.1007/978-3-642-60684-7_1
Marino, M. A., Mazzanti, A., Assuero, S. G., Gastal, F., Echeverria, H. E., and Andrade, F. (2004). Nitrogen dilution curves and nitrogen use efficiency during winter-spring growth of annual ryegrass. Agron. J. 96, 601–607. doi: 10.2134/agronj2004.0601
Monjardino, M., Mcbeath, T. M., Brennan, L., and Llewellyn, R. S. (2013). Are farmers in low-rainfall cropping regions under-fertilising with nitrogen? A risk analysis. Agric. Syst. 116, 37–51. doi: 10.1016/j.agsy.2012.12.007
Neuhaus, A., Hoogmoed, M., and Sadras, V. (2017). Closing the yield gap for wheat and canola through an adjusted nitrogen nutrition index. Better Crops Plant Food 101, 16–18.
Niklas, K. J. (1994). Plant Allometry: The Scaling of Form and Process. Chicago, IL: University of Chicago Press.
Niklas, K. J. (2004). Plant allometry: is there a grand unifying theory? Biol. Rev. 79, 871–889. doi: 10.1017/S1464793104006499
Plénet, D., and Lemaire, G. (1999). Relationships between dynamics of nitrogen uptake and dry matter accumulation in maize crops. Determination of critical N concentration. Plant Soil 216, 65–82. doi: 10.1023/A:1004783431055
Poorter, H., Niklas, K. J., Reich, P. B., Oleksyn, J., Poot, P., and Mommer, L. (2012). Biomass allocation to leaves, stems and roots: meta-analyses of interspecific variation and environmental control. New Phytol. 193, 30–50. doi: 10.1111/j.1469-8137.2011.03952.x
R Development Core Team (2008). R: A Language and Environment for Statistical Computing. Vienna: R Foundation for Statistical Computing.
Ratjen, A. M., and Kage, H. (2016). Nitrogen-limited light use efficiency in wheat crop simulators: comparing three model approaches. J. Agric. Sci. 154, 1090–1101. doi: 10.1017/S0021859615001082
Ratjen, A. M., Neukam, D., and Kage, H. (2016). A simple drought-sensitive model for leaf:stem partitioning of wheat. J. Agron. Crop Sci. 202, 300–308. doi: 10.1111/jac.12165
Rebetzke, G. J., Van Herwaarden, A. F., Jenkins, C., Weiss, M., Lewis, D., Ruuska, S., et al. (2008). Quantitative trait loci for water-soluble carbohydrates and associations with agronomic traits in wheat. Aust. J. Agric. Res. 59, 891–905. doi: 10.1071/AR08067
Sadras, V. O., Lake, L., Li, Y., Farquharson, E. A., and Sutton, T. (2016). Phenotypic plasticity and its genetic regulation for yield, nitrogen fixation and δ13C in chickpea crops under varying water regimes. J. Exp. Bot. 67, 4339–4351. doi: 10.1093/jxb/erw221
Sadras, V. O., and Lemaire, G. (2014). Quantifying crop nitrogen status for comparisons of agronomic practices and genotypes. Field Crop Res. 164, 54–64. doi: 10.1016/j.fcr.2014.05.006
Sadras, V. O., and Moran, M. A. (2012). Elevated temperature decouples anthocyanins and sugars in berries of Shiraz and Cabernet Franc. Aust. J. Grape Wine Res. 18, 115–122. doi: 10.1111/j.1755-0238.2012.00180.x
Sadras, V. O., and Rodriguez, D. (2007). The limit to wheat water use efficiency in eastern Australia. II. Influence of rainfall patterns. Aust. J. Agric. Res. 58, 657–669. doi: 10.1071/AR06376
Saint Pierre, C., Trethowan, R., and Reynolds, M. (2010). Stem solidness and its relationship to water-soluble carbohydrates: association with wheat yield under water deficit. Funct. Plant Biol. 37, 166–174. doi: 10.1071/FP09174
Weiner, J. (2004). Allocation, plasticity and allometry in plants. Perspect. Plant Ecol. Evol. Syst. 6, 207–215. doi: 10.1078/1433-8319-00083
Yan, B., Ji, Z., Fan, B., Wang, X., He, G., Shi, L., et al. (2016). Plants adapted to nutrient limitation allocate less biomass into stems in an arid-hot grassland. New Phytol. 211, 1232–1240. doi: 10.1111/nph.13970
Yin, M., Li, Y., Xu, L., Shen, S., and Faang, H. (2018). Nutrition diagnosis in winter wheat based on critical nitrogen dilution curves. Crop Sci. 58, 1–10. doi: 10.2135/cropsci2017.05.0326
Yue, S. C., Meng, Q. F., Zhao, R. F., Li, F., Chen, X. P., Zhang, F. S., et al. (2012). Critical nitrogen dilution curve for optimizing nitrogen management of winter wheat production in the North China plain. Agron. J. 104, 523–529. doi: 10.2134/agronj2011.0258
Zadoks, J. C., Chang, T. T., and Konzak, C. F. (1974). A decimal code for the growth stages of cereals. Weed Res. 14, 415–421. doi: 10.1111/j.1365-3180.1974.tb01084.x
Zhao, Z., Wang, E., Wang, Z., Zang, H., Liu, Y., and Angus, J. F. (2014). A reappraisal of the critical nitrogen concentration of wheat and its implications on crop modeling. Field Crop Res. 164, 65–73. doi: 10.1016/j.fcr.2014.05.004
Zhu, L., Liang, Z. S., Xu, X., Li, S. H., and Monneveux, P. (2009). Evidences for the association between carbon isotope discrimination and grain yield-Ash content and stem carbohydrate in spring wheat grown in Ningxia (Northwest China). Plant Sci. 176, 758–767. doi: 10.1016/j.plantsci.2009.02.018
Keywords: water stress, carbon isotope discrimination, phenology, Triticum aestivum, water-soluble carbohydrates
Citation: Hoogmoed M and Sadras VO (2018) Water Stress Scatters Nitrogen Dilution Curves in Wheat. Front. Plant Sci. 9:406. doi: 10.3389/fpls.2018.00406
Received: 30 November 2017; Accepted: 14 March 2018;
Published: 06 April 2018.
Edited by:
Luis A. N. Aguirrezabal, National University of Mar del Plata, ArgentinaReviewed by:
Sotirios Archontoulis, Iowa State University, United StatesPeter Thorburn, Commonwealth Scientific and Industrial Research Organisation (CSIRO), Australia
Philippe Debaeke, Institut National de la Recherche Agronomique de Toulouse, France
Copyright © 2018 Hoogmoed and Sadras. This is an open-access article distributed under the terms of the Creative Commons Attribution License (CC BY). The use, distribution or reproduction in other forums is permitted, provided the original author(s) and the copyright owner are credited and that the original publication in this journal is cited, in accordance with accepted academic practice. No use, distribution or reproduction is permitted which does not comply with these terms.
*Correspondence: Victor O. Sadras, dmljdG9yLnNhZHJhc0BzYS5nb3YuYXU=