 Carlos Henríquez-Valencia
 Anita Arenas-M
 Joaquín Medina
 Javier Canales
- 1Instituto de Bioquímica y Microbiología, Facultad de Ciencias, Universidad Austral de Chile, Valdivia, Chile
- 2Instituto de Producción y Sanidad Vegetal, Facultad de Ciencias Agrarias, Universidad Austral de Chile, Valdivia, Chile
- 3Centro de Biotecnología y Genómica de Plantas, Instituto Nacional de Investigación y Tecnología Agraria y Alimentaria, Universidad Politécnica de Madrid, Madrid, Spain
- 4Millennium Institute for Integrative Systems and Synthetic Biology (MIISSB), Santiago, Chile
Sulfur is an essential nutrient for plant growth and development. Sulfur is a constituent of proteins, the plasma membrane and cell walls, among other important cellular components. To obtain new insights into the gene regulatory networks underlying the sulfate response, we performed an integrative meta-analysis of transcriptomic data from five different sulfate experiments available in public databases. This bioinformatic approach allowed us to identify a robust set of genes whose expression depends only on sulfate availability, indicating that those genes play an important role in the sulfate response. In relation to sulfate metabolism, the biological function of approximately 45% of these genes is currently unknown. Moreover, we found several consistent Gene Ontology terms related to biological processes that have not been extensively studied in the context of the sulfate response; these processes include cell wall organization, carbohydrate metabolism, nitrogen compound transport, and the regulation of proteolysis. Gene co-expression network analyses revealed relationships between the sulfate-responsive genes that were distributed among seven function-specific co-expression modules. The most connected genes in the sulfate co-expression network belong to a module related to the carbon response, suggesting that this biological function plays an important role in the control of the sulfate response. Temporal analyses of the network suggest that sulfate starvation generates a biphasic response, which involves that major changes in gene expression occur during both the early and late responses. Network analyses predicted that the sulfate response is regulated by a limited number of transcription factors, including MYBs, bZIPs, and NF-YAs. In conclusion, our analysis identified new candidate genes and provided new hypotheses to advance our understanding of the transcriptional regulation of sulfate metabolism in plants.
Introduction
Sulfur (S) is an essential nutrient for living organisms, including microorganisms, animals, and plants. Animals are unable to assimilate inorganic S sources and must obtain this nutrient from organic compounds such as proteins in their diet. This source of organic S ultimately depends on the ability of plants to assimilate S from inorganic sources, highlighting the importance of plants in the natural global S cycle (Takahashi et al., 2011). Plants have a constitutive demand for S driven by the need to synthesize essential S-containing compounds, such as amino acids [cysteine (Cys) and methionine], glutathione, and secondary metabolites, all of which help to sustain biological processes related to growth, development and defense (Maruyama-Nakashita, 2017).
The main source of S for plants is the sulfate anion ( ), which is taken up by root epidermal cells via the activity of specific sulfate transporters (SULTRs), mostly SULTR1;1 and SULTR1;2 (Yoshimoto et al., 2002). From the root tissue, sulfate is then transported to the aerial portion of plants through SULTRs such as SULTR2;1 and SULTR3;5 (Takahashi et al., 2000; Kataoka et al., 2004a). In addition to its long-distance transport, sulfate can be stored in the vacuoles and the release from these organelles is facilitated by the activities of the sulfate transporters SULTR4;1 and SULTR4;2 (Buchner et al., 2004; Kataoka et al., 2004b). Interestingly, the expression of genes coding for these sulfate transporters is induced by S starvation (Maruyama-Nakashita, 2017). The first step in sulfate assimilation occurs in the chloroplasts or cytosol, where a reaction catalyzed by isoforms of the enzyme ATP sulfurylase (ATPS) generates the metabolite adenosine 5′-phosphosulfate (APS). APS is one of the key intermediaries of the sulfate assimilation pathway and represents a branching point of that pathway (Kopriva et al., 2012). APS can be phosphorylated by the activity of APS kinase (APK), generating 3′-phosphoadenosine-5′-phosphosulfate (PAPS), an essential metabolite for the biosynthesis of sulfated compounds such as glucosinolates (GSLs) (Koprivova and Kopriva, 2016). GSLs have an important function in the defense of plants against pests and pathogens, especially in the Brassicales (Halkier and Gershenzon, 2006). APS can also be reduced to sulfite by the enzyme APS reductase (APR) in the chloroplasts; in turn, sulfite is reduced to sulfide by sulfite reductase (SiR) (Gotor et al., 2015). Sulfide is then incorporated into O-acetylserine (OAS) to form Cys (Gotor et al., 2015). Cys is a branching point in this pathway, leading to methionine biosynthesis or glutathione biosynthesis (Romero et al., 2014). Alternatively, by using sulfide as a source of S, mitochondria can also synthesize Cys (Romero et al., 2014). Cys biosynthesis requires the additional coordination of nitrogen and carbon metabolism, representing a key point for the dynamic control of these important metabolic pathways (Hesse et al., 2004). Recent evidence indicates that the availability of Cys precursors is perceived by plant cells via the GNC2 and TOR signaling pathways (Dong et al., 2017). In summary, sulfate assimilation involves the coordination of multiple subcellular organelles and enzymes, suggesting that complex regulatory mechanisms are involved in the regulation of the S metabolic pathway.
During the past few decades, as a consequence of the reduction in industrial S emissions, S deposition in the soil has severely decreased (McNeill et al., 2005). Lower S availability can reduce crop yields and impact the quality of harvested products (McGrath and Zhao, 1996; Bonnot et al., 2017). S deficiency also can impact the internal levels of important nutrients such as nitrate, phosphate, molybdenum, and iron (Forieri et al., 2017). Therefore, S starvation is problematic in modern agriculture in several industrialized countries.
Several studies have reported that S limitation triggers regulatory metabolic systems, such as the catabolism of S-storage compounds and suppression of the biosynthesis of secondary S metabolites (Maruyama-Nakashita, 2017). By entirely rearranging the flow of S metabolism, plants sustain their growth in low-S environments (Maruyama-Nakashita, 2017). This rearrangement involves the activation of sulfate uptake by inducing the expression of high-affinity sulfate transporters, the modification of GSL metabolism and the dramatic accumulation of OAS, the last of which is a signaling compound for responses to the lack of S (Nikiforova et al., 2003; Hubberten et al., 2012).
The complex signaling network of sulfate assimilation in plants is regulated by several transcriptional and post-transcriptional mechanisms (Maruyama-Nakashita, 2017). At the transcriptional level, S starvation induces the expression of several SULTRs via specific S-responsive cis-acting elements (SUREs) in their promoter regions (Maruyama-Nakashita et al., 2005; Rouached et al., 2008). Moreover, a post-transcriptional regulatory mechanism mediated by the activity of microRNA-395 (miR-395), which regulates several genes of the sulfate assimilation pathway in response to S limitation, has also been reported (Kawashima et al., 2009). In the past few decades, multiple efforts have been carried out to identify factors regulating the S-starvation response: SLIM1 (sulfur limitation1) (Maruyama-Nakashita et al., 2006), HY5 (Lee et al., 2011), miR-395 (Kawashima et al., 2009), several MYB transcription factors (TFs) (Celenza et al., 2005; Gigolashvili et al., 2007, 2008; Hirai et al., 2007), and SDI1 (sulfur deficiency induced 1) (Aarabi et al., 2016) as well as other factors related to epigenetic mechanisms such as SHM7 (Huang et al., 2016). Despite these recent advances, the molecular mechanisms that control S-starvation responses have only slowly began to emerge (Koprivova and Kopriva, 2014).
In the past decade, a considerable amount of transcriptomic data has been generated for the model plant Arabidopsis thaliana; these data correspond to a wide range of different tissues, developmental stages, stress conditions, and genotypes (Zimmermann et al., 2008). Analysis of this valuable information can provide information that cannot be gained by analyzing individual experiments (Rest et al., 2016). In the past few years, several transcriptomic analyses of the response of A. thaliana plants to sulfate starvation have been reported (Maruyama-Nakashita et al., 2005; Iyer-Pascuzzi et al., 2011; Bielecka et al., 2015; Aarabi et al., 2016; Forieri et al., 2017). By using an integrative meta-analysis of transcriptomic data from sulfate-availability experiments of different laboratories, we aimed to explore the unknown gene expression networks underlying the sulfate response in A. thaliana in this paper. Our results suggest that transporters and enzymes related to sulfate assimilation are consistently transcriptionally regulated by sulfate availability and reveal biological processes that have not been extensively studied in the context of the sulfate response, including cell wall organization, the regulation of proteolysis and carbon/nitrogen metabolism. In addition, we identified new regulatory factors, such as bZIP1, RVE2 and NF-YA2, that might be involved in the control of the S-starvation response. Combining a meta-analysis and functional analyses of candidate genes together will contribute to an improved understanding of the biology of sulfate responses in plants.
Materials and Methods
Plant Materials and Growth Conditions
Arabidopsis thaliana ecotype Columbia (Col-0) was used in this study. Seeds were sterilized with 50% bleach (v/v) and 0.1% Triton X-100, after which they were rinsed with sterilized water at least four times. The seeds were stratified at 4°C for 24 h in darkness and then germinated on plates containing Murashige and Skoog (MS) medium that was supplemented with 1% sucrose and 0.6% agar. The plates were incubated in a growth chamber (Bioref-19 incubator, PiTec, Santiago, Chile) at 23°C under a 16/8-h photoperiod and a light intensity of 125 μmol m-2 s-1 for 5 days. At dawn on the fifth day, the seedlings were transplanted to 6-well plates that contained liquid MS medium [full nutrient (FN)] or modified liquid MS medium that lacked sulfate, after which they were allowed to grow for 2 days. Afterward, the 7-day-old seedlings were treated with either 1.5 mM K2SO4 (+S) or 3 mM KCl (as a control) (-S) for 2 h. The FN plants were grown in the same medium and were harvested at the same time as were treated plants. At the end of the experiment, the shoots and roots were frozen in liquid nitrogen and stored at -80°C until further use. All experiments were performed in triplicate, and each replicate consisted of 80–100 seedlings.
RNA Isolation and Quantitative Real-Time PCR (qPCR) Analysis
For gene expression analyses, the total RNA was isolated from the frozen roots and shoots using preheated (65°C) RNA extraction buffer [2% cetyl-trimethylammonium bromide (CTAB) (Sigma), 2% PVP-40 (Sigma), 100 mM Tris-HCl (pH 8), 30 mM EDTA, 2 M NaCl, and 2% mercaptoethanol] and then purified using mini columns (PureLink PCR Purification Kit, Invitrogen) in accordance with previously described protocols (Yaffe et al., 2012). First-strand cDNA was synthesized using 500 ng of total RNA and a Promega Go-Script Reverse Transcription System. Gene expression was measured by Touchdown qPCR assays (Zhang et al., 2015) with PowerUp SYBR Green Master Mix (Thermo Fisher Scientific) and a Stratagene Mx3000P qPCR System (Agilent). The raw fluorescence data were analyzed with Real-time PCR Miner software (Zhao and Fernald, 2005). Each qPCR sample (total volume of 20 μl) contained 10 ng of cDNA (10 ng) and each primer at 300 μM. The following PCR program was used: one cycle at 95°C for 3 min; four cycles at 95°C for 20 s followed by 66°C for 10 s, during which the temperature decreased by 3°C per cycle; and 40 cycles of 95°C for 30 s, 60°C for 30 s, and 72°C for 30 s. The gene-specific forward and reverse primers used are listed in Supplementary Table S1. The clathrin adapter gene (AT4G24550) was used as an internal control to quantify the relative mRNA levels (Czechowski et al., 2005).
Microarray and Gene Co-expression Network Analyses
All previously published microarray experiments used in this work are listed in Table 1, and the raw data were downloaded from the Gene Expression Omnibus (GEO) database1. Several classic experiments (Hirai et al., 2003; Nikiforova et al., 2003; Maruyama-Nakashita et al., 2006) were not considered because of the lack of raw data in the public databases (GEO or ArrayExpress) or because of the microarray platform involved (only Affymetrix chips were considered). For each experiment, all the samples were normalized together using the robust multi-array average (RMA) method (Gautier et al., 2004) prior to differential expression analyses. To increase the power of the statistical analyses of the microarray data, we filtered out 50% of the genes that had lowest standard deviation, as previously recommended (Hackstadt and Hess, 2009). Differentially expressed genes were identified using empirical Bayes statistics implemented using the R package “limma” (Smyth, 2004). Those genes that met the following threshold criteria were considered significant: a minimum fold change (FC) of 2 and a false discovery rate (FDR) of less than 5%.
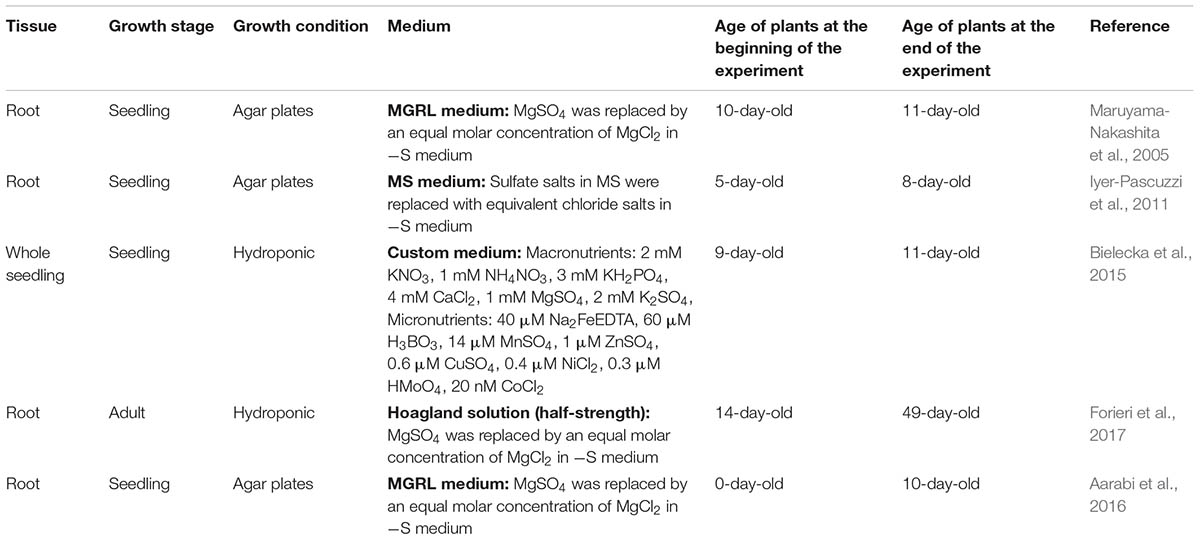
TABLE 1. Summary of microarray datasets and sample details.
To focus on consistent sulfate-responsive genes, we selected genes that were significantly regulated by sulfate in at least two different experiments. We then calculated the Pearson correlation coefficients between each gene pair across all selected experiments using the R package rsgcc (Ma and Wang, 2012). For network construction, an absolute correlation threshold of 0.81 was selected based on the best fit of the scale-free topology, as described previously (Romero-Campero et al., 2016). The gene co-expression network was visualized using Cytoscape v3.4 (Shannon et al., 2003), and the network topology parameters were calculated using the NetworkAnalyzer plugin (Doncheva et al., 2012). Co-expression modules were identified using Dynamic Tree Cut software (Langfelder et al., 2008).
Functional Enrichment Analyses
Gene ontology (GO) enrichment analyses were performed using BiNGO software (Maere et al., 2005). Hypergeometric tests with an FDR of 5% as a cutoff were used to select significantly enriched GO terms. REVIGO software (Supek et al., 2011) was then used to reduce the redundancy between GO terms. In addition, we filtered and removed the general GO terms (those containing more than 5% of A. thaliana genes) to focus on the more specific terms.
Results
Meta-Transcriptomic Analysis Uncovers a New Core Set of Genes Involved in the Sulfate Response in A. thaliana
Several transcriptomic analyses of the response of A. thaliana plants to S starvation have been reported in the past several years (Maruyama-Nakashita et al., 2005; Iyer-Pascuzzi et al., 2011; Bielecka et al., 2015; Aarabi et al., 2016; Forieri et al., 2017). Additionally, microarray data from sulfate treatments after S-starvation periods have also been published (Maruyama-Nakashita et al., 2005; Bielecka et al., 2015). Therefore, a good opportunity exists to perform an integrated analysis of the sulfate transcriptomic data to answer relevant questions related to sulfate assimilation, such as “Is there a group of conserved genes involved in the response to sulfate availability?,” “What are the main biological functions involved in this response?,” and “What are the potential transcriptional regulatory factors of the sulfate response?”
As a first step toward answering these questions, we conducted a detailed search for sulfate experiments in the GEO and ArrayExpress databases. Specifically, we selected experiments using the same microarray platform (Affymetrix) to avoid noise related to mixing different technologies, and we considered only samples from wild-type plants. Moreover, the microarray experiments in which raw data were not publicly available were discarded. In accordance with these criteria, five different datasets were found in public databases; these datasets were generated from experiments carried out in different laboratories (Table 1). Notably, three of these datasets were generated from time-course experiments that assessed the sulfate response, and there was a wide variety of sulfate concentrations, different growth systems (hydroponics or plates) and different tissues (roots and whole plants). In total, 52 microarrays were normalized by the RMA method (Gautier et al., 2004), and we performed a differential expression analysis between +S and -S samples from each experiment. To focus on the relevant S-responsive genes, we considered a gene to be differentially expressed when its FDR was less than 5% and its FC was a minimum of two. Using these criteria, we identified 2046 genes that significantly responded to changes in sulfate availability (Figure 1A and Supplementary Table S2). Only 20.43% of these differentially expressed genes were shared between at least two different experiments (418 genes, Figure 1A and Supplementary Table S2). Similar results have been reported for other nutrients and environmental factors, such as nitrate, carbon, or light conditions (Krouk et al., 2009; Canales et al., 2014). Among the most enriched biological functions associated with these 418 genes are sulfate assimilation, sulfate transport, GSL biosynthesis, and glutathione metabolism (Figure 1B). All these functions are directly related to sulfate assimilation (Takahashi et al., 2011; Kopriva et al., 2015), which is indicative of the high specificity of the genes identified in our analysis. On the other hand, the most enriched GO terms for molecular functions were “sulfate transmembrane transporter activity” (38-fold enrichment) and “glutathione transferase activity” (17-fold enrichment). The most enriched GO terms among the cellular components were “integral component of plasma membrane” (sevenfold enrichment) and “cell wall” (twofold enrichment). Taken together, these results indicate that the genes identified in our meta-analysis are highly associated with sulfate transport and metabolism.
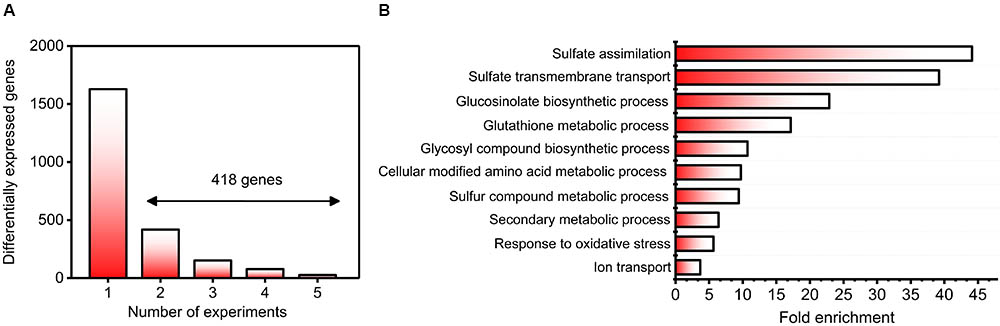
FIGURE 1. Identification of robust genes and biological functions involved in the sulfate response. (A) Histogram of 2046 significantly responding sulfate-responsive genes (FDR < 5%) distributed according to the number of experiments in which they were regulated. Those genes regulated by sulfate in at least two different experiments (418) were selected for further analyses. (B) The most enriched biological processes associated with genes regulated by sulfate availability. The GO over-representation analysis was carried out using 418 genes regulated by sulfate in at least two different experiments, and a 5% FDR cutoff was used. The top 10 GO terms are shown ranked in accordance with their enrichment level.
Interestingly, we found 27 genes that were differentially expressed in all the sulfate experiments analyzed (Table 2). Most (85.2%) of these genes were positively regulated by S starvation. Among this group, the genes ATSDI1, BGLU28, AT5G26220, and LSU1 showed the greatest average induction in response to S starvation (>15-fold), and these genes have been used as markers of sulfate deficiency in several studies (Dan et al., 2006; Zhang et al., 2014; Aarabi et al., 2016). More than half of the genes in this group, such as APR3 (Setya et al., 1996), BCAT4 (Lächler et al., 2015), and SULTR4;2 (Kataoka et al., 2004b), have a domain related to enzymatic activity or sulfate transport, suggesting that genes encoding transporters and enzymes related to sulfate assimilation are consistently transcriptionally regulated by sulfate availability. In addition, we identified a set of genes whose functions in the sulfate response are unknown, including AT3G05400, AT4G31330, AT5G40670, and AT3G56200, and that belong to the same group of consistent genes (≈45%, Table 2). To validate the results of this meta-analysis, we performed sulfate resupply experiments involving 7-day-old Arabidopsis seedlings that were previously subjected to 48 h of S starvation, as described in Section “Materials and Methods.” We collected root and shoot samples 2 h after sulfate treatment, and the mRNA levels of six genes that were representative examples of unknown and consistent sulfate-responsive genes were analyzed by qPCR (Figure 2). As shown in Figure 2, the genes AT3G05400, NSP5, AT4G31330, SIP1;2, AT5G40670, and AT1G75290 were significantly induced at 48 h after S starvation. Similar results were also reported for the five experiments selected for our meta-analysis. Compared with the S-starvation treatment, the sulfate resupply treatment caused a significant decrease in the mRNA levels of these genes, with the exception of SIP1;2. This result indicates that AT3G05400, NSP5, AT4G31330, AT5G40670, and AT1G75290 rapidly respond to changes in sulfate availability. Interestingly, we also found that the response of these genes to S starvation is tissue-dependent (Figure 2). For instance, AT4G31330 showed a clear response to S starvation in the root tissue, whereas AT3G05400 was specifically induced in the shoots, which suggests a different physiological role of these unknown genes in sulfate metabolism. In addition, six marker genes that respond to S were also analyzed by qPCR, and the expression profiles of these classic marker genes indicated that effective S treatments were performed under our specific experimental conditions (Supplementary Figure S1).
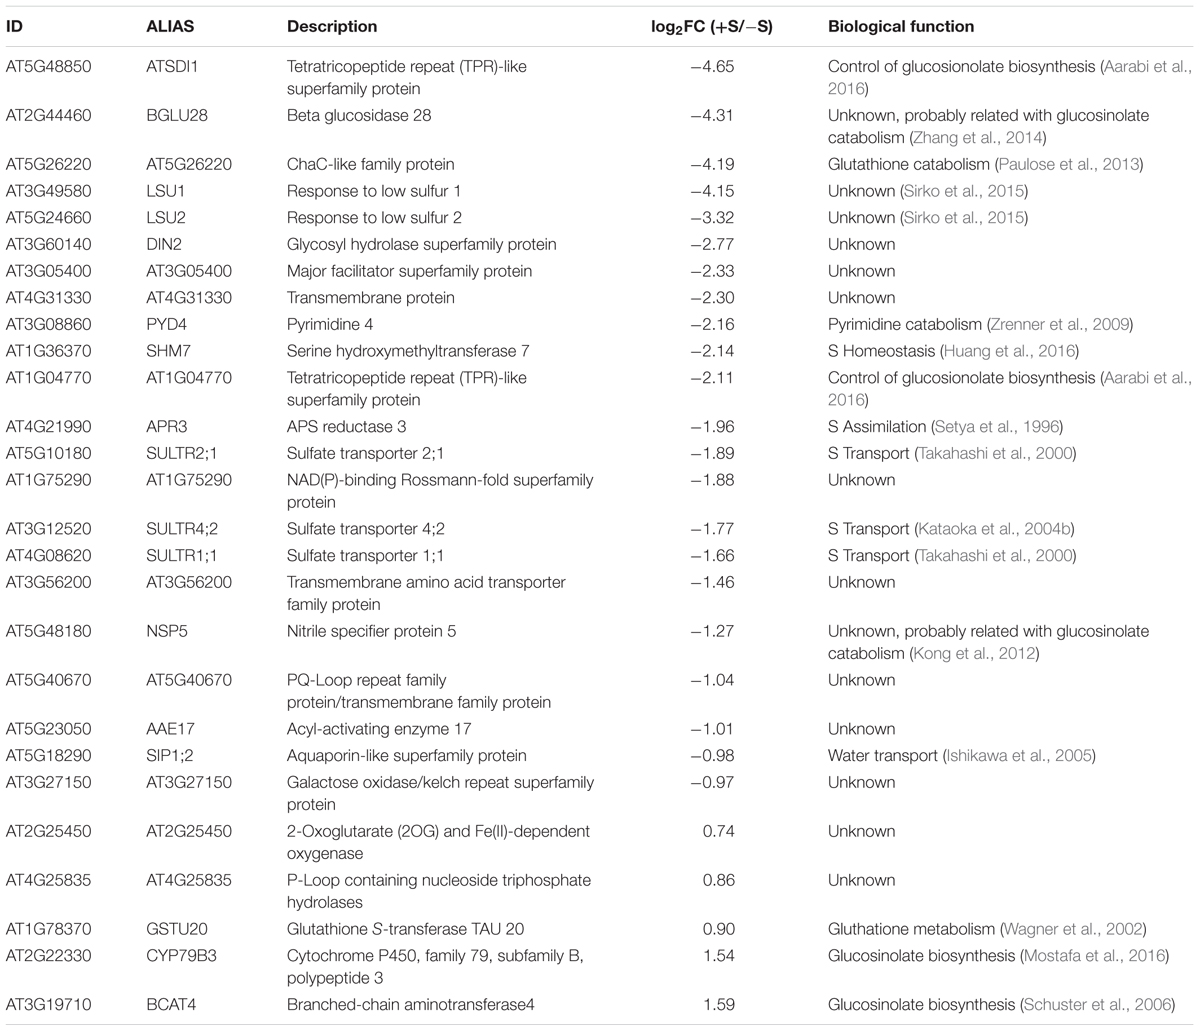
TABLE 2. Set of genes that significantly responded to sulfate in all the experiments analyzed (FDR < 5% and log2|FC| > 1).
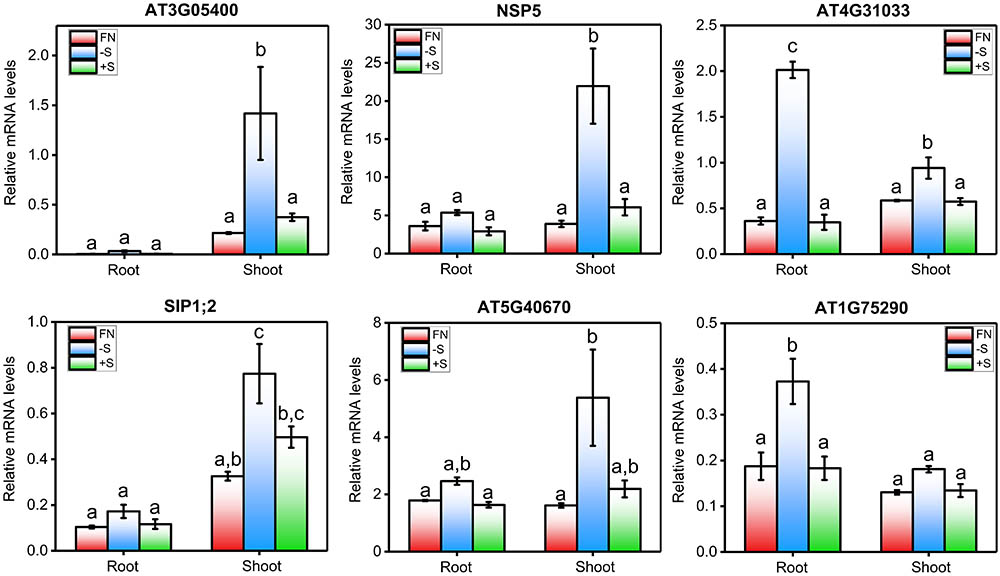
FIGURE 2. qPCR-analyzed expression profiles of highly consistent genes whose function in the sulfate response is unknown. mRNA levels of six genes (AT3G05400, NSP5, AT4G31033, SIP1;2, AT5G40670, and AT1G75290) selected from the meta-analysis of the sulfate transcriptome data were analyzed by qPCR using the clathrin adapter gene (AT4G24550) as a normalization reference gene. Briefly, 5-day-old seedlings were transferred to liquid MS medium that was supplemented with sulfate (FN, 1.5 mM S) or not, after which the seedlings were allowed to grow for 2 days. At dawn on the 7th day, the plants were treated with potassium sulfate (+S, 1.5 mM) or potassium chloride (–S, 3 mM). The mRNA levels were measured 2 h after treatment using the total RNA extracted from root and shoot samples. The values plotted correspond to the means of three independent experiments ± standard errors of the mean; 80 to 100 seedlings were used per replicate. The means with different lowercase letters are significantly different, p < 0.05 (one-way ANOVA and Tukey’s test).
GO Analysis of Robust Sulfate-Responsive Genes Reveals the Biological Processes Involved in the Sulfate Response
Determination of the most consistent genes in the sulfate response immediately raises the following question: what are the most consistent biological functions? To answer this question, we subjected each sulfate experiment to a functional enrichment analysis using BiNGO software (Maere et al., 2005), after which we ranked the over-represented GO terms according to their consistency across the five experiments analyzed. REVIGO software (Supek et al., 2011) was used to remove redundant GO terms and was also used to construct a network consisting of the most consistent biological processes (Figure 3). As such, we identified four major functional groups: response to stimulus, metabolism, transport, and homeostasis (Figure 3). The GO terms related to ion transport, sulfate metabolism and response to stress were the most consistent biological functions that were over-represented in all the experiments analyzed (red circles, Figure 3). Moreover, we found several consistent GO terms related to biological processes that have been studied little in the context of the sulfate response, including cell wall organization, regulation of proteolysis, carbohydrate metabolism, and nitrogen compound transport. Consistent with these results, a strong interaction between the sulfate and nitrate assimilation pathways has been reported (Kopriva and Rennenberg, 2004). Interestingly, our meta-analysis identified genes encoding nitrate transporters [NTR2.1 (Wang and Crawford, 1996) and NTR3.1 (Okamoto et al., 2006)] and important nitrogen metabolism enzymes, such as nitrate reductase [NIA1 and NIA2 (Cheng et al., 1991)] and asparagine synthetase [ASN2 (Lam et al., 1998)], which were differentially expressed in accordance with sulfate availability in at least two different experiments (Supplementary Table S2). Moreover, we have found that overlaps between sulfate-responsive genes identified in this work and nitrate-responsive genes reported previously (Canales et al., 2014) are higher than expected due to chance (p-value < 0.001, Genesect Virtual Plant 1.3; Katari et al., 2010). Specifically, 169 genes are shared between a set of 1021 nitrate-responsive genes and a set of 418 sulfate-responsive genes (Supplementary Figure S2). Interestingly, among the most over-represented biological functions of these shared genes, we found “response to stimulus” and “secondary metabolism” GO terms; these shared genes include multiple glutathione metabolism genes, including GSTU20, GSTU22, GSTU24, and GSTU25 (Wagner et al., 2002).
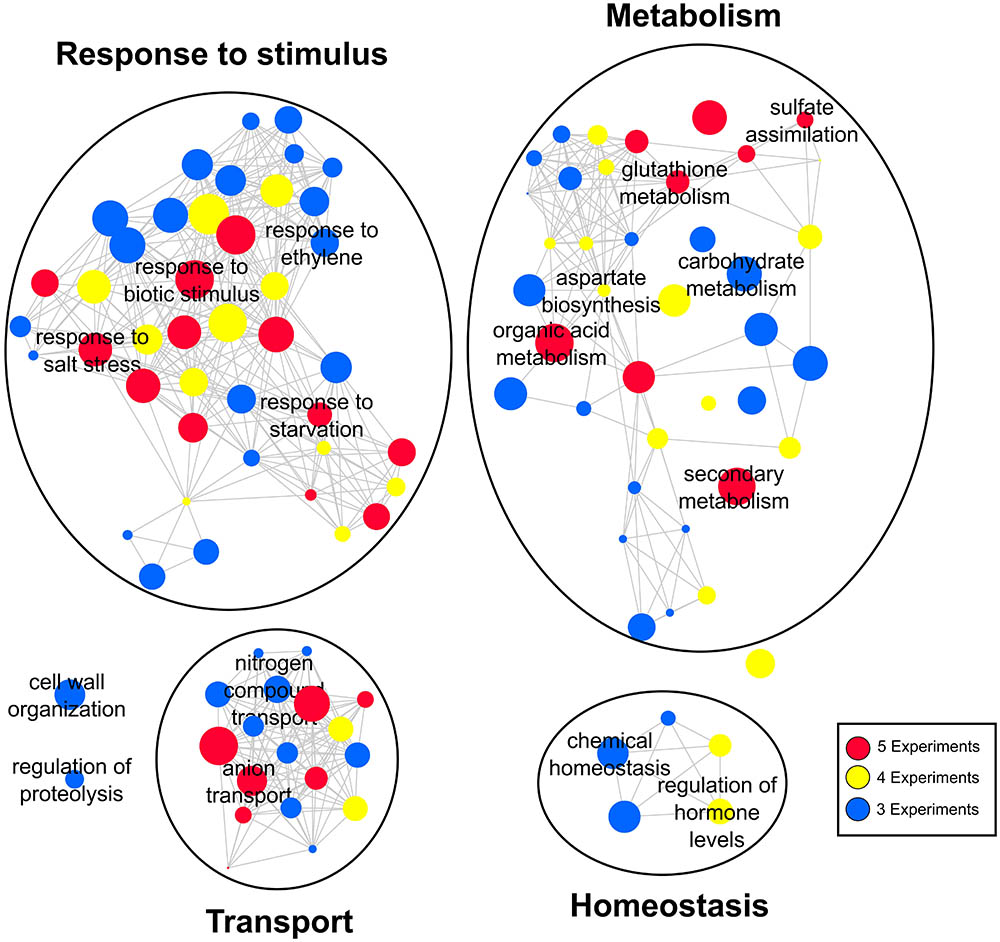
FIGURE 3. Gene ontology (GO) network of the most frequent biological functions regulated by sulfate. GO terms are linked by edges in the graph according to their semantic similarity (Supek et al., 2011). The bubble size indicates the percentage of genes associated with the corresponding GO term, and the color indicates the degree of consistency of the corresponding GO term.
Gene Co-expression Network Analysis Predicts New Candidate Genes and Functional Modules Involved in the Sulfate Response
We hypothesized that an unsupervised gene co-expression network analysis of the sulfate transcriptomic data will provide new insight into the regulation of sulfate metabolism and will help prioritize candidate genes for future functional analyses. To reduce noise in our dataset for co-expression analyses, we focused on genes that were differentially expressed in at least two different experiments (418 genes, Figure 1A). First, prior to network construction, we performed unsupervised hierarchical clustering using Dynamic Tree Cut software (Langfelder et al., 2008) to identify gene co-expression modules associated with the sulfate response. As such, we identified seven major modules, which were sorted and named according their size from 1 to 7. As shown in Figure 4, modules M1 and M4 show a clear negative response to sulfate, whereas M2, M3, and M5 show a general positive response to sulfate availability. The functional enrichment analysis revealed that the modules with a negative response to sulfate (M1 and M4) had over-represented biological functions related to sulfate assimilation and glutathione metabolism (Figure 4). In contrast, positive responsive modules, such as M2, M3 and M5, had over-represented biological functions related to secondary S metabolism, ion transport and carbon responses (Figure 4). This result indicates that S-starvation signals activate the expression of genes related to sulfate assimilation and repress genes related to secondary S metabolism, as reported previously (Hirai et al., 2005; Kopriva et al., 2012), which reflects the accuracy of our predictions. Notably, our analysis extends this regulatory mechanism to other biological processes such as the carbon response (M3) and transport of other molecules such as nitrate or amino acids (M5). On the other hand, genes of modules M6 and M7 did not show a consistent response to S, indicating that other factors interact with the S response to control the expression of these genes. These modules, M6 and M7, included genes related to nitrate and sulfate metabolism, such as NIA1, NIA2, APR2, and ATSERAT3;1.
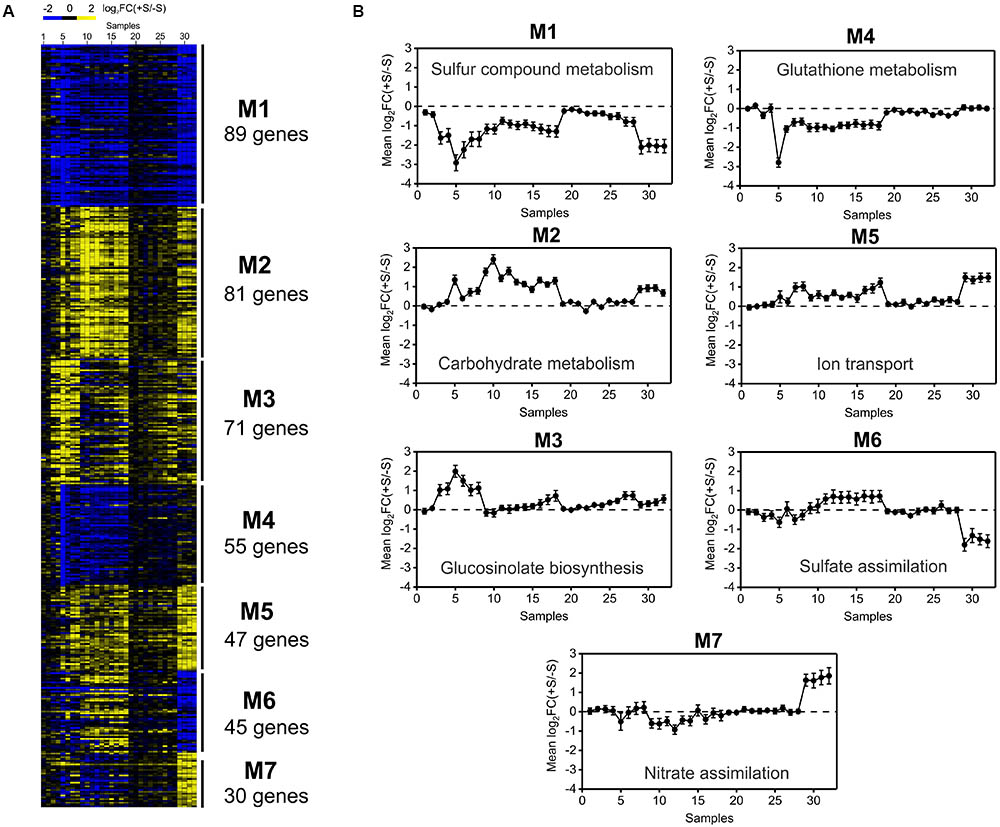
FIGURE 4. Hierarchical clustering of transcriptomic data from sulfate-availability experiments uncovers functional modules involved in the sulfate response. (A) Heatmap of 418 sulfate-responsive genes selected in the meta-analysis. Gene co-expression modules identified using Dynamic Tree Cut software are indicated on the right-hand side of the heatmap. Genes up-regulated by sulfate are indicated in yellow, and genes down-regulated by sulfate are shown in blue. (B) Average expression profiling of each co-expression module across the different samples analyzed in the meta-analysis. Samples 1 to 6 correspond to the experiment of Bielecka et al. (2015), samples 7 and 8 correspond to the experiment of Aarabi et al. (2016), samples 9 to 18 correspond to the dataset of Iyer-Pascuzzi et al. (2011), samples 19 to 28 correspond to the dataset of Maruyama-Nakashita et al. (2005) and samples 29 to 32 correspond to the experiment of Forieri et al. (2017). The GEO accession number for each sample is indicated in Supplementary Table S4. The most over-represented GO term for the biological processes is indicated within each module.
To better understand the functional relationships between gene co-expression modules and to identify new candidate genes related to the sulfate response, we performed a gene co-expression network analysis. As such, using the R package rsgcc, we determined the Pearson’s correlation index of each pair of sulfate-responsive genes (Ma and Wang, 2012). We then selected a Pearson correlation threshold (0.81) based on the best fit of the scale-free model (Supplementary Figure S3), as previously described (Romero-Campero et al., 2016). Accordingly, we obtained a gene co-expression network with 341 nodes and 1811 connections as shown in Figure 5A. Gene co-expression modules (M1–M7) are marked with different colors to distinguish the different expression patterns and functional groups present in the network.
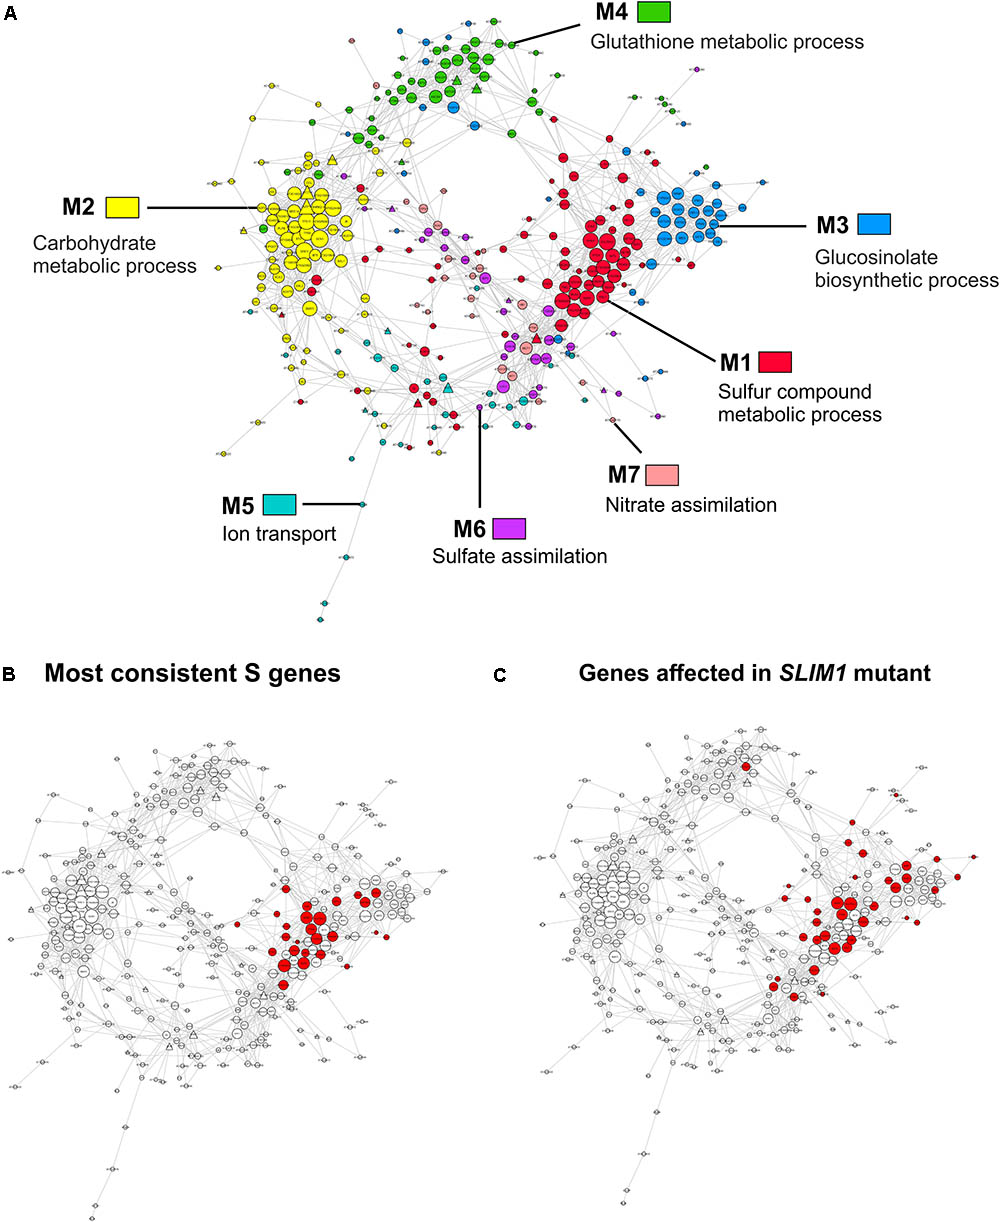
FIGURE 5. Sulfate-responsive gene co-expression network. (A) Colors are used to distinguish the genes from each network module. The most over-represented GO terms for the biological process are indicated in each module. The shape of each specific node is related to TFs (triangle) or targets (circle) and the size depends on the number of connections of each node in such a way that nodes with higher size are the most connected genes in the network. (B) The most consistent sulfate-responsive genes in the co-expression network. The red nodes indicate genes that were regulated by sulfate availability in the five analyzed experiments. (C) Mapping of the genes that were significantly affected in slim1 mutants according to previous microarray analyses (Maruyama-Nakashita et al., 2006).
With 86 genes, M1 is the largest module in the sulfate-responsive gene co-expression network. Moreover, M1 contains most of the genes that were consistently detected in our meta-analysis of the sulfate response (Figure 5B, 21 of 23 genes), suggesting that this module plays a key role in the sulfate response. In addition, most of these genes were affected in plants with a mutant form of slim1 (Figure 5C), a key TF involved in the control of the sulfate assimilation pathway (Maruyama-Nakashita et al., 2006). The top GO categories in this module are S compound metabolic processes (GO:0006790, adjusted p-value = 8.22E-12) and S compound transport (GO:0072348, adjusted p-value = 8.22E-12). In network analyses, a common way to prioritize candidate genes is by the number of connections (van Dam et al., 2017), which is also known as the degree of a gene. Thus, NetworkAnalyzer was used to determine the degree of each gene from this module (Doncheva et al., 2012). The genes of high degree in this module were SULTR4;2 [a vacuolar sulfate transporter (Kataoka et al., 2004b)], AT3G56200 (a putative amino acid transporter) and SHM7 [serine hydroxymethyltransferase 7 (Huang et al., 2016)], each of which had 34, 32, and 31 connections, respectively (Table 3).
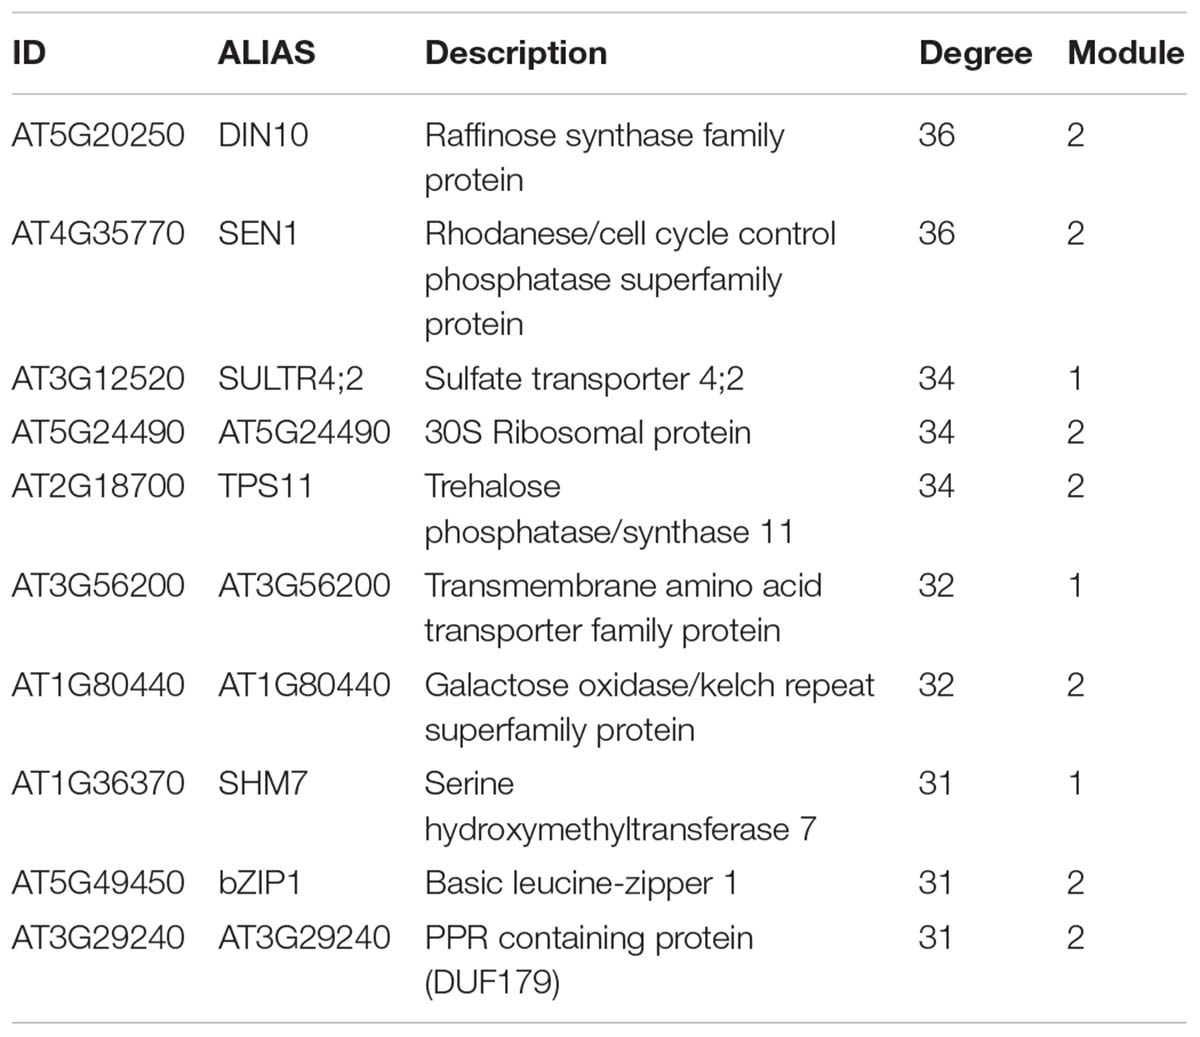
TABLE 3. Ranking of the 10 most connected genes in the sulfate co-expression network.
M3 is the module most connected to M1; a total of 75 connections were present between the genes of the two modules (Figure 5A). The top GO categories in M3 were GSL biosynthetic process (GO: 0019761, adjusted p-value = 3.78E-27) and glycosyl compound biosynthetic process (GO: 1901659, adjusted p-value = 7.85E-22). Several well-known enzymes involved in the GSL biosynthetic pathway, including CYP83A1, IMD3, BCAT4, and MAM1 (Sønderby et al., 2010), are among the most connected genes in this module. As mentioned above, the expression patterns of the genes in modules M1 and M3 exhibit contrasting responses to sulfate (Figure 4), indicating that these genes are inversely regulated by S-starvation signals (Falk et al., 2007; Hirai et al., 2007; Davidian and Kopriva, 2010).
The second largest module in the sulfate co-expression network is M2, which contains 81 genes. In this case, the carbohydrate metabolic process (GO: 0005975, adjusted p-value = 4.26E-03) and the response to carbohydrate (GO: 0009743, adjusted p-value = 4.26E-03) were the most over-represented biological processes. In fact, several of the most connected genes of this module are related to these biological functions, including DIN10 (Fujiki et al., 2001), bZIP1 (Usadel et al., 2008) and TPS8 (Ramon et al., 2009), each of which has 36, 31, and 30 connections, respectively (Supplementary Table S3). To verify the expression of the selected genes, using the same conditions as mentioned previously, qPCR expression analyses were performed. As shown in Figure 6, the expression levels of DIN10 and bZIP1 in aerial tissues were down-regulated in response to sulfate deficiency and did not recover after 2 h of sulfate treatment. In addition, we also analyzed the expression of a gene related to tRNA processing, SEN1 (Akama et al., 2000), which, together with DIN10, is the most connected gene in the sulfate co-expression network (Table 3). Interestingly, the RNA levels of the SEN1 gene were significantly higher in sulfate-containing samples (FN and +S) than in sulfate-starved samples (-S), and similar responses were observed for DIN10 and bZIP1 (Figure 6). Overall, the results of the qPCR analyses confirm the expression patterns obtained by the microarray data (Figure 4B, M2).
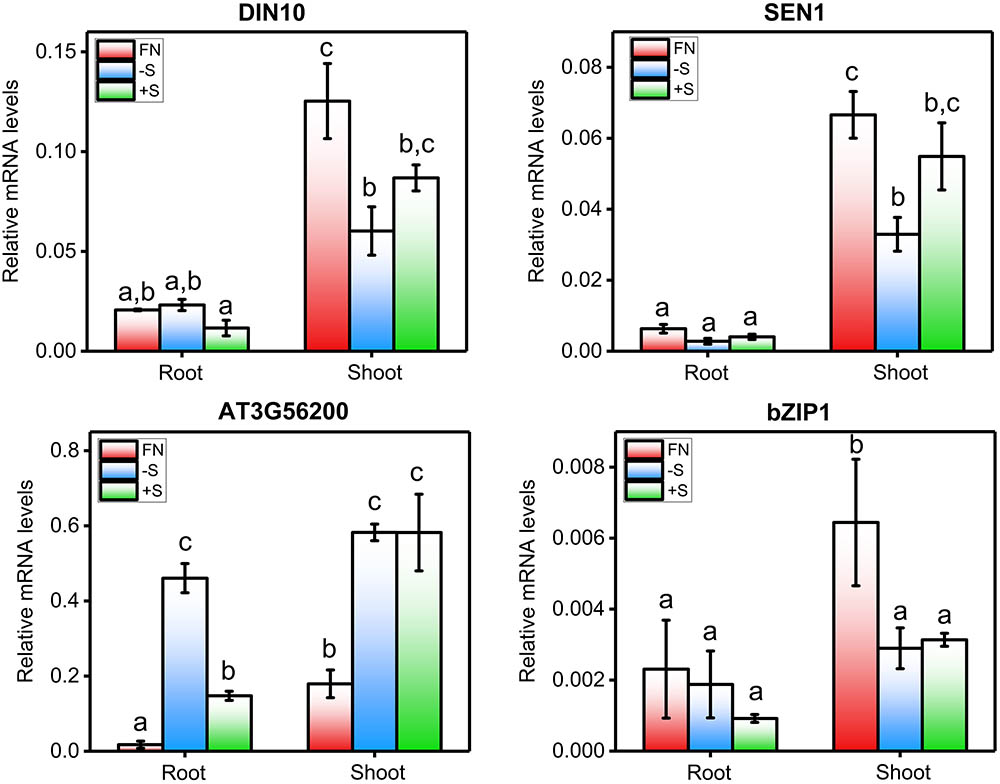
FIGURE 6. qPCR-analyzed expression profiles of hub genes identified in the sulfate co-expression network. The mRNA levels of DIN10, SEN1, AT3G56200, and bZIP1 were determined by qPCR in three different samples: FN (full nutrient-treated samples), +S (sulfate-treated samples) and –S (sulfate-starved samples). For more details regarding this experiment, see the legend in Figure 2. The values plotted correspond to the means of three independent experiments ± standard errors of the mean; 80 to 100 seedlings were used per replicate. The means with different lowercase letters are significantly different, p < 0.05 (one-way ANOVA and Tukey’s test).
The most connected module to M2 is M4, which is related to glutathione metabolism (GO:0006749, adjusted p-value = 1.31E-07). As shown in Figure 4, the average expression profile of module M4 contrasts with that of module M2, indicating that several connected genes of the two modules are negatively correlated with each other. Other biological processes over-represented in M4 included the flavonoid metabolic process (GO:0009812, adjusted p-value = 2.66E-07) and cellular-modified amino acid metabolic process, indicating that this module is enriched in genes related to secondary metabolism.
Temporal Dynamics of the Network Reveal a Complex Response to S Starvation
To further investigate the dynamics of the sulfate response, we performed detailed expression and network analyses of Arabidopsis plants subjected to S starvation. For this purpose, we selected the available microarray dataset that contained the most differentially expressed genes and the most time points (Iyer-Pascuzzi et al., 2011). Specifically, 7-day-old plants were subjected to S starvation, and samples were collected at five different time points after this treatment (0, 3, 12, 24, 48, and 72 h). We first analyzed the number of differentially expressed genes identified in modules M1–M7 at the different time points after the starvation treatment (Figure 7C). In addition, we determined the node degree for the different modules, which served as an estimation of the complexity of the gene co-expression network at the different time points.
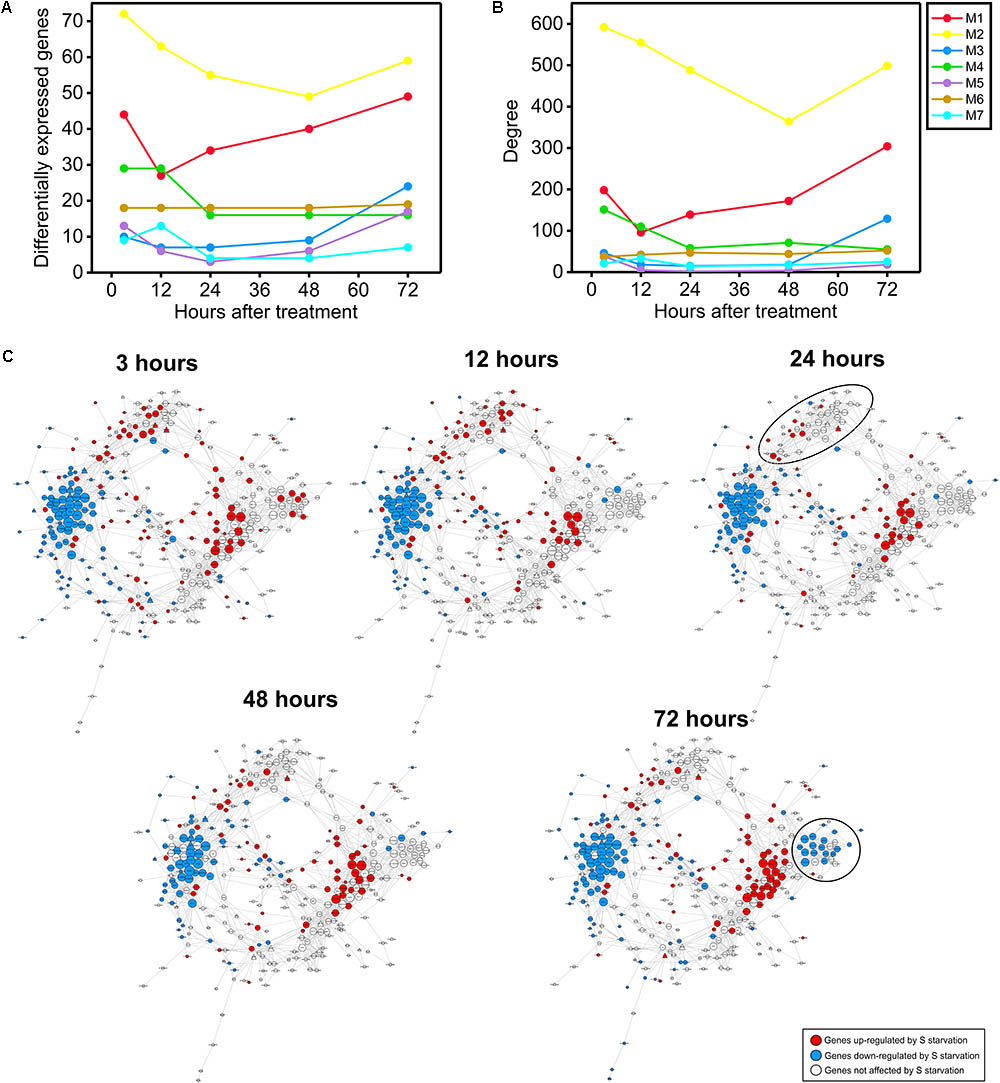
FIGURE 7. Temporal dynamics of the sulfate co-expression network. (A) Temporal dynamics of the numbers of genes differentially expressed in response to sulfate starvation in a previous experiment (Iyer-Pascuzzi et al., 2011). The color code indicates the co-expression module to which each gene belongs according to the sulfate co-expression network presented in Figure 5. (B) Temporal dynamics of the degree of each co-expression module according to the differentially expressed genes in the previously mentioned experiment (Iyer-Pascuzzi et al., 2011). The color code indicates the co-expression module. (C) Mapping of the differentially expressed genes in response to sulfate starvation at five different time points (3, 12, 24, 48, and 72 h). The red and blue colors indicate significant up- or down-regulation, respectively, in response to sulfate starvation (adjusted p-value < 0.05 and log2|FC| > 1 or < –1). The microarray data were obtained from the experiment GSE30098 of GEO (Iyer-Pascuzzi et al., 2011). The shape of each specific node is related to TFs (triangle) or targets (circle), the size depends on the number of connections of each node in such a way that nodes with higher size are the most connected genes in the network.
As shown in Figure 7A, most of the sulfate co-expression network modules exhibited a similar expression pattern; maximal values were reached at early (3–12 h) and late (60–72 h) time points after the starvation treatment. An exception to these general patterns were the genes of module M6; these genes exhibited stable expression patterns in response to S starvation across all time points. Similar results were obtained when we assessed the number of connections or the degree of each module (Figure 7B). In fact, most of the sulfate modules present higher degree values at early (3–12 h) and late (60–72 h) time points. Taken together these results suggest that the S-starvation response likely generates a biphasic response, which involves major changes in gene regulatory networks during both the early and late responses. A similar biphasic response to S-starvation has been reported after performing an integrative analysis of transcriptomic and metabolomic data at longer times (Nikiforova et al., 2004; Hoefgen and Nikiforova, 2007).
Network Analysis Predicts That the Sulfate Response Is Regulated by a Limited Number of TFs, Including MYB, bZIP, and NF-YA
Regarding TFs, we found 17 genes annotated as “nucleic acid binding” (GO:0003676) in the sulfate co-expression network; these genes represented 4.5% of the genes with GO annotations. In contrast, in the entire A. thaliana genome, 14% of genes were annotated as “nucleic acid binding,” which is three times greater than the percentage of genes involved in the sulfate co-expression network. Genes with nucleic acid-binding domains were significantly underrepresented (adjusted p-value = 3.44E-06), suggesting that most of the TFs involved in the response to sulfate availability are not transcriptionally regulated. Since, we have applied a twofold of change filter for the selection of differentially expressed genes, it is possible that this filter has specifically reduced the number of TFs. The number of differentially expressed genes increased up to 2148 by removing the twofold expression filter. Despite this increase in the number of genes, the GO term “nucleic acid binding” (GO:0003676) was also significantly under-represented (adjusted p-value = 3.6667E-8), indicating that the twofold expression filter is not the reason of TFs under-representation.
Another possibility is that the sulfate-responsive TFs identified in this network have many targets. The five TFs with the highest degree were co-expressed together alongside a total of 66 different genes, which represent 19.35% of the sulfate network. Specifically, the TFs with the highest degree in the sulfate co-expression network were bZIP1 (Weltmeier et al., 2009), ATCTH (Pomeranz et al., 2010) and MYBL2 (Matsui et al., 2008), each of which has 31, 25, and 16 connections, respectively (Supplementary Table S3). These three TFs belong to module M2, and most of their connections are with genes from the same module, indicating that these TFs are specific to M2. After analyzing all the TFs in the sulfate co-expression network, we identified two TFs connected to multiple co-expression modules, suggesting that these TFs could be important for the coordination of different functional responses to sulfate. These TFs include RVE2 [AT5G37260 (Zhang et al., 2007)] and NF-YA2 [AT3G05690 (Leyva-González et al., 2012)] and are connected to specific genes of five different co-expression modules (Figure 8). In fact, RVE2 has 16 connections that are distributed among M1 (6), M2 (1), M5 (5), M6 (3), and M7 (1). NF-YA2 has 15 connections with genes in modules M1 (9), M3 (1), M5 (3), M6 (2), and M7 (1); thus, these two TFs are connected to the same functional modules, with the exceptions of M2 and M3. However, RVE2 and NF-YA2 share only two target genes (MOT1 and FPF1), suggesting that RVE2 and NF-YA2 act complementarily to regulate different genes of the same modules.
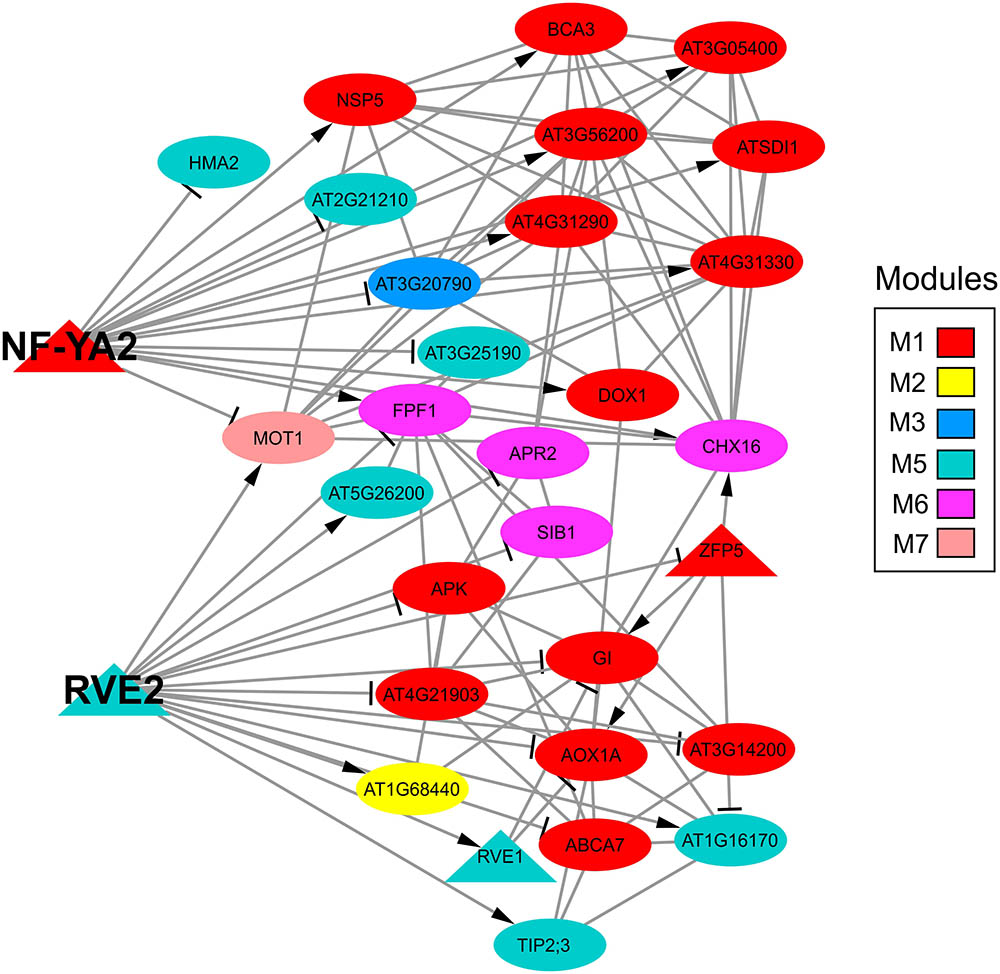
FIGURE 8. Subnetwork of two TFs (NF-YA2 and RVE2) identified as intermodular hub genes of the sulfate gene co-expression network. The color code indicates the co-expression module to which each gene belongs according to the sulfate co-expression network presented in Figure 5. The arrows or lines at the end of an edge indicate positive or negative correlations, respectively. The shape of each specific node is related to TFs (triangle) or targets (circle) and the size depends on the number of connections of each node in such a way that nodes with higher size are the most connected genes in the network.
Discussion
Although several transcriptomic studies have been performed in the past decade, an integrated view of the transcriptional regulation of the sulfate response is still lacking. The identification of relevant genes in the response to an environmental stimulus is an important step in understanding the molecular mechanisms involved in this process. The analysis of multiple transcriptomic experiments focuses on the same stimulus is often used to achieve this goal (Tseng et al., 2012). This type of analysis is based on the logical principle that the expression of essential genes controlling the response to a stimulus is independent of other factors, such as developmental stage or plant growth conditions. Moreover, meta-analyses are useful for the identification of new genes and biological processes related to a stimulus of interest, such as nutrient availability (Canales et al., 2014) or a phytohormone (Bhargava et al., 2013). For instance, a meta-transcriptomic analysis of the nitrate response revealed that root hair development was one of the most consistent biological functions in that response (Canales et al., 2014). This result was based on bioinformatic analyses that have recently been experimentally validated in a report showing that the molecular mechanism involved in root hair development is induced by nitrate treatment (Canales et al., 2017). Following a similar strategy, we present a detailed meta-analysis of sulfate-specific microarray experiments; this meta-analysis enabled us to identify a highly consistent group of sulfate-responsive genes. Several well-known genes involved in sulfate transport and metabolism, such as SULTR1;1, SULTR2;1, SULTR4;2 and APR3, are members of this group (Takahashi, 2010). Interestingly, most of these consistent genes were also highly co-expressed in sulfate-specific experiments and belong to module M1 of the sulfate co-expression network. Based on the biological functions associated with the genes in M1, these highly consistent genes in the sulfate response are likely strongly related to sulfate transport and metabolism.
However, M1 also contains several genes whose functions are unknown but that are related to sulfate metabolism, such as AT3G56200, AT4G31330, and AT3G05400. In the case of AT3G56200, the predicted open reading frame codes for a protein that consists of 435 amino acids and contains a conserved transmembrane domain (pfam01490) present in several amino acid transporters including amino butyric acid (GABA) transporters (Edwards et al., 1997), proline transporters and amino acid permeases (Marchler-Bauer et al., 2017). In accordance with SUBA4 prediction and consistent with the presence of this transmembrane domain, the subcellular localization of AT3G56200 is the plasma membrane (Hooper et al., 2017). The qPCR expression analyses revealed that AT3G56200 was significantly induced in the roots and shoots of Arabidopsis under S deficiency conditions. Interestingly, the resupply of this nutrient 2 h later reduced the expression of this gene only in the roots, possibly because it takes more time for sulfate or its derivatives to be transported to the aerial portions. Considering these data, the AT3G56200 gene might be involved in the transport of amino acids derived from sulfate assimilation, such as Cys, methionine, or serine. Interestingly, this gene is highly co-expressed together alongside genes related to sulfate assimilation, including SULTR4;1, APS1, and APS3 [ATTED-II (Obayashi et al., 2017)]. However, we cannot rule out the possibility that the product of this gene, acting as co-transporter, plays an indirect role in the amino acid transport or is involved in the transport of other S-containing compounds. Owing to its root-specific response to S, the AT4G31330 gene, whose function is unknown, stands out in this group; this gene codes for a putative protein that consists of 239 amino acids and, in accordance with SUBA4 prediction, localizes to the plasma membrane (Hooper et al., 2017). Interestingly, the AT4G31330 gene is highly co-expressed together alongside a group of genes coding for several enzymes involved in amino acid metabolism, such as aspartate kinase 3 (Yoshioka et al., 2001), methionine sulfoxide reductase B5 (Vieira Dos Santos et al., 2005) and ATSERAT3;1, suggesting that this gene is also related to amino acid transport. Moreover, information within a general co-expression database [ATTED-II (Obayashi et al., 2017)] suggests that AT4G31330 is highly co-expressed together alongside the genes coding for several members of the nodulin MtN21-like transporter family, including UMAMIT12, UMAMIT20 and UMAMIT28, which are usually involved in amino acid export (Muller et al., 2015). Importantly, the genes involved in the transport of S-containing amino acids are currently unknown (Gigolashvili and Kopriva, 2014). Our analyses indicated that the AT3G56200 and AT4G31330 genes might play a relevant role in this important biological process for plants to adapt to changes in S availability.
Another interesting finding from our analysis is that changes in sulfate availability regulate genes involved in nitrate metabolism. Regulatory interactions of sulfate and nitrate reduction have been reported in several plant systems (Lee et al., 2011). For example, the activity of nitrate reductase decreases upon S starvation in cultured tobacco cells (Reuveny et al., 1980). Moreover, it has been reported that S deficiency also affects the internal nitrate levels in Arabidopsis (Forieri et al., 2017), as nitrate metabolism is among the biological processes that were significantly down-regulated in a recent transcriptomic analysis (Forieri et al., 2017). In addition, carbon availability is an important factor that affects the expression of genes that are involved in nitrate and sulfate assimilation (Hesse et al., 2003; Gutiérrez et al., 2007). For example, glucose and sucrose treatments induced the expression of the important enzymes of sulfate metabolism, such as APR and sulfate transporters (Hesse et al., 2003; Maruyama-Nakashita et al., 2004). In the case of nitrogen, asparagine synthetase 1 (ASN1) was one of the first reported genes showing dual regulation by nitrogen and carbon and is related to the role of asparagine, which represents an efficient compound for nitrogen transport (Lam et al., 1994). Several genes involved in the control of carbon/nitrogen (C/N) balance have subsequently been reported in Arabidopsis, such as bZIP1 (Obertello et al., 2010; Dietrich et al., 2011) and ATL31 (Sato et al., 2009). Interestingly, we found that S starvation reduces the expression levels of ASN1 and bZIP1, suggesting that the C/N balance is affected by sulfate availability. Thus, it is possible that C/N balance is among the signals involved in the coordination of S and nitrogen metabolism. Indeed, the connections between nitrogen, carbon, and S metabolism involve two different regulated branches for the biosynthesis of Cys (Dong et al., 2017). One branch is affected by the limitation of C/N and is regulated by GCN2 protein kinase for the selective sensing of Cys precursors (Dong et al., 2017). However, by down-regulating glucose metabolism, S starvation is transduced to TOR (Dong et al., 2017). In addition to these novel results, our analysis suggests that the bZIP1 signaling pathway might also be involved in the coordination of carbon, S, and nitrogen metabolism.
Topological parameters of the presented gene co-expression network can be used to identify new candidate genes. This criterion is based on empirical evidence showing a positive correlation between the essentiality and connectivity of a gene (Jeong et al., 2001; Hahn and Kern, 2005; Carlson et al., 2006). In our case, the most connected genes in the network were SEN1 and DIN10, both of whose functions in the sulfate response are unknown. These two genes belong to a group of dark-inducible (DIN) genes (Azumi and Watanabe, 1991), whose expression is strongly induced by low-carbon conditions, including darkness and senescence (Fujiki et al., 2001). Both the microarray data and qPCR analyses reveal that SEN1 and DIN10 are repressed by conditions of S deficiency. Other DIN genes, such as ASN1, DIN2 and DIN9, responded similarly, suggesting that S starvation increases carbon availability. This hypothesis is supported by several metabolic studies that have shown significant increases in raffinose and sucrose levels upon S starvation (Nikiforova et al., 2005; Zhang et al., 2011); these increases might be due to the activation of GSL catabolism, which releases sugars and S metabolites (Maruyama-Nakashita, 2017). Other biological functions highlighted by our meta-analysis include cell wall organization and the regulation of proteolysis. Two extracellular polypeptides are related to the restructuring of cell walls during S starvation in Chlamydomonas reinhardtii for redistributing internal S-containing molecules (Takahashi et al., 2001). In accordance with this biological function, genes coding for apoplast-localized proteins were also over-represented in the sulfate-responsive genes detected in our meta-analysis. The modification of cell walls during S starvation might also be related to nutrient uptake, since the permeability of the plant cells depends largely on the composition of this extracellular barrier. S deficiency can increase the suberization of root endodermis within cell walls, and interestingly, plants with mutant forms of the sulfate transporters SULTR1;1 and SULTR1;2 displayed increased suberization (Barberon et al., 2016). We also identified several genes related to the regulation of proteolysis, a biological function that might be related to the remobilization of S from proteins. For instance, significant degradation of ribulose-1,5-bisphospate carboxylase occurs during S deprivation (Ferreira and Teixeira, 1992). This biological function might also be involved in the post-translational control of the S response. By using our meta-analysis, we identified two sulfate-responsive genes that are members of the Arabidopsis Tóxicos en Levadura (ATL) family (ATL8 and ATL15), a group of plant-specific RING-type ubiquitin ligases involved in ubiquitin-dependent protein catabolic processes (Aguilar-Hernández et al., 2011).
Transcription factors are important components involved in the control of gene regulatory networks; therefore, we analyzed this protein family in the sulfate co-expression network in high detail. Unexpectedly, we found that TFs were significantly underrepresented in the sulfate co-expression network. Importantly, only two TFs that are involved in the sulfate response and functionally characterized thus far (SLIM1 and HY5) are not regulated by this nutrient (Maruyama-Nakashita et al., 2006; Lee et al., 2011; Koprivova and Kopriva, 2014). Overall, these data support the idea that, in addition to transcriptional regulatory mechanisms, other post-transcriptional and post-translational mechanisms are important for plant sulfate responses. MYB28, a key TF involved in GSL biosynthesis, is repressed by interactions with SDI1 and SDI2 proteins, which in turn are induced by S starvation (Aarabi et al., 2016). These interacting proteins localize to the nucleus but lack the DNA-binding ability, indicating that SDIs proteins might represents an additional layer of regulation. To date, 59 miRNAs whose expression is affected by S deficiency have been described (Liang et al., 2015). However, only the family of miR-395 has been shown to mediate sulfate allocation and regulate the expression of important enzymes of sulfate assimilation, such as APS3/APS4 (Kawashima et al., 2009, 2011; Liang et al., 2010). Post-translational regulatory mechanisms controlling the S response are largely unknown, since no proteomic studies have been conducted in Arabidopsis seedlings or adult plants under S deficiency conditions.
Another reason that may explain the underrepresentation of TFs in the sulfate-responsive co-expression network is that some TFs have many targets. Our network analyses predicted that only five TFs control the expression of a large proportion of the sulfate-regulated target genes identified in this work (approximately 20% of the total set of sulfate-responsive genes). We highlight the case of the NF-YA2 and RVE2 TFs, since they are connected to genes within five different co-expression modules, suggesting that these TFs might be central regulators of the S response. NF-YA2 belongs to a family of evolutionarily conserved TFs present in nearly all eukaryotes (Zhao et al., 2017). NF-Y TFs are biologically active upon formation of a heterotrimeric complex composed of NF-YA, NF-YB, and NF-YC subunits (Nardini et al., 2013). NF-Y TFs are associated with the regulation of several developmental processes such as flowering and root system architecture (Petroni et al., 2012). NF-YA2 is preferentially expressed in leaves and shoot apical meristems, and overexpression of NF-YA2 increases leaf biomass (Zhang et al., 2017). Our analysis showed that NF-YA2 is positively correlated with the genes in modules M1 and M6, which are related to S metabolism and the response to S deficiency. Interestingly, NF-YA2 is regulated by other nutritional deficiencies such as phosphate starvation (Woo et al., 2012), suggesting a general role of this TF in the nutrient starvation response. On the other hand, RVE2 is also co-expressed together alongside genes in the same modules with which NF-YA2 is associated but in an inverse manner. Our microarray analysis revealed that RVE2 is repressed by S starvation, whereas NF-YA2 is induced by this signal, suggesting these TFs act complementarily to coordinate the response to sulfate availability. RVE2 is a MYB-like TF and has a single MYB domain that belongs to the same family as that of CCA1 and LHY (Rawat et al., 2009), which are important TFs involved in the control of the circadian rhythm and flowering (Park et al., 2016). In fact, the expression levels of the central regulators of the circadian rhythm are affected by overexpression of RVE2 (Zhang et al., 2007). Recently, it has been reported that, by directly regulating gibberellin biosynthesis, RVE2, together with RVE1, regulates important developmental processes such as germination in Arabidopsis (Jiang et al., 2016); this finding suggests that S signaling pathways are also involved in the control of other developmental processes such as flowering and germination.
Based on our analysis of microarray data, we identified 2046 sulfate-responsive genes and the most robust biological functions associated with them in Arabidopsis. However, individual transcriptomic analyses of the sulfate response are unable to capture the broad realm of sulfate-responsive genes because these experiments are carried out under very specific experimental conditions (Hirai and Saito, 2004). Similar to other environmental factors, responses to changes in S availability depend on multiple factors, such as time of treatment, nutrient concentrations, and age of the plant or tissue (Hirai and Saito, 2004). We found that most of the sulfate-responsive genes are regulated under a particular experimental condition (Figure 1A). Accordingly, only 18.2% of genes reported by one of the pioneering microarray analyses (Hirai et al., 2003) are shared with those identified from our meta-analysis (Supplementary Figure S4). The low overlap with this experiment might be due to differences in the age of the plants used in that experiment (21 days old), as most of the samples used in our meta-analysis were from plants that were 7 to 13 days old. In contrast, the data obtained by Nikiforova et al. (2003) and Maruyama-Nakashita et al. (2006) showed greater overlap with the data in our meta-analysis: 33.7 and 59.5%, respectively. Interestingly, the age range of the plants analyzed in those experiments was similar to that of the plants used in our meta-analysis. Taken together, these results suggest that developmental stage might be an important factor that affects the transcriptional response to sulfate availability, which has been reported for the case of nitrate in maize (Plett et al., 2016).
Another possibility to explain the limited overlap between individual experiments observed in this study is that the consistency of nutrient responses is markedly higher at the biological function level than at the gene level (Canales et al., 2014). We found that the median overlap between the over-represented biological functions of any combination of the five experiments analyzed in this work was 52%, whereas at the gene level, the median overlap was 23%. The overlap between our meta-analysis and the pioneering works reported by Hirai et al. (2003), Nikiforova et al. (2003), and Maruyama-Nakashita et al. (2006) is also consistently higher at biological function level than at the gene level (Supplementary Figure S4). This result indicates that the same biological function, e.g., sulfate transport, can be carried out by different genes depending on the environmental and developmental context.
Conclusion
Our work also highlights the role of the TFs bZIP, MYB, and NF-YA in the regulation of important functions related to sulfate transport and signaling. NF-YA TFs have not yet been characterized in the framework of sulfate responses. Moreover, we identified candidate genes involved in the transport of amino acids derived from sulfate assimilation. Functional studies of these new candidate genes should improve the understanding of the regulatory mechanisms underlying sulfate responses in crop species and model plant species such as Arabidopsis.
Author Contributions
CH-V performed the experiments. JC and JM analyzed the data. JM and AA-M helped in writing the manuscript. JC conceived and designed the study and wrote the manuscript.
Funding
This work was supported by the grants no 11150070 from “Fondo Nacional de Desarrollo Científico y Tecnológico” (FONDECYT) and REDI170024 from “Programa de Cooperación Internacional” (PCI) awarded to JC, the FONDECYT post-doctoral fellowship no 3160336 awarded to AA-M, the “Instituto Nacional de Investigación y Tecnología Agraria y Alimentaria” (INIA) RTA2015-00014-c02-01 awarded to JM, the Internationalization Program PUC (PUC1566) awarded to JM and the FONDECYT post-doctoral fellowship no 3180269 awarded to CH-V. This research is funded by MIISSB Iniciativa Científica Milenio-MINECON.
Conflict of Interest Statement
The authors declare that the research was conducted in the absence of any commercial or financial relationships that could be construed as a potential conflict of interest.
Supplementary Material
The Supplementary Material for this article can be found online at: https://www.frontiersin.org/articles/10.3389/fpls.2018.00470/full#supplementary-material
FIGURE S1 | qPCR analysis of genes that are related to sulfate assimilation and that belong to module M1 of the sulfate co-expression network. For details, see the legend in Figure 2. Student’s t-test was performed to test the significant differences (p < 0.05) between FN and +/-S treatments. Significant changes are indicated with an asterisk.
FIGURE S2 | Venn diagram showing the genes shared between nitrate- and sulfate-responsive genes. For this analysis, we considered only genes reported as differentially expressed in at least two different experiments in a previous study (Canales et al., 2014) or in the present study.
FIGURE S3 | Selection of the Pearson’s correlation threshold for the construction of the sulfate co-expression network.
FIGURE S4 | Overlap between genes and GO terms in our meta-analysis and the pioneering microarray experiments of Hirai et al. (2003), Nikiforova et al. (2003), and Maruyama-Nakashita et al. (2006).
TABLE S1 | List of oligonucleotides used for qPCR analyses.
TABLE S2 | List of sulfate-responsive genes ranked according to their consistency in the sulfate response.
TABLE S3 | List of genes involved in the sulfate co-expression network ranked according to their number of connections.
TABLE S4 | Gene Expression Omnibus accession numbers and descriptions of the samples included in Figure 4B.
Footnote
References
Aarabi, F., Kusajima, M., Tohge, T., Konishi, T., Gigolashvili, T., Takamune, M., et al. (2016). Sulfur deficiency-induced repressor proteins optimize glucosinolate biosynthesis in plants. Sci. Adv. 2:e1601087. doi: 10.1126/sciadv.1601087
Aguilar-Hernández, V., Aguilar-Henonin, L., and Guzmán, P. (2011). Diversity in the architecture of ATLs, a family of plant ubiquitin-ligases, leads to recognition and targeting of substrates in different cellular environments. PLoS One 6:e23934. doi: 10.1371/journal.pone.0023934
Akama, K., Junker, V., and Beier, H. (2000). Identification of two catalytic subunits of tRNA splicing endonuclease from Arabidopsis thaliana. Gene 257, 177–185. doi: 10.1016/S0378-1119(00)00408-X
Azumi, Y., and Watanabe, A. (1991). Evidence for a senescence-associated gene induced by darkness. Plant Physiol. 95, 577–583. doi: 10.1104/pp.95.2.577
Barberon, M., Vermeer, J. E., De Bellis, D., Wang, P., Naseer, S., Andersen, T. G., et al. (2016). Adaptation of root function by nutrient-induced plasticity of endodermal differentiation. Cell 164, 447–459. doi: 10.1016/j.cell.2015.12.021
Bhargava, A., Clabaugh, I., To, J. P., Maxwell, B. B., Chiang, Y.-H., Schaller, G. E., et al. (2013). Identification of cytokinin-responsive genes using microarray meta-analysis and RNA-Seq in Arabidopsis. Plant Physiol. 162, 272–294. doi: 10.1104/pp.113.217026
Bielecka, M., Watanabe, M., Morcuende, R., Scheible, W.-R., Hawkesford, M. J., Hesse, H., et al. (2015). Transcriptome and metabolome analysis of plant sulfate starvation and resupply provides novel information on transcriptional regulation of metabolism associated with sulfur, nitrogen and phosphorus nutritional responses in Arabidopsis. Front. Plant Sci. 5:805. doi: 10.3389/fpls.2014.00805
Bonnot, T., Bancel, E., Alvarez, D., Davanture, M., Boudet, J., Pailloux, M., et al. (2017). Grain subproteome responses to nitrogen and sulfur supply in diploid wheat Triticum monococcum ssp. monococcum. Plant J. 91, 894–910. doi: 10.1111/tpj.13615
Buchner, P., Takahashi, H., and Hawkesford, M. J. (2004). Plant sulphate transporters: co-ordination of uptake, intracellular and long-distance transport. J. Exp. Bot. 55, 1765–1773. doi: 10.1093/jxb/erh206
Canales, J., Contreras-Lopez, O., Alvarez, J. M., and Gutierrez, R. A. (2017). Nitrate induction of root hair density is mediated by TGA1/TGA4 and CPC transcription factors in Arabidopsis thaliana. Plant J. 92, 305–316. doi: 10.1111/TPJ.13656
Canales, J., Moyano, T. C., Villarroel, E., and Gutiérrez, R. A. (2014). Systems analysis of transcriptome data provides new hypotheses about Arabidopsis root response to nitrate treatments. Front. Plant Sci. 5:22. doi: 10.3389/fpls.2014.00022
Carlson, M. R. J., Zhang, B., Fang, Z., Mischel, P. S., Horvath, S., and Nelson, S. F. (2006). Gene connectivity, function, and sequence conservation: predictions from modular yeast co-expression networks. BMC Genomics 7:40. doi: 10.1186/1471-2164-7-40
Celenza, J. L., Quiel, J. A., Smolen, G. A., Merrikh, H., Silvestro, A. R., Normanly, J., et al. (2005). The Arabidopsis ATR1 Myb transcription factor controls indolic glucosinolate homeostasis. Plant Physiol. 137, 253–262. doi: 10.1104/pp.104.054395
Cheng, C. L., Acedo, G. N., Dewdney, J., Goodman, H. M., and Conkling, M. A. (1991). Differential expression of the two Arabidopsis nitrate reductase genes. Plant Physiol. 96, 275–279. doi: 10.1104/pp.96.1.275
Czechowski, T., Stitt, M., Altmann, T., Udvardi, M. K., and Scheible, W.-R. (2005). Genome-wide identification and testing of superior reference genes for transcript normalization in Arabidopsis. Plant Physiol. 139, 5–17. doi: 10.1104/pp.105.063743
Dan, H., Yang, G., and Zheng, Z.-L. (2006). A negative regulatory role for auxin in sulphate deficiency response in Arabidopsis thaliana. Plant Mol. Biol. 63, 221–235. doi: 10.1007/s11103-006-9084-0
Davidian, J. C., and Kopriva, S. (2010). Regulation of sulfate uptake and assimilation - The same or not the same? Mol. Plant 3, 314–325. doi: 10.1093/mp/ssq001
Dietrich, K., Weltmeier, F., Ehlert, A., Weiste, C., Stahl, M., Harter, K., et al. (2011). Heterodimers of the Arabidopsis transcription factors bZIP1 and bZIP53 reprogram amino acid metabolism during low energy stress. Plant Cell 23, 381–395. doi: 10.1105/tpc.110.075390
Doncheva, N. T., Assenov, Y., Domingues, F. S., and Albrecht, M. (2012). Topological analysis and interactive visualization of biological networks and protein structures. Nat. Protoc. 7, 670–685. doi: 10.1038/nprot.2012.004
Dong, Y., Silbermann, M., Speiser, A., Forieri, I., Linster, E., Poschet, G., et al. (2017). Sulfur availability regulates plant growth via glucose-TOR signaling. Nat. Commun. 8:1174. doi: 10.1038/s41467-017-01224-w
Edwards, R. H., Jorgensen, E. M., McIntire, S. L., Reimer, R. J., and Schuske, K. (1997). Identification and characterization of the vesicular GABA transporter. Nature 389, 870–876. doi: 10.1038/39908
Falk, K. L., Tokuhisa, J. G., and Gershenzon, J. (2007). The effect of sulfur nutrition on plant glucosinolate content: physiology and molecular mechanisms. Plant Biol. 9, 573–581. doi: 10.1055/s-2007-965431
Ferreira, R. M., and Teixeira, A. R. (1992). Sulfur starvation in Lemna leads to degradation of ribulose-bisphosphate carboxylase without plant death. J. Biol. Chem. 267, 7253–7257.
Forieri, I., Sticht, C., Reichelt, M., Gretz, N., Hawkesford, M. J., Malagoli, M., et al. (2017). System analysis of metabolism and the transcriptome in Arabidopsis thaliana roots reveals differential co-regulation upon iron, sulfur and potassium deficiency. Plant. Cell Environ. 40, 95–107. doi: 10.1111/pce.12842
Fujiki, Y., Yoshikawa, Y., Sato, T., Inada, N., Ito, M., Nishida, I., et al. (2001). Dark-inducible genes from Arabidopsis thaliana are associated with leaf senescence and repressed by sugars. Physiol. Plant. 111, 345–352. doi: 10.1034/j.1399-3054.2001.1110312.x
Gautier, L., Cope, L., Bolstad, B. M., and Irizarry, R. A. (2004). affy–analysis of Affymetrix GeneChip data at the probe level. Bioinformatics 20, 307–315. doi: 10.1093/bioinformatics/btg405
Gigolashvili, T., Engqvist, M., Yatusevich, R., Müller, C., and Flügge, U.-I. (2008). HAG2/MYB76 and HAG3/MYB29 exert a specific and coordinated control on the regulation of aliphatic glucosinolate biosynthesis in Arabidopsis thaliana. New Phytol. 177, 627–642. doi: 10.1111/j.1469-8137.2007.02295.x
Gigolashvili, T., and Kopriva, S. (2014). Transporters in plant sulfur metabolism. Front. Plant Sci. 5:442. doi: 10.3389/fpls.2014.00442
Gigolashvili, T., Yatusevich, R., Berger, B., Müller, C., and Flügge, U.-I. (2007). The R2R3-MYB transcription factor HAG1/MYB28 is a regulator of methionine-derived glucosinolate biosynthesis in Arabidopsis thaliana. Plant J. 51, 247–261. doi: 10.1111/j.1365-313X.2007.03133.x
Gotor, C., Laureano-Marín, A. M., Moreno, I., Aroca,Á, García, I., and Romero, L. C. (2015). Signaling in the plant cytosol: cysteine or sulfide? Amino Acids 47, 2155–2164. doi: 10.1007/s00726-014-1786-z
Gutiérrez, R. A., Lejay, L. V., Dean, A., Chiaromonte, F., Shasha, D. E., and Coruzzi, G. M. (2007). Qualitative network models and genome-wide expression data define carbon/nitrogen-responsive molecular machines in Arabidopsis. Genome Biol. 8:R7. doi: 10.1186/gb-2007-8-1-r7
Hackstadt, A. J., and Hess, A. M. (2009). Filtering for increased power for microarray data analysis. BMC Bioinformatics 10:11. doi: 10.1186/1471-2105-10-11
Hahn, M. W., and Kern, A. D. (2005). Comparative genomics of centrality and essentiality in three eukaryotic protein-interaction networks. Mol. Biol. Evol. 22, 803–806. doi: 10.1093/molbev/msi072
Halkier, B. A., and Gershenzon, J. (2006). Biology and biochemistry of glucosinolates. Annu. Rev. Plant Biol. 57, 303–333. doi: 10.1146/annurev.arplant.57.032905.105228
Hesse, H., Nikiforova, V., Gakiere, B., and Hoefgen, R. (2004). Molecular analysis and control of cysteine biosynthesis: integration of nitrogen and sulphur metabolism. J. Exp. Bot. 55, 1283–1292. doi: 10.1093/jxb/erh136
Hesse, H., Trachsel, N., Suter, M., Kopriva, S., von Ballmoos, P., Rennenberg, H., et al. (2003). Effect of glucose on assimilatory sulphate reduction in Arabidopsis thaliana roots. J. Exp. Bot. 54, 1701–1709. doi: 10.1093/jxb/erg177
Hirai, M. Y., Fujiwara, T., Awazuhara, M., Kimura, T., Noji, M., and Saito, K. (2003). Global expression profiling of sulfur-starved Arabidopsis by DNA macroarray reveals the role of O -acetyl-l-serine as a general regulator of gene expression in response to sulfur nutrition. Plant J. 33, 651–663. doi: 10.1046/j.1365-313X.2003.01658.x
Hirai, M. Y., Klein, M., Fujikawa, Y., Yano, M., Goodenowe, D. B., Yamazaki, Y., et al. (2005). Elucidation of gene-to-gene and metabolite-to-gene networks in Arabidopsis by integration of metabolomics and transcriptomics. J. Biol. Chem. 280, 25590–25595. doi: 10.1074/jbc.M502332200
Hirai, M. Y., and Saito, K. (2004). Post-genomics approaches for the elucidation of plant adaptive mechanisms to sulphur deficiency. J. Exp. Bot. 55, 1871–1879. doi: 10.1093/jxb/erh184
Hirai, M. Y., Sugiyama, K., Sawada, Y., Tohge, T., Obayashi, T., Suzuki, A., et al. (2007). Omics-based identification of Arabidopsis Myb transcription factors regulating aliphatic glucosinolate biosynthesis. Proc. Natl. Acad. Sci. U.S.A. 104, 6478–6483. doi: 10.1073/pnas.0611629104
Hoefgen, R., and Nikiforova, V. J. (2007). Metabolomics integrated with transcriptomics: assessing systems response to sulfur-deficiency stress. Physiol. Plant. 132, 190–198. doi: 10.1111/j.1399-3054.2007.01012.x
Hooper, C. M., Castleden, I. R., Tanz, S. K., Aryamanesh, N., and Millar, A. H. (2017). SUBA4: the interactive data analysis centre for Arabidopsis subcellular protein locations. Nucleic Acids Res. 45, D1064–D1074. doi: 10.1093/nar/gkw1041
Huang, X.-Y., Chao, D.-Y., Koprivova, A., Danku, J., Wirtz, M., Müller, S., et al. (2016). Nuclear localised MORE SULPHUR ACCUMULATION1 epigenetically regulates sulphur homeostasis in Arabidopsis thaliana. PLoS Genet. 12:e1006298. doi: 10.1371/journal.pgen.1006298
Hubberten, H.-M., Klie, S., Caldana, C., Degenkolbe, T., Willmitzer, L., and Hoefgen, R. (2012). Additional role of O-acetylserine as a sulfur status-independent regulator during plant growth. Plant J. 70, 666–677. doi: 10.1111/j.1365-313X.2012.04905.x
Ishikawa, F., Suga, S., Uemura, T., Sato, M. H., and Maeshima, M. (2005). Novel type aquaporin SIPs are mainly localized to the ER membrane and show cell-specific expression in Arabidopsis thaliana. FEBS Lett. 579, 5814–5820. doi: 10.1016/j.febslet.2005.09.076
Iyer-Pascuzzi, A. S., Jackson, T., Cui, H., Petricka, J. J., Busch, W., Tsukagoshi, H., et al. (2011). Cell identity regulators link development and stress responses in the Arabidopsis root. Dev. Cell 21, 770–782. doi: 10.1016/j.devcel.2011.09.009
Jeong, H., Mason, S. P., Barabási, A.-L., and Oltvai, Z. N. (2001). Lethality and centrality in protein networks. Nature 411, 41–42. doi: 10.1038/35075138
Jiang, Z., Xu, G., Jing, Y., Tang, W., and Lin, R. (2016). Phytochrome B and REVEILLE1/2-mediated signalling controls seed dormancy and germination in Arabidopsis. Nat. Commun. 7:12377. doi: 10.1038/ncomms12377
Kataoka, T., Hayashi, N., Yamaya, T., and Takahashi, H. (2004a). Root-to-shoot transport of sulfate in Arabidopsis. Evidence for the role of SULTR3;5 as a component of low-affinity sulfate transport system in the root vasculature. Plant Physiol. 136, 4198–4204. doi: 10.1104/pp.104.045625
Kataoka, T., Watanabe-Takahashi, A., Hayashi, N., Ohnishi, M., Mimura, T., Buchner, P., et al. (2004b). Vacuolar sulfate transporters are essential determinants controlling internal distribution of sulfate in Arabidopsis. Plant Cell 16, 2693–2704. doi: 10.1105/tpc.104.023960
Katari, M. S., Nowicki, S. D., Aceituno, F. F., Nero, D., Kelfer, J., Thompson, L. P., et al. (2010). VirtualPlant: a software platform to support systems biology research. Plant Physiol. 152, 500–515. doi: 10.1104/pp.109.147025
Kawashima, C. G., Matthewman, C. A., Huang, S., Lee, B.-R., Yoshimoto, N., Koprivova, A., et al. (2011). Interplay of SLIM1 and miR395 in the regulation of sulfate assimilation in Arabidopsis. Plant J. 66, 863–876. doi: 10.1111/j.1365-313X.2011.04547.x
Kawashima, C. G., Yoshimoto, N., Maruyama-Nakashita, A., Tsuchiya, Y. N., Saito, K., Takahashi, H., et al. (2009). Sulphur starvation induces the expression of microRNA-395 and one of its target genes but in different cell types. Plant J. 57, 313–321. doi: 10.1111/j.1365-313X.2008.03690.x
Kong, X. Y., Kissen, R., and Bones, A. M. (2012). Characterization of recombinant nitrile-specifier proteins (NSPs) of Arabidopsis thaliana: dependency on Fe(II) ions and the effect of glucosinolate substrate and reaction conditions. Phytochemistry 84, 7–17. doi: 10.1016/j.phytochem.2012.08.004
Kopriva, S., Calderwood, A., Weckopp, S. C., and Koprivova, A. (2015). Plant sulfur and big data. Plant Sci. 241, 1–10. doi: 10.1016/j.plantsci.2015.09.014
Kopriva, S., Mugford, S. G., Baraniecka, P., Lee, B.-R., Matthewman, C. A., and Koprivova, A. (2012). Control of sulfur partitioning between primary and secondary metabolism in Arabidopsis. Front. Plant Sci. 3:163. doi: 10.3389/fpls.2012.00163
Kopriva, S., and Rennenberg, H. (2004). Control of sulphate assimilation and glutathione synthesis: interaction with N and C metabolism. J. Exp. Bot. 55, 1831–1842. doi: 10.1093/jxb/erh203
Koprivova, A., and Kopriva, S. (2014). Molecular mechanisms of regulation of sulfate assimilation: first steps on a long road. Front. Plant Sci. 5:589. doi: 10.3389/fpls.2014.00589
Koprivova, A., and Kopriva, S. (2016). Sulfation pathways in plants. Chem. Biol. Interact. 259, 23–30. doi: 10.1016/j.cbi.2016.05.021
Krouk, G., Tranchina, D., Lejay, L., Cruikshank, A. A., Shasha, D., Coruzzi, G. M., et al. (2009). A systems approach uncovers restrictions for signal interactions regulating genome-wide responses to nutritional cues in Arabidopsis. PLoS Comput. Biol. 5:e1000326. doi: 10.1371/journal.pcbi.1000326
Lächler, K., Imhof, J., Reichelt, M., Gershenzon, J., and Binder, S. (2015). The cytosolic branched-chain aminotransferases of Arabidopsis thaliana influence methionine supply, salvage and glucosinolate metabolism. Plant Mol. Biol. 88, 119–131. doi: 10.1007/s11103-015-0312-3
Lam, H. M., Hsieh, M. H., and Coruzzi, G. (1998). Reciprocal regulation of distinct asparagine synthetase genes by light and metabolites in Arabidopsis thaliana. Plant J. 16, 345–353. doi: 10.1046/j.1365-313X.1998.00302.x
Lam, H. M., Peng, S. S., and Coruzzi, G. M. (1994). Metabolic regulation of the gene encoding glutamine-dependent asparagine synthetase in Arabidopsis thaliana. Plant Physiol. 106, 1347–1357. doi: 10.1104/pp.106.4.1347
Langfelder, P., Zhang, B., and Horvath, S. (2008). Defining clusters from a hierarchical cluster tree: the dynamic tree cut package for R. Bioinformatics 24, 719–720. doi: 10.1093/bioinformatics/btm563
Lee, B.-R., Koprivova, A., and Kopriva, S. (2011). The key enzyme of sulfate assimilation, adenosine 5′-phosphosulfate reductase, is regulated by HY5 in Arabidopsis. Plant J. 67, 1042–1054. doi: 10.1111/j.1365-313X.2011.04656.x
Leyva-González, M. A., Ibarra-Laclette, E., Cruz-Ramírez, A., and Herrera-Estrella, L. (2012). Functional and transcriptome analysis reveals an acclimatization strategy for abiotic stress tolerance mediated by Arabidopsis NF-YA family members. PLoS One 7:e48138. doi: 10.1371/journal.pone.0048138
Liang, G., Ai, Q., and Yu, D. (2015). Uncovering miRNAs involved in crosstalk between nutrient deficiencies in Arabidopsis. Sci. Rep. 5:11813. doi: 10.1038/srep11813
Liang, G., Yang, F., and Yu, D. (2010). MicroRNA395 mediates regulation of sulfate accumulation and allocation in Arabidopsis thaliana. Plant J. 62, 1046–1057. doi: 10.1111/j.1365-313X.2010.04216.x
Ma, C., and Wang, X. (2012). Application of the gini correlation coefficient to infer regulatory relationships in transcriptome analysis. Plant Physiol. 160, 192–203. doi: 10.1104/pp.112.201962
Maere, S., Heymans, K., and Kuiper, M. (2005). BiNGO: a cytoscape plugin to assess overrepresentation of gene ontology categories in biological networks. Bioinformatics 21, 3448–3449. doi: 10.1093/bioinformatics/bti551
Marchler-Bauer, A., Bo, Y., Han, L., He, J., Lanczycki, C. J., Lu, S., et al. (2017). CDD/SPARCLE: functional classification of proteins via subfamily domain architectures. Nucleic Acids Res. 45, D200–D203. doi: 10.1093/nar/gkw1129
Maruyama-Nakashita, A. (2017). Metabolic changes sustain the plant life in low-sulfur environments. Curr. Opin. Plant Biol. 39, 144–151. doi: 10.1016/j.pbi.2017.06.015
Maruyama-Nakashita, A., Nakamura, Y., Tohge, T., Saito, K., and Takahashi, H. (2006). Arabidopsis SLIM1 is a central transcriptional regulator of plant sulfur response and metabolism. Plant Cell 18, 3235–3251. doi: 10.1105/tpc.106.046458
Maruyama-Nakashita, A., Nakamura, Y., Watanabe-Takahashi, A., Inoue, E., Yamaya, T., and Takahashi, H. (2005). Identification of a novel cis-acting element conferring sulfur deficiency response in Arabidopsis roots. Plant J. 42, 305–314. doi: 10.1111/j.1365-313X.2005.02363.x
Maruyama-Nakashita, A., Nakamura, Y., Yamaya, T., and Takahashi, H. (2004). Regulation of high-affinity sulphate transporters in plants: towards systematic analysis of sulphur signalling and regulation. J. Exp. Bot. 55, 1843–1849. doi: 10.1093/jxb/erh175
Matsui, K., Umemura, Y., and Ohme-Takagi, M. (2008). AtMYBL2, a protein with a single MYB domain, acts as a negative regulator of anthocyanin biosynthesis in Arabidopsis. Plant J. 55, 954–967. doi: 10.1111/j.1365-313X.2008.03565.x
McGrath, S. P., and Zhao, F. J. (1996). Sulphur uptake, yield responses and the interactions between nitrogen and sulphur in winter oilseed rape (Brassica napus). J. Agric. Sci. 126, 53–62. doi: 10.1017/S0021859600088808
McNeill, A. M., Eriksen, J., Bergstrom, L., Smith, K. A., Marstorp, H., Kirchmann, H., et al. (2005). Nitrogen and sulphur management: challenges for organic sources in temperate agricultural systems. Soil Use Manag. 21, 82–93. doi: 10.1111/j.1475-2743.2005.tb00412.x
Mostafa, I., Zhu, N., Yoo, M.-J., Balmant, K. M., Misra, B. B., Dufresne, C., et al. (2016). New nodes and edges in the glucosinolate molecular network revealed by proteomics and metabolomics of Arabidopsis myb28/29 and cyp79B2/B3 glucosinolate mutants. J. Proteomics 138, 1–19. doi: 10.1016/J.JPROT.2016.02.012
Muller, B., Fastner, A., Karmann, J., Mansch, V., Hoffmann, T., Schwab, W., et al. (2015). Amino acid export in developing arabidopsis seeds depends on UmamiT facilitators. Curr. Biol. 25, 3126–3131. doi: 10.1016/j.cub.2015.10.038
Nardini, M., Gnesutta, N., Donati, G., Gatta, R., Forni, C., Fossati, A., et al. (2013). Sequence-specific transcription factor NF-Y displays histone-like DNA binding and H2B-like ubiquitination. Cell 152, 132–143. doi: 10.1016/j.cell.2012.11.047
Nikiforova, V., Freitag, J., Kempa, S., Adamik, M., Hesse, H., and Hoefgen, R. (2003). Transcriptome analysis of sulfur depletion in Arabidopsis thaliana: interlacing of biosynthetic pathways provides response specificity. Plant J. 33, 633–650. doi: 10.1046/j.1365-313X.2003.01657.x
Nikiforova, V. J., Gakière, B., Kempa, S., Adamik, M., Willmitzer, L., Hesse, H., et al. (2004). Towards dissecting nutrient metabolism in plants: a systems biology case study on sulphur metabolism. J. Exp. Bot. 55, 1861–1870. doi: 10.1093/jxb/erh177
Nikiforova, V. J., Kopka, J., Tolstikov, V., Fiehn, O., Hopkins, L., Hawkesford, M. J., et al. (2005). Systems rebalancing of metabolism in response to sulfur deprivation, as revealed by metabolome analysis of Arabidopsis plants. Plant Physiol. 138, 304–318. doi: 10.1104/pp.104.053793
Obayashi, T., Aoki, Y., Tadaka, S., Kagaya, Y., and Kinoshita, K. (2017). ATTED-II in 2018: a plant coexpression database based on investigation of statistical property of the mutual rank index. Plant Cell Physiol. 59:e3. doi: 10.1093/pcp/pcx191
Obertello, M., Krouk, G., Katari, M. S., Runko, S. J., and Coruzzi, G. M. (2010). Modeling the global effect of the basic-leucine zipper transcription factor 1 (bZIP1) on nitrogen and light regulation in Arabidopsis. BMC Syst. Biol. 4:111. doi: 10.1186/1752-0509-4-111
Okamoto, M., Kumar, A., Li, W., Wang, Y., Siddiqi, M. Y., Crawford, N. M., et al. (2006). High-affinity nitrate transport in roots of Arabidopsis depends on expression of the NAR2-like gene AtNRT3.1. Plant Physiol. 140, 1036–1046. doi: 10.1104/pp.105.074385
Park, M.-J., Kwon, Y.-J., Gil, K.-E., and Park, C.-M. (2016). LATE ELONGATED HYPOCOTYL regulates photoperiodic flowering via the circadian clock in Arabidopsis. BMC Plant Biol. 16:114. doi: 10.1186/s12870-016-0810-8
Paulose, B., Chhikara, S., Coomey, J., Jung, H.-I., Vatamaniuk, O., and Dhankher, O. P. (2013). A γ-glutamyl cyclotransferase protects Arabidopsis plants from heavy metal toxicity by recycling glutamate to maintain glutathione homeostasis. Plant Cell 25, 4580–4595. doi: 10.1105/tpc.113.111815
Petroni, K., Kumimoto, R. W., Gnesutta, N., Calvenzani, V., Fornari, M., Tonelli, C., et al. (2012). The promiscuous life of plant NUCLEAR FACTOR Y transcription factors. Plant Cell 24, 4777–4792. doi: 10.1105/tpc.112.105734
Plett, D., Baumann, U., Schreiber, A. W., Holtham, L., Kalashyan, E., Toubia, J., et al. (2016). Maize maintains growth in response to decreased nitrate supply through a highly dynamic and developmental stage-specific transcriptional response. Plant Biotechnol. J. 14, 342–353. doi: 10.1111/pbi.12388
Pomeranz, M. C., Hah, C., Lin, P.-C., Kang, S. G., Finer, J. J., Blackshear, P. J., et al. (2010). The Arabidopsis tandem zinc finger protein AtTZF1 traffics between the nucleus and cytoplasmic foci and binds both DNA and RNA. Plant Physiol. 152, 151–165. doi: 10.1104/pp.109.145656
Ramon, M., De Smet, I., Vandesteene, L., Naudts, M., Leyman, B., Van Dijck, P., et al. (2009). Extensive expression regulation and lack of heterologous enzymatic activity of the Class II trehalose metabolism proteins from Arabidopsis thaliana. Plant Cell Environ. 32, 1015–1032. doi: 10.1111/j.1365-3040.2009.01985.x
Rawat, R., Schwartz, J., Jones, M. A., Sairanen, I., Cheng, Y., Andersson, C. R., et al. (2009). REVEILLE1, a Myb-like transcription factor, integrates the circadian clock and auxin pathways. Proc. Natl. Acad. Sci. U.S.A. 106, 16883–16888. doi: 10.1073/pnas.0813035106
Rest, J. S., Wilkins, O., Yuan, W., Purugganan, M. D., and Gurevitch, J. (2016). Meta-analysis and meta-regression of transcriptomic responses to water stress in Arabidopsis. Plant J. 85, 548–560. doi: 10.1111/tpj.13124
Reuveny, Z., Dougall, D. K., and Trinity, P. M. (1980). Regulatory coupling of nitrate and sulfate assimilation pathways in cultured tobacco cells. Proc. Natl. Acad. Sci. U.S.A. 77, 6670–6672. doi: 10.1073/pnas.77.11.6670
Romero, L. C., Aroca, M. Á, Laureano-Marín, A. M., Moreno, I., García, I., and Gotor, C. (2014). Cysteine and cysteine-related signaling pathways in Arabidopsis thaliana. Mol. Plant 7, 264–276. doi: 10.1093/mp/sst168
Romero-Campero, F. J., Perez-Hurtado, I., Lucas-Reina, E., Romero, J. M., and Valverde, F. (2016). ChlamyNET: a Chlamydomonas gene co-expression network reveals global properties of the transcriptome and the early setup of key co-expression patterns in the green lineage. BMC Genomics 17:227. doi: 10.1186/s12864-016-2564-y
Rouached, H., Wirtz, M., Alary, R., Hell, R., Arpat, A. B., Davidian, J.-C., et al. (2008). Differential regulation of the expression of two high-affinity sulfate transporters, SULTR1.1 and SULTR1.2, in Arabidopsis. Plant Physiol. 147, 897–911. doi: 10.1104/pp.108.118612
Sato, T., Maekawa, S., Yasuda, S., Sonoda, Y., Katoh, E., Ichikawa, T., et al. (2009). CNI1/ATL31, a RING-type ubiquitin ligase that functions in the carbon/nitrogen response for growth phase transition in Arabidopsis seedlings. Plant J. 60, 852–864. doi: 10.1111/j.1365-313X.2009.04006.x
Schuster, J., Knill, T., Reichelt, M., Gershenzon, J., and Binder, S. (2006). BRANCHED-CHAIN AMINOTRANSFERASE4 is part of the chain elongation pathway in the biosynthesis of methionine-derived glucosinolates in Arabidopsis. Plant Cell 18, 2664–2679. doi: 10.1105/tpc.105.039339
Setya, A., Murillo, M., and Leustek, T. (1996). Sulfate reduction in higher plants: molecular evidence for a novel 5’-adenylylsulfate reductase. Proc. Natl. Acad. Sci. U.S.A. 93, 13383–13388. doi: 10.1073/pnas.93.23.13383
Shannon, P., Markiel, A., Ozier, O., Baliga, N. S., Wang, J. T., Ramage, D., et al. (2003). Cytoscape: a software environment for integrated models of biomolecular interaction networks. Genome Res. 13, 2498–2504. doi: 10.1101/gr.1239303
Sirko, A., Wawrzyńska, A., Rodríguez, M. C., and Sêktas, P. (2015). The family of LSU-like proteins. Front. Plant Sci. 5:774. doi: 10.3389/fpls.2014.00774
Smyth, G. K. (2004). Linear models and empirical bayes methods for assessing differential expression in microarray experiments. Stat. Appl. Genet. Mol. Biol. 3, 1–25. doi: 10.2202/1544-6115.1027
Sønderby, I. E., Geu-Flores, F., and Halkier, B. A. (2010). Biosynthesis of glucosinolates – gene discovery and beyond. Trends Plant Sci. 15, 283–290. doi: 10.1016/j.tplants.2010.02.005
Supek, F., Bošnjak, M., Škunca, N., and Šmuc, T. (2011). REVIGO summarizes and visualizes long lists of gene ontology terms. PLoS One 6:e21800. doi: 10.1371/journal.pone.0021800
Takahashi, H. (2010). Regulation of sulfate transport and assimilation in plants. Int. Rev. Cell Mol. Biol. 281, 129–159. doi: 10.1016/S1937-6448(10)81004-4
Takahashi, H., Braby, C. E., and Grossman, A. R. (2001). Sulfur economy and cell wall biosynthesis during sulfur limitation of Chlamydomonas reinhardtii. Plant Physiol. 127, 665–673. doi: 10.1104/pp.010257
Takahashi, H., Kopriva, S., Giordano, M., Saito, K., and Hell, R. (2011). Sulfur assimilation in photosynthetic organisms: molecular functions and regulations of transporters and assimilatory enzymes. Annu. Rev. Plant Biol. 62, 157–184. doi: 10.1146/annurev-arplant-042110-103921
Takahashi, H., Watanabe-Takahashi, A., Smith, F. W., Blake-Kalff, M., Hawkesford, M. J., and Saito, K. (2000). The roles of three functional sulphate transporters involved in uptake and translocation of sulphate in Arabidopsis thaliana. Plant J. 23, 171–182. doi: 10.1046/j.1365-313X.2000.00768.x
Tseng, G. C., Ghosh, D., and Feingold, E. (2012). Comprehensive literature review and statistical considerations for microarray meta-analysis. Nucleic Acids Res. 40, 3785–3799. doi: 10.1093/nar/gkr1265
Usadel, B., Blasing, O. E., Gibon, Y., Retzlaff, K., Hohne, M., Gunther, M., et al. (2008). Global transcript levels respond to small changes of the carbon status during progressive exhaustion of carbohydrates in Arabidopsis rosettes. Plant Physiol. 146, 1834–1861. doi: 10.1104/pp.107.115592
van Dam, S., Võsa, U., van der Graaf, A., Franke, L., and de Magalhães, J. P. (2017). Gene co-expression analysis for functional classification and gene–disease predictions. Brief. Bioinform. doi: 10.1093/bib/bbw139 [Epub ahead of print].
Vieira Dos Santos, C., Cuiné, S., Rouhier, N., and Rey, P. (2005). The Arabidopsis plastidic methionine sulfoxide reductase B proteins. Sequence and activity characteristics, comparison of the expression with plastidic methionine sulfoxide reductase A, and induction by photooxidative stress. Plant Physiol. 138, 909–922. doi: 10.1104/pp.105.062430
Wagner, U., Edwards, R., Dixon, D. P., and Mauch, F. (2002). Probing the diversity of the Arabidopsis glutathione S-transferase gene family. Plant Mol. Biol. 49, 515–532. doi: 10.1023/A:1015557300450
Wang, R., and Crawford, N. M. (1996). Genetic identification of a gene involved in constitutive, high-affinity nitrate transport in higher plants. Proc. Natl. Acad. Sci. U.S.A. 93, 9297–9301. doi: 10.1073/pnas.93.17.9297
Weltmeier, F., Rahmani, F., Ehlert, A., Dietrich, K., Schütze, K., Wang, X., et al. (2009). Expression patterns within the Arabidopsis C/S1 bZIP transcription factor network: availability of heterodimerization partners controls gene expression during stress response and development. Plant Mol. Biol. 69, 107–119. doi: 10.1007/s11103-008-9410-9
Woo, J., MacPherson, C., Liu, J., Wang, H., Kiba, T., Hannah, M. A., et al. (2012). The response and recovery of the Arabidopsis thaliana transcriptome to phosphate starvation. BMC Plant Biol. 12:62. doi: 10.1186/1471-2229-12-62
Yaffe, H., Buxdorf, K., Shapira, I., Ein-Gedi, S., Moyal-Ben Zvi, M., Fridman, E., et al. (2012). LogSpin: a simple, economical and fast method for RNA isolation from infected or healthy plants and other eukaryotic tissues. BMC Res. Notes 5:45. doi: 10.1186/1756-0500-5-45
Yoshimoto, N., Takahashi, H., Smith, F. W., Yamaya, T., and Saito, K. (2002). Two distinct high-affinity sulfate transporters with different inducibilities mediate uptake of sulfate in Arabidopsis roots. Plant J. 29, 465–473. doi: 10.1046/j.0960-7412.2001.01231.x
Yoshioka, Y., Kurei, S., and Machida, Y. (2001). Identification of a monofunctional aspartate kinase gene of Arabidopsis thaliana with spatially and temporally regulated expression. Genes Genet. Syst. 76, 189–198. doi: 10.1266/ggs.76.189
Zhang, B., Pasini, R., Dan, H., Joshi, N., Zhao, Y., Leustek, T., et al. (2014). Aberrant gene expression in the Arabidopsis SULTR1;2 mutants suggests a possible regulatory role for this sulfate transporter in response to sulfur nutrient status. Plant J. 77, 185–197. doi: 10.1111/tpj.12376
Zhang, J., Sun, X., Zhang, Z., Ni, Y., Zhang, Q., Liang, X., et al. (2011). Metabolite profiling of Arabidopsis seedlings in response to exogenous sinalbin and sulfur deficiency. Phytochemistry 72, 1767–1778. doi: 10.1016/j.phytochem.2011.06.002
Zhang, M., Hu, X., Zhu, M., Xu, M., and Wang, L. (2017). Transcription factors NF-YA2 and NF-YA10 regulate leaf growth via auxin signaling in Arabidopsis. Sci. Rep. 7:1395. doi: 10.1038/s41598-017-01475-z
Zhang, Q., Wang, J., Deng, F., Yan, Z., Xia, Y., Wang, Z., et al. (2015). TqPCR: a touchdown qPCR assay with significantly improved detection sensitivity and amplification efficiency of SYBR green qPCR. PLoS One 10:e0132666. doi: 10.1371/journal.pone.0132666
Zhang, X., Chen, Y., Wang, Z.-Y., Chen, Z., Gu, H., and Qu, L.-J. (2007). Constitutive expression of CIR1 (RVE2) affects several circadian-regulated processes and seed germination in Arabidopsis. Plant J. 51, 512–525. doi: 10.1111/j.1365-313X.2007.03156.x
Zhao, H., Wu, D., Kong, F., Lin, K., Zhang, H., and Li, G. (2017). The Arabidopsis thaliana nuclear factor Y transcription factors. Front. Plant Sci. 7:2045. doi: 10.3389/fpls.2016.02045
Zhao, S., and Fernald, R. D. (2005). Comprehensive algorithm for quantitative real-time polymerase chain reaction. J. Comput. Biol. 12, 1047–1064. doi: 10.1089/cmb.2005.12.1047
Zimmermann, P., Laule, O., Schmitz, J., Hruz, T., Bleuler, S., and Gruissem, W. (2008). Genevestigator transcriptome meta-analysis and biomarker search using rice and barley gene expression databases. Mol. Plant 1, 851–857. doi: 10.1093/mp/ssn048
Keywords: gene co-expression analysis, sulfur, sulfate assimilation, microarray analysis, network analysis, transcription factors
Citation: Henríquez-Valencia C, Arenas-M A, Medina J and Canales J (2018) Integrative Transcriptomic Analysis Uncovers Novel Gene Modules That Underlie the Sulfate Response in Arabidopsis thaliana. Front. Plant Sci. 9:470. doi: 10.3389/fpls.2018.00470
Received: 05 January 2018; Accepted: 26 March 2018;
Published: 10 April 2018.
Edited by:
Stanislav Kopriva, Universität zu Köln, GermanyReviewed by:
Masami Yokota Hirai, RIKEN Center for Sustainable Resource Science (CSRS), JapanRainer Hoefgen, Max Planck Institute of Molecular Plant Physiology (MPG), Germany
Copyright © 2018 Henríquez-Valencia, Arenas-M, Medina and Canales. This is an open-access article distributed under the terms of the Creative Commons Attribution License (CC BY). The use, distribution or reproduction in other forums is permitted, provided the original author(s) and the copyright owner are credited and that the original publication in this journal is cited, in accordance with accepted academic practice. No use, distribution or reproduction is permitted which does not comply with these terms.
*Correspondence: Javier Canales, amF2aWVyLmNhbmFsZXNAdWFjaC5jbA==
†These authors have contributed equally to this work.