 Ya-ying Wang1,2†
 Yu-qiu Li1,2,3†
 Hong-yan Wu1Bo Hu1,2
 Jia-jia Zheng1,2Hong Zhai1Shi-xiang Lv1,4Xin-lei Liu4Xin Chen5Hong-mei Qiu3
 Jiayin Yang6Chun-mei Zong7De-zhi Han8
 Zi-xiang Wen9
 De-chun Wang9
 Zheng-jun Xia1*
- 1Key Laboratory of Soybean Molecular Design Breeding, Northeast Institute of Geography and Agroecology, Chinese Academy of Sciences, Harbin, China
- 2University of Chinese Academy of Sciences, Beijing, China
- 3Soybean Research Institute, Jilin Academy of Agricultural Sciences, Changchun, China
- 4Heilongjiang Academy of Agricultural Sciences, Harbin, China
- 5Jiangsu Academy of Agricultural Sciences, Nanjing, China
- 6Huaiyin Institute of Agricultural Sciences in Xuhuai Region of Jiangsu Province, Huaian, China
- 7Mudanjiang Branch of Heilongjiang Academy of Agricultural Sciences, Mudanjiang, China
- 8Heihe Branch of Heilongjiang Academy of Agricultural Sciences, Heihe, China
- 9Department of Plant, Soil and Microbial Sciences, Michigan State University, East Lansing, MI, United States
Soybean was domesticated about 5,000 to 6,000 years ago in China. Although genotyping technologies such as genotyping by sequencing (GBS) and high-density array are available, it is convenient and economical to genotype cultivars or populations using medium-density SNP array in genetic study as well as in molecular breeding. In this study, 235 cultivars, collected from China, Japan, USA, Canada and some other countries, were genotyped using SoySNP8k iSelect BeadChip with 7,189 single nucleotide polymorphisms (SNPs). In total, 4,471 polymorphic SNP markers were used to analyze population structure and perform genome-wide association study (GWAS). The most likely K value was 7, indicating this population can be divided into 7 subpopulations, which is well in accordance with the geographic origins of cultivars or accession studied. The LD decay rate was estimated at 184 kb, where r2 dropped to half of its maximum value (0.205). GWAS using FarmCPU detected a stable quantitative trait nucleotide (QTN) for hilum color and seed color, which is consistent with the known loci or genes. Although no universal QTNs for flowering time and maturity were identified across all environments, a total of 30 consistent QTNs were detected for flowering time (R1) or maturity (R7 and R8) on 16 chromosomes, most of them were corresponding to known E1 to E4 genes or QTL region reported in SoyBase (soybase.org). Of 16 consistent QTNs for protein and oil contents, 11 QTNs were detected having antagonistic effects on protein and oil content, while 4 QTNs soly for oil content, and one QTN soly for protein content. The information gained in this study demonstrated that the usefulness of the medium-density SNP array in genotyping for genetic study and molecular breeding.
Introduction
Soybean [Glycine max (L.) Merr.] is one of important crops worldwide, providing a sustainable source of high-quality protein feed and vegetable oil. Soybean was domesticated in China more than 5,000–6,000 years ago. Soybean can grow across a wide range of latitudes from 50°N to 35°S (Norman, 1978). Soybean yield related traits such as flowering, maturity and protein/oil contents are quantitatively inherited traits controlled by internal and external factors (Xia et al., 2013).
Each soybean cultivar adapts to a limited latitudinal region for its maximal yield since soybean is a short day plants with photoperiod sensitivity (Xia et al., 2012b). Flowering time and maturity are important agronomic traits related to soybean adaptability and productivity. More than 200 loci or genes have been mapped to control flowering time in soybean (SoyBase, www.soybase.org). Previous studies identified eleven major-effect loci affecting flowering and maturity in soybean, which have been designated as E1 to E10, and the J locus for “long juvenile period” (Bernard, 1971; Buzzell, 1971; Buzzell and Voldeng, 1980; McBlain and Bernard, 1987; Ray et al., 1995; Bonato and Vello, 1999; Cober and Voldeng, 2001; Cober et al., 2010; Kong et al., 2014; Samanfar et al., 2017). Of these genes, E1, E2, E3, E4, E6, E9, E10, and J have been cloned and functionally characterized (Liu et al., 2008; Watanabe et al., 2009, 2011; Xia et al., 2012a; Zhai et al., 2014a; Zhao et al., 2016; Lu et al., 2017; Samanfar et al., 2017). E1 encodes a nuclear-localized B3 domain-containing protein, suppresses both GmFT2a and GmFT5a expression, two FT orthologs promoting early flowering in soybean (Xia et al., 2012a). E1 expression is suppressed in short day, which is regarded as the main factor for soybean being a short day plant (Xia et al., 2012a; Zhai et al., 2015; Zhang et al., 2016). E2 encodes a homolog of GIGANTEA, controls soybean flowering through regulation of GmFT2a expression but not GmFT5a (Watanabe et al., 2011). E3 and E4 are Phytochrome A (PHYA) genes of GmPHYA3 and GmPHYA2 (Liu et al., 2008; Watanabe et al., 2009). Various allelic combinations of E1, E3 or E4 lead to various photoperiod insensitivity, enabling soybean to adapt to high-latitude environments (Zhai et al., 2014b). J loci is identified as the ortholog of Arabidopsis thaliana EARLY FLOWERING 3 (ELF3), which control flowering time through regulation of E1 expression (Lu et al., 2017). Higher E1 expression in short day enables soybean to grow in the area of lower latitude near equator. E9 and E10 are GmFT2a and GmFT4, FT homolog of Arabidopsis (Zhai et al., 2014a; Zhao et al., 2016). Apart from negative report on existence of E5 loci (Dissanayaka et al., 2016), molecular identities of E7 and E8 are still unknown. Many quantitative trait loci (QTL) or quantitative trait nucleotide (QTN) related to soybean flowering time (first flowering, R1) and maturity have also been documented at SoyBase (http://soybase.org). Many genes or QTL might regulate flowering time through regulation of the expression of the E1 gene (Zhai et al., 2015).
Soybean seed compositions traits such as protein and oil contents are important quality traits in breeding programs. Patil et al. (2017) reviewed molecular mapping and genomic of soybean seed protein, and concluded genetic improvement of soybean protein meal is a complex process because of negative correlation with oil, yield, and the temperature (Patil et al., 2017). Major QTL were repeated detected on chromosome (20 (LG I) and 15 (LG E) (Patil et al., 2017). Leamy et al. (2017) studied seed composition traits in wild soybean (Glycine soja) and found 29 SNPs located on ten different chromosomes that are significantly associated with the seven seed composition traits, of which eight SNPs co-localized with QTLs previously uncovered in linkage or association mapping studies conducted with cultivated soybean samples (Leamy et al., 2017). Zhou et al. (2015) mapped major QTN for protein on chromosome 13, 3, 17, 12, 11, and 15 using a 302 accessions (Zhou et al., 2015). More than 100 quantitative trait loci (QTLs) for soybean oil content have been documented at SoyBase (https://www.soybase.org). Cao et al. (2017) found 8 QTLs explained a range of phenotypic variance from 6.3 to 26.3% using RIL population, and qOil-5-1, qOil-10-1, and qOil-14-1 were detected in different environments (Cao et al., 2017). And qOil-5-1 was also detected using natural population and further localized to a linkage disequilibrium block region of approximately 440 kb (Zhang et al., 2017). WRINKLED1(WRI1), LEAFY COTYLEDON1 (LEC1), and LEC2 are involved in the regulatory pathways modulating seed oil content in Arabidopsis. However, their homologs have been modified in the palaeopolyploid soybean, each exhibiting similar intensities of purifying selection to their respective duplicates since these pairs were formed by a 13 mya (million years ago) whole-genome duplication (WGD) event (Zhang et al., 2017).
Recently, researchers have been applied GWAS in soybean (Bandillo et al., 2015; Wen et al., 2015; Zhang et al., 2015, 2016; Zhou et al., 2015; Contreras-Soto et al., 2017; Fang et al., 2017). Zhang et al. (2015) revealed that genetic loci underlying some agronomically important traits, such as days to flowering, days to maturity, duration of flowering-to-maturity, and plant height in early maturity soybean (Zhang et al., 2015). The ability of GWAS to capture one trait often depends on the frequency of the accessions with contrast phenotypic value in the population being investigated. Recently, as the great advance in sequencing technology, genotyping by sequencing (GBS) has been a choice over other genotyping method, SNP array and traditional SSR markers.
In comparison of traditional linage analysis, genome-wide association study (GWAS) takes advantage of more historic recombination events that have occurred within natural populations. GWAS has been widely applied to crop plants such as maize (Tian et al., 2011), rice (Huang et al., 2010; Ma et al., 2016). However, in rice, recently studies demonstrates the power of GWAS in combination of biparental association mapping and fine-mapping in dissect agronomic important trait (Huang et al., 2010; Ma et al., 2016).
In this study, we genotyped 235 cultivars using Illumina SoySNP8k iSelect BeadChip; and 4471 core SNP markers were selected. A relatively complex population structure (K = 7) was revealed. GWAS were performed to identify the QTN associated with flowering time and the protein/oil contents using FarmCPU. More than 30 QTN were identified under multiple environments for flowering time and maturity; while 16 consistent QTNs were detected for protein and oil contents.
Materials and Methods
Cultivars and Growth Condition
A set of 235 cultivars collected from China, Japan, USA, and Canada were mainly obtained from the Gene Resource Center of Jilin Academy of Agricultural Sciences, China. The origin and other traits for these cultivars are listed in Table S1.
Phenotypic Observation
Soybean accessions were evaluated for photoperiodic responses at six geographic locations: (1), Harbin (hereafter termed as HRB): Research field at the Campus of Northeast Institute of Geography and Agroecology, Harbin, Heilongjiang (45°70′N, 126°64′E); (2), Mudanjiang (hereafter termed as MDJ): Mudanjiang Research Station, Heilongjiang Academy of Agricultural Science (44°42′N, 129°52′E); (3) Gongzhuling (hereafter termed as GZL): Gongzhuling Research Station, Jilin Academy of Agricultural Science, Gongzhuling, Jilin (43°53′N, 124°84′E); (4) Jinan (JN): Campus of Shandong Normal University, Jinan, Shandong (36°66′N,117° 17′E); (5) Huaian (hereafter termed as HA): Huaiyin Research Station, Jiangsu Academy of Agricultural Science, Huaian, Jiangsu (33°57′N, 119°04′E); (6) Nanjing (hereafter termed as NJ): Luhe Research Station, Jiangsu Academy of Agricultural Science, Nanjing, Jiangsu (32°31′N, 118°82′E). At least 15 plants for each cultivar or accession per geographic location were grown in a single row with 20 cm apart for phenotypic evaluation. Days from planting to flowering (R1) and maturity (R7 and R8) were recorded according to Fehr's description (Fehr et al., 1971). R1 refers the beginning of bloom (the opening of the first flower at any node on the main stem). R7 represents the beginning of maturity (one normal pod on the main stem has reached its mature pod color, normally brown or tan); R8 stands for full maturity (95 percent of the pods having reached their mature pod color). For a given cultivar, each specific R stage is defined only when at least 50% of individual plants reached that stage.
Seed were harvested upon maturity. In HRB, GZL, MDJ locations, cultivars that did not reach mature stage (R8) were precluded for maturity and protein/oil content.
Seed coat or hilum color were classified into four groups and coded as follows: (1) yellow or yellowish; (2) green or light brown; (3) brown; (4) black. Seed-weight (100-seedweight) was determined by weighing 3 different set of randomly selected 100 seeds for each cultivar or accession. Seed protein and oil contents of cultivars were measured using MATRIX-I FT-NIR spectrometer (Bruker). The protein or oil contents were measured three times using different bulk seeds of a given cultivar.
The heritability estimates were calculated using variance components obtained by lme4 of R package (Fehr, 1987).
Genotyping With SNP Markers
DNA was extracted from fresh leaves using the hexadecyltrimethylammonium bromide (CTAB) method with slight modification (Murray and Thompson, 1980; Xia et al., 2007). Due to availability of financial budget, cultivars were divided into two batches (95 cultivars and 140 cultivars) to proceed genotyping. Genotyping using Illumina SoySNP8k iSelect BeadChip (Akond et al., 2013; Yang et al., 2017), which contained a total of 7,189 SNPs and was specifically manufactured by Infinium HD Ultra. SNP genotyping was performed with the Illumina Iscan platform (Illumina, Inc., San Diego, CA). A series of procedures, such as incubation, DNA amplification, preparation of bead assay, hybridization of samples for the bead assay, extension, staining of samples, and imaging of the bead assay, were conducted following previously reported methods (Song et al., 2013). The SNP alleles were called with the Genome Studio Genotyping module (Illumina, Inc.) (Song et al., 2013), and SNP data is available at ftp://159.226.208.134/public/SNP_data.zip (Data Sheet 1).
Population Structure Analysis and GWAS
Population structure analysis was performed using STRUCTURE (Pritchard et al., 2000) and to choose the appropriate number of inferred clusters to model the data, 5 independent runs were performed for each K cluster (2 < K < 13, the length of the burn-in is 10,000, the length of MCMC(Markov chain Monte Carlo) is 10,000). After several attempts, we found that our parameter set was sufficient, longer length of burn-in and MCMC did not change the result significantly. Furthermore, population structure was assessed for K values ranging from 2 to 13 on the entire panel using high quality SNPs. The calculation method of STRUCTURE is based on the Bayesian model. For the simulation result of each K value, STRUCTURE will correspondingly produce the log maximum likelihood value, “LnP(D).” As LnP(D) increases, the K value is closer to the real case. The simulation result with largest LnP(D) and smallest K value is the optimal result (Evanno et al., 2005). The neighbor-joining tree was analyzed using the TASSEL (Version 5.2.38) (Bradbury et al., 2007).
By analyzing r2 value of all pairs of SNPs located within 1 Mb of physical distance, the LD decay trend was found following the regression of negative natural logarithm. Heterozygosis, linkage disequilibrium decade, and kinship plot were generated using GAPIT (Lipka et al., 2012) with default parameters. For kinship plot, a heat map of the values in the values in the kinship matrix is created. Kinship matrix was using the VanRaden kinship algorithm (Tang et al., 2016).
GWAS was conducted the Fixed and random model Circulating Probability Unification (FarmCPU; Liu X. L. et al., 2016) with Bonferroni-corrected threshold with 0.01. This recently developed model selection algorithm takes into account the confounding problem between covariates and test marker by using both Fixed Effect Model (FEM) and a Random Effect Model (REM) (Arora et al., 2017). The first three principal components calculated using GAPIT were used as covariates. The quantile–quantile (Q–Q) plot was used for assessing how fit the model was to account for population structure.
Result and Discussion
Polymorphic SNPs Among the Tested Accessions
Of total 5,039 polymorphic SNP makers, 4,961 were mapped into 20 chromosome (Chr) and 31 scaffolds. Apart from unmapped 78 markers, 4,930 SNP markers were successfully mapped onto 20 chromosomes of the soybean genome (Gmax_275_Wm82.a2.v1; http://phytozome.jgi.doe.gov/pz/portal.html#!info?alias=Org_Gmax) using the stand-alone BLAST applications (BLAST+) (ftp://ftp.ncbi.nlm.nih.gov/blast/executables/blast+/LATEST) (Data Sheet 1, ftp://159.226.208.134/public/SNP_data.zip). In order to delimit the influence of batch specific or biased SNP markers on GWAS and population structure analysis, we deleted 459 batch specific or biased SNPs. The unbiased SNP was defined as the frequency of two homogenous nucleotide identities (e.g., AA, GG, or AG) at a given locus in a batch was 0.85 or higher. An unbiased marker having the same two nucleotide identities in two batches were kept for further analysis. According to this threshold of 0.85, 4,471 polymorphic SNP markers were enclosed for population structure and GWAS analysis (Data Sheet 1, ftp://159.226.208.134/public/SNP_data.zip).
Rare SNPs other than two majority nucleotide identities were treated as unknown. Heterozygosis was calculated for both individuals and makers (Figure S1A). By analyzing r2 value of all pairs of SNPs located within 1 Mb of physical distance, the LD decay trend was found following the regression of negative natural logarithm (Figure 1D). The LD decay rate was estimated at 184 kb, where r2 drop to half of its maximum value (0.205). Also this trend was confirmed using GAPIT (Figure S1B). This LD rate calculated is well consistent with previous studies (Zhang et al., 2015; Song et al., 2016).
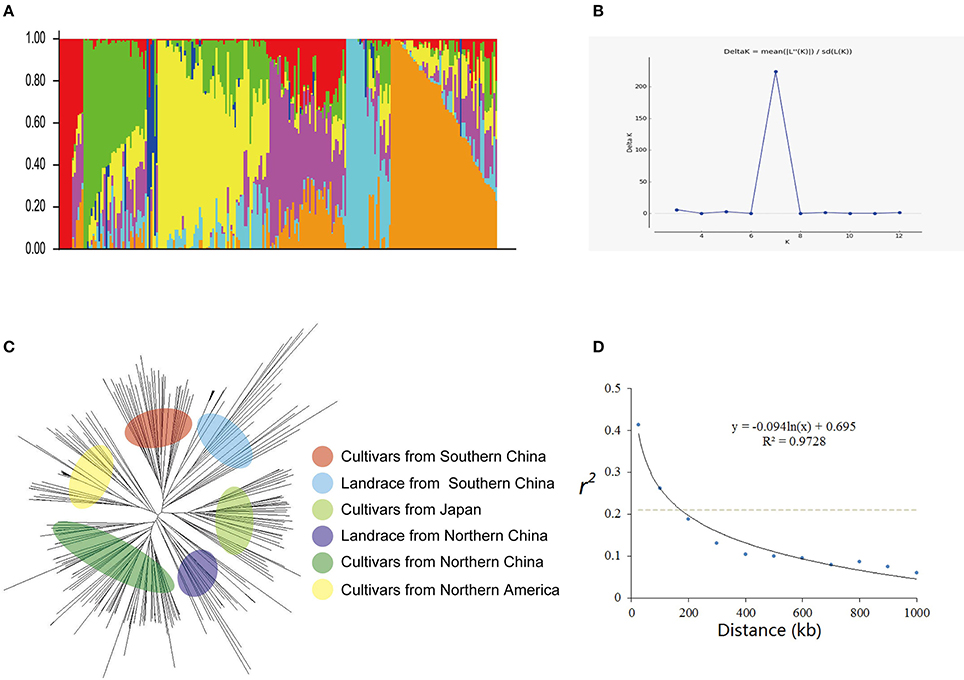
Figure 1. Genetic diversity and population structure of 235 soybean cultivars or accessions. (A) Population structure of 235 cultivars at K = 7. Each cultivar is represented by a single vertical line and color represents one cluster. (B) Estimated Delta K(probability of the data) calculated for K ranging from 2 to 12. (C) Phylogenetic tree constructed using neighbor-joining method. (D) Average linkage disequilibrium (LD) decay rate in the soybean genome. The mean LD decay rate was estimated as squared correlation coefficient (r2) using all pairs of SNPs located within 1 Mb of physical distance in a population of 235 soybean germplasm accessions. The dashed line in gray indicates the position where r2 dropped to half of its maximum value.
Population Structures
Two hundred thirty five cultivars were originally obtained from different geographic origins, e.g., different latitudinal regions of China, Japan, USA. Apart from 5 landraces, the majority of set of germplasms are modern cultivars (Table S1). According to the population structure, the most likely value of K was 7 and such a portioning of the population was consistent with the significant delta K value (Figures 1A,B). Moreover, this result is also well in accordance with the neighbor- joining tree (Figure 1A). All cultivars are classified into 7 subgroups, which are generally in accordance with their geographic origins, Japan, Northern America, central China, Huang-huai region China, Northern area China, landraces (wild soybean) (Figure 1). This classification was also supported by the VanRaden kinship algorithm (Figure 2).
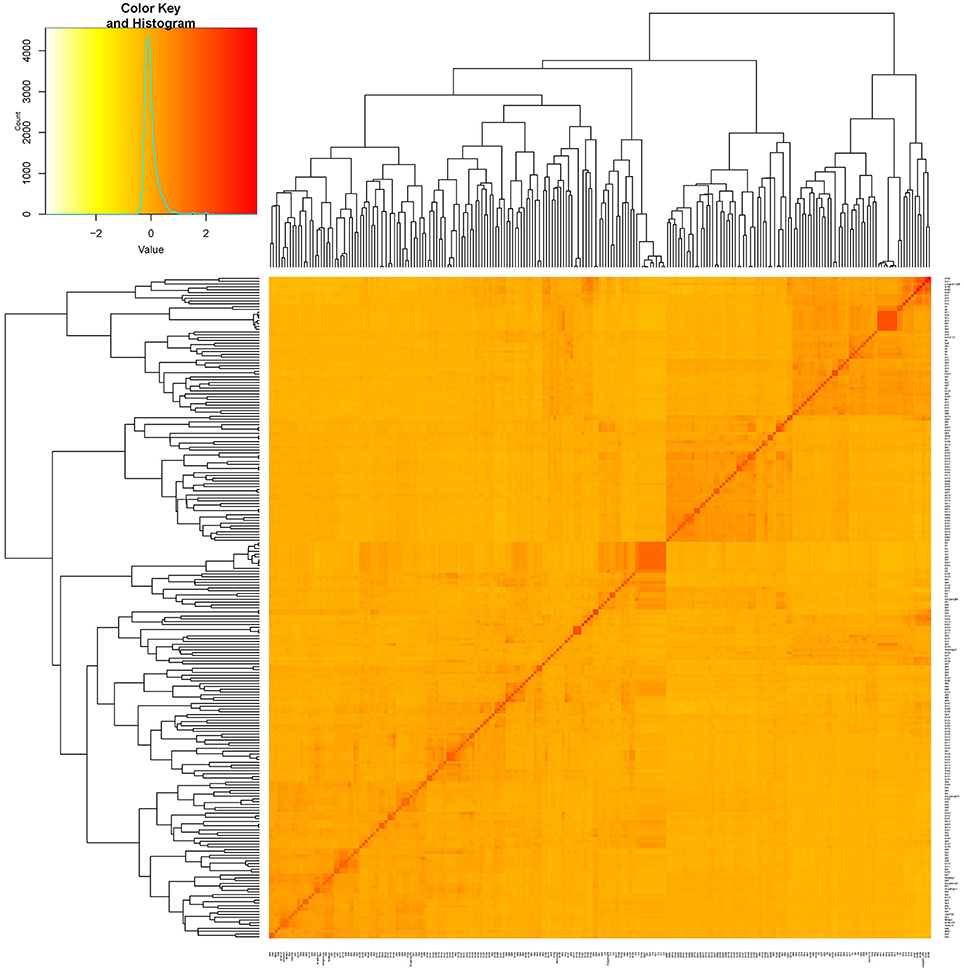
Figure 2. Kinship plot of 235 cultivars. The heat map of the values in the values in the kinship matrix was created using GAPIT (version 2).
In this study, a relatively complex population structure (K = 7) was revealed in comparison of previous reports in which population structures (K = 2, 4, 9) were disclosed (Sonah et al., 2015; Liu Z. X. et al., 2016; Fang et al., 2017). After eliminating batch specific or biased markers, the set of 4471 markers might represents the core markers for this set of germplasm (Data Sheet 1, ftp://159.226.208.134/public/SNP_data.zip).
GWAS on Hilum Color and Seed Coat Color
Genetic control of seed hilum color has been well documented (Githiri et al., 2007; Oyoo et al., 2011; Cho et al., 2017). We used this trait as a control to monitor the accuracy of our GWAS analysis (Sonah et al., 2015). In this study, only one significant QTN peaked at Gm08_8571052_A_G-0_T_F_2177931718 (Chr08:8601055) was detected (Figure 3A, Table S2). Chalcone synthase (CHS) gene has been proved to regulate the hilum color. The significant QTN overlapped a CHS gene clustered region in chromosome 8 (Githiri et al., 2007; Oyoo et al., 2011; Fang et al., 2017). These CHS genes are CHS5 (Glyma.08G110400.1, Chr08:8478834.8480215 reverse), CHS3 (Glyma.08G110900.1, Chr08:8517799.8519303 reverse), CHS4(Glyma.08G110500.1, Chr08:8504479.8506020 reverse), CHS3(Glyma.08G110300.1, Chr08:8475793.8477410 forward), CHS9(Glyma.08G109500.1, Chr08:8397944.8399751 forward) (Cho et al., 2017).
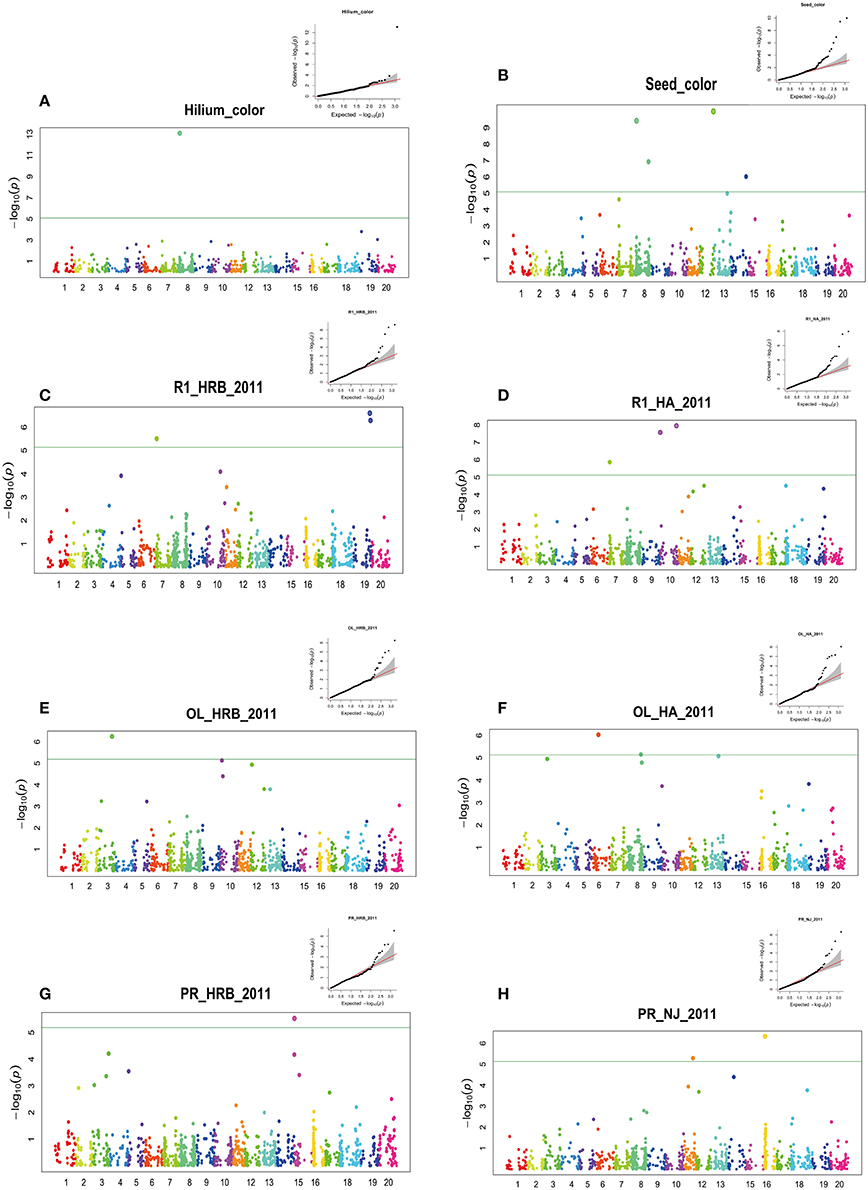
Figure 3. GWAS of seed hilum color, seed coat color, flowering time (R1), protein and oil using FarmCPU. Manhattan plots (bottom) and Quantile-quantile (upper right) plot. Negative log10 P-values from a genome-wide scan are plotted against SNP positions of 20 chromosomes. The horizontal dash line indicates the significant threshold (2 × 10⁻⁵). (A) Hilium color at Harbin in 2011; (B) Seed coat color at Harbin in 2011; (C) Flowering time (R1) at Harbin in 2011; (D) Flowering time (R1) at Huaian in 2011; (E) Oil content at Harbin in 2011; (F) Oil content at Huaian in 2011 (G) Protein content at Harbin in 2011 (H) Protein content at Nanjing in 2011.
We detected four significant QTNs for seed coat color using FarmCPU (Figure 3B). The major QTN was also located at 8622793 bp of chromosome 08. The major QTN detected for seed coat color was about 20 kb away from that for hilum (Figure 3). The clustered CHS family is considered to be candidate genes responsible for the seed coat color (Cho et al., 2017). Also other three QTNs were detected on chromosome 08 (41,212,762 bp), chromosome 12 (37,411,186 bp) and chromosome 14 (41,162,011 bp). A peak but not over the threshold was present on chromosome 13. Recently, seed coat bloom in wild soybeans is mainly controlled by Bloom1 (B1) on chromosome 13, which encodes a transmembrane transporter-like protein for biosynthesis of the bloom in pod endocarp (Zhang et al., 2018). Interestingly, this gene also elevated seed oil content in domesticated soybeans.
GWAS on Flowering Time and Maturity
In this study, flowering time R1 and maturity R7 and R8 were evaluated in six geographic locations. For flowering time, the basic statistics of flowering time (R1) of cultivars were presented in Table 1. It took longer days to reach R1 in the northern locations, HRB, MDJ, and GZL (Figure 4). Other parameters such as Skewness, Kurtosis, K-S distance, K-S probability, SWilk W, SWilk probability indicated these traits were quantitatively inherited (Table 1). The correlation coefficients with a range of 0.592 to 0.978 between R1 of soybean cultivars grown at different locations in 2011 or 2012 (Table 2) were all statistically significant, which indicates this trait is genetically inherited, and also phenotypic data are validated.
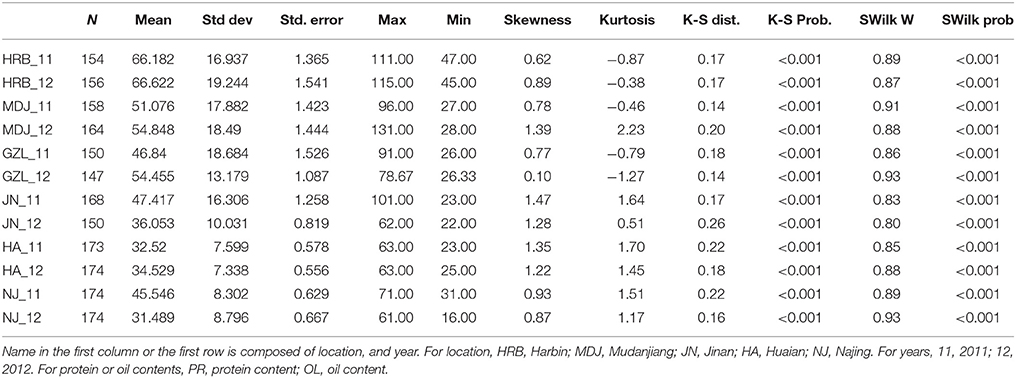
Table 1. The basic statistics of flowering time (R1) of cultivars grown at different locations in 2011 or 2012.
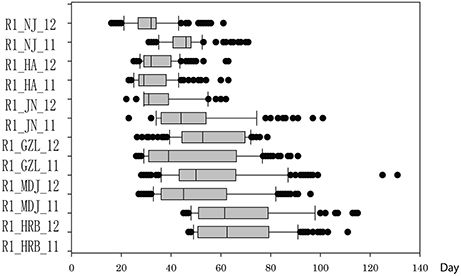
Figure 4. Phenotypic variations in flowering time (R1) of cultivars or accessions at different locations and in 2011 and 2012. The phenotypic segregation is shown in box-plot format. The interquartile region, median, and range are indicated by the box, the bold horizontal line, and the vertical line, respectively. For location, HRB, Harbin; MDJ, Mudanjiang; GZL, Gongzhuling; JN, Jinan; HA, Huaian; NJ, Nanjing. For years, 11, 2011; 12, 2012.
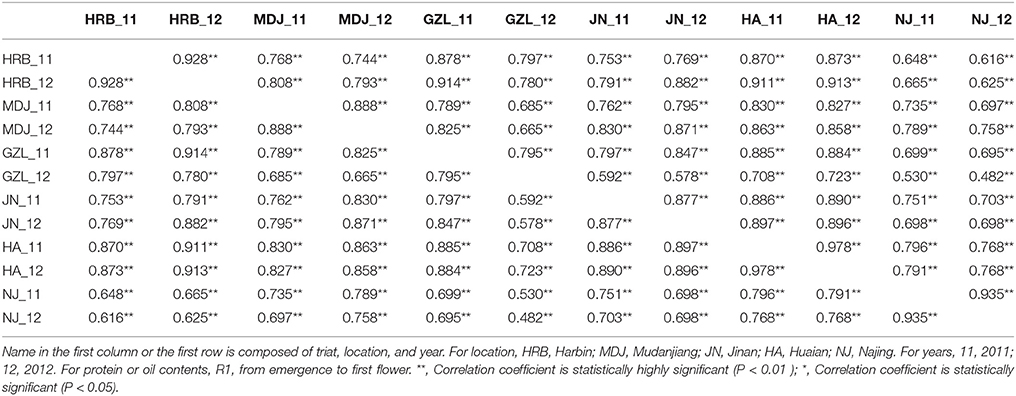
Table 2. The correlation coefficients between R1 (first flower) of soybean cultivars grown at different locations in 2011 or 2012.
Statistical analysis (Table 3) showed that broad sense heritability was 0.5833.
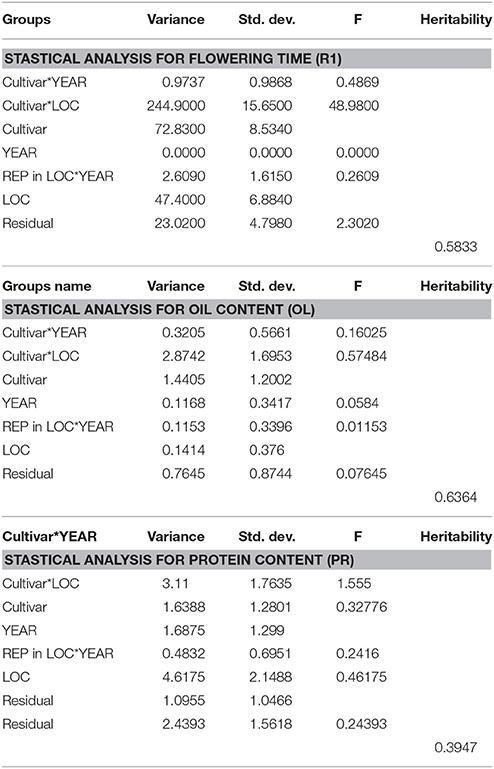
Table 3. The heritability estimates were calculated using variance components obtained by lme4 of R package.
Although phenotypic data for R7 and R8 were not conducted in all locations, the basic distributions were presented in Figure S2, which was similar to R1 trait. Since some cultivars could not reached R7 or R8 before frost in northern locations, HRB, MDJ, and GZL.
In order to analyze the relationship between R1 and R7/R8, the correlation coefficients matrix were generated and listed in Table S2. The correlation coefficients of R7 (R8) between different geographic locations or years were statistically significant except for that between MDJ and southern location, HA and NJ. The correlation coefficients between R1 and R7 or R8 were higher in the same location than in different location. Considering maturity genes, such as E1–E4, are controlling flowering time as well as maturity, we also enclosed R7 and R8 for GWAS.
Although no consistent QTNs for flowering time and maturity were identified across all environments, a total of 30 consistent QTNs were detected for flowering time (R1) or maturity (R7 and R8) on 16 chromosomes (Figures 3C–H; Table 4; Figures S3–S6; Table S3). In Table 4 and Table S3, we only listed the QTN that has been detected more than three environments. In Table 4, we listed the corresponding QTLs listed in SoyBase or known genes with a physical distance less than 5 Mb.
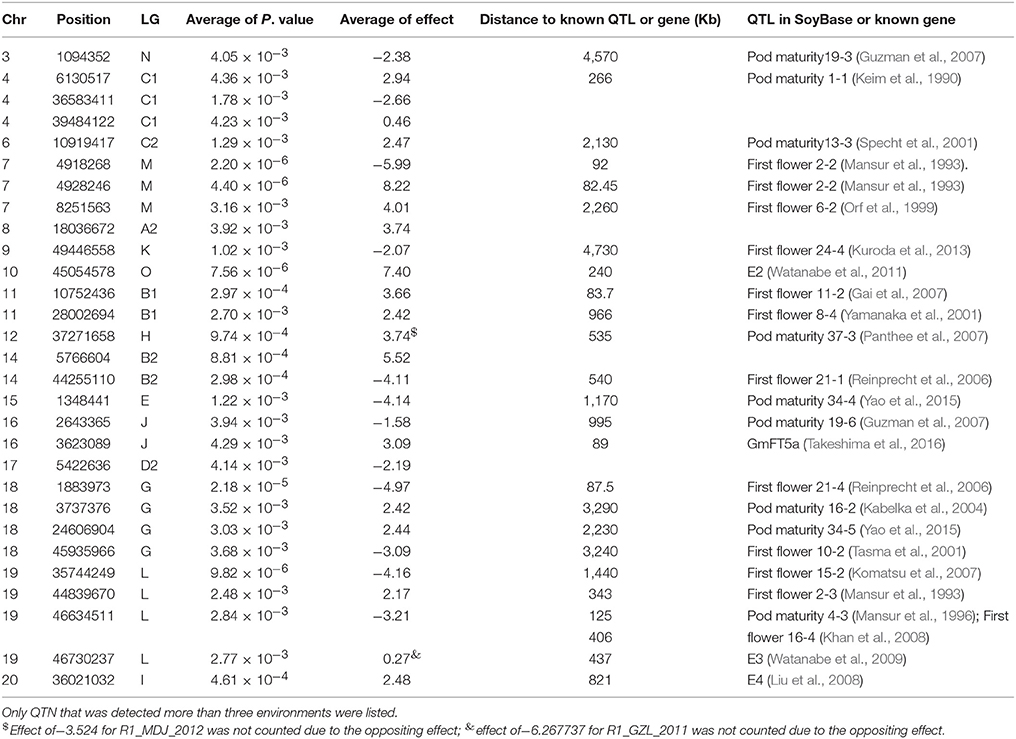
Table 4. Physical position, P-value, effect, and distance to known QTL or known genes of QTN for flowering time (R1) and maturity (R7 and R8) detected using FarmCPU.
In chromose 10 (LG O), we detected a QTN at 45054578 with effect of 7.40 (Table 4; Table S3), which is about 240 kb away from the reported E2 gene (Watanabe et al., 2009). This gene is a major genetic factor controlling flowering time, maturity, geographic adaption in Chinese cultivars (Zhai et al., 2014a; Wang et al., 2016; Fang et al., 2017; Langewisch et al., 2017). In chromosome 19 (LG L), 4 QTN were detected to be significantly associated with flowering time or maturity (Table 4; Table S3). Three QTN at 44839670, 46634511, 46730237 were detected in 5, 12, and 5 environments respectively. QTN at position of 44839670 on chromosome 19 exhibited consistent effect on flowering time or maturity with average of 2.17 day. QTN at 46634511, displayed homogeneous effect on flowering or maturity with average of −3.21 days. In this region, E3 gene, encoding phytochrome A (PHYA), is located from 47633059 to 47641958. The QTN (Gm19_46611973_C_T-1_B_F_2179344248) at 46730237 were detected having four location with positive (suppressing flowering) effect (average of, while in QTN for R1 in GZL in 2011 displayed an oppositing effect of −6.27 days. In generally, the E3 region is strongly associated with flowering time and domestication (Watanabe et al., 2009; Zhai et al., 2014a; Zhou et al., 2015; Langewisch et al., 2017). The QTN disclosed in this study might this region is very important in term of regulation of flowering time or maturity. However, the authenticity of these QTNs or the relationship with the E3 gene merits further investigation.
On chromosome 6, a QTN (Gm06_10891060_T_C-1_B_F_2179335984) was detected at 10919417 with effect of 2.47 day. The E1 gene is located in the pericentromeric region from 20207253 to 20207829 (Xia et al., 2012b) of chromosome 6. Glyma.06G207800.1 in phytozome is physically corresponding to the E1 gene, however, this coding region of this gene was annotated from 20207077 to 2020794. The lack of polymorphic SNP in the E1 region might account for not being able to detect this major gene. Another Phytochrome A gene, E4, located at Chr20:33236018.33241692 (forward), was reported to be less diversified among Chinese and American cultivars (Zhai et al., 2014b; Langewisch et al., 2017). A QTN (Gm20_34881595_C_T-1_B_F_2179344630) was detected about 3 Mb away from E4 gene. GmFT5a, an FT homolog, located at Chr16:4135885.4137742 (reverse) about 89 kb from the QTN (Gm16_3598173_C_T-1_B_F_2179342018 with average effect of 3.09) detected (Table 4; Table S3). Other QTNs detected over 3 environments were mapped on chromosome 3, 4, 7, 8, 9, 11, 12, 14, 15, 16, 17, 18, 19 (Figures 3C–H; Table 4; Figures S3–S6; Table S3). Among them, QTN (Gm11_10721006_A_G-1_T_F_2179339194) at 10752436 bp on Chr 11 (LG B1), QTN (Gm12_37315664_A_G-1_T_F_2179339946) at 37271658 on Chr 12 (LG H), QTN(Gm15_1349135_T_C-1_B_F_2179341354) at 1348441 of on Chr 15 (LG E); QTL (Gm18_34401760_G_A-1_T_F_2179343324) at 24606904 on Chr 18 (LG G) were identified in 7 or more environments. Fang et al. (2017) also reported a QTN on chromosome 18 (Fang et al., 2017), whether QTN (Gm18_34401760_G_A-1_T_F_2179343324) is the same as the QTLs reported by other researchers (SoyBase, www.soybase.org) merits further investigation.
In our previous study, the genotypes at E1, E2, E3, and E4 of 180 cultivars revealed great allelic variations at E1 and E3 genes (Zhai et al., 2014b). The power of GWAS to capture a certain trait often depends on the frequency of the accessions with contrast phenotypic value in the population being investigated (Yan et al., 2017). In the previous GWAS studies, fewer QTNs were detected for this trait. When the modern cultivars only a QTN corresponding to E3 was detected at a natural population of 304 short-season soybean lines (K = 9) (Sonah et al., 2015). While using 892 cultivars (K = 4), only a QTN corresponds to E2 locus was identified (Fang et al., 2017).
No universal QTN was detected over all environments in this study. Common QTNs detected in three or more environments are also informative for us to understand this trait, although authenticity of these QTNs detected in this study need to be verified. GWAS and biparental linkage mapping are commentary each other in mapping and thereafter gene cloning. At present, around 50 biparental populations were generated using the cultivars in this study. We will use these populations to verify the QTN obtained in this study. Fine-mapping or positional cloning will be performed when a novel gene or QTN is verified.
GWAS of Protein and Oil Contents of Cultivar Seeds
In this study, protein and oil contents were simultaneously measured in 5 geographic location in 2011 and 2012. The basic statistics of two traits were listed in Table 5 and presented in Figure 5. The parameters such as Skewness, Kurtosis, K-S distance, K-S probability, SWilk W, SWilk probability indicated this trait were quantitatively inherited (Table 5). The correlation coefficients between protein and oil were presented in Table 6. From the correlation coefficients, the protein contents were negatively and significantly correlated to oil content in the same environments or different environments; while the protein contents in an environments was positively correlated to protein contents in other environments (Table 6, Figure 5). The trend was the same for oil contents. According to statistical analysis, the broad sense heritability for oil and protein were 0.6364 and 0.3947. When we used data for protein and oil contents obtained in 9 environments for GWAS using FarmCPU, 16 consistent QTNs for protein and oil contents were detected for oil or protein over 3 environments (Table 7; Table S4; Figures 3G,H, Figures S7, S8). Eleven QTNs were detected having antagonistic effects on protein and oil content, while 4 QTNs soly for oil content, and one QTN soly for protein content. Of eleven QTN for both traits detected over 3 environments, each QTN showed antagonistic effects on protein and oil contents, which indicated these QTNs are involved in biological pathway affecting both oil and protein. Major QTL were repeatedly detected on Chromosome 20 (LG I) and 15 (LG E) using America cultivars (Patil et al., 2017). In this study, we detected three QTNs on Chromosome 20 (LG O). Two QTNs were identified for both traits, QTN (Gm20_2372509_T_C-1_T_R_2179344425) at position of 2366428 with antagonistic effects on protein (0.431691) and oil (-0.45203) and QTN (Gm20_7927513_A_G-1_T_F_2179344472) with antagonistic effects on protein(0.76146) and oil (-0.47998). Another QTN (Gm20_38151772_C_T-1_T_R_2179344711) for oil with effect of−0.53353 was identified on chromosome 20. We did not detect any consistent QTN on Chr 15 (LG E). All 16 QTNs mapped in this study (Table 7) were physically near (less than 5 Mb) QTL reported in SoyBase.
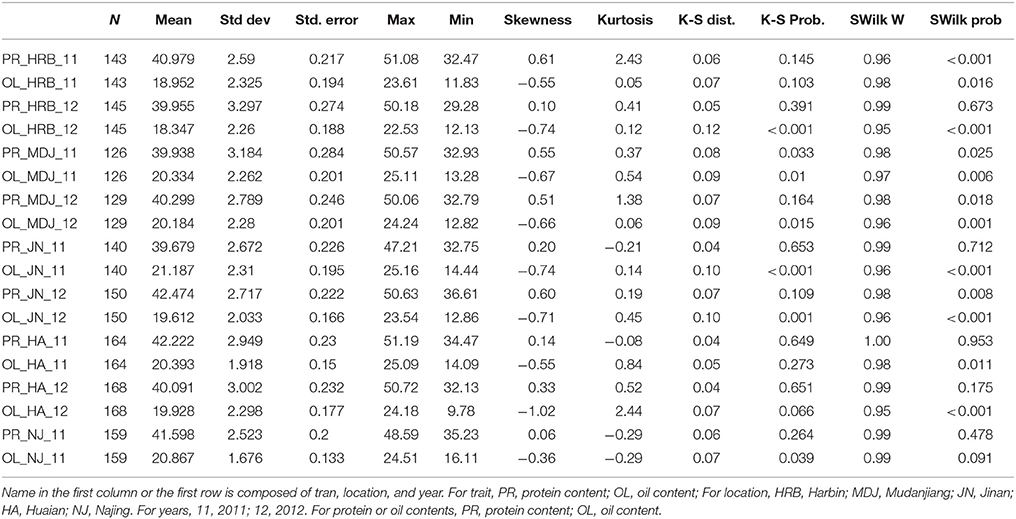
Table 5. The basic statistics of protein and oil contents of cultivars grown at different locations in 2011 or 2012.
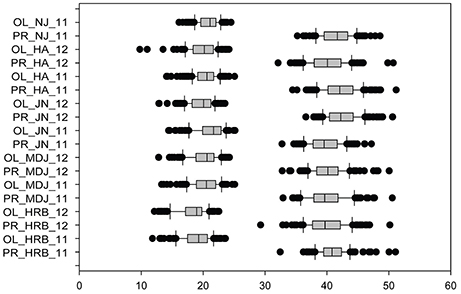
Figure 5. Phenotypic variations in protein (PR) and oil (OL) contents of cultivars or accessions at different locations and in 2011 and 2012. The phenotypic segregation is shown in box-plot format. The interquartile region, median, and range are indicated by the box, the bold horizontal line, and the vertical line, respectively. For location, HRB, Harbin; MDJ, Mudanjiang; GZL, Gongzhuling; JN, Jinan; HA, Huaian; NJ, Nanjing. For years, 11, 2011; 12, 2012.
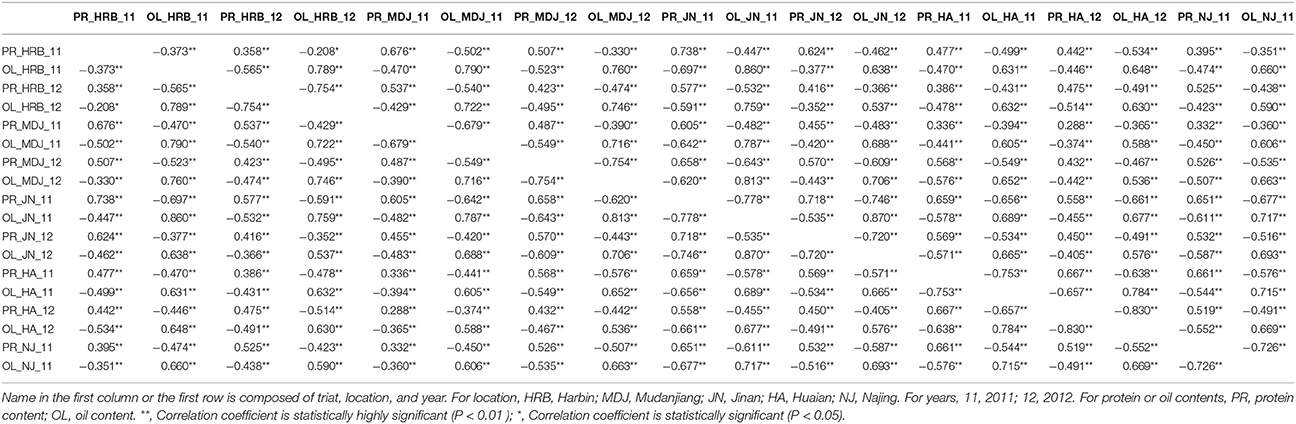
Table 6. The correlation coefficients between seed protein content and oil content of soybean cultivars grown at different locations in 2011 or 2012.
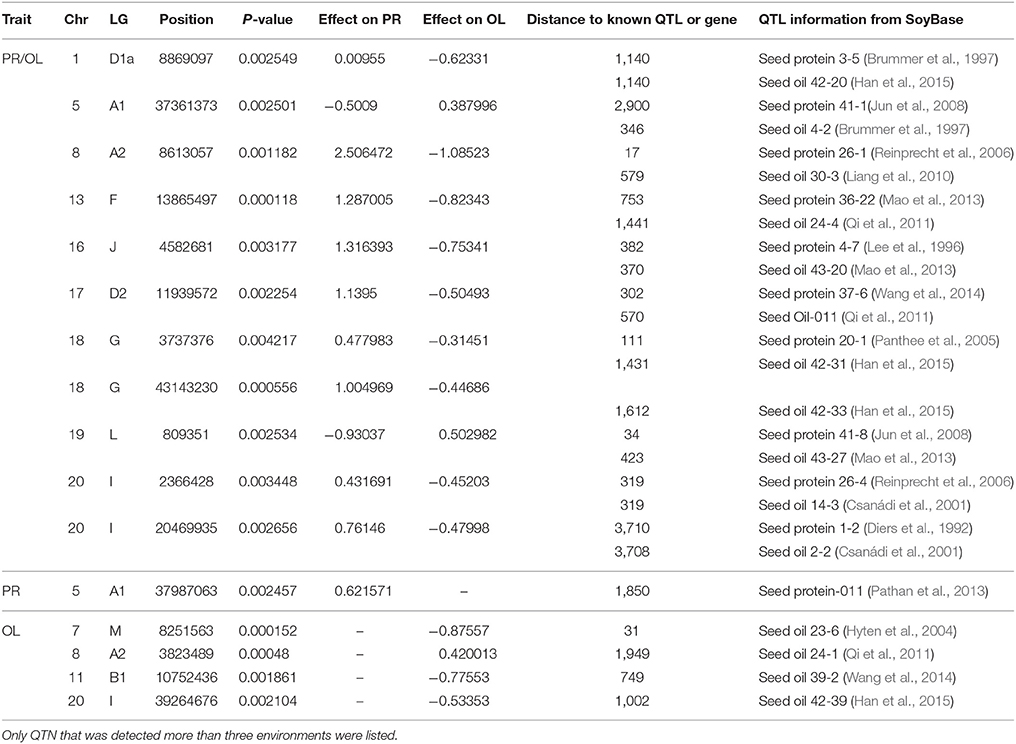
Table 7. Physical position, P-value, effect, and distance to known QTL or known genes of QTN for protein and oil content (PR/OL), oil content only (OL) and protein content only (PR) using FarmCPU.
Conclusion and Further Consideration
Instead of traditional molecular markers, e.g., SSR, AFLP, advances in sequencing technologies have enabled high-density array and GBS to be widely applied to genomic and genetic study to dissect genetic population structure and GWAS (Sonah et al., 2013; Bandillo et al., 2015; Wen et al., 2015; Zhang et al., 2015; Contreras-Soto et al., 2017; Fang et al., 2017; Yan et al., 2017). However, this study employed a medium density array to reveal population genetic structure, the result showed the quality of the population genetic study has been improved by elimination of some batch specific or biased SNPs. Also the GWAS quality has been monitored using hilum color and seed coat color. Fast genotyping method e.g., using a set of core SNP array is in high demand for genetic study or molecular breeding (Chaudhary et al., 2015).
The information gained in this study demonstrated that the usefulness of the medium-density SNP array in genotyping for genetic study and molecular breeding.
Up to date, there are a large number of loci or QTL have been identified by GWAS using different set of natural population or by linkage or association mapping using biparental populations under different environments in different years. In generally, the effect of each locus is rather small, its detection might be influenced by population size, population structure, accuracy of phenotyping, physical location of the causal gene (e.g., pericentromeric region), epistatic association between QTLs as well as environmental factors. High negative correlation coefficients between oil and protein content in soybean was revealed in this study, which is consistent with previous reports (Boydak et al., 2002; Karaaslan et al., 2008); common regions or loci might have favorable effect on one and unfavorable effect on the other. The higher negative correlation coefficients of two traits might reflect that we might be able to detect QTL or QTN with higher effect on both traits. Hwang et al. (2014) found seven of 13 regions associated with oil content also have effect on protein content (Hwang et al., 2014). Similarly, in this study, we have detected 11 common QTNs associated with oil and antagonistically associated with protein, although no universal QTN detected over all environments. However, the overall oil and protein content can be varied to a great extent, also the environmental effect e.g., latitudinal location, temperature can also influence the balance of two contents, there are a lot loci affecting most to one content, but not the other, at least not significantly (Eskandari et al., 2013).
Overall, a large number of loci have been identified to underlie some important agronomic traits e.g., flowering time, maturity, oil and protein contents; however, a detailed study may only detect some of them. Ideally, a large numbers of natural population can be subtracted into a subpopulation each member of which carries higher or lower phenotypic values for a given trait; GWAS for the given trait can be performed using in this subpopulation (Yan et al., 2017).
A large number of QTLs or loci underlying agronomically important traits have been identified by GWAS or linkage mapping, some of which were detected in different environments or in different populations while some are environmental or population specific. Although molecular identities of genes or QTL underlying some important agronomic traits e.g., maturity have been disclosed, vast of loci underlying quantitative traits like soybean seed protein /oil content are still largely unknown. GWAS in combination with biparental populations such as RIL, NIL, CSSL, is very powerful for QTL identification and their gene cloning. As high throughput sequencing data aggregate, the important QTL or QTN detected by traditional linkage mapping or GWAS will be verified and subsequently cloned. As most components of a molecular or signaling pathway have been identified (Gentzbittel et al., 2015), information of gene regulation or crosstalk with different pathways will enable us to build a genetic network that can be used in molecular design breeding.
Author Contributions
ZX conceived this project; YW, YL performed the most experiments in the laboratory; HW, BH, HZ, SL, XL, XC, HQ, JY, CZ, DH conducted field experiment and phenotypic observation; JZ, ZW, ZX: performed data analysis including GWAS; ZX, YW, and YL wrote the article; DW contributed to scientific discussions and critical revision of manuscript. All authors reviewed the final manuscript.
Funding
This work was supported by National Key R&D Program of China (2016YFD0101902 and 2016YFD0100201); by Strategic Priority Research Program of the Chinese Academy of Sciences (XDA0801010503); and by Programs (31471518, 31771869, 31771818) from National Natural Science Foundation of China. The funders had no role in study design, data collection and analysis, decision to publish, or preparation of the manuscript.
Conflict of Interest Statement
The authors declare that the research was conducted in the absence of any commercial or financial relationships that could be construed as a potential conflict of interest.
Acknowledgments
We thank Professor Kyuya Harada (Dept. of Biotechnology, Osaka University, Japan) and Professor Liuling Yan (Dept. of Plant and Soil Sciences, Oklahoma State University, USA) for critical comments and English editing. Also thanks to Scientific Data Center of Northeast Black Soil, National Earth System Science Data Sharing Infrastructure, National Science and Technology Infrastructure of China, (http://northeast.geodata.cn).
Supplementary Material
The Supplementary Material for this article can be found online at: https://www.frontiersin.org/articles/10.3389/fpls.2018.00610/full#supplementary-material
Figure S1. The frequency of heterozygous and linkage disequilibrium decade were culculated using Gapit. (a) The frequency of heterozygous nature was calculated for both individuals and markers. High level of heterozygosis indicated low quality. (b) Linkage disequilibrium are measured as R square for pair wise markers and plotted against their distance.
Figure S2. Phenotypic variations in maturity (R7, Beginning Maturity, R8, Full Maturity) of cultivars or accessions at different locations and in 2011 and 2012. The phenotypic segregation is shown in box-plot format. The interquartile region, median, and range are indicated by the box, the bold horizontal line, and the vertical line, respectively. For location, HRB, Harbin; MDJ, Mudanjiang; GZL, Gongzhuling; JN, Jinan; HA, Huaian; NJ, Nanjing. For years, 11, 2011; 12, 2012.
Figure S3. GWAS of flowering time (R1) in the northern geographic region using FarmCPU. Manhattan plots (bottom) and Quantile-quantile (upper right) plot for a trait. Negative log10 P-values from a genome-wide scan are plotted against SNP positions of 20 chromosomes. The horizontal dash line indicates the significant threshold (2 × 10⁻⁵). (a) Gongzhuling in 2011; (b) Gongzhuling in 2012; (c) Harbin in 2011; (d) Harbin in 2012; (e) Mudanjiang in 2011; (F) Mudanjiang in 2012.
Figure S4. GWAS of flowering time (R1) in the southern geographic region using FarmCPU. Manhattan plots (bottom) and Quantile-quantile (upper right) plot for a trait. Negative log10 P-values from a genome-wide scan are plotted against SNP positions of 20 chromosomes. The horizontal dash line indicates the significant threshold (2 × 10⁻⁵). (a) Jinan in 2011; (b) Jinan in 2012; (c) Huaian in 2011; (d) Huaian in 2012; (e) Nanjing in 2011; (f) Nanjing in 2012.
Figure S5. GWAS of beginning maturity, R7, flowering time (R1) using FarmCPU. Manhattan plots (left) and Quantile-quantile (right) plot. Negative log10 P-values from a genome-wide scan are plotted against SNP positions of 20 chromosomes. The horizontal dash line indicates the significant threshold (2 × 10⁻⁵). (a) Gongzhuling in 2011; (b) Gongzhuling in 2012; (c) Mudanjiang 2011; (d) Mudanjiang in 2012; (e) Jinan in 2011; (f) Huaian in 2011; (g) Huaian in 2012; (h) Nanjing in 2011; (i) Nanjing in 2012.
Figure S6. GWAS of full maturity, R8, using FarmCPU. Manhattan plots (left) and Quantile-quantile (right) plot. Negative log10 P-values from a genome-wide scan are plotted against SNP positions of 20 chromosomes. The horizontal dash line indicates the significant threshold (2 × 10⁻⁵). (a) Gongzhuling in 2011; (b) Gongzhuling in 2012; (c) Mudanjiang 2011; (d) Mudanjiang in 2012; (e) Jinan in 2011; (f) Huaian in 2011.
Figure S7. GWAS of oil contents using FarmCPU. Manhattan plots (left) and Quantile-quantile (right) plot. Negative log10 P-values from a genome-wide scan are plotted against SNP positions of 20 chromosomes. The horizontal dash line indicates the significant threshold (2 × 10⁻⁵). (a) Harbin in 2011; (b) Harbin in 2012; (c) Mudanjiang 2011; (d) Mudanjiang in 2012; (e) Jinan in 2011; (F) Jinan in 2012; (g) Huaian in 2011; (h) Huaian in 2012; (i) Nanjing in 2011.
Figure S8. GWAS of protein contents using FarmCPU. Manhattan plots (left) and Quantile-quantile (right) plot. Negative log10 P-values from a genome-wide scan are plotted against SNP positions of 20 chromosomes. The horizontal dash line indicates the significant threshold (2 × 10⁻⁵). (a) Harbin in 2011; (b) Harbin in 2012; (c) Mudanjiang 2011; (d) Mudanjiang in 2012; (e) Jinan in 2011; (F) Jinan in 2012; (g) Huaian in 2011; (h) Huaian in 2012; (i) Nanjing in 2011.
Table S1. Geographic origins of soybean cultivars or accession used in this study.
Table S2. The correlation coefficients between R1 (first flower), R7 (beginning of maturity) and R8 (Fully Maturity) of soybean cultivars grown at different locations in 2011 or 2012.
Table S3. QTNs for flowering time (R1) and maturity (R7 or R8) were detected using FarmCPU.
Table S4. QTNs for protein and oil contents were detected using FarmCPU.
Data Sheet 1. Raw data and probe information of SoySNP8k iSelect BeadChip, which can be download at.ftp://159.226.208.134/public/SNP_data.zip.
References
Akond, M., Liu, S., Schoener, L., Anderson, J. A., Kantartzi, S. K., Meksem, K., et al. (2013). SNP-based genetic linkage map of soybean using the SoySNP6K Illumina Infnium BeadChip genotyping array. Plant Genome Sci. 1, 80–89. doi: 10.5147/jpgs.2013.0090
Arora, S., Singh, N., Kaur, S., Bains, N. S., Uauy, C., Poland, J., et al. (2017). Genome-wide association study of grain architecture in wild wheat Aegilops tauschii. Front. Plant Sci. 8:886. doi: 10.3389/fpls.2017.00886
Bandillo, N., Jarquin, D., Song, Q. J., Nelson, R., Cregan, P., Specht, J., et al. (2015). A population structure and genome-wide association analysis on the USDA soybean germplasm collection. Plant Genome 8, 1–13. doi: 10.3835/plantgenome2015.04.0024
Bernard, R. L. (1971). Two major genes for time of flowering and maturity in soybeans. Crop Sci. 11, 242–244. doi: 10.2135/cropsci1971.0011183X001100020022x
Bonato, E. R., and Vello, N. A. (1999). E6, a dominant gene conditioning early flowering and maturity in soybeans. Genet. Mol. Biol. 22, 229–232. doi: 10.1590/S1415-47571999000200016
Boydak, E., Alpaslan, M., Hayta, M., Gercek, S., and Simsek, M. (2002). Seed composition of Soybeans grown in the Harran region of Turkey as affected by row spacing and irrigation. J. Agric. Food Chem. 50, 4718–4720. doi: 10.1021/jf0255331
Bradbury, P. J., Zhang, Z., Kroon, D. E., Casstevens, T. M., Ramdoss, Y., and Buckler, E. S. (2007). TASSEL: software for association mapping of complex traits in diverse samples. Bioinformatics 23, 2633–2635. doi: 10.1093/bioinformatics/btm308
Brummer, E. C., Graef, G. L., Orf, J., Wilcox, J. R., and Shoemaker, R. C. (1997). Mapping QTL for seed protein and oil content in eight soybean populations. Crop Sci. 37, 370–378. doi: 10.2135/cropsci1997.0011183X003700020011x
Buzzell, R. I., and Voldeng, H. D. (1980).Inheritance of insensitivity to long daylength. Soybean Genet. Newsletter 7, 26–29.
Buzzell, R. I. (1971). Inheritance of a soybean flowering response to fluorescent-daylength conditions. Can. J. Genet. Cytol. 13, 703–707. doi: 10.1139/g71-100
Cao, Y., Li, S., Wang, Z., Chang, F., Kong, J., Gai, J., et al. (2017). Identification of major quantitative trait loci for seed oil content in soybeans by combining linkage and genome-wide association mapping. Front. Plant Sci. 8:1222. doi: 10.3389/fpls.2017.01222
Chaudhary, J., Patil, G. B., Sonah, H., Deshmukh, R. K., Vuong, T. D., Valliyodan, B., et al. (2015). Expanding omics resources for improvement of soybean seed composition traits. Front. Plant Sci. 6:1021. doi: 10.3389/fpls.2015.01021
Cho, Y. B., Jones, S. I., and Vodkin, L. O. (2017). Mutations in Argonaute5 illuminate epistatic interactions of the K1 and / loci leading to saddle seed color patterns in Glycine max. Plant Cell 29, 708–725. doi: 10.1105/tpc.17.00162
Cober, E. R., and Voldeng, H. D. (2001). A new soybean maturity and photoperiod-sensitivity locus linked to E1 and T. Crop Sci. 41, 698–701. doi: 10.2135/cropsci2001.413698x
Cober, E. R., Molnar, S. J., Charette, M., and Voldeng, H. D. (2010). A new locus for early maturity in soybean. Crop Sci. 50, 524–527. doi: 10.2135/cropsci2009.04.0174
Contreras-Soto, R. I., Mora, F., de Oliveira, M. A. R., Higashi, W., Scapim, C. A., and Schuster, I. (2017). A genome-wide association study for agronomic traits in soybean using SNP markers and SNP-based haplotype analysis. PLoS ONE 12:e0171105. doi: 10.1371/journal.pone.0171105
Csanádi, G. Y., Vollmann, J., Stift, G., and Lelley, T. (2001). Seed quality QTLs identified in a molecular map of early maturing soybean. Theor. Appl. Genet. 103, 912–919. doi: 10.1007/s001220100621
Diers, B. W., Keim, P., Fehr, W. R., and Shoemaker, R. C. (1992). RFLP analysis of soybean seed protein and oil content. Theor. Appl. Genet. 83, 608–612. doi: 10.1007/BF00226905
Dissanayaka, A., Rodriguez, T. O., Di, S., Yan, F., Githiri, S. M., Rodas, F. R., et al. (2016). Quantitative trait locus mapping of soybean maturity gene E5. Breed. Sci. 66, 407–415. doi: 10.1270/jsbbs.15160
Eskandari, M., Cober, E. R., and Rajcan, I. (2013). Genetic control of soybean seed oil: I. QTL and genes associated with seed oil concentration in RIL populations derived from crossing moderately high-oil parents. Theor. Appl. Genet. 126, 483–495. doi: 10.1007/s00122-012-1995-3
Evanno, G., Regnaut, S., and Goudet, J. (2005). Detecting the number of clusters of individuals using the software STRUCTURE: a simulation study. Mol. Ecol. 14, 2611–2620. doi: 10.1111/j.1365-294X.2005.02553.x
Fang, C., Ma, Y. M., Wu, S. W., Liu, Z., Wang, Z., Yang, R., et al. (2017). Genome-wide association studies dissect the genetic networks underlying agronomical traits in soybean. Genome Biol. 18:161. doi: 10.1186/s13059-017-1289-9
Fehr, W. R., Caviness, C. E., Burmood, D. T., and Pennington, J. S. (1971). Stage of development descriptions for soybeans, Glycine max (L.) Merrill. Crop Sci. 11, 929–931. doi: 10.2135/cropsci1971.0011183X001100060051x
Gai, J., Wang, Y., Wu, X., and Chen, S. (2007). A comparative study on segregation analysis and QTL mapping of quantitative traits in plants-with a case in soybean. Front. Agric. China 1, 1–7. doi: 10.1007/s11703-007-0001-3
Gentzbittel, L., Andersen, S. U., Ben, C., Rickauer, M., Stougaard, J., and Young, N. D. (2015). Naturally occurring diversity helps to reveal genes of adaptive importance in legumes. Front. Plant Sci. 6:269. doi: 10.3389/fpls.2015.00269
Githiri, S. M., Yang, D., Khan, N. A., Xu, D., Komatsuda, T., and Takahashi, R. (2007). QTL analysis of low temperature induced browning in soybean seed coats. J. Hered. 98, 360–366. doi: 10.1093/jhered/esm042
Guzman, P. S., Diers, B. W., Neece, D. J., St Martin, S. K., LeRoy, A. R., Grau, C. R., et al. (2007). QTL associated with yield in three backcross-derived populations of soybean. Crop Sci. 47, 111–122. doi: 10.2135/cropsci2006.01.0003
Han, Y., Teng, W., Wang, Y., Zhao, X., Wu, L., Li, D., et al. (2015). Unconditional and conditional QTL underlying the genetic interrelationships between soybean seed isoflavone, and protein or oil contents. Plant Breed. 134, 300–309. doi: 10.1111/pbr.12259
Huang, X., Wei, X., Sang, T., Zhao, Q. A., Feng, Q., Zhao, Y., et al. (2010). Genome-wide association studies of 14 agronomic traits in rice landraces. Nat. Genet. 42, U961–U976. doi: 10.1038/ng.695
Hwang, E. Y., Song, Q. J., Jia, G. F., Specht, J. E., Hyten, D. L., Costa, J., et al. (2014). A genome-wide association study of seed protein and oil content in soybean. BMC Genomics 15:1. doi: 10.1186/1471-2164-15-1
Hyten, D. L., Pantalone, V. R., Sams, C. E., Saxton, A. M., Landau-Ellis, D., Stefaniak, T. R., et al. (2004). Seed quality QTL in a prominent soybean population. Theor. Appl. Genet. 109, 552–561. doi: 10.1007/s00122-004-1661-5
Jun, T. H., Van, K., Kim, M. Y., Lee, S. H., and Walker, D. R. (2008). Association analysis using SSR markers to find QTL for seed protein content in soybean. Euphytica 162, 179–191. doi: 10.1007/s10681-007-9491-6
Kabelka, E. A., Diers, B. W., Fehr, W. R., LeRoy, A. R., Baianu, I. C., You, T., et al. (2004). Putative alleles for increased yield from soybean plant introductions. Crop Sci. 44, 784–791. doi: 10.2135/cropsci2004.7840
Karaaslan, D., Boydak, E., Turkoglu, H., and Hakan, M. (2008). Effect of different seed rates on oil and protein content and fatty acid composition of soybean seeds. Asian J. Chem. 20, 2115–2124.
Keim, P., Diers, B. W., Olson, T. C., and Shoemaker, R. C. (1990). RFLP mapping in soybean: association between marker loci and variation in quantitative traits. Genetics 126, 735–742. Available online at: http://www.genetics.org/content/126/3/735
Khan, N. A., Githiri, S. M., Benitez, E. R., Abe, J., Kawasaki, S., Hayashi, T., et al. (2008). QTL analysis of cleistogamy in soybean. Theor. Appl. Genet. 117, 479–487. doi: 10.1007/s00122-008-0792-5
Komatsu, K., Okuda, S., Takahashi, M., Matsunaga, R., and Nakazawa, Y. (2007). Quantitative trait loci mapping of pubescence density and flowering time of insect-resistant soybean (Glycine max L. Merr.). Genet. Mol. Bio. 30, 635–639. doi: 10.1590/S1415-47572007000400022
Kong, F. J., Nan, H. Y., Cao, D., Li, Y., Wu, F. F., Wang, J. L., et al. (2014). A new dominant gene E9 conditions early flowering and maturity in soybean. Crop Sci. 54, 2529–2535. doi: 10.2135/cropsci2014.03.0228
Kuroda, Y., Kaga, A., Tomooka, N., Yano, H., Takada, Y., Kato, S., et al. (2013). QTL affecting fitness of hybrids between wild and cultivated soybeans in experimental fields. Ecol. Evo. 3, 2150–2168. doi: 10.1002/ece3.606
Langewisch, T., Lenis, J., Jiang, G. L., Wang, D. C., Pantalone, V., and Bilyeu, K. (2017). The development and use of a molecular model for soybean maturity groups. BMC Plant Biol. 17:91. doi: 10.1186/s12870-017-1040-4
Leamy, L. J., Zhang, H. Y., Li, C. B., Chen, C. Y., and Song, B. H. (2017). A genome-wide association study of seed composition traits in wild soybean (Glycine soja). BMC Genomics 18:18. doi: 10.1186/s12864-016-3397-4
Lee, S. H., Bailey, M. A., Mian, M. A. R., Carter, T. E., Shipe, E. R., Ashley, D. A., et al. (1996). RFLP loci associated with soybean seed protein and oil content across populations and locations. Theor. Appl. Genet. 93, 649–657. doi: 10.1007/BF00224058
Liang, H. Z., Yu, Y. L., Wang, S. F., Lian, Y., Wang, T. F., Wei, Y. L., et al. (2010). QTL mapping of isoflavone, oil and protein contents in soybean (Glycine max L. Merr.). Agric. Sci. China 9, 1108–1116. doi: 10.1016/S1671-2927(09)60197-8
Lipka, A. E., Tian, F., Wang, Q., Peiffer, J., Li, M., Bradbury, P. J., et al. (2012). GAPIT: genome association and prediction integrated tool. Bioinformatics 28, 2397–2399. doi: 10.1093/bioinformatics/bts444
Liu, X. L., Huang, M., Fan, B., Buckler, E. S., and Zhang, Z. W. (2016). Iterative usage of fixed and random effect models for powerful and efficient genome-wide association studies. PLoS Genet. 12:e1005767. doi: 10.1371/journal.pgen.1005767
Liu, B. H., Kanazawa, A., Matsumura, H., Takahashi, R., Harada, K., and Abe, J. (2008). Genetic redundancy in soybean photoresponses associated with duplication of the phytochrome A gene. Genetics 180, 995–1007. doi: 10.1534/genetics.108.092742
Liu, Z., Li, H., Fan, X., Huang, W., Yang, J., Li, C., et al. (2016). Phenotypic characterization and genetic dissection of growth period traits in soybean (Glycine max) using association mapping. PLoS ONE 11:e0158602. doi: 10.1371/journal.pone.0158602
Lu, S., Zhao, X., Hu, Y., Liu, S., Nan, H., Li, X., et al. (2017). Natural variation at the soybean J locus improves adaptation to the tropics and enhances yield. Nat. Genet. 49, 773–779. doi: 10.1038/ng.3819
Ma, X., Feng, F., Wei, H., Mei, H., Xu, K., Chen, S., et al. (2016). Genome-wide association study for plant height and grain yield in rice under contrasting moisture regimes. Front. Plant Sci. 7:1801. doi: 10.3389/fpls.2016.01801
Mansur, L. M., Lark, K. G., Kross, H., and Oliveira, A. (1993). Interval mapping of quantitative trait loci for reproductive, morphological, and seed traits of soybean (Glycine max L.). Theor. Appl. Genet. 86, 907–913. doi: 10.1007/BF00211040
Mansur, L. M., Orf, J. H., Chase, K., Jarvik, T., Cregan, P. B., and Lark, K. G. (1996). Genetic mapping of agronomic traits using recombinant inbred lines of soybean. Crop Sci. 36, 1327–1336. doi: 10.2135/cropsci1996.0011183X003600050042x
Mao, T., Jiang, Z., Han, Y., Teng, W., Zhao, X., and Li, W. (2013). Identification of quantitative trait loci underlying seed protein and oil contents of soybean across multi-genetic backgrounds and environments. Plant Breed. 132, 630–641. doi: 10.1111/pbr.12091
McBlain, B. A., and Bernard, R. L. (1987). A new gene affecting the time of flowering and maturity in soybeans. J. Hered. 78, 160–162. doi: 10.1093/oxfordjournals.jhered.a110349
Murray, M. G., and Thompson, W. F. (1980). Rapid isolation of high molecular-weight plant DNA. Nucleic Acids Res. 8, 4321–4325. doi: 10.1093/nar/8.19.4321
Norman, A. G. (1978). Soybean Physiology, Agronomy, and Utilization. New York, NY: Academic Press. doi: 10.1097/00010694-197904000-00013
Orf, J. H., Chase, K., Jarvik, T., Mansur, L. M., Cregan, P. B., Adler, F. R., et al. (1999). Genetics of soybean agronomic traits: I. Comparison of three related recombinant inbred populations. Crop Sci. 39, 1642–1651. doi: 10.2135/cropsci1999.3961642x
Oyoo, M. E., Benitez, E. R., Kurosaki, H., Ohnishi, S., Miyoshi, T., Kiribuchi-Otobe, C., et al. (2011). QTL Analysis of soybean seed coat discoloration associated with II TT genotype. Crop Sci. 51, 464–469. doi: 10.2135/cropsci2010.02.0121
Panthee, D. R., Pantalone, V. R., Saxton, A. M., West, D. R., and Sams, C. E. (2007). Quantitative trait loci for agronomic traits in soybean. Plant Breed. 126, 51–57. doi: 10.1111/j.1439-0523.2006.01305.x
Panthee, D. R., Pantalone, V. R., West, D. R., Saxton, A. M., and Sams, C. E. (2005). Quantitative trait loci for seed protein and oil concentration, and seed size in soybean. Crop Sci. 45, 2015–2022. doi: 10.2135/cropsci2004.0720
Pathan, S. M., Vuong, T., Clark, K., Lee, J. D., Shannon, J. G., Roberts, C. A., et al. (2013). Genetic mapping and confirmation of quantitative trait loci for seed protein and oil contents and seed weight in soybean. Crop Sci. 53, 765–774. doi: 10.2135/cropsci2012.03.0153
Patil, G., Mian, R., Vuong, T., Pantalone, V., Song, Q., Chen, P., et al. (2017). Molecular mapping and genomics of soybean seed protein: a review and perspective for the future. Theor. Appl. Genet. 130, 1975–1991. doi: 10.1007/s00122-017-2955-8
Pritchard, J. K., Stephens, M., Rosenberg, N. A., and Donnelly, P. (2000). Association mapping in structured populations. Am. J. Hum. Genet. 67, 170–181. doi: 10.1086/302959
Qi, Z. M., Xue, H. A. N., Sun, Y. N., Qiong, W. U., Shan, D. P., Du, X. Y., et al. (2011). An integrated quantitative trait locus map of oil content in soybean, Glycine max (L.) Merr., generated using a meta-analysis method for mining genes. Agric. Sci. China 10, 1681–1692. doi: 10.1016/S1671-2927(11)60166-1
Ray, J. D., Hinson, K., Mankono, E. B., and Malo, M. F. (1995). Genetic control of a long-juvenile trait in soybean. Crop Sci. 35, 1001–1006. doi: 10.2135/cropsci1995.0011183X003500040012x
Reinprecht, Y., Poysa, V. W., Yu, K., Rajcan, I., Ablett, G. R., and Pauls, K. P. (2006). Seed and agronomic QTL in low linolenic acid, lipoxygenase-free soybean (Glycine max (L.) Merrill) germplasm. Genome 49, 1510–1527. doi: 10.1139/g06-112
Samanfar, B., Molnar, S. J., Charette, M., Schoenrock, A., Dehne, F., Golshani, A., et al. (2017). Mapping and identification of a potential candidate gene for a novel maturity locus, E10, in soybean. Theor. Appl. Genet. 130, 377–390. doi: 10.1007/s00122-016-2819-7
Sonah, H., Bastien, M., Iquira, E., Tardivel, A., Legare, G., Boyle, B., et al. (2013). An Improved genotyping by sequencing (GBS) approach offering increased versatility and efficiency of SNP discovery and genotyping. PLoS ONE 8:e54603. doi: 10.1371/journal.pone.0054603
Sonah, H., O'Donoughue, L., Cober, E., Rajcan, I., and Belzile, F. (2015). Identification of loci governing eight agronomic traits using a GBS-GWAS approach and validation by QTL mapping in soya bean. Plant Biotechnol. J. 13, 211–221. doi: 10.1111/pbi.12249
Song, Q., Hyten, D. L., Jia, G. F., Quigley, C. V., Fickus, E. W., Nelson, R. L., et al. (2013). Development and evaluation of SoySNP50K, a high-density genotyping array for soybean. PLoS ONE 8:e54985. doi: 10.1371/journal.pone.0054985
Song, J., Liu, Z., Hong, H., Ma, Y., Tian, L., Li, X., et al. (2016). Identification and validation of loci governing seed coat color by combining association mapping and bulk segregation analysis in soybean. PLoS ONE 11:e0159064. doi: 10.1371/journal.pone.0159064
Specht, J., Chase, K., Macrander, M., Graef, G., Chung, J., Markwell, J., et al. (2001). Soybean response to water: a QTL analysis of drought tolerance. Crop Sci. 41, 493–509. doi: 10.2135/cropsci2001.412493x
Takeshima, R., Hayashi, T., Zhu, J., Zhao, C., Xu, M., Yamaguchi, N., et al. (2016). A soybean quantitative trait locus that promotes flowering under long days is identified as FT5a, a FLOWERING LOCUS T ortholog. J. Exp. Bot. 67, 5247–5258. doi: 10.1093/jxb/erw283
Tang, Y., Liu, X. L., Wang, J., Li, M., Wang, Q., Tian, F., et al. (2016). GAPIT version 2: an enhanced integrated tool for genomic association and prediction. Plant Genome 9. doi: 10.3835/plantgenome2015.11.0120
Tasma, I. M., Lorenzen, L. L., Green, D. E., and Shoemaker, R. C. (2001). Mapping genetic loci for flowering time, maturity, and photoperiod insensitivity in soybean. Mol. Breed. 8, 25–35. doi: 10.1023/A:1011998116037
Tian, F., Bradbury, P. J., Brown, P. J., Hung, H., Sun, Q., Flint-Garcia, S., et al. (2011). Genome-wide association study of leaf architecture in the maize nested association mapping population. Nat. Genet. 43, 159–162. doi: 10.1038/ng.746
Wang, Y., Gu, Y., Gao, H., Qiu, L., Chang, R., Chen, S., et al. (2016). Molecular and geographic evolutionary support for the essential role of GIGANTEAa in soybean domestication of flowering time. BMC Evol. Biol. 16:79. doi: 10.1186/s12862-016-0653-9
Wang, X., Jiang, G. L., Green, M., Scott, R. A., Song, Q., Hyten, D. L., et al. (2014). Identification and validation of quantitative trait loci for seed yield, oil and protein contents in two recombinant inbred line populations of soybean. Mol. Genet. Genomics 289, 935–949. doi: 10.1007/s00438-014-0865-x
Watanabe, S., Hideshima, R., Xia, Z. J., Tsubokura, Y., Sato, S., Nakamoto, Y., et al. (2009). Map-based cloning of the gene associated with the soybean maturity locus E3. Genetics 182, 1251–1262. doi: 10.1534/genetics.108.098772
Watanabe, S., Xia, Z. J., Hideshima, R., Tsubokura, Y., Sato, S., Yamanaka, N., et al. (2011). A Map-pased cloning strategy employing a residual heterozygous line reveals that the GIGANTEA gene is involved in soybean maturity and flowering. Genetics 188, 395–407. doi: 10.1534/genetics.110.125062
Wen, Z., Boyse, J. F., Song, Q., Cregan, P. B., and Wang, D. (2015). Genomic consequences of selection and genome-wide association mapping in soybean. BMC Genomics 16:671. doi: 10.1186/s12864-015-1872-y
Xia, Z., Tsubokura, Y., Hoshi, M., Hanawa, M., Yano, C., Okamura, K., et al. (2007). An integrated high-density linkage map of soybean with RFLP, SSR, STS, and AFLP markers using a single F-2 population. DNA Res. 14, 257–269. doi: 10.1093/dnares/dsm027
Xia, Z., Watanabe, S., Yamada, T., Tsubokura, Y., Nakashima, H., Zhai, H., et al. (2012a). Positional cloning and characterization reveal the molecular basis for soybean maturity locus E1 that regulates photoperiodic flowering. Proc. Natl. Acad. Sci. U.S.A. 109, E2155–E2164. doi: 10.1073/pnas.1117982109
Xia, Z. J., Zhai, H., Liu, B. H., Kong, F. J., Yuan, X. H., Wu, H. Y., et al. (2012b). Molecular identification of genes controlling flowering time, maturity, and photoperiod response in soybean. Plant Syst. Evol. 298, 1217–1227. doi: 10.1007/s00606-012-0628-2
Xia, Z., Zhai, H., Lu, S., Wu, H., and Zhang, Y. (2013). Recent achievement in gene cloning and functional genomics in soybean. Sci. World J. 2013:281367. doi: 10.1155/2013/281367
Yamanaka, N., Ninomiya, S., Hoshi, M., Tsubokura, Y., Yano, M., Nagamura, Y., et al. (2001). An informative linkage map of soybean reveals QTLs for flowering time, leaflet morphology and regions of segregation distortion. DNA Res. 8, 61–72. doi: 10.1093/dnares/8.2.61
Yan, L., Hofmann, N., Li, S. X., Ferreira, M. E., Song, B. H., Jiang, G. L., et al. (2017). Identification of QTL with large effect on seed weight in a selective population of soybean with genome-wide association and fixation index analyses. BMC Genomics 18:529. doi: 10.1186/s12864-017-3922-0
Yang, G., Zhai, H., Wu, H. Y., Zhang, X. Z., Lu, S. X., Wang, Y. Y., et al. (2017). QTL effects and epistatic interaction for flowering time and branch number in a soybean mapping population of JapanesexChinese cultivars. J. Integr. Agric. 16, 1900–1912. doi: 10.1016/S2095-3119(16)61539-3
Yao, D., Liu, Z. Z., Zhang, J., Liu, S. Y., Qu, J., Guan, S. Y., et al. (2015). Analysis of quantitative trait loci for main plant traits in soybean. Genet. Mol. Res. 14, 6101–6109. doi: 10.4238/2015.June.8.8
Zhai, H., Lu, S., Liang, S., Wu, H., Zhang, X., Liu, B., et al. (2014a). GmFT4, a homolog of FLOWERING LOCUS T, is positively regulated by E1 and functions as a flowering repressor in soybean. PLoS ONE 9:e89030. doi: 10.1371/journal.pone.0089030
Zhai, H., Lu, S., Wang, Y., Chen, X., Ren, H., Yang, J., et al. (2014b). Allelic variations at four major maturity E genes and transcriptional abundance of the E1 gene are associated with flowering time and maturity of soybean cultivars. PLoS ONE 9:e97636. doi: 10.1371/journal.pone.0097636
Zhai, H., Lu, S., Wu, H., Zhang, Y., Zhang, X., Yang, J., et al. (2015). Diurnal expression pattern, allelic variation, and association analysis reveal functional fFeatures of the E1 gene in control of photoperiodic flowering in soybean. PLoS ONE 10:e0135909. doi: 10.1371/journal.pone.0135909
Zhang, J., Song, Q., Cregan, P. B., Nelson, R. L., Wang, X., Wu, J., et al. (2015). Genome-wide association study for flowering time, maturity dates and plant height in early maturing soybean (Glycine max) germplasm. BMC Genomics 16:217. doi: 10.1186/s12864-015-1441-4
Zhang, D., Sun, L., Li, S., Wang, W., Ding, Y., Swarm, S., et al. (2018). Elevation of soybean seed oil content through selection for seed coat shininess. Nat. Plants 4, 30–35. doi: 10.1038/s41477-017-0084-7
Zhang, X., Zhai, H., Wang, Y., Tian, X., Zhang, Y., Wu, H., et al. (2016). Functional conservation and diversification of the soybean maturity gene E1 and its homologs in legumes. Sci. Rep. 6:29548. doi: 10.1038/srep29548
Zhang, D., Zhao, M., Li, S., Sun, L., Wang, W., Cai, C., et al. (2017). Plasticity and innovation of regulatory mechanisms underlying seed oil content mediated by duplicated genes in the palaeopolyploid soybean. Plant J. 90, 1120–1133. doi: 10.1111/tpj.13533
Zhao, C., Takeshima, R., Zhu, J., Xu, M., Sato, M., Watanabe, S., et al. (2016). A recessive allele for delayed flowering at the soybean maturity locus E9 is a leaky allele of FT2a, a FLOWERING LOCUS T ortholog. BMC Plant Biol. 16:20. doi: 10.1186/s12870-016-0704-9
Keywords: soybean, GWAS, flowering time, protein content, oil content, population structure, FarmCPU
Citation: Wang Y, Li Y, Wu H, Hu B, Zheng J, Zhai H, Lv S, Liu X, Chen X, Qiu H, Yang J, Zong C, Han D, Wen Z, Wang D and Xia Z (2018) Genotyping of Soybean Cultivars With Medium-Density Array Reveals the Population Structure and QTNs Underlying Maturity and Seed Traits. Front. Plant Sci. 9:610. doi: 10.3389/fpls.2018.00610
Received: 10 November 2017; Accepted: 17 April 2018;
Published: 09 May 2018.
Edited by:
Alma Balestrazzi, University of Pavia, ItalyReviewed by:
Umesh K. Reddy, West Virginia State University, United StatesMartin Mascher, Leibniz-Institut für Pflanzengenetik und Kulturpflanzenforschung (IPK), Germany
Marco Maccaferri, Department of Agricultural Sciences, University of Bologna, Italy
Copyright © 2018 Wang, Li, Wu, Hu, Zheng, Zhai, Lv, Liu, Chen, Qiu, Yang, Zong, Han, Wen, Wang and Xia. This is an open-access article distributed under the terms of the Creative Commons Attribution License (CC BY). The use, distribution or reproduction in other forums is permitted, provided the original author(s) and the copyright owner are credited and that the original publication in this journal is cited, in accordance with accepted academic practice. No use, distribution or reproduction is permitted which does not comply with these terms.
*Correspondence: Zheng-jun Xia, eGlhemhqQGlnYS5hYy5jbg==
†These authors have contributed equally to this work.