- National Engineering and Technology Center for Information Agriculture, Key Laboratory for Crop System Analysis and Decision Making, Ministry of Agriculture, Jiangsu Key Laboratory for Information Agriculture, Jiangsu Collaborative Innovation Center for Modern Crop Production, Nanjing Agricultural University, Nanjing, China
Plant nitrogen concentration (PNC) is a critical indicator of N status for crops, and can be used for N nutrition diagnosis and management. This work aims to explore the potential of multispectral imagery from unmanned aerial vehicle (UAV) for PNC estimation and improve the estimation accuracy with hyperspectral data collected in the field with a hyperspectral radiometer. In this study we combined selected vegetation indices (VIs) and texture information to estimate PNC in rice. The VIs were calculated from ground and aerial platforms and the texture information was obtained from UAV-based multispectral imagery. Two consecutive years (2015 & 2016) of experiments were conducted, involving different N rates, planting densities and rice cultivars. Both UAV flights and ground spectral measurements were taken along with destructive samplings at critical growth stages of rice (Oryza sativa L.). After UAV imagery preprocessing, both VIs and texture measurements were calculated. Then the optimal normalized difference texture index (NDTI) from UAV imagery was determined for separated stage groups and the entire season. Results demonstrated that aerial VIs performed well only for pre-heading stages (R2 = 0.52–0.70), and photochemical reflectance index and blue N index from ground (PRIg and BNIg) performed consistently well across all growth stages (R2 = 0.48–0.65 and 0.39–0.68). Most texture measurements were weakly related to PNC, but the optimal NDTIs could explain 61 and 51% variability of PNC for separated stage groups and entire season, respectively. Moreover, stepwise multiple linear regression (SMLR) models combining aerial VIs and NDTIs did not significantly improve the accuracy of PNC estimation, while models composed of BNIg and optimal NDTIs exhibited significant improvement for PNC estimation across all growth stages. Therefore, the integration of ground-based narrow band spectral indices with UAV-based textural information might be a promising technique in crop growth monitoring.
Introduction
Nitrogen (N) is one of the most important elements for crop growth. In order to ensure high yield, excess N fertilizer was put into the field, which results in severe N leaching and environmental pollution (Ju et al., 2006; Li et al., 2007). Therefore, precision N management is urgent and essential, which might bring significant economic and environmental benefits. Precision N status monitoring is prerequisite for determining optimal N rate. Traditional method for monitoring crop N status was through destructive sampling and chemical analysis, which was tedious and time-consuming. As a nondestructive method, remote sensing techniques have been applied to monitor N status in the past several decades (Filella et al., 1995; Tarpley et al., 2000; Hansen and Schjoerring, 2003; Zhu et al., 2007; Stroppiana et al., 2009; Inoue et al., 2012; Yao et al., 2015; Sun et al., 2017).
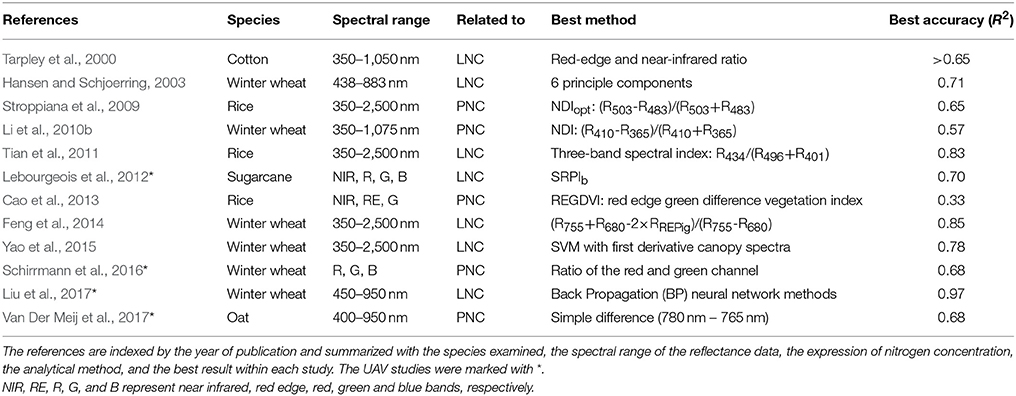
Crop N concentration estimation with remote sensing was studied widely (Table 1), and the majority of studies used ground-based hyperspectral reflectance. Vegetation indices (VIs) were commonly used to estimate crop leaf/plant N concentration (LNC/PNC), and new VIs were proposed to improve estimation accuracy (Stroppiana et al., 2009; Tian et al., 2011; Wang et al., 2012). One of the early studies found the red edge and near-infrared ratio performed best in cotton LNC estimation among all the combinations with 20 spectral bands (Tarpley et al., 2000). Matrix plots were commonly used to find the best performing normalized difference vegetation index (NDVI) or ratio vegetation index (RVI) among thousands of wavelength combinations. For example, Zhu et al. (2007) found that the combination of 1,220 and 610 nm as either simple ratio (SR) or a normalized difference index (NDI) performed best in LNC estimation of rice and wheat crops. Tian et al. (2013) reported that SR (R553, R537) was the optimal combination for rice LNC estimation. Stroppiana et al. (2009) proposed an optimal normalized difference index [NDIopt = (R553-R483)/(R553+R483)], which was strongly correlated with rice PNC (R2 = 0.65), but least correlated with leaf area index (LAI) and aboveground biomass. For PNC estimation in winter wheat, the optimal NDVI or RVI was composed of reflectance in 400 and 370 nm (Li et al., 2010b). Furthermore, Tian et al. (2011) proposed two new three-band spectral indices [R434/(R496+R401) and R705/(R717+ R491)] to estimate rice LNC with hyperspectral reflectance data, and these two indices significantly outperformed other existing VIs in LNC estimation. Similarly, (R924-R703+2 × R423)/(R924+R703-2 × R423) was proposed with hyperspectral data and proved to be significantly related to LNC of both rice and wheat crops (Wang et al., 2012).
From the aforementioned studies, the majority focused on crops LNC and a limited number of studies were on plant N concentration (PNC), which has been taken as an effective indicator of crop N status. When actual PNC is compared to the critical N concentration at the corresponding biomass level, the N nutrition index (NNI) could be obtained for determining crop N nutrition status and guiding N applications for a target yield (Lemaire et al., 2008; Zhao et al., 2016; Ata-Ul-Karim et al., 2017). Therefore, precise PNC estimation is critical and useful for in-season site-specific N management.
Ground-based spectral data has been used to estimate crop PNC, but the estimation accuracy is not so satisfactory (Stroppiana et al., 2009; Li et al., 2010b), especially with a multispectral sensor (Li et al., 2010a; Cao et al., 2013). Because canopy reflectance is dominated by leaves and hardly receive the signal of stem and panicle (after heading stage), and PNC is consisted of leaf, stem and panicle concentration, thus canopy reflectance is hard to explain the variation of PNC. Moreover, ground-based platform is often limited by low spatial coverage and unfavorable weather conditions.
Recently, unmanned aerial vehicles (UAVs) offer particular advantages over other remote sensing platforms with a high spatial resolution, a spectral resolution adapted for a specific purpose (here PNC estimation) and an appropriate revisit time. UAVs have been applied in many aspects related to crop growth monitoring, as summarized in Yang et al. (2017), but few studies about rice N status monitoring could be found. Because canopy structural variable (e.g., LAI and biomass) might greatly influence the interaction between leaves and radiation, which covered the signal of N status, thus making difficult to estimate N concentration (Stroppiana et al., 2009). Furthermore, previous studies have reported that the ultraviolet, violet and blue regions were shown to be consistently important for PNC estimation (Stroppiana et al., 2009; Li et al., 2010b). However, bands from these regions are generally missing from the current UAV-based sensors. Hunt et al. (2005) found crop N nutrition status could not be detectable with UAV RGB imagery. Lebourgeois et al. (2012) used two sensors (RGB and NIR-G-B cameras) mounted on a UAV to detect N status in sugarcane and found the best correlation of LNC with a broadband version of the simple ratio pigment index (SRPIb) (R2 = 0.7) among all indices examined. Furthermore, Schirrmann et al. (2016) found the ratio of the red and green channels from UAV RGB imagery correlated well (R2 = 0.68) with PNC in winter wheat for only the heading stage. Liu et al. (2017) used UAV imagery to estimate LNC in wheat winter successfully with the cost of hyperspectral camera. Whether rice PNC could be estimated with UAV multispectral imagery at multiple stages remains to be addressed.
Texture is an important characteristic used to identify objects or regions of interest in any images (Haralick et al., 1973), and it has been commonly used for image classification (Laliberte and Rango, 2009; Murray et al., 2010). Since the beginning of twenty-first century, texture from satellite imagery has been used to estimate aboveground biomass but only for the forest (Lu and Batistella, 2005; Sarker and Nichol, 2011; Kelsey and Neff, 2014). UAV imagery takes the advantage of ultra-high spatial resolution, which indicates that texture is also an important source of information (Podest and Saatchi, 2002; Dell'Acqua and Gamba, 2003). However, texture in the UAV imagery was rarely used for crop growth monitoring. In addition, whether combining ground hyperspectral data could compensate for the limited bands of UAV sensors and improve the estimation accuracy of PNC is worthy to be explored. Therefore, the objectives of this study were (i) to explore the capability of UAV-based multispectral imagery in rice PNC estimation with spectral and textural information, and (ii) to improve PNC estimation accuracy through combining ground hyperspectral data and UAV imagery.
Materials and Methods
Experimental Designs
Two consecutive years' experiments were conducted in the experimental station of National Engineering and Technology Center for Information Agriculture (NETCIA) located in Rugao, Jiangsu province, China (120°45′ E,32°16′ N). The predominant soil type was loam and the organic carbon concentration in the soil was 12.95 g kg−1. The annual average temperature, number of precipitation days, and precipitation were about 14.6°C, 121.3, and 1055.5 mm, respectively. In 2015, two rice (Oryza sativa L.) cultivars were planted with four levels of nitrogen fertilizer (0 (N0), 100 (N1), 200 (N2) and 300 (N3) kg N ha−1 as urea). The treatments with minimum and maximum N rates (N0 and N3) were planted with one density (22 plants m−2) and the treatments with intermediate N rates (N1 and N2) were planted with two densities (13 and 22 plants m−2). The experiment was organized in 36 plots (5 × 6 m for each plot) with a completely randomized block design (Figure 1).
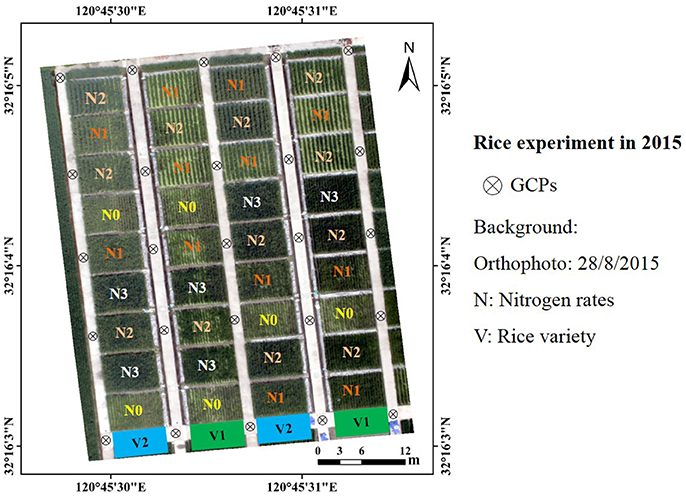
Figure 1. Experimental design: rice experiment at the experimental station of National Engineering and Technology Center for Information Agriculture in 2015; GCPs, ground control points used for band registration and GPS georeferencing.
In 2016, the experiment was similar to the former with same rice varieties. Two rice cultivars were planted with two densities (13 and 22 plants m−2) and three levels of nitrogen fertilizer (0 (N0), 150 (N1) and 300 (N2) kg N ha−1 as urea). In these two experiments, other field management practices during the experiment followed the local production standards.
Data Collection
Ground Sampling and N Concentration Determination
Ground destructive samplings were taken along with the UAV campaigns at rice critical growth stages (Table 2). Three hills of rice plants were randomly selected from the sampling region of each plot and separated into different organs (leaf, stem and panicle). All the samples were oven-dried for 30 min at 105°C and later at 80°C to a constant weight, then weighed, ground and stored in plastic bags for chemical analysis. The total N content in different organs was determined with the micro-Keldjahl method (Bremner and Mulvaney, 1982). The plant N concentration was calculated as:
Where LW, SW and PW are the dry weights of leaf, stem and panicle samples, respectively. LN, SN and SN are the N concentrations of leaf, stem and panicle samples, respectively.
UAV Image Acquisition
The UAV used in this study was a multi-rotor Mikrokopter OktoXL (Zhou et al., 2017). It was equipped with a six-band multispectral (MS) camera, a 1.3 Megapixel (1,280 × 1,024) Tetracam mini-MCA6 (Tetracam, Chatsworth, CA, USA) camera with center wavelengths of 490, 550, 680, 720, 800, and 900 nm. The angular field of view is 38.26° × 30.97°, resulting in an individual image footprint of 69 × 55 m, and a nominal resolution of 0.054 m ground sampling distance at 100 m above ground level.
Images were captured at one frame per 3 s and saved as a 10 bit RAW format. Camera settings were adjusted to lighting conditions and set to a fixed exposure for each flight. After the flight, only one image (covering all the 36 plots) was selected for post analysis due to the small study area. All the flights were executed in stable ambient light conditions between 11:00 a.m. and 1:30 p.m.
Field Spectral Measurements
Rice canopy spectral reflectance was collected with an ASD FieldSpec Pro spectrometer (Analytical Spectral Devices, Boulder, CO, USA) with a 25° field of view. The spectral range was 350–2,500 nm, with a 1.4 nm sampling interval between 350 and 1050 nm and a 2 nm sampling interval between 1,000 and 2,500 nm. All the spectral measurements were taken at a height of 1.0 m above the rice canopy from 11:00 a.m. to 1:00 p.m. local time. Three observation points were fixed in each plot and each point was measured five times with the ASD spectrometer. The average of those measurements represented the reflectance spectrum of each plot. Calibration measurements were taken with a white reference panel every 10 min.
UAV Imagery Processing
UAV images were processed in IDL/ENVI environment (Exelis Visual Information Solutions, Boulder, Colorado, USA) and the image preprocessing workflows followed Zhou et al. (2017). Later, band registration was taken with the 25 ground control points (GCPs) to obtain an image with six spectral bands. Radiation correction was conducted with an empirical line correction method (Smith and Milton, 1999; Zhou et al., 2017) by using the six flat calibration canvas at different reflectance intensities (Figure 1). The reflectance of each plot was represented by the average of reflectance values over the non-sampling area of the plot.
Calculation of Vegetation Indices
In this study, canopy spectral reflectance acquired from aerial and ground platforms was used to calculate a number of vegetation indices (Table 3), which were reported to be well correlated with N or chlorophyll concentration. Because multispectral images had only six spectral bands, only NDVI, CIG, CIRE, OSAVI and VIopt were calculated with UAV imagery.
Texture Analysis
Gray level co-occurrence matrix (GLCM) was the most commonly used texture algorithm (Haralick et al., 1973), and employed to test the potential of texture analysis of UAV images on PNC estimation. After the radiation correction was conducted, eight GLCM-based texture measurements [e.g., mean (MEA), variance (VAR), homogeneity (HOM), contrast (CON), dissimilarity (DIS), entropy (ENT), second moment (SEM) and correlation (COR)] were computed with a window size (3 × 3 pixels) in the direction of 45° using the ENVI software. Texture analysis was taken on five bands without 900 nm due to the close correlation between the reflectance of two near infrared bands (data not shown).
Since compared with spectral reflectance data, VIs were shown to reduce the influence of canopy geometry, soil background, illumination angles and atmospheric conditions when estimating biophysical properties (Tucker, 1979; Huete et al., 1985). Therefore, we assumed that texture index with ratio or normalization of texture measurements might have the same function. Then a normalized difference texture index (NDTI = (T1-T2)/(T1+T2) was proposed, where T1 and T2 was random texture measurement from the five bands). In order to select an appropriate texture combination, the correlation between PNC and NDTI was tested by using all possible combinations of texture.
Statistical Analysis
The data collected from the two-year experiment were pooled to examine the relationships of PNC with VIs, NDTIs and the combinations with simple linear regression (SLR) and stepwise multiple linear regression (SMLR). In order to simplify the estimation model, the number of variables in multiple linear regression (MLR) models was set no more than two. The statistical analysis was executed in Graph-Pad Prism (GraphPad Software Inc., San Diego, CA, USA, 1996) and SPSS 20.0 software (SPSS INC., Chicago, IL, USA, 2002).
The established models were validated with all the data using a k-fold (k = 10) cross-validation procedure, and evaluated by the differences in the root mean square error (RMSE) and the relative RMSE (RRMSE). The RMSE and RRMSE were calculated using Equations (2, 3), respectively:
Where , Pi and Oi were the observed, predicted and mean values of rice PNC, respectively, and n was the number of samples.
Results
Performance of Spectral Vegetation Indices
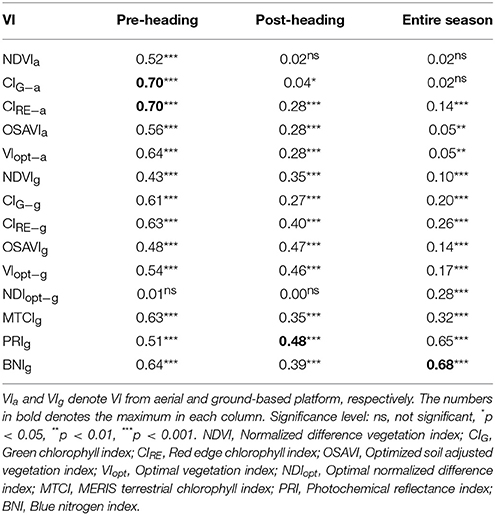
Table 4 shows the simple linear relationships between PNC and VIs from two platforms. For aerial VIs, NDVIa, and OSAVIa exhibited moderate performance and CIG−a and CIRE−a performed equally well and best amongst all VIs for pre-heading stages. For post-heading stages and the entire season, all aerial VIs were weakly related to PNC with the highest R2 of 0.28 and 0.14, respectively.
For ground VIs, the majority of VIs only performed well for pre-heading stages. OSAVIg and VIopt−g showed no significant difference in PNC estimation before or after heading stage, while PRIg and BNIg exhibited equal performance cross all growth stages. Compared with VIs from ground-based platform, aerial VIs performed better for pre-heading stages and worse for post-heading stages and entire season (Figure 2).
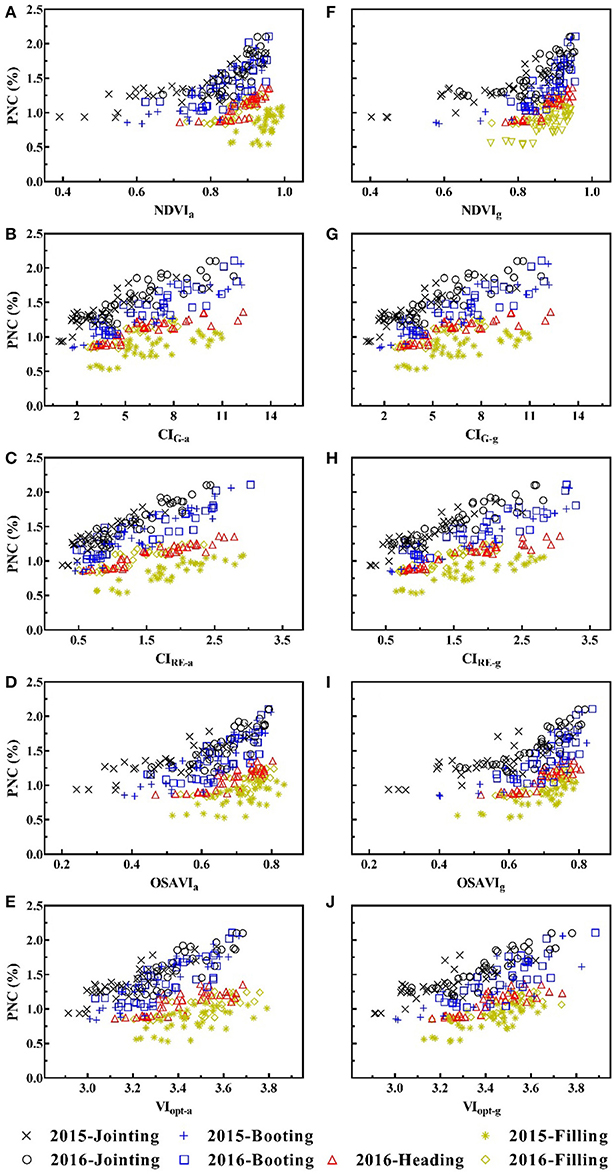
Figure 2. Plant nitrogen concentration (PNC, %) plotted against counterpart vegetation indices from two platforms: (A) NDVIa; (B) CIRE−a; (C) CIG−a; (D) OSAVIa; (E) VIopt−a; (F) NDVIg; (G) CIRE−g; (H) CIG−g; (I) OSAVIg; (J) VIopt−g. The dashed line is fitted for all data points.
Performance of Texture Features and Texture Indices
The relationships between PNC and texture measurements of all spectral bands were found to be poor across all growth stages, though stronger correlation was observed with MEA800 (R2 = 0.51), MEA800 (R2 = 0.41) and HOM720 (R2 = 0.42) for pre-heading, post-heading stages and entire season, respectively (Supplementary Table 1). Compared with individual texture measurements, NDTIs performed significantly better in PNC estimation across all growth stages (Table 5). NDTI1, composed by MEA800 and MEA720, performed best in PNC estimation for the pre-heading stages. For post-heading stages, the top eight best-performing NDTIs were mainly composed by texture measurements from red edge and near infrared bands. The top one was NDTI9 with MEA800 and DIS720, explaining 61% variability of PNC for the post-heading stages. Similar to the result for post-heading stages, NDTIs showing close relationship with PNC for entire season were all composed of texture measurements in 720 and 800 nm. NDTI17 could explain 50% variability of PNC, which was superior to other NDTIs.
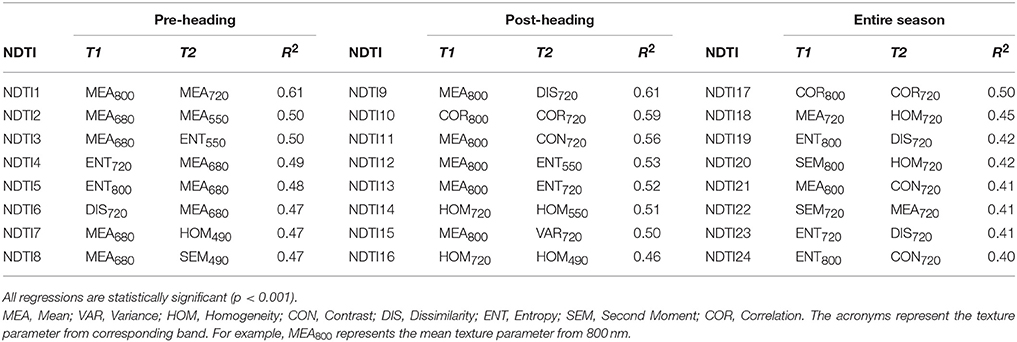
Table 5. Simple linear relationship between PNC and the top eight best-performing normalized difference texture indices (R2).
Performance of VI and NDTI Combinations
Table 6 shows the best performance of SMLR models combining VIs and NDTIs. Combining NDTIs and aerial VIs, SMLR models did not show significant improvement in comparison to the optimal VI or NDTI with SLR models across all growth stages. The optimal model for pre-heading stages was still composed of CIRE−g with SLR, while the MLR models for post-heading and entire season were all consisted of the top two best-performing NDTIs.
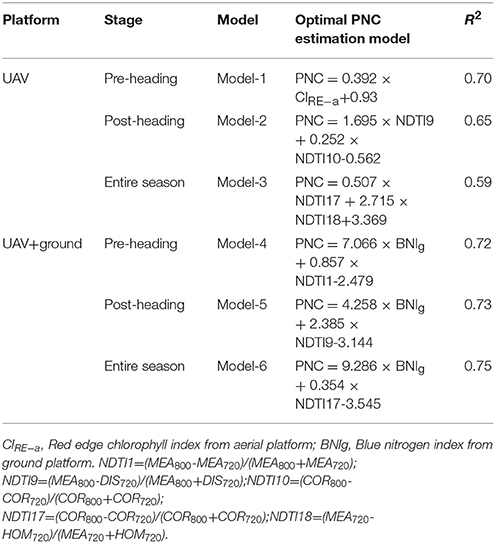
Table 6. Plant nitrogen concentration (PNC) estimates derived using UAV imagery texture indices and spectral vegetation indices from aerial or ground platform with stepwise multiple linear regression.
However, when combining NDTIs and groud-based VIs, the performance of MLR models improved significantly across all growth stages. Interestingly, all the models were consisted of optimal NDTI and BNI, explaining 72, 73, and 75% variability of PNC for pre-headings stages, post-heading stages and entire season, respectively. Therefore, the combination of ground-based VIs and NDTIs with MLR models could be taken as an efficient approach in PNC estimation.
Model Validation
All the regression models were cross-validated with all data and the best performing VI from both platforms, texture index and MLR models were shown in Figures 3–5 for different stage groups. For pre-heading stages, all the selected models had close performance and MLR models showed minor advantages (Figure 3). The highest estimation accuracy (RMSE = 0.16 and RRMSE = 10.92%) was obtained by model-4, composed of NDTI1 and BNIg. For post-heading stages, NDTIs exhibited higher estimation accuracy than that of VIs (Figure 4B). Significant improvements were achieved by MLR models, and model-2 produced lowest RMSE and RRMSE (Figure 4E) following with model-5 consisted of NDTI9 and BNIg (Figure 4F). For entire season, PRIg and BNIg performed equally well and were superior to other VIs and NDTIs (Figures 5C,D). However, compared with these two VIs, Model-6 combining BNIg and NDTI17 yielded higher estimation accuracy with RMSE and RRMSE of 0.17 and 13.49%, respectively (Figure 5F).
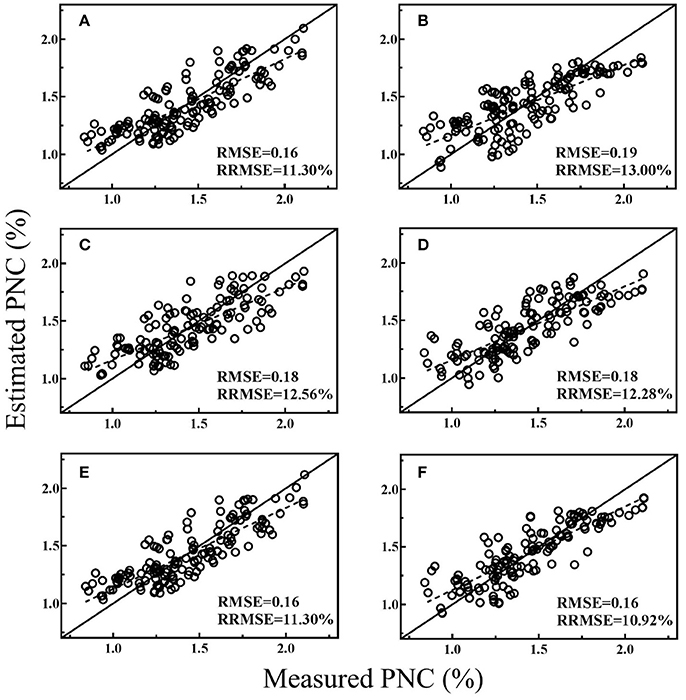
Figure 3. Cross-validation scatter plots for measured PNC vs. estimated PNC derived from selected models for pre-heading stages: CIRE−a (A), NDTI1 (B), MTCIg (C), BNIg (D), Model-1 (E), and Model-4 (F).
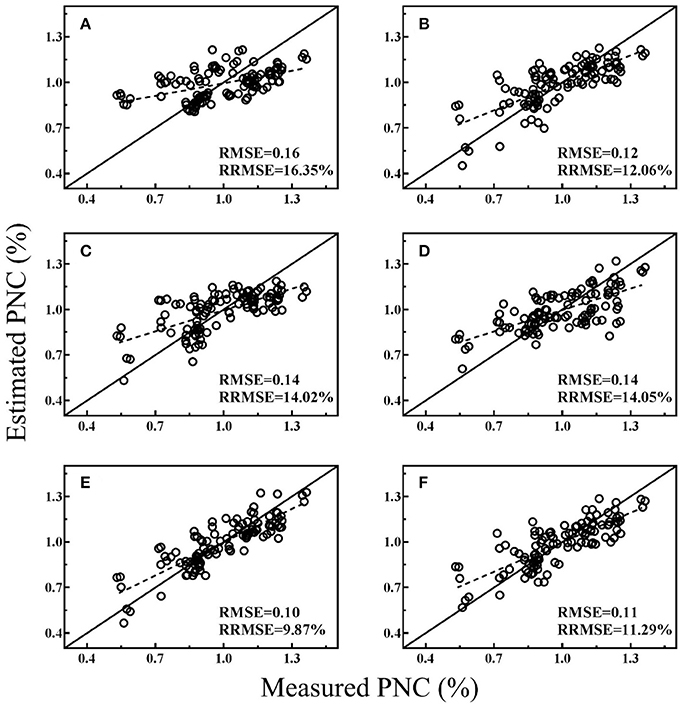
Figure 4. Cross-validation scatter plots for measured PNC vs. estimated PNC derived from selected models for post-heading stages: CIRE−a (A), NDTI9 (B), OSAVIg (C), PRIg (D), Model-2 (E), and Model-5 (F).
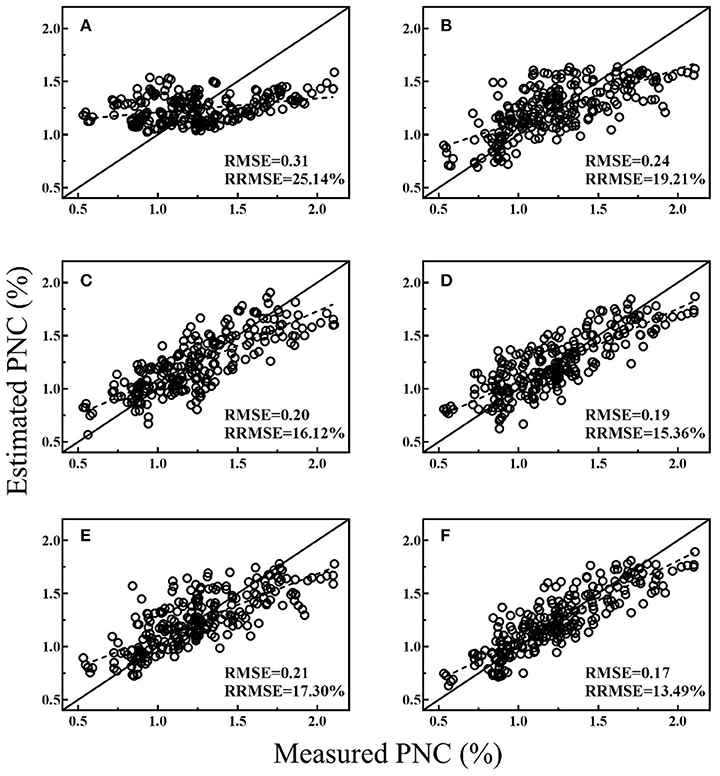
Figure 5. Cross-validation scatter plots for measured PNC vs. estimated PNC derived from selected models for entire season: CIRE−a (A), NDTI17 (B), PRIg (C), BNIg (D), Model-3 (E), and Model-6 (F).
Discussion
Different Performance of VIs From Two Platforms
In this study, counterpart VIs from UAV imagery performed better than that from ground, but only for pre-heading stages (Figure 2). That might be caused by the variation in reflectance extracted from different sampling sizes. For UAV MS imagery, reflectance was extracted from the non-sampling area (around 12 m2) within each plot. While the field view of the ASD spectrometer placed at 1 m above the canopy was a circle in a diameter of approximately 0.22 m (around 0.15 m2). For post-heading stages, the canopy was more homogenous and the ground-based VIs outperformed the aerial VIs in PNC estimation.
The best-performing VI was CIRE−a before heading stage, which was expected and in agreement with the findings of Li et al. (2010b). At the early growth stages, biophysical parameters (e.g. biomass, LAI) varied greatly and masked the contribution of chlorophyll and N to the canopy reflectance (Haboudane et al., 2002), thus VIs consisted of red edge and NIR bands performed better than other indices (Table 4). However, aerial VIs had weak capability in PNC estimation for post-heading and the entire season, because those VIs, which are sensitive to the canopy structure, became saturated in high biomass level and hard to monitor N status. Furthermore, ground-based VIs performing consistently well in PNC estimation across all growth stages were composed of blue and green bands (Stroppiana et al., 2009; Yu et al., 2013). UAV-based multispectral cameras were equipped with limited bands with broad bandwidth, thus they can not obtain those N concentration specific VIs. Hunt et al. (2005) also found that UAV RGB imagery could not be used to detect crop nutrient status due to the improper bands.
Ground hyperspectral data takes the great advantage of abundant spectral bands and narrow bandwidth, thus it offers more options for VI computation. In this study PRIg and BNIg exhibited good performance across all growth stages, because they were computed with blue and green bands that are specifically sensitive to N concentration, which is consistent with findings from Stroppiana et al. (2009) and Yu et al. (2013). However, the highest correlation between PNC and ground VI was not so satisfactory for post-heading stages with R2 < 0.50. That might be because the presence of panicles changed the plot structure and affected the spectral signature (Gnyp et al., 2014). In a UAV-based grain yield prediction study, Zhou et al. (2017) also found that the estimation accuracy of grain yield decreased as rice panicles emerged from the sheath at heading stage. Therefore, it is essential to improve PNC estimation for post-heading stages and the entire season with new data source.
Difference in Texture Features Between Stage Groups
Texture can be used as a description of spectral feature distribution in spectral image space (Ning, 1998), which might be interpreted with biological meaning as for the spectral features. In this study we found most texture measurements were weakly related to PNC across all growth stages (Supplementary Table 1), which corresponds well to the findings of Lu and Batistella (2005). Besides, Jin et al. (2015) found only MEA texture feature was useful in residue cover estimation in maize. MEA490 and MEA680 performed well only for pre-heading stages, because reflectance in the visible bands varied slightly at low chlorophyll content levels and saturated at high levels (Hatfield et al., 2008). As a result, the texture features from the visible bands fluctuated slightly and it was difficult to use visible texture features for detecting the variation in PNC. HOM720 and MEA800 performed well at late growth stages and the majority of texture features at 720 nm were superior to other texture features for the entire season. That might due to the fact that the reflectance at red edge and NIR bands had a broader variation through the growing season and the texture features from these bands could explain more variation in PNC.
However, texture indices performed significantly better than individual texture measurements, which might be similar to advantages of vegetation index that could reduce the influence of canopy geometry and soil background over raw reflectance data (Tucker, 1979; Huete et al., 1985). Sarker and Nichol (2011) also reported that the ratio of texture parameters could improve the estimation accuracy of forest biomass. Given different stage groups, the optimal NDTI was different, because canopy structure varies as rice plants grow, and leaves dominate the canopy before heading stage. After that panicles emerge out from the sheath, which makes the canopy reflectance more complicated due to the difference in leaf and panicle reflectance (Tang et al., 2007). Interestingly, the optimal NDTIs across all growth stages consisted of texture parameters from red edge and NIR bands (Table 5). Since they are good indicators of canopy chlorophyll (Gitelson et al., 2003b, 2005), LAI and biomass (Gitelson et al., 2003a), the NDTIs from those bands performed well in PNC estimation.
Actually, it is still complicated to select an appropriate texture involving window sizes and image bands for a specific research topic. Although numerous studies have reported texture features were useful in biomass (Lu, 2005; Sarker and Nichol, 2011), LAI (Wulder et al., 1998) and residue cover (Jin et al., 2015) estimation, the underlying mechanism of selected texture measurement remains to be better understood. Those questions need to be clarified in the future studies.
Advantages of Combining Ground-Based Spectral Data and UAV Imagery
The combination of spectral data and texture measurements has been proposed to improve biomass (Lu, 2005; Eckert, 2012), LAI (Wulder et al., 1998) and residue cover (Jin et al., 2015) estimation with satellite data. In present study, we found that the improvement was not pronounced in PNC estimation by combining aerial VIs and NDTIs due to the limited bands of UAV sensors. However, the combination of ground-based VIs and NDTIs improved PNC estimation significantly across all growth stages, especially for the post-heading stages (Table 6). Because ground-based hyperspectral data is available for those VIs that are highly sensitive to N concentration. In addition, texture analysis could efficiently address saturation problems associated with vegetation indices in dense canopies (Kelsey and Neff, 2014) and detect variable canopy structural characteristics well (Eckert, 2012). MLR models integrated both techniques and could explain 75% variability of PNC for entire season with a general model, which was superior to the findings of Li et al. (2010b) and Stroppiana et al. (2009). Therefore, a combination of UAV imagery and ground hyperspectral data could be taken as an effective hybrid method for N status monitoring in rice. Future work will focus on transferring such an integrative methodology presented here to other agronomic parameters estimation.
Implications for Future Applications
Most previous studies estimated crop PNC with ground-based hyperspectral data, but the estimation accuracy was moderate (Stroppiana et al., 2009; Li et al., 2010b). Although high accuracy of PNC estimation in rice was obtained by Yu et al. (2013), the optimal estimation model was established by six bands, which was difficult for practical application. In this study we found that CIRE from UAV multispectral imagery could be used to estimate PNC for pre-heading stages. That indicates that UAV imagery might have potential for N diagnose and management based on PNC, before the heading stage (Ding et al., 2003; Cao et al., 2016). Texture information from UAV imagery could be useful for PNC estimation for post-heading stages, which shows that grain yield and quality is predictable with PNC at late growth stages. Therefore, UAV multispectral imagery could be used to estimate rice PNC with independent models for different stage groups.
Furthermore, the hybrid method combining ground-based hyperspectral data and UAV imagery could accurately estimate PNC across all growth stages. As crop growth monitoring techniques develop, multiple sensors from different platforms have been integrated to collect data (Bendig et al., 2015; Tilly et al., 2015). Additionally, UAV-based hyperspectral imaging might execute this method easily. Therefore, this method is feasible and offers technique support for N diagnose and management, and grain yield and quality prediction in the future.
Conclusions
This work showed UAV-based multispectral imagery could be used to estimate rice PNC with spectral data only for pre-heading stages, but texture information from UAV imagery could be used to estimate PNC across all growth stages with moderate accuracy. PRI and BNI computed with ground-based hyperspectral data performed consistently well across all growth stages. Furthermore, the combination of ground VIs and NDTIs improved the PNC estimation significantly, but the improvement with aerial VIs and NDTIs was not pronounced. Therefore, this hybrid method with ground spectral data and UAV imagery texture information was promising in rice N status monitoring.
Future work should focus on determining optimal texture parameters involving different texture algorithms, window sizes and spectral bands. Moreover, multiple year datasets are needed to evaluate this new hybrid method to improve the robustness and applicability. Most importantly, realizing N diagnose and N management depending on PNC with presented method is more essential and anticipated.
Author Contributions
YZ and TC designed and directed the rice trials at the experimental station of NETCIA in Rugao, China. HZ and DL conducted the field measurements and the collection of samples. HZ processed the images, analyzed the samples and wrote the paper. YZ, TC, XY, and WC gave valuable comments to the manuscript and carried out critical revisions. All authors gave final approval for publication.
Funding
This work was supported by grants from the National Key Research and Development Program of China (2016YFD0300601), the National Science Fund for Distinguished Young Scholars (31725020), and the Priority Academic Program Development of Jiangsu Higher Education Institutions (PAPD).
Conflict of Interest Statement
The authors declare that the research was conducted in the absence of any commercial or financial relationships that could be construed as a potential conflict of interest.
Acknowledgments
The authors gratefully thank Kai Zhou, Xiaoqing Xu, Jiaoyang He for their great assistance in rice planting, data collection and harvesting. The authors also want to thank Dr. Xiaojun Liu for selecting rice seeds and Ms. Juan Shen for rice field management.
Supplementary Material
The Supplementary Material for this article can be found online at: https://www.frontiersin.org/articles/10.3389/fpls.2018.00936/full#supplementary-material
References
Ata-Ul-Karim, S. T., Liu, X., Lu, Z., Zheng, H., Cao, W., and Zhu, Y. (2017). Estimation of nitrogen fertilizer requirement for rice crop using critical nitrogen dilution curve. Field Crops Res. 201, 32–40. doi: 10.1016/j.fcr.2016.10.009
Bendig, J., Yu, K., Aasen, H., Bolten, A., Bennertz, S., Broscheit, J., et al. (2015). Combining UAV-based plant height from crop surface models, visible, and near infrared vegetation indices for biomass monitoring in barley. Int. J. Appl. Earth Obs. Geoinform. 39, 79–87. doi: 10.1016/j.jag.2015.02.012
Bremner, J. M., and Mulvaney, C. S. (1982). “Nitrogen-Total,” in Methods of Soil Analysis, Part 2. eds A. L. Page, R. H. Miller, and D.R. Keeney (Madison, WI: American Society of Agronomy), 595–624.
Cao, Q., Miao, Y., Shen, J., Yu, W., Yuan, F., Cheng, S., et al. (2016). Improving in-season estimation of rice yield potential and responsiveness to topdressing nitrogen application with Crop Circle active crop canopy sensor. Precision Agric. 17, 136–154. doi: 10.1007/s11119-015-9412-y
Cao, Q., Miao, Y., Wang, H., Huang, S., Cheng, S., Khosla, R., et al. (2013). Non-destructive estimation of rice plant nitrogen status with Crop Circle multispectral active canopy sensor. Field Crops Res. 154, 133–144. doi: 10.1016/j.fcr.2013.08.005
Dash, J., and Curran, P. J. (2004). The MERIS terrestrial chlorophyll index. Int. J. Remote Sens. 25, 5403–5413. doi: 10.1080/0143116042000274015
Dell'Acqua, F., and Gamba, P. (2003). Texture-based characterization of urban environments on satellite SAR images. IEEE Trans. Geosci. Remote Sens. 41, 153–159. doi: 10.1109/TGRS.2002.807754
Ding, Y.-F., Zhao, C.-H., and Wang, Q.-S. (2003). Effect of application stage of panicle fertilizer on rice grain yield and the utilization of nitrogen. J. Nanjing Agric. Univ. 26, 5–8.
Eckert, S. (2012). Improved forest biomass and carbon estimations using texture measures from WorldView-2 satellite data. Remote Sens. 4, 810–829. doi: 10.3390/rs4040810
Feng, W., Guo, B. B., Wang, Z. J., He, L., Song, X., Wang, Y. H., et al. (2014). Measuring leaf nitrogen concentration in winter wheat using double-peak spectral reflection remote sensing data. Field Crops Res. 159, 43–52. doi: 10.1016/j.fcr.2014.01.010
Filella, I., Serrano, L., Serra, J., and Penuelas, J. (1995). Evaluating wheat nitrogen status with canopy reflectance indices and discriminant analysis. Crop Sci. 35, 1400–1405. doi: 10.2135/cropsci1995.0011183X003500050023x
Gitelson, A. A., Andrés, V., Arkebauer, T. J., Rundquist, D. C., Galina, K., and Bryan, L. (2003a). Remote estimation of leaf area index and green leaf biomass in maize canopies. Geophys. Res. Lett. 30, 335–343. doi: 10.1029/2002GL016450
Gitelson, A. A., Andrés, V., Verónica, C., Rundquist, D. C., and Arkebauer, T. J. (2005). Remote estimation of canopy chlorophyll content in crops. Geophys. Res. Lett. 32, 93–114. doi: 10.1029/2005GL022688
Gitelson, A. A., Gritz, Y., and Merzlyak, M. N. (2003b). Relationships between leaf chlorophyll content and spectral reflectance and algorithms for non-destructive chlorophyll assessment in higher plant leaves. J. Plant Physiol. 160, 271–282. doi: 10.1078/0176-1617-00887
Gnyp, M. L., Miao, Y., Yuan, F., Ustin, S. L., Yu, K., Yao, Y., et al. (2014). Hyperspectral canopy sensing of paddy rice aboveground biomass at different growth stages. Field Crops Res. 155, 42–55. doi: 10.1016/j.fcr.2013.09.023
Haboudane, D., Miller, J. R., Tremblay, N., Zarco-Tejada, P. J., and Dextraze, L. (2002). Integrated narrow-band vegetation indices for prediction of crop chlorophyll content for application to precision agriculture. Remote Sens. Environ. 81, 416–426. doi: 10.1016/S0034-4257(02)00018-4
Hatfield, J., Gitelson, A. A., Schepers, J. S., and Walthall, C. (2008). Application of spectral remote sensing for agronomic decisions. Agron. J. 100, 117–131. doi: 10.2134/agronj2006.0370c
Hansen, P. M., and Schjoerring, J. K. (2003). Reflectance measurement of canopy biomass and nitrogen status in wheat crops using normalized difference vegetation indices and partial least squares regression. Remote Sens. Environ. 86, 542–553. doi: 10.1016/S0034-4257(03)00131-7
Haralick, R. M., Shanmugam, K., and Dinstein, I. H. (1973). Textural features for image classification. IEEE Trans. Syst. Man Cybern. 3, 610–621. doi: 10.1109/TSMC.1973.4309314
Huete, A. R., Jackson, R. D., and Post, D. F. (1985). Spectral response of a plant canopy with different soil backgrounds. Remote Sens. Environ. 17, 37–53. doi: 10.1016/0034-4257(85)90111-7
Hunt, E. R., Cavigelli, M., Cst, D., Mcmurtrey, J. I., and Walthall, C. L. (2005). Evaluation of digital photography from model aircraft for remote sensing of crop biomass and nitrogen status. Precision Agric. 6, 359–378. doi: 10.1007/s11119-005-2324-5
Inoue, Y., Sakaiya, E., Zhu, Y., and Takahashi, W. (2012). Diagnostic mapping of canopy nitrogen content in rice based on hyperspectral measurements. Remote Sens. Environ. 126, 210–221. doi: 10.1016/j.rse.2012.08.026
Jin, X., Ma, J., Wen, Z., and Song, K. (2015). Estimation of maize residue cover using Landsat-8 OLI image spectral information and textural features. Remote Sens. 7, 14559–14575. doi: 10.3390/rs71114559
Ju, X. T., Kou, C. L., Zhang, F. S., and Christie, P. (2006). Nitrogen balance and groundwater nitrate contamination: comparison among three intensive cropping systems on the North China Plain. Environ. Pollut. 143, 117–125. doi: 10.1016/j.envpol.2005.11.005
Kelsey, K., and Neff, J. (2014). Estimates of aboveground biomass from texture analysis of Landsat imagery. Remote Sens. 6, 6407–6422. doi: 10.3390/rs6076407
Laliberte, A. S., and Rango, A. (2009). Texture and scale in object-based analysis of subdecimeter resolution Unmanned Aerial Vehicle (UAV) imagery. IEEE Trans. Geosci. Remote Sens. 47, 761–770. doi: 10.1109/TGRS.2008.2009355
Lebourgeois, V., Bégué, A., Labbé, S., Houlès, M., and Martiné, J. F. (2012). A light-weight multi-spectral aerial imaging system for nitrogen crop monitoring. Precision Agric. 13, 525–541. doi: 10.1007/s11119-012-9262-9
Lemaire, G., Jeuffroy, M.-H., and Gastal, F. (2008). Diagnosis tool for plant and crop N status in vegetative stage: theory and practices for crop N management. Eur. J. Agron. 28, 614–624. doi: 10.1016/j.eja.2008.01.005
Li, F., Miao, Y., Chen, X., Zhang, H., Jia, L., and Bareth, G. (2010a). Estimating winter wheat biomass and nitrogen status using an active crop sensor. Intell. Autom. Soft Computi. 16, 1221–1230.
Li, F., Miao, Y., Hennig, S. D., Gnyp, M. L., Chen, X., Jia, L., et al. (2010b). Evaluating hyperspectral vegetation indices for estimating nitrogen concentration of winter wheat at different growth stages. Precision Agric. 11, 335–357. doi: 10.1007/s11119-010-9165-6
Li, X., Hu, C., Delgado, J. A., Zhang, Y., and Ouyang, Z. (2007). Increased nitrogen use efficiencies as a key mitigation alternative to reduce nitrate leaching in north china plain. Agric. Water Manag. 89, 137–147. doi: 10.1016/j.agwat.2006.12.012
Liu, H., Zhu, H., and Wang, P. (2017). Quantitative modelling for leaf nitrogen content of winter wheat using UAV-based hyperspectral data. Int. J. Remote Sens. 38, 2117–2134. doi: 10.1080/01431161.2016.1253899
Lu, D. (2005). Aboveground biomass estimation using Landsat TM data in the Brazilian Amazon. Int. J. Remote Sens. 26, 2509–2525. doi: 10.1080/01431160500142145
Lu, D., and Batistella, M. (2005). Exploring TM image texture and its relationships with biomass estimation in Rondônia, Brazilian Amazon. Acta Amazon. 35, 249–257. doi: 10.1590/S0044-59672005000200015
Murray, H., Lucieer, A., and Williams, R. (2010). Texture-based classification of sub-Antarctic vegetation communities on Heard Island. Int. J. Appl. Earth Obs. Geoinform. 12, 138–149. doi: 10.1016/j.jag.2010.01.006
Ning, S. (1998). Remote sensing image texture analysis and fractal assessment. J. Wuhan Techn. Univ. Surv. Mapp. 4, 370–373.
Peñuelas, J., Gamon, J. A., Fredeen, A. L., Merino, J., and Field, C. B. (1994). Reflectance indices associated with physiological changes in nitrogen- and water-limited sunflower leaves. Remote Sens. Environ. 47, 135–146. doi: 10.1016/0034-4257(94)90136-8
Podest, E., and Saatchi, S. (2002). Application of multiscale texture in classifying JERS-1 radar data over tropical vegetation. Int. J. Remote Sens. 23, 1487–1506. doi: 10.1080/01431160110093000
Reyniers, M., Walvoort, D. J., and De Baardemaaker, J. (2006). A linear model to predict with a multi-spectral radiometer the amount of nitrogen in winter wheat. Int. J. Remote Sens. 27, 4159–4179. doi: 10.1080/01431160600791650
Rondeaux, G., Steven, M., and Baret, F. (1996). Optimization of soil-adjusted vegetation indices. Remote Sens. Environ. 55, 95–107. doi: 10.1016/0034-4257(95)00186-7
Rouse, J. W., Haas, R. W., Schell, J. A., Deering, D. W., and Harlan, J. C. (1974). Monitoring the Vernal Advancement and Retrogradation (Greenwave effect) of Natural Vegetation. NASA/GSFCT Type III final report. Nasa
Sarker, L. R., and Nichol, J. E. (2011). Improved forest biomass estimates using ALOS AVNIR-2 texture indices. Remote Sens. Environ. 115, 968–977. doi: 10.1016/j.rse.2010.11.010
Schirrmann, M., Giebel, A., Gleiniger, F., Pflanz, M., Lentschke, J., and Dammer, K.-H. (2016). Monitoring agronomic parameters of winter wheat crops with low-cost UAV imagery. Remote Sens. 8:706. doi: 10.3390/rs8090706
Smith, G. M., and Milton, E. J. (1999). The use of the empirical line method to calibrate remotely sensed data to reflectance. In. J. Remote Sens. 20, 2653–2662. doi: 10.1080/014311699211994
Stroppiana, D., Boschetti, M., Brivio, P. A., and Bocchi, S. (2009). Plant nitrogen concentration in paddy rice from field canopy hyperspectral radiometry. Field Crops Res. 111, 119–129. doi: 10.1016/j.fcr.2008.11.004
Sun, J., Yang, J., Shi, S., Chen, B., Du, L., Gong, W., et al. (2017). Estimating rice leaf nitrogen concentration: influence of regression algorithms based on passive and active leaf reflectance. Remote Sens. 9:951. doi: 10.3390/rs9090951
Tang, Y. L., Huang, J. F., Cai, S. H., and Wang, R. C. (2007). Nitrogen contents of rice panicle and paddy by hyperspectral remote sensing. Pak. J. Biol. Sci. 10, 4420–4425. doi: 10.3923/pjbs.2007.4420.4425
Tarpley, L., Reddy, K. R., and Sassenrath-Cole, G. F. (2000). Reflectance indices with precision and accuracy in predicting cotton leaf nitrogen concentration. Crop Sci. 40, 1814–1819. doi: 10.2135/cropsci2000.4061814x
Tian, Y. C., Gu, K. J., Chu, X., Yao, X., Cao, W. X., and Zhu, Y. (2013). Comparison of different hyperspectral vegetation indices for estimating canopy leaf nitrogen accumulation in rice. Plant Soil 376, 193–209. doi: 10.1007/s11104-013-1937-0
Tian, Y., Yao, X., Yang, J., Cao, W., Hannaway, D., and Zhu, Y. (2011). Assessing newly developed and published vegetation indices for estimating rice leaf nitrogen concentration with ground-and space-based hyperspectral reflectance. Field Crops Res. 120, 299–310. doi: 10.1016/j.fcr.2010.11.002
Tilly, N., Aasen, H., and Bareth, G. (2015). Fusion of plant height and vegetation indices for the estimation of barley biomass. Remote Sens. 7, 11449–11480. doi: 10.3390/rs70911449
Tucker, C. J. (1979). Red and photographic infrared linear combinations for monitoring vegetation. Remote Sens. Environ. 8, 127–150. doi: 10.1016/0034-4257(79)90013-0
Van Der Meij, B., Kooistra, L., Suomalainen, J., Barel, J. M., and De Deyn, G. B. (2017). Remote sensing of plant trait responses to field-based plant-soil feedback using UAV-based optical sensors. Biogeosciences 14, 733-749 doi: 10.5194/bg-14-733-2017
Wang, W., Yao, X., Yao, X., Tian, Y., Liu, X., Ni, J., et al. (2012). Estimating leaf nitrogen concentration with three-band vegetation indices in rice and wheat. Field Crops Res. 129, 90–98. doi: 10.1016/j.fcr.2012.01.014
Wulder, M. A., Ledrew, E. F., Franklin, S. E., and Lavigne, M. B. (1998). Aerial image texture information in the estimation of northern deciduous and mixed wood forest leaf area index (LAI). Remote Sens. Environ. 64, 64–76. doi: 10.1016/S0034-4257(97)00169-7
Yang, G., Liu, J., Zhao, C., Li, Z., Huang, Y., Yu, H., et al. (2017). Unmanned aerial vehicle remote sensing for field-based crop phenotyping: current status and perspectives. Front. Plant Sci. 8:1111. doi: 10.3389/fpls.2017.01111
Yao, X., Huang, Y., Shang, G., Zhou, C., Cheng, T., Tian, Y., et al. (2015). Evaluation of six algorithms to monitor wheat leaf nitrogen concentration. Remote Sens. 7, 14939–14966. doi: 10.3390/rs71114939
Yu, K., Li, F., Gnyp, M. L., Miao, Y., Bareth, G., and Chen, X. (2013). Remotely detecting canopy nitrogen concentration and uptake of paddy rice in the Northeast China Plain. ISPRS J. Photogr. Remote Sens. 78, 102–115. doi: 10.1016/j.isprsjprs.2013.01.008
Zhao, B., Liu, Z., Ata-Ul-Karim, S. T., Xiao, J., Liu, Z., Qi, A., et al. (2016). Rapid and nondestructive estimation of the nitrogen nutrition index in winter barley using chlorophyll measurements. Field Crops Res. 185, 59–68. doi: 10.1016/j.fcr.2015.10.021
Zhou, X., Zheng, H. B., Xu, X. Q., He, J. Y., Ge, X. K., Yao, X., et al. (2017). Predicting grain yield in rice using multi-temporal vegetation indices from UAV-based multispectral and digital imagery. ISPRS J. Photogr. Remote Sens. 130, 246–255. doi: 10.1016/j.isprsjprs.2017.05.003
Keywords: UAV, multispectral imagery, ground hyperspectral data, vegetation index, texture index, PNC, rice
Citation: Zheng H, Cheng T, Li D, Yao X, Tian Y, Cao W and Zhu Y (2018) Combining Unmanned Aerial Vehicle (UAV)-Based Multispectral Imagery and Ground-Based Hyperspectral Data for Plant Nitrogen Concentration Estimation in Rice. Front. Plant Sci. 9:936. doi: 10.3389/fpls.2018.00936
Received: 18 March 2018; Accepted: 11 June 2018;
Published: 03 July 2018.
Edited by:
Trevor Garnett, University of Adelaide, AustraliaReviewed by:
Nicolas Virlet, Rothamsted Research (BBSRC), United KingdomShawn Carlisle Kefauver, University of Barcelona, Spain
Copyright © 2018 Zheng, Cheng, Li, Yao, Tian, Cao and Zhu. This is an open-access article distributed under the terms of the Creative Commons Attribution License (CC BY). The use, distribution or reproduction in other forums is permitted, provided the original author(s) and the copyright owner(s) are credited and that the original publication in this journal is cited, in accordance with accepted academic practice. No use, distribution or reproduction is permitted which does not comply with these terms.
*Correspondence: Yan Zhu, eWFuemh1QG5qYXUuZWR1LmNu
 Hengbiao Zheng
 Tao Cheng
 Dong Li
 Xia Yao
 Yongchao Tian
 Weixing Cao
 Yan Zhu