 Yuxuan Yuan1,2
 Zbyněk Milec3
 Philipp E. Bayer1,2
 Jan Vrána3
 Jaroslav Doležel3David Edwards1,2William Erskine2,4
 Parwinder Kaur2,4,5*
- 1School of Biological Sciences, The University of Western Australia, Perth, WA, Australia
- 2Institute of Agriculture, The University of Western Australia, Perth, WA, Australia
- 3Institute of Experimental Botany, Centre of the Region Haná for Biotechnological and Agricultural Research, Olomouc, Czechia
- 4Centre for Plant Genetics and Breeding, School of Agriculture and Environment, The University of Western Australia, Perth, WA, Australia
- 5Telethon Kids Institute, Perth, WA, Australia
We selected two genetically diverse subspecies of the Trifolium model species, subterranean clover cvs. Daliak and Yarloop. The structural variations (SVs) discovered by Bionano optical mapping (BOM) were validated using Illumina short reads. In the analysis, BOM identified 12 large-scale regions containing deletions and 19 regions containing insertions in Yarloop. The 12 large-scale regions contained 71 small deletions when validated by Illumina short reads. The results suggest that BOM could detect the total size of deletions and insertions, but it could not precisely report the location and actual quantity of SVs in the genome. Nucleotide-level validation is crucial to confirm and characterize SVs reported by optical mapping. The accuracy of SV detection by BOM is highly dependent on the quality of reference genomes and the density of selected nickases.
Introduction
Subterranean clover is the key forage legume in Australia, producing valued feed for livestock on a sown area of more than 29 million hectares (Nichols et al., 2013). As with other legumes, symbiotic nitrogen fixation in subterranean clover contributes to soil improvement. Subterranean clover is diploid (2n = 2x = 16) with a genome size around 556 Mb/1C. Its inbreeding nature, annual habit, and well-assembled reference genome (subterraneum) have established it as a model for Trifolium (Nichols et al., 2013). Based on morphology, genetic, and cytogenetic data, subterranean clover is classified into three subspecies: subterraneum, yanninicum, and brachycalycinum (Katznelson and Morley, 1965a,b). The subspecies differ morphologically, enabling them to adapt to different soil environments, e.g., ssp. subterraneum and ssp. yanninicum are adapted to moderately acidic soils, with ssp. subterraneum found on well-drained soils and ssp. yanninicum adapted to water-enriched soils (Francis and Devitt, 1969). In contrast, ssp. brachycalycinum is adapted to dry and neutral-to-alkaline soils that contain cracks or stones facilitating burr development. In this study, we examined the sympatric subspecies subterraneum and yanninicum to check the performance of optical mapping in structural variation (SV) detection and validate the findings using short read sequencing.
Structural variations are genomic alterations in sequence size, copy number, orientation or chromosomal location between individuals (Feuk et al., 2006). They are important genetic features that enrich genetic diversity and lead to important phenotypes (Escaramis et al., 2015).
We selected the Trifolium model species, subterranean clover (Trifolium subterraneum L.), with a high-quality reference and high-resolution Bionano optical maps (BOM) for two genetically diverse subspecies. These BOM findings were then validated by high coverage Illumina short read data generated for the two subtypes.
Materials and Methods
Purification of Cell Nuclei
Suspensions of intact cell nuclei were prepared following Vrána et al. (2016). Approximately 20 g each of mature dry seeds of ssp. subterraneum cultivar Daliak and ssp. yanninicum cultivar Yarloop were germinated at 25°C on moist paper towels in a dark environment. When the roots reached 2–3 cm in length, they were excised about 1 cm from the root tip, fixed in (2% v/v) formaldehyde at 5°C for 20 min, and subsequently washed three times with Tris buffer (5 min each time). The root tips (∼40/sample) were excised and transferred to 1 ml IB buffer (Šimková et al., 2003), in which cell nuclei were isolated using a homogenizer at 13,000 rpm for 18 s. Large debris was removed by filtering through 50-μm nylon mesh, and the nuclei in suspension were stained with DAPI (2 μg ml-1).
Preparation of High Molecular Weight (HMW) DNA
High molecular weight (HMW) DNA was prepared according to Šimková et al. (2003) with modifications. Four batches of 700,000 G1-phase nuclei each were sorted into 660 μl IB buffer in 1.5 ml polystyrene tubes using a FACSAria II SORP flow cytometer and sorter (BD Biosciences, San Jose, CA, United States). One 20 μL agarose miniplug was prepared from each batch of nuclei. The miniplugs were treated by proteinase K (Roche, Basel, Switzerland), washed in wash buffer (10 mM Tris, 50 mM EDTA, pH 8.0) four times, and subsequently five times in TE buffer (10 mM Tris, 1 mM EDTA, pH 8.0). After the plugs had been melted for 5 min at 70°C and solubilized with GELase (Epicentre, Madison, WI, United States) for 45 min, DNA was purified by drop dialysis against TE buffer (Merck Millipore, Billerica, MA, United States) for 90 min.
Construction of Bionano Optical Map
The latest genome assembly of T. subterraneum (cv. Daliak) (Kaur et al., 2017) was used as a reference and digested in silico using Knickers (v1.5.5). Four available nickases (Nt.BspQI: GCTCTTC, Nb.BbvCI: CCTCAGC, Nb.BsmI: GAATGC, Nb.BsrDI: GCAATG) were used to check the frequency of enzyme restriction sites in the reference genome with Nt.BspQI, being the most appropriate enzyme to nick the HMW DNA with the expected frequency of 7.1 sites per 100 kb. In all Bionano experiments, Nt.BspQI was used. The DNA was labeled and stained following the manufacturer’s NLRS protocol as described in Kaur et al. (2017). Four runs on the Bionano Irys® instrument (30 cycles/run) were carried for subspecices yannicum (cv. Yarloop) to achieve sufficient genome coverage (∼425 ×).
The dedicated Bionano IrysView (v2.5.1.29842), Bionano tools (v5122), Bionano scripts (v5134) and runBNG (Yuan et al., 2017b) were used to de novo assemble cv. Yarloop single molecule optical maps. Before de novo assembly, molecule quality was checked by running the Molecule Qlty Report (MQR) in Bionano IrysView using cv. Yarloop raw BOM data and the digested reference genomes. In the alignment parameter settings, the p-value (–T) was set to 1.81 × 10-08 and the number of iterations (–M) was set to 5. On receipt of the MQR, we followed the instruction of parameter settings from BioNano Genomics and adjusted the de novo assembly parameters from the default false positive density (–FP) 1.5 to 1.67, default negative rate (–FN) 0.15 to 0.09, default scalingSD (–sd) 0.0 to 0.25, default siteSD (–sf) 0.2 to 0.15, and default initial assembly p-value (–T) 1 × 10⁻⁹ to 1.81 × 10-08.
Structural Variation Detection by BOM Validated Using Illumina Short Reads
After de novo assembly, runBNG was used for SV calling with default parameter settings (medium configration settings from Bionano Genomics). To check the accuracy of the SVs detected, we followed the pipeline from Shelton et al. (2015) using the default, strict and relaxed parameters in optical mapping and then performed SV calling. To further confirm the findings, we selected short paired-end reads for validation. The plants were grown in the field at Shenton Park, Western Australia (31°57′ S, 115°50′ E) and the genomic DNA was extracted from a single plant of cv. Yarloop and cv. Daliak - representatives of two subterranean clover subspecies. Truseq Illumina libraries were prepared with an insert size of approximately 550 b and the short paired-end reads were generated using Illumina HiSeq 2000 at coverage of 48 × in cv. Yarloop and 56 × in cv. Daliak [the same dataset used in Kaur et al. (2017)]. Reads from both cultivars were aligned to the latest nucleotide reference (cv. Daliak) respectively (Kaur et al., 2017) using Speedseq (v0.1.0) (Chiang et al., 2015). Results were visualized using the integrative genomics viewer (IGV) (v2.3.91) (Robinson et al., 2011). Nucleotide-level SV calling was performed using Lumpy (v0.2.11) (Layer et al., 2014) by analyzing the mapping result from Speedseq (v0.1.0) (Chiang et al., 2015). The settings of Speedseq reads mapping were the deafult. The program used from Lumpy was ‘lumpyexpress’. The nucleotide reference was the same one used in the Speedseq reads mapping. The short sequence reads of cv. Yarloop were the same as used in reads mapping. When large-scale regions containing SVs from BOM were identified, we checked the corresponding regions to see if these regions contain SVs from the results of Lumpy and the visualization by IGV.
Results
De Novo Assembly of cv. Yarloop Optical Map
A total of 1,083,671 single molecule maps (directly from the Irys platform without filtering) were generated with a total length of 235.5 Gb (∼48 × genome coverage), of which the molecule N50 was 212.7 kb, and the average label density was 7.5 per 100 kb (Table 1). After filtering maps < 150 kb, 958,136 single molecule maps remained with a total length of 212.7 Gb (∼385 × genome coverage), of which the molecule N50 was 218.6 kb, and the average label density was 8.3 per 100 kbp. Using the filtered single molecule maps, 375,975 single molecule maps were finally de novo assembled to generate 377 consensus maps. The total length of the generated consensus maps was 475 Mb (∼89% of the total length of the reference genome) with a map N50 of 1.8 Mb.
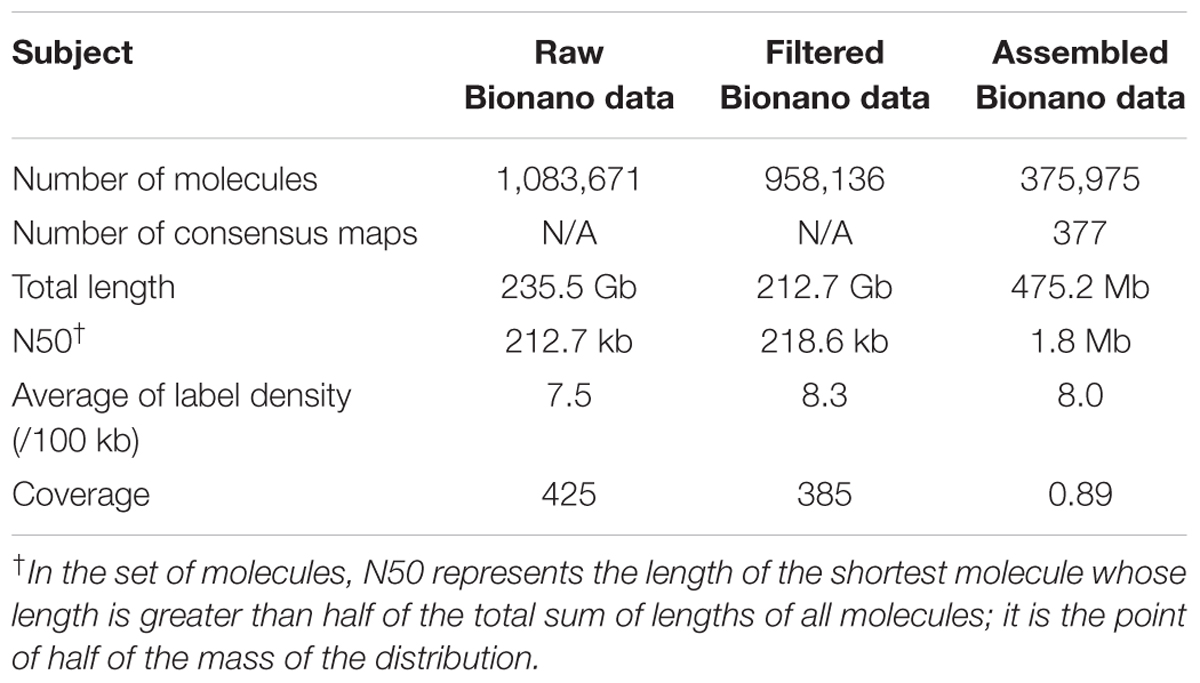
TABLE 1. Statistics of cv. Yarloop Bionano optical maps.
SVs Assessment With BOM Validated by Illumina Short Reads
The mapping rate between cv. Yarloop Bionano consensus maps and the cv. Daliak NGS reference is 7.4%. Bionano SV calling between cv. Yarloop Bionano molecule maps and the cv. Daliak reference genome identified 12 regions (tens of kb regions) containing deletions and 19 containing insertions in cv. Yarloop compared to cv. Daliak (Supplementary Figure S1). The average deletoin length was 6.2 kb (Supplementary Table S1) and in these regions, 9.7% of the sequences were assembly gaps (Ns). The average length of the insertions was 8.04 kb, and the percentage of unknown sequences in these regions was 3.6%. Compared to the average coverage of all cv. Yarloop Bionano consensus maps (95.64 ± 23.52), the average coverge of the deletion and insertion regions in BioNano consensus maps is 101.12 ± 6.75. When checking the SVs called from the pipeline presented by Shelton et al. (2015) the results are consistent with our findings. Speedseq/Lumpy SV calling detected 20,887 deletions, 115 inversions, and 1,331 duplications in cv. Yarloop. Among those 20,887 deletions there are 71 (on average 2,533 b) that supported the 12 regions (on average 6,196 b) implied by BOM in cv. Daliak (Supplementary Figure S2 and Supplementary Table S2). Lumpy did not detect any insertions.
Discussion
Although whole genome sequencing has been widely used to detect SVs, it is challenging to characterize large-scale SVs in a genome, particular for large-scale insertions. Current sequencing technologies can produce sequencing reads from a hundred to tens of thousands base pairs (Yuan et al., 2017a). However, they are still not long enough to span some variant regions (Li et al., 2011). Optical mapping, as an alternative, has promised the accuracy in SV detection (Li et al., 2017).
In the de novo assembly of cv. Yarloop Bionano single molecule maps, the total length of the consensus maps accounted for ∼89% of the estimated T. subterraneum genome size contrary to our expectation of ∼100%. This incomplete assembly could be caused by the low-quality single molecule map filtering step or the single map fragmentation due to the close proximity of Nt.BspQI restriction sites leading to DNA double-strand breaks in some DNA regions (Hastie et al., 2013). If the fragmented Bionano maps are repeats, they may collapse due to sharing the same nicking site partten. If there is no restriction sites in the fragmented maps, in the de novo assembly, they could be excluded leading to a smaller consensus map size.
The mapping rate between cv. Yarloop Bionano optical maps to the Daliak NGS reference indicates that the genomes of cv. Yarloop and cv. Daliak are diverged and most of the genome cannot be aligned. This could be an explanation that only 12 deletions and 19 insertions were detected. When checking the avergae coverage of the detected SV regions and the average coverage of the Yarloop Bionano consenus maps, the results suggeste that our findings are reliable. To get rid of the bias from one paramter settings in the de novo assembly step, we followed the pipeline presented by Shelton et al. (2015). Our results have also been supported.
In the Lumpy SV calling, we identified 71 small deletions in the 12 large-scale regions reported by BOM (Figure 1). While, the total length of the 71 deleted genomic regions reported by Lumpy was close to the total length reported by BOM (71.7 kb vs. 74.4 kb respectively), some length differences remained, probably due to the incorrect gap size or misassemblies in the reference genome, or also could be due to the incomplete SV calling in Lumpy. Interestingly, the gaps in the detected SV regions which were highly likely caused by collapse in the repetitive regions, were complemented by the Bionano super-scaffolding process for the generation of the advanced reference assembly (Kaur et al., 2017).
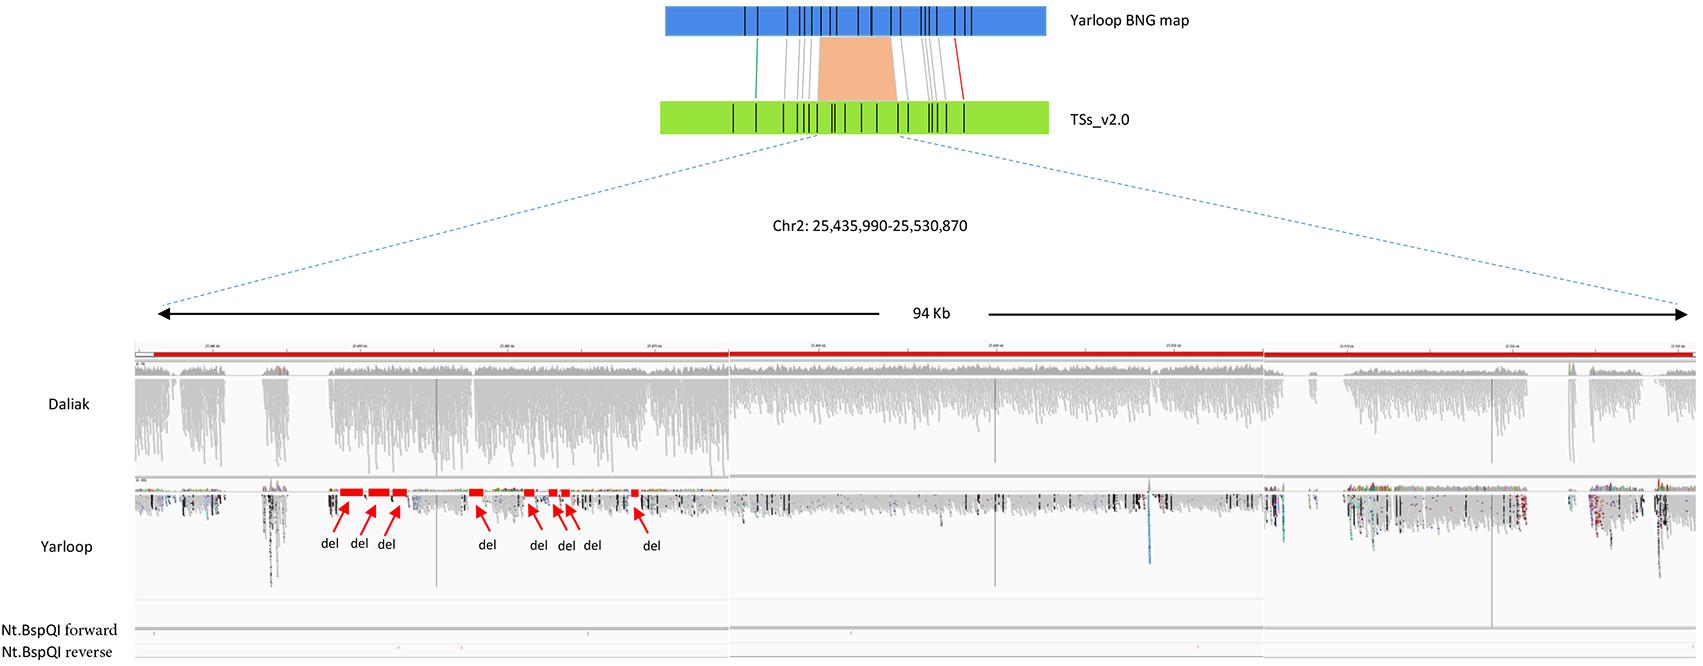
FIGURE 1. An example of deletions detected by Bionano optical mapping with nucleotide sequences validation. The region reported by Bionano contains deletion(s) in cv. Yarloop compared to the reference genome between location 25,435,990 b and 25,530,870 b in chromosome 2. The gray bars in this figure represents short reads aligned to the reference. Other color dots means different SNPs. Nt.BspQI forward represents sequence: GCTCTTC and Nt.BspQI reverse represents sequence: GAAGAGC. The size of the deletion reported by Bionano is 6.6 kb. From the nucleotide-level validation, eight small deletions (displayed as ‘del’) were visualized in the IGV with no sequence reads aligned to the reference genome. The total size of those eight small deletions is 6.1 kb. The eight small regions were supported in the Lumpy SV calling. The regions having zero coverage are the gaps in the reference.
No insertions were reported by Lumpy in the SV calling, it is probable that those sequences being novel in cv. Yarloop compared to the reference assembly based on the cv. Daliak. When nucleotide level alignments were carried out using short sequence reads from the cv. Yarloop with the cv. Daliak, Yarloop reads from genomic regions not present in the reference assembly (either Yarloop-specific or unassembled in the reference) could not be mapped. As such, SV could not be called in these regions. Such novel sequences were grouped as unmapped sequences, earlier abandoned by Lumpy in SV calling. This issue has also been reported previously by (Xia et al., 2016) for most reference based SV calling methods, which cannot efficiently report large-scale insertions if there are many novel sequences in the examined individuals.
Conclusion
Based on the physical location of nicking sites, optical mapping provides an attractive method to detect SVs. Single molecule maps produced by optical mapping are long enough to span most of the large and complex genome regions that traditional sequencing technologies are unable to achieve. However, optical mapping has some limitations in discovering the precise location and actual number of SVs owing to enzyme physical locations. NGS is useful to characterize SVs identified by optical mapping.
Although optical mapping provides the total size of SVs in a detected region, the total size of those SVs can be misreported due to the inaccurate gap size in the reference genome and/or absent enzyme restriction site information in the gap regions. To improve SV detection and characterization, a high-quality reference genome is crucial. In the absence of a high-quality reference genome, possible nucleotide-level validation of those identified SV regions is recommended to assess the accuracy of SV calling in optical mapping.
Availability of Data
All raw nucleotide data and Bionano data are under BioProject PRJNA404013.
Author Contributions
PK, DE, PB, and YY conceived and designed the research. ZM, JV, and JD performed the Bionano Irys® System genome mapping experiments. YY performed the bioinformatics analysis, prepared the figures and wrote the manuscript with contributions from PK, PB, ZM, WE, DE, JD, and JV. All authors read and approved this manuscript.
Funding
This study was conducted by the Centre for Plant Genetics and Breeding (PGB) at The University of Western Australia (UWA) in close collaboration with Institute of Experimental Botany, Centre of the Region Haná for Biotechnological and Agricultural Research, Czech Republic. This project was also supported by grant award LO1204 from the National Program of Sustainability I and by the Czech Science Foundation (Award No. P501/12/G090).
Conflict of Interest Statement
The authors declare that the research was conducted in the absence of any commercial or financial relationships that could be construed as a potential conflict of interest.
Acknowledgments
YY was supported by the China Scholarship Council for his Ph.D. studies at the University of Western Australia. We thank Zdeňka Dubská for assistance with nuclei flow sorting, Helena Staňková for help with Bionano mapping, and Hana Šimková for advice on Bionano mapping. We acknowledge the supercomputing resources provided by the Pawsey Supercomputing Centre with funding from the Australian Government and the Government of Western Australia.
Supplementary Material
The Supplementary Material for this article can be found online at: https://www.frontiersin.org/articles/10.3389/fpls.2018.00971/full#supplementary-material
Abbreviation
BOM, Bionano optical mapping; DAPI, 4′,6-diamidino-2-phenylindole; DNA, deoxyribonucleic acid; MQR, molecule quality report; N/A, not available; NGS, next generation sequencing; SNP, single-nucleotide polymorphism; SV, structural variation.
References
Chiang, C., Layer, R. M., Faust, G. G., Lindberg, M. R., Rose, D. B., Garrison, E. P., et al. (2015). SpeedSeq: ultra-fast personal genome analysis and interpretation. Nat. Methods 12, 966–968. doi: 10.1038/nmeth.3505
Escaramis, G., Docampo, E., and Rabionet, R. (2015). A decade of structural variants: description, history and methods to detect structural variation. Brief. Funct. Genomics 14, 305–314. doi: 10.1093/bfgp/elv014
Feuk, L., Carson, A. R., and Scherer, S. W. (2006). Structural variation in the human genome. Nat. Rev. Genet. 7, 85–97. doi: 10.1038/nrg1767
Francis, C., and Devitt, A. (1969). The effect of waterlogging on the growth and isoflavone concentration of Trifolium subterraneum L. Aust. J. Agric. Res. 20, 819–825. doi: 10.1071/AR9690819
Hastie, A. R., Dong, L., Smith, A., Finklestein, J., Lam, E. T., Huo, N., et al. (2013). Rapid genome mapping in nanochannel arrays for highly complete and accurate de novo sequence assembly of the complex Aegilops tauschii genome. PLoS One 8:e55864. doi: 10.1371/journal.pone.0055864
Katznelson, J., and Morley, F. H. W. (1965a). A taxonomic revision of sect calycomorphum of the genus Trifolium. 1. The geocarpic species. Isr. J. Bot. 14, 112–134.
Katznelson, J., and Morley, F. H. W. (1965b). Speciation processes in Trifolium subterraneum L. Isr. J. Bot. 14, 15–35.
Kaur, P., Bayer, P. E., Milec, Z., Vrana, J., Yuan, Y., Appels, R., et al. (2017). An advanced reference genome of Trifolium subterraneum L. reveals genes related to agronomic performance. Plant Biotechnol. J. 15, 1034–1046. doi: 10.1111/pbi.12697
Layer, R. M., Chiang, C., Quinlan, A. R., and Hall, I. M. (2014). LUMPY: a probabilistic framework for structural variant discovery. Genome Biol. 15:R84. doi: 10.1186/gb-2014-15-6-r84
Li, L., Leung, A. K., Kwok, T. P., Lai, Y. Y. Y., Pang, I. K., Chung, G. T., et al. (2017). OMSV enables accurate and comprehensive identification of large structural variations from nanochannel-based single-molecule optical maps. Genome Biol. 18:230. doi: 10.1186/s13059-017-1356-2
Li, Y., Zheng, H., Luo, R., Wu, H., Zhu, H., Li, R., et al. (2011). Structural variation in two human genomes mapped at single-nucleotide resolution by whole genome de novo assembly. Nat. Biotechnol. 29, 723–730. doi: 10.1038/nbt.1904
Nichols, P. G. H., Foster, K. J., Piano, E., Pecetti, L., Kaur, P., Ghamkhar, K., et al. (2013). Genetic improvement of subterranean clover (Trifolium subterraneum L.). 1. Germplasm, traits and future prospects. Crop Pasture Sci. 64, 312–346. doi: 10.1071/CP13118
Robinson, J. T., Thorvaldsdottir, H., Winckler, W., Guttman, M., Lander, E. S., Getz, G., et al. (2011). Integrative genomics viewer. Nat. Biotechnol. 29, 24–26. doi: 10.1038/nbt.1754
Shelton, J. M., Coleman, M. C., Herndon, N., Lu, N., Lam, E. T., Anantharaman, T., et al. (2015). Tools and pipelines for BioNano data: molecule assembly pipeline and FASTA super scaffolding tool. BMC Genomics 16:734. doi: 10.1186/s12864-015-1911-8
Šimková, H., Číhalíková, J., Vrána, J., Lysák, M. A., and Doležel, J. (2003). Preparation of HMW DNA from plant nuclei and chromosomes isolated from root tips. Biol. Plant. 46, 369–373. doi: 10.1186/s12864-015-1911-8
Vrána, J., Cápal, P., Číhalíková, J., Kubaláková, M., and Doležel, J. (2016). Flow sorting plant chromosomes. Methods Mol. Biol. 1429, 119–134. doi: 10.1023/A:1024322001786
Xia, L. C., Sakshuwong, S., Hopmans, E. S., Bell, J. M., Grimes, S. M., Siegmund, D. O., et al. (2016). A genome-wide approach for detecting novel insertion-deletion variants of mid-range size. Nucleic Acids Res. 44:e126. doi: 10.1007/978-1-4939-3622-9_10
Yuan, Y., Bayer, P. E., Batley, J., and Edwards, D. (2017a). Improvements in genomic technologies: application to crop genomics. Trends Biotechnol. 35, 547–558. doi: 10.1093/nar/gkw481
Keywords: structural variation, optical mapping, Bionano, nucleotide validation, reference
Citation: Yuan Y, Milec Z, Bayer PE, Vrána J, Doležel J, Edwards D, Erskine W and Kaur P (2018) Large-Scale Structural Variation Detection in Subterranean Clover Subtypes Using Optical Mapping. Front. Plant Sci. 9:971. doi: 10.3389/fpls.2018.00971
Received: 14 December 2017; Accepted: 15 June 2018;
Published: 17 July 2018.
Edited by:
Fabio Marroni, Università degli Studi di Udine, ItalyReviewed by:
Bud (Bhubaneswar) Mishra, New York University, United StatesErnest Lam, Bionano Genomics, United States
Tingting Zhu, University of California, Davis, United States
Copyright © 2018 Yuan, Milec, Bayer, Vrána, Doležel, Edwards, Erskine and Kaur. This is an open-access article distributed under the terms of the Creative Commons Attribution License (CC BY). The use, distribution or reproduction in other forums is permitted, provided the original author(s) and the copyright owner(s) are credited and that the original publication in this journal is cited, in accordance with accepted academic practice. No use, distribution or reproduction is permitted which does not comply with these terms.
*Correspondence: Parwinder Kaur, cGFyd2luZGVyLmthdXJAdXdhLmVkdS5hdQ==