 Haiyan Lü1†
 Yuming Yang2†Haiwang Li3†Qijia Liu1Jianjun Zhang1
 Junyi Yin1
 Shanshan Chu1Xiangqian Zhang1Kaiye Yu1Lingling Lv1Xi Chen1
 Dan Zhang1*
- 1Collaborative Innovation Center of Henan Grain Crops, Henan Agricultural University, Zhengzhou, China
- 2National Center for Soybean Improvement, National Key Laboratory of Crop Genetics and Germplasm Enhancement, Nanjing Agricultural University, Nanjing, China
- 3College of Food Science and Technology, Henan University of Technology, Zhengzhou, China
Photosynthesis is the basis of plant growth and development, and is seriously affected by low phosphorus (P) stress. However, few studies have reported for the genetic foundation of photosynthetic response to low P stress in soybean. To address this issue, 219 soybean accessions were genotyped by 292,035 high-quality single nucleotide polymorphisms (SNPs) and phenotyped under normal and low P conditions in 2015 and 2016. These datasets were used to identify quantitative trait nucleotides (QTNs) for photosynthesis-related traits using mrMLM, ISIS EM-BLASSO, pLARmEB, FASTmrMLM, FASTmrEMMA, and pKWmEB methods. As a result, 159 QTNs within 31 genomic regions were found to be associated with four photosynthesis-related traits under different P stress conditions. Among the 31 associated regions, five (q7-2, q8-1, q9, q13-1, and q20-2) were detected commonly under both normal and low P conditions, indicating the insensitivity of these candidate genes to low P stress; five were detected only under normal P condition, indicating the sensitivity of these candidate genes to low P stress; six were detected only under low P condition, indicating the tolerantness of these candidate genes to low P stress; 20 were reported in previous studies. Around the 159 QTNs, 52 candidate genes were mined. These results provide the important information for marker-assisted breeding in soybean and further reveal the basis for the application of P tolerance to photosynthetic capacity.
Introduction
Phosphorus (P) is one of the main factors for plant growth because of its influence on cellular phosphorylation events and the synthesis of DNA and RNA (Johnston et al., 2000; Khan et al., 2009; Zhang et al., 2014b; Li et al., 2016). Nevertheless, the availability of P in soil is limited owing to the formation of organic P complexes and the fixation of P by aluminum and ferrum oxides (Vance et al., 2003; Wang et al., 2010). In the past decade, enormous efforts have been made in the dissection of the genetic mechanisms for soybean P efficiency by evaluating factors such as P concentration, root architecture (Ao et al., 2010), biomass (Li et al., 2005), and phosphatase activity (Zhang et al., 2009). Although a series of quantitative trait loci (QTLs) across all 20 chromosomes on the genome have been found to be associated with P efficiency in soybean (SoyBase, https://soybase.org), QTLs underlying photosynthetic response to low P stress have rarely been studied.
Plant productivity relies on photosynthesis, which is sensitive to low P stress (Veneklaas et al., 2012). A number of QTLs associated with photosynthesis-related traits have been detected (Yin et al., 2010a,b; Hao et al., 2012). However, the situation under the low P stress has not been considered. Recently, linkage mapping studies showed a significant genetic relationship between P efficiency and photosynthesis-related traits, such as net photosynthetic rate and transpiration rate (Li et al., 2016). In soybean, however, both the P efficiency and photosynthesis-related traits are complex quantitative traits controlled by polygenes, and most of them are genotype-specific and environment-sensitive. So far, no pleiotropic QTL for the two traits have been reported, mainly because of the relatively low mapping resolution and smaller allele effect sizes.
More recently, genome-wide association study (GWAS) has a great advantage in the dissection of genetic basis of complex traits over linkage analysis: GWAS leverages the greater number of historical recombination events, a greater number of alleles, and broader genetic variation (Yu and Buckler, 2006). Up to now this approach was widely used in multiple crops, for instance, in rice (Huang et al., 2012), soybean (Zhang et al., 2014a,b), maize (Mao et al., 2015; Wang et al., 2016c), and Arabidopsis thaliana (van Rooijen et al., 2017).
The most popular method for GWAS is mixed linear model (MLM) method (Zhang et al., 2005; Yu and Buckler, 2006). In the past decade, many MLM-based methods have been proposed to improve computational efficiency, such as CMLM (Zhang et al., 2010) and ECMLM (Li et al., 2014). However, these models are one-dimensional genome scan, which need the correction for multiple tests. The typical Bonferroni correction is often too conservative to identify many important loci with small effects. To address this problem, Wang et al. (2016b) proposed a multi-locus random-SNP-effect mixed linear model (mrMLM) method without Bonferroni correction. And then, a series of multi-locus GWAS methods have been proposed, such as ISIS EM-BLASSO (Tamba et al., 2017), pLARmEB (Zhang et al., 2017), FASTmrEMMA (Wen et al., 2018), FASTmrMLM (Tamba and Zhang, 2018), and pKWmEB (Ren et al., 2018). These methods not only improve the power and accuracy of GWAS but also identify the small-effect quantitative trait nucleotides (QTNs).
To reveal the genetic basis of photosynthetic response to low P stress in soybean, in this study, four photosynthesis-related traits under two P levels were measured for seedling plants in hydroponics across two environments, 219 soybean accessions were genotyped by 292,035 high-quality SNPs from NJAU 355 K Soy SNP array described by Wang et al. (2016a), and the two datasets were used to conduct GWAS for the above four traits. Because of the relatively smaller allelic effects, multi-locus GWAS methods as mentioned above, rather than common GWAS methods based on single marker analysis with a fixed-SNP-effect MLM, were adopted in this study.
Our objectives were: (i) to estimate the genetic variance and heritability of four photosynthesis-related traits under different P conditions; (ii) to investigate the correlations among the four traits under different P levels; (iii) to detect QTNs associated with the above four traits; and (iv) to predict their candidate genes.
Materials and Methods
Plant Materials and Hydroponics Experiments
The population for GWAS was comprised of 219 soybean accessions (including 195 landraces and 24 elite varieties) derived from 26 provinces within six ecological regions in China (latitude 53 to 24°N and longitude 134 to 97°E; Wang and Gai, 2002). The 219 soybean accessions were grown hydroponically and measured by two independent experiments in 2015 and 2016 (E1 and E2). Hydroponics experiments and phenotyping were conducted as previously described by Li et al. (2016). The controlled conditions of hydroponics was 28/20°C day/night temperature and 10 h light/14 h dark photoperiod in artificial climate chambers. The surfaces of the seeds were sterilized with chlorine, and then, the seeds were sprouted in sterile vermiculite. Next, regular soybean seedlings, whose cotyledons were expanded completely, were selected. Then, the selected seedlings were moved into modified one-half Hoagland's nutrient solution supplemented with 500 μM P (normal P, KH2PO4) for 3 days. Finally, one half of the seedlings were transferred into modified one-half Hoagland's nutrient solution supplemented with 5 μM P (low P) for 14 days, and the other half remained in the normal P condition as controls.
The photosynthesis-related traits assessed were net photosynthetic rate (Pn, μmol·m2·s−1), transpiration rate (Tr, g·m2·h−1), stomatal conductance (Co, mmol·m−2· s−1), and intercellular carbon dioxide concentration (Ci, μL·L−1) under different P conditions (normal P, low P, and the ratio of low/normal P were abbreviated as NP, LP, and L/NP, respectively) in 2015 (E1) and 2016 (E2). A LI-6400 portable photosynthesis system was used to measure the above four traits (Li Cor Inc., Lincoln, NE, USA). The phenotyping used the upper third leaf of three plants, and three replicates were measured per plant. All the traits were measured at the second trifoliolate stage. A total of 12 characteristics were analyzed in this paper: PnNP, PnLP, PnL/NP represent the net photosynthetic rates under normal P, low P, and the ratios of low/normal P, respectively; and TrNP, TrLP, TrL/NP, CoNP, CoLP, CoL/NP, CiNP, CiLP, CiL/NP represent the transpiration rates, stomatal conductance and intercellular carbon dioxide concentrations under normal P, low P, and the ratios of low/normal P, respectively.
Genotyping and Statistical Analysis of the Phenotypes
Two hundred and nineteen soybean accessions were genotyped by 292,035 SNPs derived from NJAU 355 K Soy SNP array described by Wang et al. (2016a). In other words, there was one SNP per 3.3 kb along the 20 soybean chromosomes. In the present study, SNPs with minor allele frequency (MAF) < 0.05 were deleted. Based on this rule, a total of 201,994 SNPs were used for the GWAS.
The ANOVA of the phenotypic data was carried out using the PROC GLM of SAS version 9.2 (SAS Institute, Cary, NC, USA). Genotype and environment were treated as fixed and random, respectively. The broad-sense heritability (h2) was calculated as: , where is the genotypic variance, is the phenotypic variance. SPSS Statistics 19.0 (SPSS, Inc., Chicago, IL, USA) was used to analyze the correlation coefficients among the four photosynthesis-related traits under different P conditions in the soybean.
Genome-Wide Association Studies and Prediction of Candidate Genes
Population structure of the 219 soybean accessions each with 201,994 SNPs was calculated using the STRUCTURE package (Pritchard et al., 2009). The relative kinship (K matrix) between a pair of accessions was calculated using the R package mrMLM. GWAS was performed by the R package mrMLM with six multi-locus GWAS methods: mrMLM (Wang et al., 2016b), ISIS EM-BLASSO (Tamba et al., 2017), pLARmEB (Zhang et al., 2017), FASTmrEMMA (Wen et al., 2018), FASTmrMLM (Tamba and Zhang, 2018), and pKWmEB (Ren et al., 2018). In order to get more accurate candidate genes, markers that met the criterion of LOD score ≥5 were considered to be significantly associated with the traits.
To mine the candidate genes related to soybean photosynthesis response to low P stress, the predicted genes around significantly associated QTNs were identified based on the annotation in the soybean reference genome (Wm82.a2.v1) in Phytozome v10.3 (http://phytozome.net). Then, the genes with known function annotations underlying soybean photosynthesis-related traits under different P conditions were selected as candidate genes. In addition, we also selected the previously reported QTLs from soybase (https://soybase.org) in the associated genomic regions.
Results
Phenotype for Photosynthesis-Related Traits
All the four traits under different P conditions showed approximately normal distributions (Figure 1 and Figure S1). However, the four traits under the L/NP condition were far away from normal distributions, indicating the existence of major QTNs. The coefficients of variation for the four traits under different P conditions ranged from 13.99~69.22% (Table 1). The analysis of variance showed the significant differences for the four traits between genotypes and between environments. The last two results indicated that it is suitable for this population to conduct multi-locus GWAS.
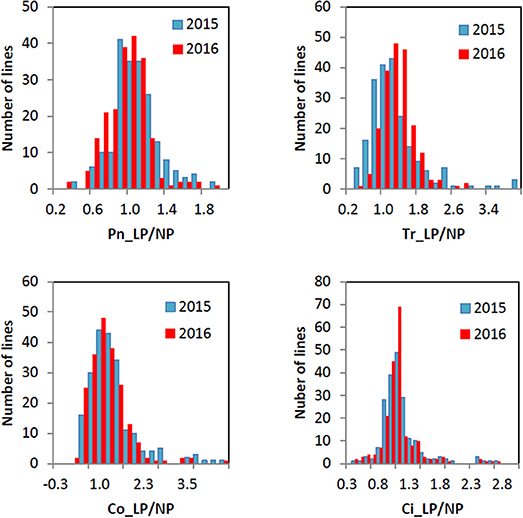
Figure 1. Histogram of the frequency distributions for the four photosynthesis-related traits in soybean under L/NP condition in 2015 and 2016.
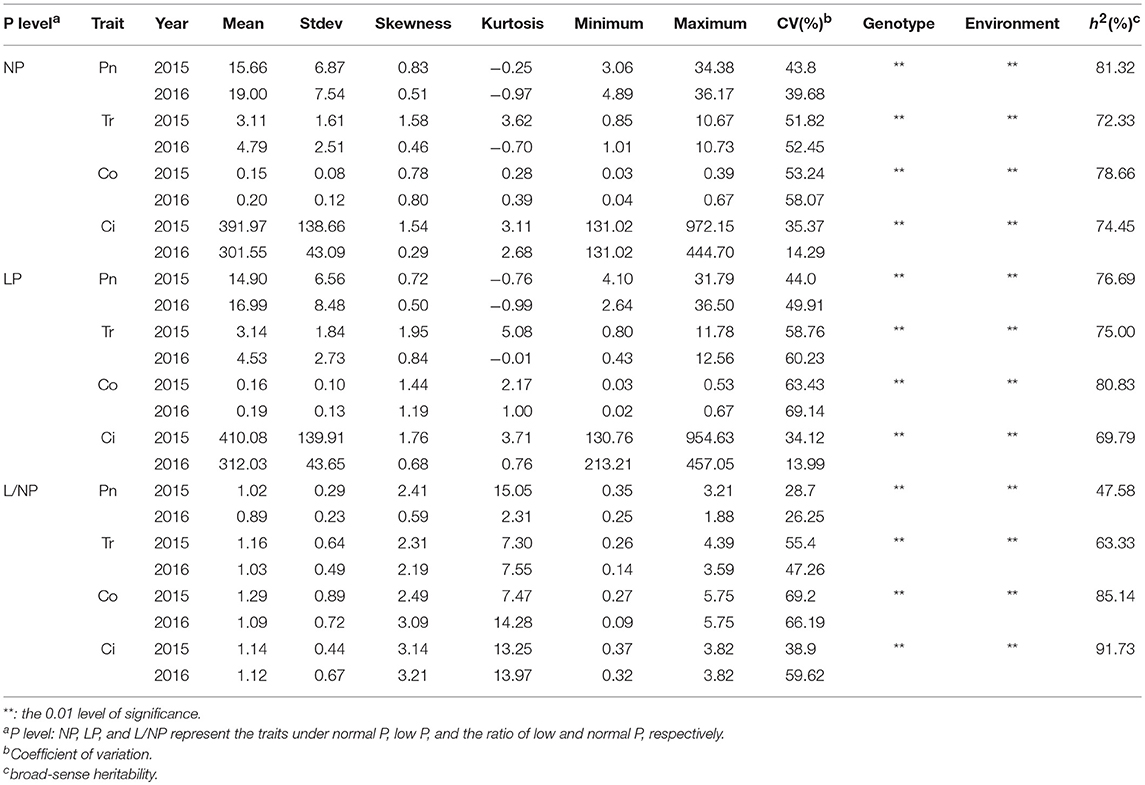
Table 1. Descriptive statistical results for photosynthesis-related traits of soybean under different P conditions.
To investigate the correlation among the four photosynthesis-related traits, simple correlations were calculated based on the average values of the two experiments (Table 2 and Table S2). The results showed that Co was very significantly and positively correlated with Tr [r = 0.886 (NP) or 0.924 (LP)]; Ci was very significantly and positively correlated with Pn [r = 0.394 (NP) or 0.500 (LP)]; Pn was significantly and negatively correlated with Tr and Co (r = −0.100 and −0.108), respectively, under normal P condition; Tr was significantly and negatively correlated with Ci (r = −0.167) under normal P condition (Table 2).
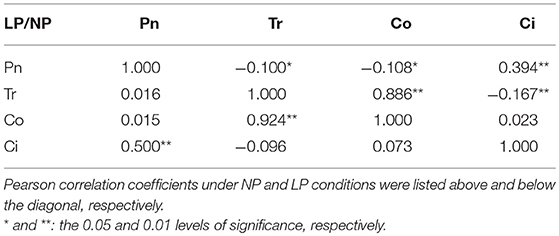
Table 2. Correlations between four photosynthesis-related traits under different P conditions.
Multi-Locus Genome-Wide Association Studies for Photosynthesis-Related Traits
A total of 201,994 SNPs were selected with MAF ≥ 0.05 from 292,053 high-quality SNPs. The selected SNPs were used to determine the number of sub-populations (k) using the software STRUCTURE. As a result, the k-value was 3. The above information along with four photosynthesis-related traits under different P conditions (NP, LP, and L/NP) in 2015 (E1) and 2016 (E2) was used to conduct multi-locus GWAS using package mrMLM. For all the traits, QTNs within approximately 5 Mb or less were viewed as caused by one common gene (Visscher et al., 1996; Öckinger et al., 2006; Swanson-Wagner et al., 2009; Wang et al., 2012). As a result, a total of 31 associated regions comprised of 159 QTNs across all the 20 soybean chromosomes, except the 2, 3, 4, 5, and 10 chromosomes, were significantly associated with the related traits at the critical LOD ≥5 (Table 3 and Figure 2). All the 31 associated regions were identified by at least three methods. The full list of significant QTNs from the six multi-locus GWAS methods is presented in Table S2. Among the 159 QTNs, the numbers of QTNs detected under NP, LP, and L/NP conditions were 59, 64, and 66, respectively; while the numbers of QTNs associated with Co, Tr, Ci, and Pn were 56, 54, 35, and 31, respectively (Table S2).
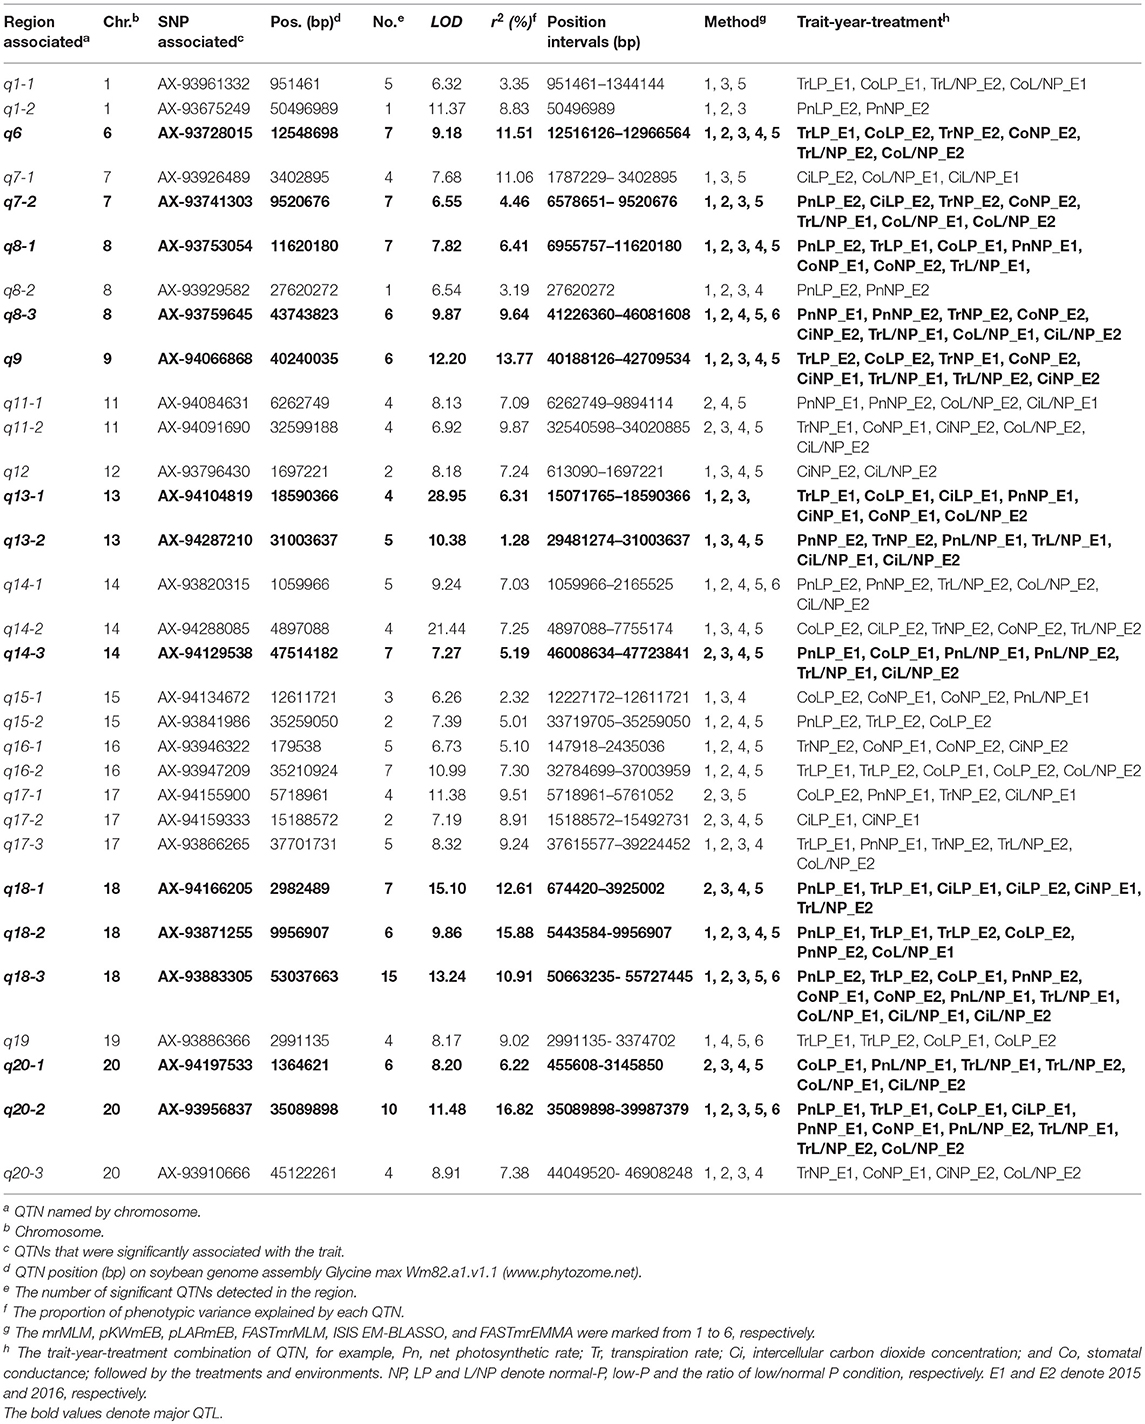
Table 3. Details of loci associated with photosynthesis-related traits via multi-locus GWAS in soybean.
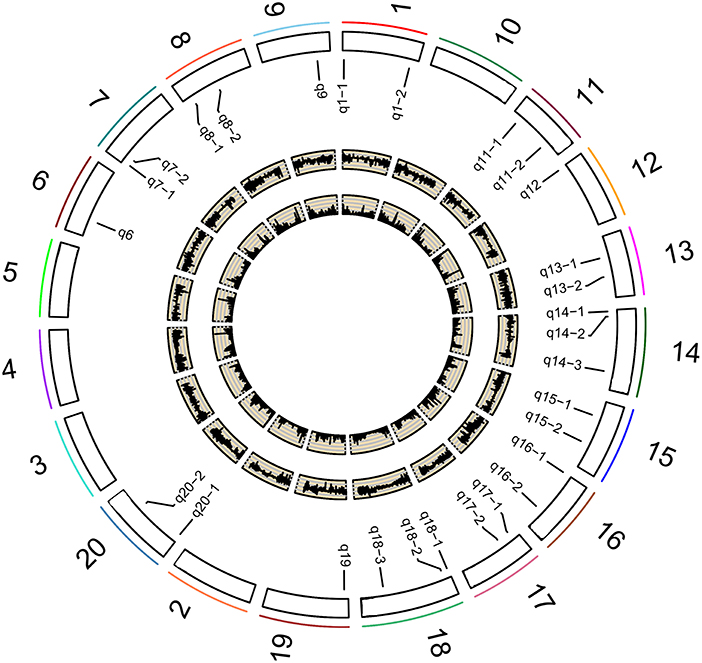
Figure 2. Soybean chromosomes and QTLs for the studied traits under different P conditions. The outside/inside wheat-colored circle indicates the LOD/ r2 value curve for the studied traits across environments. The outermost circle indicates the 20 soybean chromosomes; QTLs for the studied traits under different P conditions.
Most of the 31 associated regions were detected under both NP and LP conditions, including the QTNs on chromosomes 1, 6, 7, 8, 9, 13, 14, 15, 18, and 20. Five of them, q7-2, q8-1, q9, q13-1, and q20-2 were more representative than others. q13-1 was associated with the four photosynthesis-related traits, Pn, Tr, Co, and Ci. q8-1 was associated with Tr, Co, and Pn. q9 was associated with Tr, Co, and Ci. Additionally, q8-1 and q9 were associated with Tr under the L/NP conditions. q7-2 was associated with Pn and Ci under LP conditions, while it was also associated with Tr and Co under NP conditions. q20-2 was associated with Pn and Co under both NP and LP conditions, while it was also associated with Tr and Ci under LP conditions. There were some regions that were uniquely associated with one trait. For example, q17-2 was associated only with Ci, while q1-2 and q8-2 were associated only with Pn, and both loci contain only one QTN. These QTNs probably contribute to the genetic basis of photosynthesis and are probably not significantly influenced by low P stress.
In addition, there were several QTNs identified uniquely under NP or LP conditions and, therefore, they were considered as NP-specific or LP-specific QTNs. For example, q8-3, q11-2, q13-2, q16-1, and q20-3 on chromosomes 8, 11, 13, 16, and 20, respectively, were detected only under NP conditions. In contrast, several LP-specific QTNs, q1-1, q7-1, q14-3, q15-2, q16-2, and q19 on chromosomes 1, 7, 14, 15, 16, and 19, respectively, were detected only under LP level, indicating that the genes underlying these QTNs may be more likely to be affected by low P stress. Moreover, most of the 31 loci were detected under L/NP conditions, and the most representative QTNs were q18-3 and q20-1, which were associated with all four photosynthesis-related traits under the L/NP conditions. Further research of these P condition-specific QTNs may supply more understanding to the genetic basis of P tolerance to photosynthetic capacity.
On the other hand, 13 of the 31 associated regions were repeatedly detected more than 6 times across treatments, traits or years, which are major QTNs (Figure 2; Table 3). These QTNs could be used to assess the effect of low P stress on photosynthesis in further analysis. As shown in Table 3, 13 QTNs (q6, q7-2, q8-1, q8-3, q9, q13-1, q13-2, q14-3, q18-1, q18-2, q18-3, q20-1, and q20-2) were mapped on chromosomes 6, 7, 8, 9, 13, 14, 18, and 20. In addition, comparative analyses showed that eight major QTNs (q7-2, q8-1, q9, q13-2, q14-3, q18-2, q18-3, and q20-1) were co-localized with the QTLs identified in previous reports (Zhang et al., 2009, 2016; Li et al., 2016), including the QTL harboring the P efficiency-related gene, GmACP1 (Zhang et al., 2014b). These eight QTNs most likely play important roles for P efficiency in soybean. For instance, the major QTN q8-1, where the acid phosphatase encoding gene GmACP1 is located and underlying variation in Pn, Tr, and Co, was stably detected across traits and environments. The co-localization of GmACP1 with q8-1 demonstrates the high accuracy of the GWAS results in this study.
Prediction and Preliminary Validation of Candidate Genes
Although it is not easy to compare the results in different studies with different genetic maps, we determined whether the 31 associated regions in the present study were situated at or near the same position as previously identified QTLs by comparing the chromosomal locations of these QTLs (https://soybase.org). Twenty of the 31 regions were reported in previous studies (Table S3), and some of them were associated with leaflet-related traits (Yamanaka et al., 2001; Jun et al., 2014; Shim et al., 2015), such as q7-2, q14-2, q18-2, and q20-2, which could be closely related with photosynthesis.
To identify candidate genes affecting each trait, we re-investigated the 159 QTNs detected in our study based on the annotation of the soybean reference genome W82.a2.v1. As a result, 52 annotated genes were found and listed in Table S4. Most of them were previously associated with P efficiency. For example, the gene cluster within the q8-1 region on chromosome 8 (Glyma.08G114800, Glyma.08G115400, Glyma.08G123200, Glyma.08G129200, Glyma.08G150800) was near the key P efficiency-related gene, GmACP1 (Zhang et al., 2014b). Another gene cluster within the q13-2 region on chromosome 13 (Glyma.13G181600, Glyma.13G192100, Glyma.13G194500, and Glyma.13G196600) was near the protein kinase gene, Glyma.13G161900 (Zhang et al., 2016). In particular, the gene Glyma.13G196600, encoding NADPH: quinine oxidoreductase, might participate in the metabolic processes involving phosphate and photosynthesis.
The major gene cluster of q18-1 on chromosome 18 has three annotated genes in the region encoding DNA polymerase alpha 2 (Glyma.18G009300), anaphase-promoting complex/cyclosome 2 (Glyma.18G036900), and ALWAYS EARLY4 (Glyma.18G040400), which is near a rubisco activase gene Glyma.18G036400 (Li et al., 2016); these could have significant effects on the regulation of photosynthetic capacity in the soybean. In addition, there was also a single annotated gene that had been reported previously. Glyma.12G023100, within the q12 region on chromosome 12, encodes a Transmembrane amino acid transporter family protein, which is physically close to ribulose-bisphosphate carboxylases gene Glyma.12G061600 (Li et al., 2016).
Discussion
Comparison of Six Multi-Locus GWAS Methods
With the development of advanced genomic sequencing technologies, GWAS has become a widely used method and is popular for the genetic dissection of variation in complex traits. While most complex traits are dominated by major genes plus polygenes, the common GWAS using a one-dimensional scanning model might not be able to detect associations with the variation of polygenes because of the limitation of the model. A better alternative is the multi-locus model GWAS (Wang et al., 2016b). In the present study, six multi-locus GWAS methods were used, and a total of 159 QTNs were found to be associated with the four photosynthesis-related traits under different P conditions (Table 4 and Table S2). Furthermore, 41 of the 159 QTNs were detected by at least two methods and all the 31 associated regions were detected by at least three methods. In comparing the six multi-locus GWAS methods, we found that only nine QTNs had been detected by FASTmrEMMA, while more than 40 QTNs were detected by each of the other five methods.
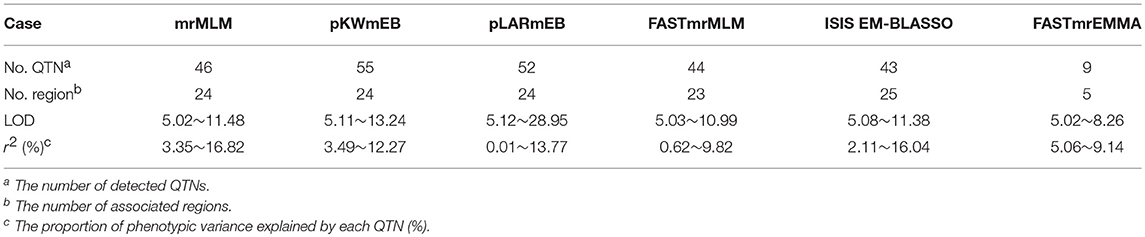
Table 4. Summary of six multi-locus GWAS analysis for the four traits.
The maximum LOD scores were more than 10 except for those from FASTmrEMMA, which was 8.26, smaller than the other five methods. The maximum LOD score of pLARmEB (28.95) was significantly larger than the LOD scores from the other methods. Moreover, the minimum r2 (%) was 0.01 from pLARmEB, which may be meaningless. Meanwhile, the minimum r2 (%) from FASTmrEMMA was 5.06, which was significantly higher than those from the other methods, meaning that FASTmrEMMA might detect major QTNs with the larger effects. This outcome explains why there were fewer associated QTNs from FASTmrEMMA than from the other five methods.
Novel QTNs and Potential Candidate Genes of Interest
Among the 13 major QTNs, five (q6, q8-3, q13-1, q18-1, and q20-1), which have not been reported in previous studies, were considered as novel QTNs for photosynthesis response to low P stress. It is worth noting that q20-1 was associated with all four photosynthesis-related traits under the L/NP conditions. Thus q20-1 might represent another important novel QTN related to Photosynthesis. In addition, two annotated genes within the q20-1 region encoding a Mitochondrial substrate carrier family protein (Glyma.20G004600) and a Cyclophilin-like peptidyl-prolyl cis-trans isomerase family protein (Glyma.20G005600) were found in our study. If possible, more research on these genes might reveal their genetic mechanisms in future.
Another major QTN, q13-1, was associated with the four photosynthesis-related traits under both NP and LP conditions. This QTN was also reported previously for seed methionine content and seed cysteine content (Panthee et al., 2006a,b). Furthermore, one annotated gene Glyma.13G053400, within the q13-1 region on chromosome 13, which encodes a Mitochondrial substrate carrier family protein, was listed in Table S4. Thus, this QTN could be a promising candidate locus for further study of low P stress on photosynthetic efficiency.
Some annotated genes weren't reported previously to be associated with phosphate and photosynthetic metabolic processes. For instance, one gene Glyma.14G029100, within the q14-1 region on chromosome 14, encodes sucrose phosphate synthase 3F. Two annotated genes encoding a phosphate transporter (Glyma.11G087800) and a phospholipase (Glyma.11G230100) might be involved in the metabolic process of phosphate and photosynthesis.
Based on 292,035 high-quality SNPs in 219 soybean accessions, 159 QTNs within 31 regions were identified to be associated with four photosynthesis-related traits under different P conditions. Importantly, genetic improvement simultaneously for phosphorus efficiency and photosynthesis in soybean might be carried out by selecting for a single large-effect QTN. The associated regions and candidate genes detected in the present study could be further tested for marker-assisted breeding of soybean varieties for the application of P tolerance to photosynthetic capacity.
Author Contributions
DZ and HLü conceived and designed the experiments. YY, HLi, SC, XZ, KY, LL, XC, and WW performed the experiments. HLü, JZ, JY, and QL performed data analyses. HLü and DZ wrote the manuscript. All authors have read and approved the final version of the manuscript.
Conflict of Interest Statement
The authors declare that the research was conducted in the absence of any commercial or financial relationships that could be construed as a potential conflict of interest.
The reviewer JZ declared a shared affiliation, though no other collaboration, with one of the authors YY to the handling Editor.
Acknowledgments
This research was supported by the China Postdoctoral Science Foundation (2017T100532, 2015M580630), the National Natural Science Foundation of China (31701309), the Science and technology Innovation Talents Projects of the Education Department of Henan Province (15HASTIT034), and Key scientific research Program of the Higher Education Institutions of Henan Province (17A110024, 18A110020).
Supplementary Material
The Supplementary Material for this article can be found online at: https://www.frontiersin.org/articles/10.3389/fpls.2018.01226/full#supplementary-material
Figure S1. Histogram of the frequency distributions for the four photosynthesis-related traits of soybean under NP and LP conditions in 2015 and 2016.
Table S1. Correlation coefficients among the four photosynthesis-related traits under different P conditions.
Table S2. The detailed list of QTNs for photosynthesis-related traits under different P conditions across two environments using six multi-locus GWAS methods.
Table S3. The overlapped QTLs between present and previous studies.
Table S4. Predicted candidate genes associated with photosynthesis-related traits under different P conditions.
References
Ao, J., Fu, J., Tian, J., Yan, X., Liao, H., Ma, J., et al. (2010). Genetic variability for root morph-architecture traits and root growth dynamics as related to phosphorus efficiency in soybean. Funct. Plant Biol. 37, 304–312. doi: 10.1071/FP09215
Hao, D., Chao, M., Yin, Z., and Yu, D. (2012). Genome-wide association analysis detecting significant single nucleotide polymorphisms for chlorophyll and chlorophyll fluorescence parameters in soybean (Glycine max) landraces. Euphytica 186, 919–931. doi: 10.1007/s10681-012-0697-x
Huang, X., Zhao, Y., Wei, X., Li, C., Wang, A., Zhao, Q., et al. (2012). Genome-wide association study of flowering time and grain yield traits in a worldwide collection of rice germplasm. Nat. Genet. 44, 32–39. doi: 10.1038/ng.1018
Johnston, A., Steen, I., and Association, E. F. M. (2000). Understanding phosphorus and its use in agriculture. Brussels: European Fertilizer Manufacturers Association.
Jun, T., Freewalt, K., Michel, A. P., and Mian, R. (2014). Identification of novel QTL for leaf traits in soybean. Plant Breeding 133, 61–66. doi: 10.1111/pbr.12107
Khan, A. A., Jilani, G., Akhtar, M. S., Naqvi, S. M. S., and Rasheed, M. (2009). Phosphorus solubilizing bacteria: occurrence, mechanisms and their role in crop production. J. Agric. Biol. Sci. 1, 48–58.
Li, H., Yang, Y., Zhang, H., Chu, S., Zhang, X., Yin, D., et al. (2016). A genetic relationship between phosphorus efficiency and photosynthetic traits in soybean as revealed by QTL analysis using a high-density genetic map. Front. Plant Sci. 7:924. doi: 10.3389/fpls.2016.00924
Li, M., Liu, X., Bradbury, P., Yu, J., Zhang, Y. M., Todhunter, R. J., et al. (2014). Enrichment of statistical power for genome-wide association studies. BMC Biol. 12:73. doi: 10.1186/s12915-014-0073-5
Li, Y., Wang, Y., Tong, Y., Gao, J., Zhang, J., and Chen, S. (2005). QTL mapping of phosphorus deficiency tolerance in soybean (Glycine max L. Merr.). Euphytica 142, 137–142. doi: 10.1007/s10681-005-1192-4
Mao, H., Wang, H., Liu, S., Li, Z., Yang, X., Yan, J., et al. (2015). A transposable element in a nac gene is associated with drought tolerance in maize seedlings. Nat. Commun. 6:8326. doi: 10.1038/ncomms9326
Öckinger, J., Serrano-Fernández, P., Möller, S., Ibrahim, S. M., Olsson, T., and Jagodic, M. (2006). Definition of a 1.06-Mb region linked to neuroinflammation in humans, rats and mice. Genetics 173, 1539–1545. doi: 10.1534/genetics.106.057406
Panthee, D. R., Pantalone, V. R., Sams, C. E., Saxton, A. M., West, D. R., Orf, J. H., et al. (2006a). Quantitative trait loci controlling sulfur containing amino acids, methionine and cysteine, in soybean seeds. Theor. Appl. Genet. 112, 546–553. doi: 10.1007/s00122-005-0161-6
Panthee, D. R., Pantalone, V. R., Saxton, A. M., West, D. R., and Sams, C. (2006b). Genomic regions associated with amino acid composition in soybean. Mol. Breeding 17, 79–89. doi: 10.1007/s11032-005-2519-5
Pritchard, J. K., Wen, X., and Falush, D. (2009). Documentation for STRUCTURE Software: Version 2.3. Chicago, IL: The University of Chicago Press.
Ren, W., Wen, Y., Dunwell, J. M., and Zhang, Y. M. (2018). pKWmEB: integration of Kruskal-Wallis test with empirical Bayes under polygenic background control for multi-locus genome-wide association study. Heredity 120, 208–218. doi: 10.1038/s41437-017-0007-4
Shim, H. C., Ha, B. K., Yoo, M., and Kang, S. T. (2015). Detection of quantitative trait loci controlling UV-B resistance in soybean. Euphytica 202, 109–118. doi: 10.1007/s10681-014-1233-y
Swanson-Wagner, R., DeCook, R., Jia, Y., Bancroft, T., Ji, T., Zhao, X., et al. (2009). Paternal dominance of trans-eQTL influences gene expression patterns in maize hybrids. Science 326, 1118–1120. doi: 10.1126/science.1178294
Tamba, C., Ni, Y., and Zhang, Y. M. (2017). Iterative sure independence screening EM-Bayesian LASSO algorithm for multi-locus genome-wide association studies. PLoS Comput. Biol. 13:e1005357. doi: 10.1371/journal.pcbi.1005357
Tamba, C., and Zhang, Y. M. (2018). A fast mrMLM algorithm for multi-locus genome-wide association studies. bioRxiv 7. doi: 10.1101/341784
van Rooijen, R., Kruijer, W., Boesten, R., van Eeuwijk, F. A., Harbinson, J., and Aarts, M. G. M. (2017). Natural variation of yellow seedling1affects photosynthetic acclimation of Arabidopsis thaliana. Nat. Commun. 8:1421. doi: 10.1038/s41467-017-01576-3
Vance, C. P., Uhdestone, C., and Allan, D. L. (2003). Phosphorus acquisition and use: critical adaptations by plants for securing a nonrenewable resource. New Phytol. 157, 423–447. doi: 10.1046/j.1469-8137.2003.00695.x
Veneklaas, E. J., Lambers, H., Bragg, J., Finnegan, P. M., Lovelock, C. E., Plaxton, W. C., et al. (2012). Opportunities for improving phosphorus-use efficiency in crop plants. New Phytol. 195, 306–320. doi: 10.1111/j.1469-8137.2012.04190.x
Visscher, P., Thompson, R., and Haley, C. (1996). Confidence intervals in QTL mapping by bootstrapping. Genetics 143, 1013–1020.
Wang, J., Chu, S., Zhang, H., Zhu, Y., Cheng, H., and Yu, D. (2016a). Development and application of a novel genome-wide SNP array reveals domestication history in soybean. Sci. Rep. 6:20728. doi: 10.1038/srep20728
Wang, S. B., Feng, J. Y., Ren, W. L., Huang, B., Zhou, L., Wen, Y. J., et al. (2016b). Improving power and accuracy of genome-wide association studies via a multi-locus mixed linear model methodology. Sci. Rep. 6:19444. doi: 10.1038/srep19444
Wang, X., Wang, H., Liu, S., Ferjani, A., Li, J., Yan, J., et al. (2016c). Genetic variation in zmvpp1 contributes to drought tolerance in maize seedlings. Nat. Genet. 48, 1233–1241. doi: 10.1038/ng.3636
Wang, X., Wurmser, C., Pausch, H., Jung, S., Reinhardt, F., Tetens, J., et al. (2012). Identification and dissection of four major QTL affecting milk fat content in the german holstein-friesian population. PLoS ONE 7:e40711. doi: 10.1371/journal.pone.0040711
Wang, X. R., Shen, J. B., and Liao, H. (2010). Acquisition or utilization, which is more critical for enhancing phosphorus efficiency in modern crops?. Plant Sci. 179, 302–306. doi: 10.1016/j.plantsci.2010.06.007
Wang, Y., and Gai, J. (2002). Study on the ecological regions of soybean in China.?. Ecological environment and representative varieties. J. appl. Ecol. 13, 71–75.
Wen, Y. J., Zhang, H., Ni, Y. N., Huang, B., Zhang, J., Feng, J. Y., et al. (2018). Methodological implementation of mixed linear models in multi-locus genome-wide association studies. Brief. Bioinform. 19, 700–712. doi: 10.1093/bib/bbw145
Yamanaka, N., Ninomiya, S., Hoshi, M., Tsubokura, Y., Yano, M., Nagamura, Y., et al. (2001). An informative linkage map of soybean reveals QTLs for flowering time, leaflet morphology and regions of segregation distortion. DNA Res. 8, 61–72. doi: 10.1093/dnares/8.2.61
Yin, Z., Meng, F., Song, H., He, X., Xu, X., and Yu, D. (2010a). Mapping quantitative trait loci associated with chlorophyll a fluorescence parameters in soybean (Glycinemax (L) Merr). Planta 231, 875–885. doi: 10.1007/s00425-009-1094-0
Yin, Z., Meng, F., Song, H., Wang, X., Xu, X., and Yu, D. (2010b). Expression quantitative trait loci analysis of two genes encoding rubisco activase in soybean. Plant Physiol. 152, 1625–1637. doi: 10.1104/pp.109.148312
Yu, J., and Buckler, E. S. (2006). Genetic association mapping and genome organization of maize. Curr. Opin. Biotechnol. 17, 155–160. doi: 10.1016/j.copbio.2006.02.003
Zhang, D., Cheng, H., Geng, L., Kan, G., Cui, S., Meng, Q., et al. (2009). Detection of quantitative trait loci for phosphorus deficiency tolerance at soybean seedling stage. Euphytica 167, 313–322. doi: 10.1007/s10681-009-9880-0
Zhang, D., Kan, G., Hu, Z., Cheng, H., Zhang, Y., Wang, Q., et al. (2014a). Use of single nucleotide polymorphisms and haplotypes to identify genomic regions associated with protein content and water-soluble protein content in soybean. Theor. Appl. Genet. 127, 1905–1915. doi: 10.1007/s00122-014-2348-1
Zhang, D., Li, H., Wang, J., Zhang, H., Hu, Z., Chu, S., et al. (2016). High-density genetic mapping identifies new major loci for tolerance to low-phosphorus stress in soybean. Front. Plant Sci. 7:372. doi: 10.3389/fpls.2016.00372
Zhang, D., Song, H., Cheng, H., Hao, D., Wang, H., Kan, G., et al. (2014b). The acid phosphatase-encoding gene GmACP1 contributes to soybean tolerance to low-phosphorus stress. PLoS Genet. 10:e1004061. doi: 10.1371/journal.pgen.1004061
Zhang, J., Feng, J. Y., Ni, Y. N., Wen, Y. J., Niu, Y., Tamba, C., et al. (2017). pLARmEB: integration of least angle regression with empirical Bayes for multi-locus genome-wide association studies. Heredity 118, 517–524. doi: 10.1038/hdy.2017.8
Zhang, Y. M., Mao, Y. C., Xie, C., Smith, H., Luo, L., and Xu, S. (2005). Mapping quantitative trait loci using naturally occurring genetic variance among commercial inbred lines of maize (Zea mays L.). Genetics 169, 2267–2275. doi: 10.1534/genetics.104.033217
Keywords: soybean, photosynthesis-related traits, phosphorus efficiency, multi-locus GWAS, QTNs, candidate gene, mrMLM
Citation: Lü H, Yang Y, Li H, Liu Q, Zhang J, Yin J, Chu S, Zhang X, Yu K, Lv L, Chen X and Zhang D (2018) Genome-Wide Association Studies of Photosynthetic Traits Related to Phosphorus Efficiency in Soybean. Front. Plant Sci. 9:1226. doi: 10.3389/fpls.2018.01226
Received: 30 April 2018; Accepted: 31 July 2018;
Published: 28 August 2018.
Edited by:
Yuan-Ming Zhang, Huazhong Agricultural University, ChinaReviewed by:
Jin Zhang, Nanjing Agricultural University, ChinaXingwang Yu, North Carolina State University, United States
Copyright © 2018 Lü, Yang, Li, Liu, Zhang, Yin, Chu, Zhang, Yu, Lv, Chen and Zhang. This is an open-access article distributed under the terms of the Creative Commons Attribution License (CC BY). The use, distribution or reproduction in other forums is permitted, provided the original author(s) and the copyright owner(s) are credited and that the original publication in this journal is cited, in accordance with accepted academic practice. No use, distribution or reproduction is permitted which does not comply with these terms.
*Correspondence: Dan Zhang, emhhbmdkQGhlbmF1LmVkdS5jbg==
†These authors have contributed equally to this work