 Yanchao Yuan1†
 Xianlin Wang1†Liyuan Wang1†Huixian Xing1
 Qingkang Wang1
 Muhammad Saeed2Jincai Tao1Wei Feng1Guihua Zhang3
 Xian-Liang Song1*Xue-Zhen Sun1*
- 1State Key Laboratory of Crop Biology/Agronomy College, Shandong Agricultural University, Taian, China
- 2Department of Botany, Government College University, Faisalabad, Pakistan
- 3Heze Academy of Agricultural Sciences, Heze, China
Cotton (Gossypium spp.) is a leading natural fiber crop and an important source of vegetable protein and oil for humans and livestock. To investigate the genetic architecture of seed nutrients in upland cotton, a genome-wide association study (GWAS) was conducted in a panel of 196 germplasm resources under three environments using a CottonSNP80K chip of 77,774 loci. Relatively high genetic diversity (average gene diversity being 0.331) and phenotypic variation (coefficient of variation, CV, exceeding 3.9%) were detected in this panel. Correlation analysis revealed that the well-documented negative association between seed protein (PR) and oil may be to some extent attributable to the negative correlation between oleic acid (OA) and PR. Linkage disequilibrium (LD) was unevenly distributed among chromosomes and subgenomes. It ranged from 0.10–0.20 Mb (Chr19) to 5.65–5.75 Mb (Chr25) among the chromosomes and the range of Dt-subgenomes LD decay distances was smaller than At-subgenomes. This panel was divided into two subpopulations based on the information of 41,815 polymorphic single-nucleotide polymorphism (SNP) markers. The mixed linear model considering both Q-matrix and K-matrix [MLM(Q+K)] was employed to estimate the association between the SNP markers and the seed nutrients, considering the false positives caused by population structure and the kinship. A total of 47 SNP markers and 28 candidate quantitative trait loci (QTLs) regions were found to be significantly associated with seven cottonseed nutrients, including protein, total fatty acid, and five main fatty acid compositions. In addition, the candidate genes in these regions were analyzed, which included three genes, Gh_D12G1161, Gh_D12G1162, and Gh_D12G1165 that were most likely involved in the control of cottonseed protein concentration. These results improved our understanding of the genetic control of cottonseed nutrients and provided potential molecular tools to develop cultivars with high protein and improved fatty acid compositions in cotton breeding programs through marker-assisted selection.
Introduction
Cotton (Gossypium spp.) is the leading natural fiber crop for the manufacture of textiles and an important source of vegetable oil and protein for humans and livestock (Yu et al., 2012; Gore et al., 2014; Liu et al., 2017a), as well as renewable raw materials for various industrial products such as biofuels, lubricants, and hydraulic oils (Jiao et al., 2013; Sinha and Murugavelh, 2016). Cottonseed oil and protein account for 17–27% and 12–32% of seed weight, respectively, and vary with cotton species, varieties, and measuring methods (Wu et al., 2009; Yu et al., 2012). The fatty acids of cottonseed oil generally contain 22% saturated fatty acids and 74% unsaturated fatty acids (15% monounsaturated fatty acids and 59% polyunsaturated fatty acids) (Stewart et al., 2010). Cottonseed protein content, oil content, and its composition determine its nutritional values and physicochemical properties (Stewart et al., 2010; Lu et al., 2011). Therefore, improving the seed nutrients and its composition is an important cotton breeding target to increase the total output of cotton production.
Oil and protein content in cottonseeds are complex quantitative traits that are controlled by a series of genes with small effects and influenced by the environment (Hanny et al., 1978; Wu et al., 2009; Yu et al., 2012; Liu et al., 2015b). For cottonseed oil and protein content, in some studies, general and special combining abilities, maternal effects, and both additive and non-additive (including dominance) effects have been reported (Kohel, 1980; Dani and Kohel, 1989; Wu et al., 2009, 2010), whereas only additive effects were detected in other studies (Wu et al., 2009, 2010), indicating the complicated genetic architecture underlying these traits. Previous reports have shown a significant negative correlation between oil and protein concentration in cottonseed, thereby limiting the potential to develop cultivars with high seed oil and protein simultaneously in conventional breeding programs (Yu et al., 2012; Liu et al., 2015b).
Molecular markers have been used to explore QTLs (Quantitative Trait Loci) or chromosome regions conferring seed nutrients and composition in oilseed crops, including Glycine max (L.) Merrill (Reinprecht et al., 2006), Brassica napus L. (Javed et al., 2016), Arachis hypogaea L. (Shasidhar et al., 2017), and Gossypium hirsutum L. (Song and Zhang, 2007; Yu et al., 2012; Liu et al., 2015a), through linkage mapping approaches. A total of 64 significant QTLs for six seed nutrient traits (the crude oil, crude protein, linolenic acid, stearic acid, oleic acid, and palmitic acid content) were identified using a high-density upland cotton genetic map in a G. hirsutum intraspecific RIL population (Liu et al., 2015a). Additional cottonseed-related QTLs were identified in interspecific populations partly due to relatively high map coverage and marker resolution (Song and Zhang, 2007; Yu et al., 2012). In a G. hirsutum × G. barbadense BC1S1 population, three major QTLs controlling kernel percentage, kernel oil percentage, and kernel protein percentage were identified (Song and Zhang, 2007). Through an interspecific hybrid backcross inbred line population between G. hirsutum and G. barbadense, 42 QTLs (17 QTLs related to oil content, 22 QTLs for protein content, and three QTLs for gossypol content) were detected (Yu et al., 2012). In cottonseed, 56 QTLs for nine amino acid raw materials of protein synthesis were detected in two upland cotton populations (Liu et al., 2017b). However, among these cottonseed QTLs, only a few were identified in multi-environments or multiple genetic-background, and none have been widely used in marker-assisted selection (MAS) strategy of cotton breeding programs for high protein and/or oil. This might be caused by QTL population specificity, large QTL confidence intervals, QTL × genetic background, and QTL × environment interactions, which hinder the application of QTL in practical breeding (Mackay and Powell, 2007; Cavanagh et al., 2008; Qi et al., 2011). Thus, more loci for cottonseed nutrient traits need to be explored in diverse genetic backgrounds with different methods.
Association mapping, which is a complementary approach for setting up the genetic basis of quantitative traits, identifies QTLs on the basis of recombination events that occurred during the evolution of a panel of diverse germplasms and therefore provides the advantage of dissecting larger numbers of alleles than linkage mapping (Yu and Buckler, 2006; Rafalski, 2010; Tian et al., 2011; Saïdou et al., 2014). Genome-wide association studies (GWAS) have been widely adopted to analyze the genetic architecture of seed protein, oil, and fatty acid composition in oil crops, including soybean (Cao et al., 2017), rapeseed (Gacek et al., 2017), and sesame (Li et al., 2014a), and other plants such as maize (Tian et al., 2011; Li et al., 2013a) and Arabidopsis thaliana (Branham et al., 2015). For cotton, an association analysis using 228 simple sequence repeats (SSR) markers in a panel of 180 elite upland cotton cultivars and breeding lines detected 86 marker-trait (seed oil and protein content) associations in six environments (Liu et al., 2015b). Twenty-one QTLs for seed quality traits (protein, oil, and fiber content) were detected through GWAS in a panel of 75 upland genotypes with 234 polymorphic amplified fragment length polymorphisms (AFLPs) (Badigannavar and Myers, 2015). With the release of complete whole-genome sequences of the tetraploid cottons, G. barbadense (Liu et al., 2015c; Yuan et al., 2015) and G. hirsutum, (Li et al., 2015; Zhang et al., 2015) and the diploid cottons, G. arboreum (Li et al., 2014b) and G. raimondii (Paterson et al., 2012), GWAS using SNP data obtained by genotyping-by-sequencing (GBS) and genotyping array technologies has been undertaken to dissect the genetic regulation of complex traits in cotton, such as fiber quality, fiber yield, agronomy traits, salt, and verticillium wilt resistance (Islam et al., 2016; Cai et al., 2017; Fang et al., 2017; Huang et al., 2017a; Li et al., 2017; Sun et al., 2017; Wang et al., 2017). However, to our knowledge, no GWAS on cottonseed protein, oil, and fatty acid composition has been reported to date.
In this study, GWAS for seed protein, oil, and fatty acid composition was performed in a panel of 196 upland cotton accessions under three environments using genotypic data of 41,815 SNP markers from the Illumina CottonSNP80K (Cai et al., 2017). The objectives of this study were (i) to evaluate variations in seed protein, oil, and fatty acid composition in this panel of upland cotton accessions; (ii) to explore the genetic structure and linkage disequilibrium (LD) level in this panel; and (iii) to identify candidate QTL regions and genes conferring cottonseed oil and protein to facilitate the dissection of the genetic architecture of these important traits in upland cotton.
Materials and Methods
Plant Materials and Field Experiments
A panel of 196 diverse upland cotton accessions was selected for this GWAS, which originated from 11 countries in five continents (Table S1). This panel contained 169 accessions cultivated in China and 27 exotic accessions. The accessions cultivated in China were selected from the five cotton-growing regions in China: 139 genotypes from the Yellow River Region (YRR), 16 from the Northwestern Inland Region (NIR), six from the Yangtze River Region (YtRR), six from the Northern Special Early Maturation Region (NSEMR), and two from Southern China Region (SCR). The 27 exotic accessions were provided by the Germplasm Repository of Institute of Cotton Research, Chinese Academy of Agricultural Sciences (Anyang, Henan province, China) and were authorized for scientific research purposes only. All the accessions were inbred for at least 3 years before use in this study.
The field experiments were conducted at the Crop Research Station of Shandong Agricultural University (CRS/SDAU), Taian, China in 2014 and 2016, and in Ling County, Dezhou, China in 2015. The 196 cotton accessions were planted at two experiment sites in a randomized complete block design with three replicates. Each replicate had one row that was 8-m long. The row space was 80 cm, and the average plant space was 33 cm. The planting date was April 24 in 2014 and 2015 and April 28 in 2016. Cultural practices followed local recommendations.
Seed Fatty Acid and Protein Determination and Statistical Analysis
Thirty normally opened bolls were collected from each plot at maturity stage, air-dried, and ginned with a laboratory cotton ginning machine. In each replicate, equal number of seeds of the same genotype were bulked. Then, seed coats were manually removed, and the resulting kernels were ground into powder for seed nutrients assay with three replicates. The total fatty acids (TA) (mg/g) in seed kernels and five fatty acids, including myristic acid (MA), palmitic acid (PA), stearic acid (SA), oleic acid (OA), and linoleic acid (LA), as percentages of TA were determined by gas chromatography (GC2010, Shimadzu Corporation, Kyoto, Japan) according to Lian et al. (2017). In this GC analysis, a DB-FFAP column (30 m length × 0.25 μm liquid membrane thickness × 0.32 mm inner diameter) was equipped. A total of 0.2 g seed kernel powder was loaded into a 10-mL glass tube with 2 mL of an ether-petroleum ether (1:1) solution. After mixing and shaking, the solution was left to stand overnight. Then, 2 mL of KOH in methanol (0.4 mol/L) solution and 4 mL of distilled water were added to the mixture. Next, the mixture was allowed to precipitate for 1–2 h, the supernatant and pellet were separated, and then 0.2 g of sodium sulfate anhydrous was added into the supernatant. Finally, 1 mL of the supernatant was absorbed into the GC tube for analysis. The temperature of the detector and gasification room was maintained at 250°C and 230°C, respectively, and the temperature of the column was maintained at 190°C during the first 9 min and then increased to 230°C for the next 8 min, while the flow rates of air carrier, hydrogen, and gas (nitrogen) were maintained at 400, 40, and 30 mL/min, respectively. The results were determined by the chromatographic peak area normalization method, and the mass percentage (m/%) of each component as a proportion of the total FA was calculated. The total protein (PR) content was measured using the Rapid N Exceed: N/Protein Analyzer of Elementar, Langenselbold, Germany (http://www.elementar.de/en/products/nprotein-analysis/rapid-n-exceed.html). The mean value of three replicates was used for further analysis. Phenotypic traits across multiple environments were estimated using the best linear unbiased predictions (BLUPs) based on a linear model (de et al., 2013; Huang et al., 2017a).
Statistical analysis of phenotypic data was performed using SPSS Statistics 21.0 (RRID:SCR_002865). Descriptive statistics was performed using the BLUPed traits values (Merk et al., 2012; Sun et al., 2016). The frequency distribution of each trait was calculated using R (R Core Team, Vienna, Austria).
SNP Genotyping
Genomic DNA was extracted from young leaf tissue with the Qiagen DNeasy Plant Kit. The DNA quantity and quality were measured with NanoDrop 2000 and agarose gel electrophoresis. Genotyping was conducted at the Beijing Compass Biotechnology Co., Ltd. using the CottonSNP80K array (Illumina) (Cai et al., 2017), which was developed by State Key Laboratory of Crop Genetics & Germplasm Enhancement, Hybrid Cotton R & D Engineering Research Center, Ministry of Education, Nanjing Agricultural University, Nanjing, China. Of all the 77,774 SNP loci on the array, 55,660 (71.57%) were polymorphic. Quality check for the SNP markers was performed using TASSEL v5.2.40 (RRID:SCR_012837) to remove the SNPs with a call rate of < 90% and a minor allele frequency (MAF) < 0.05. A final set of 41,815 SNP markers was retained for further analysis.
Population Structure, Kinship (K), and LD Analyses
The software PowerMarker version 3.25 (RRID:SCR_009332) was used to calculate the polymorphic information content (PIC) of the SNP markers, gene diversity and genetic distances among accessions, and to plot the unweighted pair group method with arithmetic means (UPGMA) phylogenetic tree using Nei's genetic distance method (Sneath and Sokal, 1973).
The population structure of the 196 accessions was estimated by STRUCTURE 2.3.4 software (Evanno et al., 2005) with the Bayesian Markov Chain Monte Carlo (MCMC) model. K value was set from 1 to 20, with iterations and burn-in length both set to 100,000 under the admixture and correlated allele frequencies model, and seven independent runs for each K were performed (Wan et al., 2017). The natural logarithms of probability data [LnP(K)] and the ad hoc statistic ΔK were calculated using STRUCTURE HARVESTER (http://taylor0.biology.ucla.edu/structureHarvester/), which is a program for visualizing the STRUCTURE output and implementing the Evanno method (Earl and Vonholdt, 2012; Huang et al., 2017a). The ΔK was considered as the determinant factor for deducing the optimal value of K (Mezmouk et al., 2011). Using CLUMPP software (Jakobsson and Rosenberg, 2007), the Q-matrix was obtained through integrating seven replicate runs.
Principal component analysis (PCA) and the K matrix calculated with TASSEL v5.2.40 (RRID:SCR_012837) were also used to adjust the population structure. TASSEL v5.2.40 (RRID:SCR_012837) was also used to calculate the parameter r2 (the correlation in frequency among pairs of alleles across a pair of SNP loci).
Genome-Wide Association Analysis
Genotypic and phenotypic data were jointly analyzed for determining the marker-trait associations. For this purpose, the software package TASSEL v5.2.40 (RRID:SCR_012837) was employed and the genome-wide association mapping was performed implementing six models: the naive general linear model (GLM), the general linear model considering the Q-matrix [GLM (Q)], the general linear model considering the PCA-matrix [the top six principal components, GLM (PCA)], the mixed linear model considering the K-matrix [MLM (K)], the mixed linear model considering both Q-matrix and K-matrix [MLM (Q + K)], and the mixed linear model considering both PCA-matrix and K-matrix [MLM (PCA + K)]. The threshold to define a significant association between the marker and trait was set at a probability level of –log(p) ≥ 3.8.
The LD decay distances among diverse chromosomes were set as confidence intervals for candidate-QTL regions in different chromosomes. The LD map based on the physical location was plotted using Haploview 4.2 (Calati et al., 2011). Putative candidate genes were put forward for each locus using the Cottongen JBrowse - Gossypium hirsutum AD1 genome NAU-NBI assembly v1.1 (annot v1.1) (https://www.cottongen.org/tools/jbrowse). Moreover, the identification of the specific expressed genes in relevant tissues of the candidate regions was based on the G. hirsutum (TM-1) gene expression database (Zhang et al., 2015).
Results
Phenotypic Statistical Analysis
The results of ANOVA of the traits for 3 years (2014–2016) are listed in Table 1. The results showed that there was significant (P < 0.01) variation among the five fatty acids (MA, myristic acid; PA, palmitic acid; SA, stearic acid; OA, oleic acid; and TA, total fatty acids) during the 3 years, whereas the observed variations in LA (linoleic acid) and PR (total protein) were not significant. The results also indicated that the environment was responsible for a sizeable portion of the observed total variations in oil and the fatty acids levels, and the interaction between the genotype and the environment for oil concentration was larger than that for the total protein content.
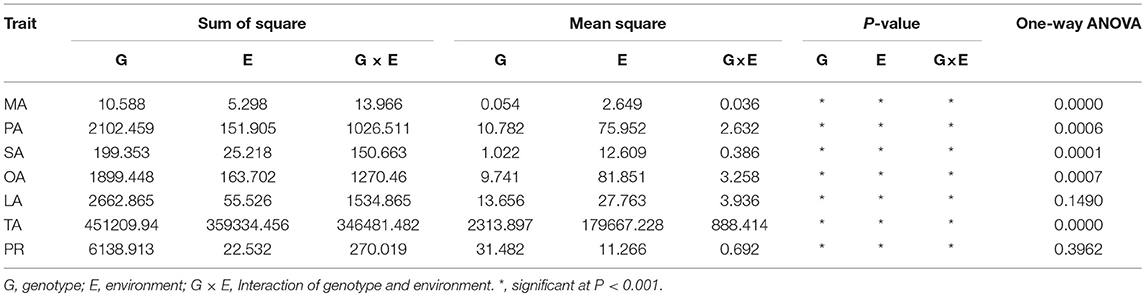
Table 1. ANOVA of seven cottonseed nutrient traits in three environments (Taian 2014, 2015 and Ling country 2016).
The BLUPed phenotypic values of MA, PA, SA, OA, LA, TA, and PR followed a normal distribution (Figure S1), with mean values of 0.70%, 22.46%, 2.49%, 15.49%, 58.86%, 220.67 mg/g, and 44.27%, with the coefficient of variation (CV) of 3.99, 3.97, 8.55, 4.65, 1.58, 3.99, and 4.65%, respectively (Table 2). Correlation analysis (Table 3) found a strong negative relationship between total protein (PR) and oil (TA). Significant negative correlations were found between PA and SA and between OA and LA, whereas positive correlations were detected between MA and PA and between SA and OA. Of the five fatty acid compositions measured, only OA showed a significant negative correlation with PR, SA had significant positive correlation with PR, and the rest of the three fatty acids, namely, PA, MA, and LA, showed a very weak non-significant association with PR.
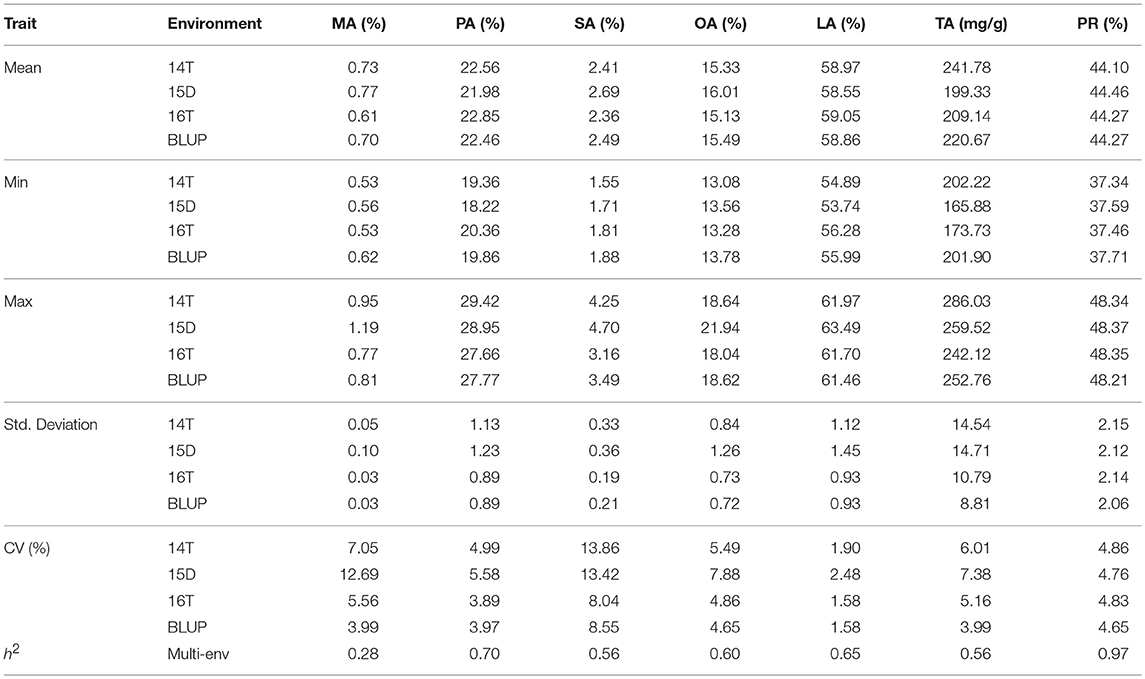
Table 2. Descriptive statistics of the observed phenotypic variations in seven traits.
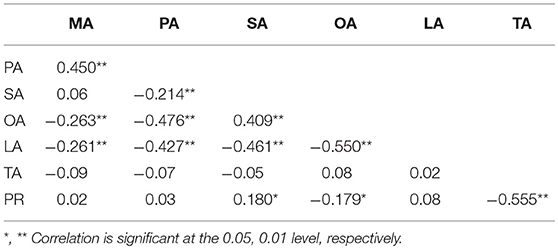
Table 3. Correlation coefficients of seven cottonseed nutrient traits.
SNP Genotyping and Genetic Diversity
All the 196 accessions were genotyped using the CottonSNP80K chip with 77,774 SNPs. Of the 77,774 SNP loci, 55,660 (71.57%) were polymorphic. After the removal of SNPs with a call rate of < 90% or with minor allele frequencies (MAFs) < 5%, 41,815 (53.76%) polymorphic SNP markers were finally screened out and used to assess the population structure (Q), relative kinship (K), and GWAS analysis. These filtered SNPs provided a whole genome-wide (1,934.65 Mb) coverage, with a mean distance of 46.26 kb (Figure 1). The average SNP distance of each chromosome ranged from 26.25 kb (Chr16) to 81.97 kb (Chr02). The PIC varied from 0.227 (Chr17) to 0.303 (Chr24), with an average of 0.267 for all SNP markers. Thus, the average gene diversity of the whole genome was 0.331, varying from 0.274 (Chr17) to 0.384 (Chr24) (Table 4).
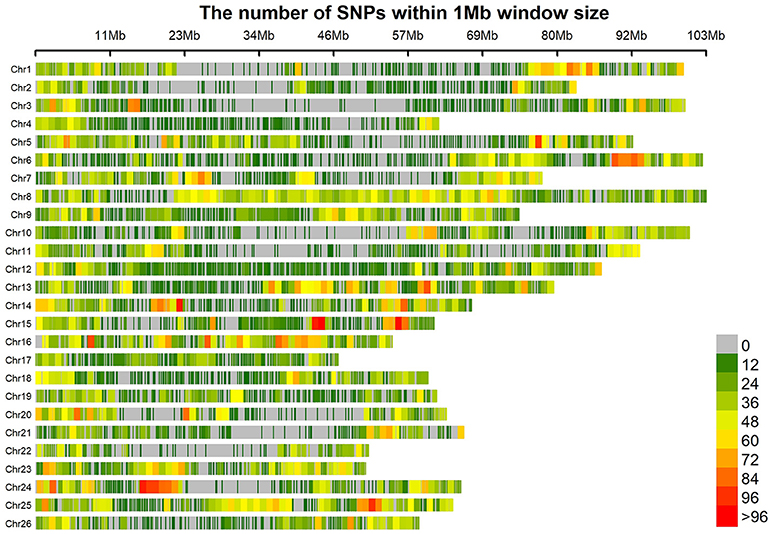
Figure 1. Distribution of 41815 SNPs on the 26 chromosomes of upland cotton. The horizontal axis shows chromosome length (Mb); the different colors depict SNP density (the number of SNPs per window).
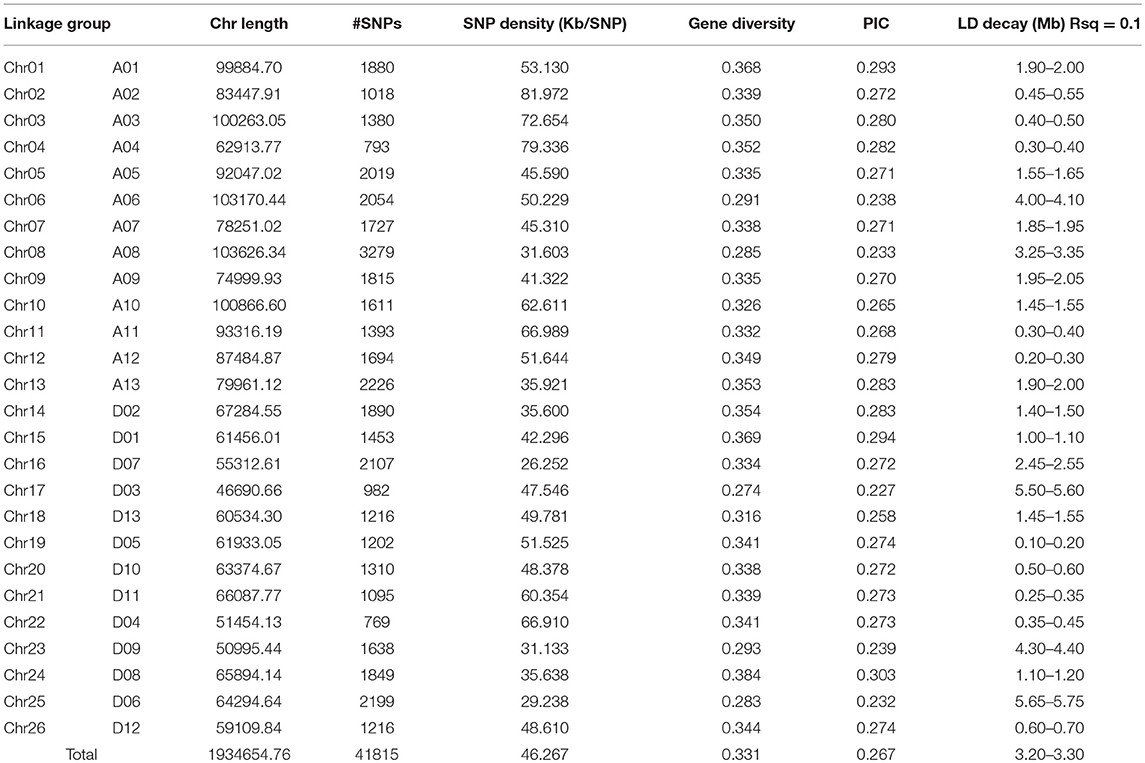
Table 4. Summary of SNPs, PIC, gene diversity, and LD decay.
LD Decay, Population Structure, and Kinship
The value of r2 between all the SNP markers genotypes in the 196 accessions, as the indicator of pairwise LD, was estimated using TASSEL v5.2.40. In this study, the average r2 at each 0.1 Mb was set as a function for inter-marker distance and used to estimate the LD decay in the upland cotton population, and the cut-off value of r2 was set to 0.1. The LD decay distance in the 196 accessions among all the SNP markers was 3.20–3.30 Mb (Figure 2). Furthermore, the LD decays occurred unevenly among different chromosomes (Table 4; Figure S2), ranging from 0.10–0.20 Mb (Chr19) to 5.65–5.75 Mb (Chr25). The Dt-subgenome chromosomes showed a smaller LD decay range than the At-subgenome chromosomes. Similar LD decays were detected between homoeologous chromosomes, such as Chr04-Chr22 (0.30–0.45 Mb) and Chr11-Chr21 (0.25–0.40 Mb), whereas distinct LD decay differences (>1.45 Mb) were observed in some other homologous chromosomes, e.g., Chr03-Chr17, Chr05-Chr19, Chr06-Chr25, Chr08-Chr24, and Chr09-Chr23.
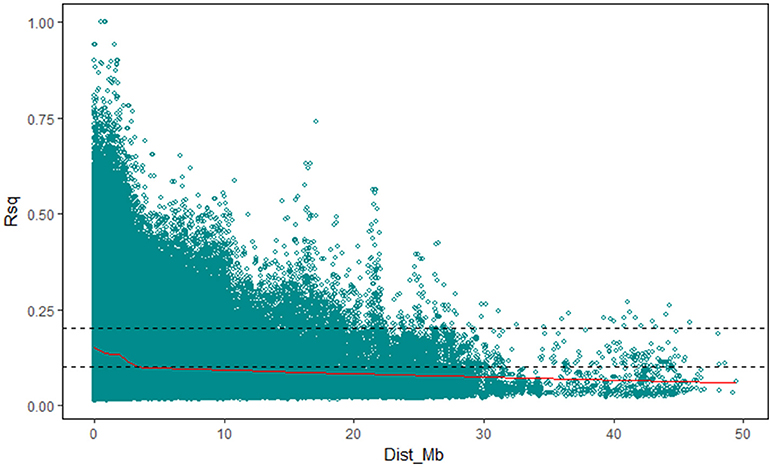
Figure 2. LD decay determined according to squared correlations of allele frequencies (r2).
Three methods were adopted to estimate the number of subpopulations of the 196 accessions basing the genotypic data, seeing that population structure affects the authenticity of QTL mapping. First, the UPGMA phylogeny tree based on Nei's genetic distances grouped 196 accessions into two major clusters (Figure 3A). Second, the Bayesian clustering was performed for K = 1–20 with seven repetitions using the software STRUCTURE. There was no an obvious inflection point in the curve of LnP(D)~K (from K = 1 to K = 20) (Figure S3A). However, a distinct spike value of the Evanno's DK was shown at K = 2 (Figure S3B), suggesting that the population could be divided into two subgroups (Figure 3C). Third, the genotypic PCA showed that the front three eigenvectors occupied only 15.84% of the observed genetic variations, with PC1, PC2, and PC3 accounting for 7.45, 4.53, and 3.85%, respectively. The PCA spatial distribution map showed that the population was divided into two subgroups with few overlapping regions (Figure 3B). The K matrix, another important factor for GWAS, was visualized using a heatmap (Figure S4), in which the two subpopulations were clearly separated. Overall, the results of the phylogeny tree, structure, PCA, and K matrix proved that the 196 accessions consisted of two subpopulations, containing 133 genotypes (Sub1) and 63 genotypes (Sub2), respectively (Table S1).
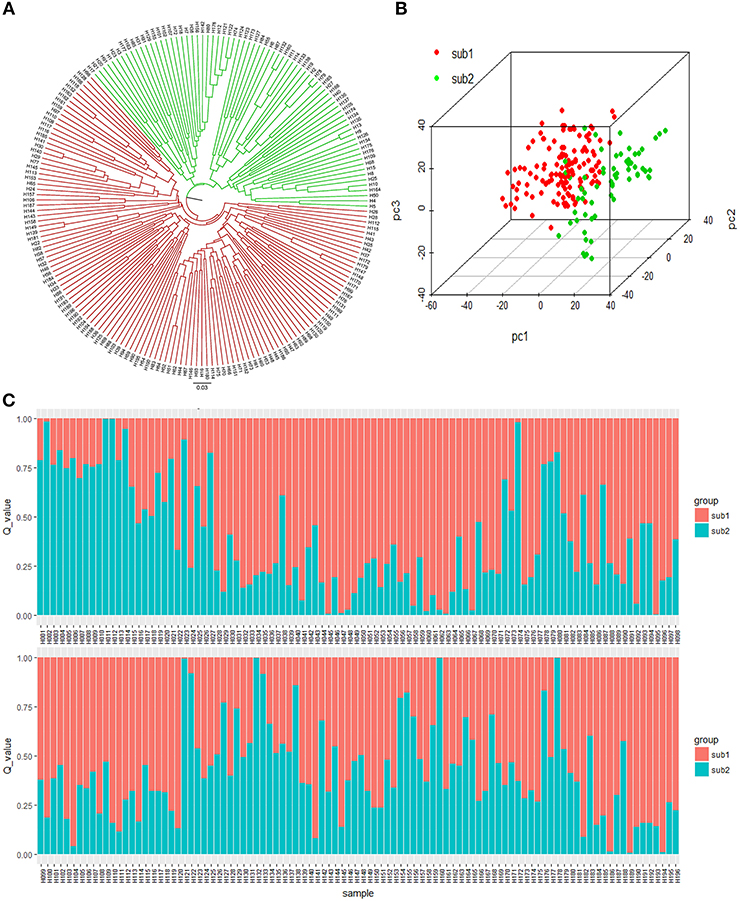
Figure 3. Population structure of the 196 accessions. (A) UPGMA tree based on Nei's genetic distances. (B) Principal component analysis of 196 accessions based on genotype. (C) Population structure of the 196 accessions based on STRUCTURE when K = 2.
Marker-Trait Associations
To determine the most appropriate model for association analysis, six common models, namely, the GLM model, the GLM (Q) model, the GLM(PCA) model, the MLM (K) model, the MLM (PCA + K) model, and the MLM (Q + K) model, were compared and shown using a quantile-quantile (Q-Q) plot (Figures 4B–10B). In the Q–Q plot of the seven seed nutrients, the scatter-lines based on the naive GLM, Q models, and PCA models clearly deviated from expectation, and hence the mixed linear models (MLM (K), MLM (PCA + K), and MLM (Q + K)) performed significantly better than the general linear models (naive GLM, GLM+Q, and GLM+PCA). The mixed linear model [MLM (K)] only reduced the errors in K compared to the MLM (Q + K) and MLM (PCA + K) models, which controlled both population structure (Q) and kinship (K). To make the most efficient use of the phenotypic and genotypic data in this study, the MLM (Q + K) model was finally selected for GWAS analysis, considering that the top two eigenvectors of PCA only accounted for 11.98% of the observed genetic variation.
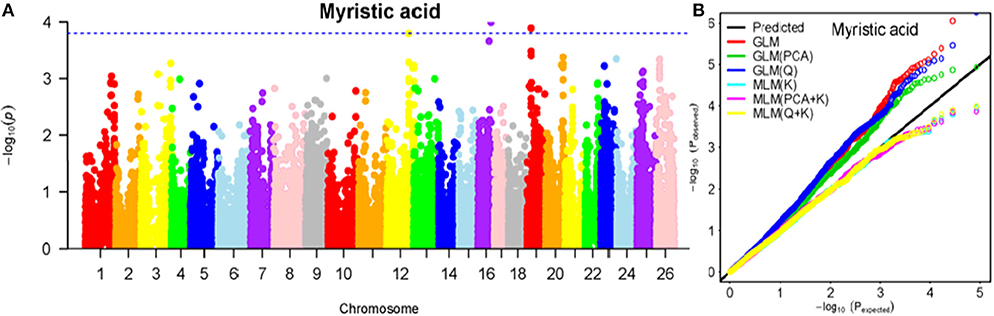
Figure 4. Summary of GWAS results for MA. (A) Manhattan plot for MA GWAS results. The threshold value was set at –log(p) > 3.80. (B) Q-Q plots for FP using GLM, GLM (Q), GLM (PCA), MLM (K), MLM (PCA+K), and MLM (Q+K).
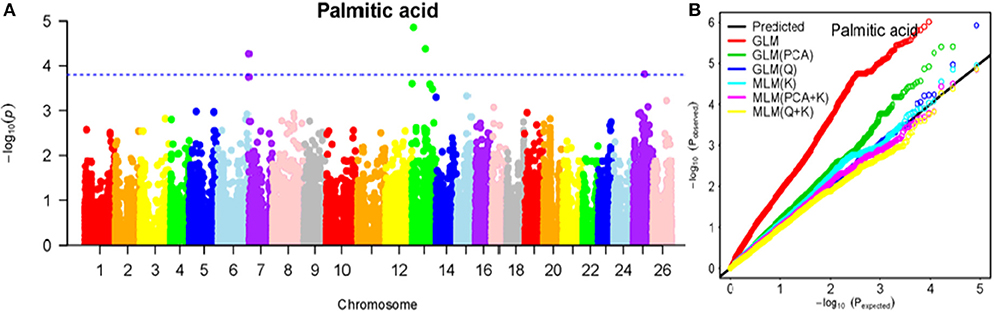
Figure 5. Summary of GWAS results for PA. (A) Manhattan plot for PA GWAS results. The threshold value was set at –log(p) > 3.80. (B) Q-Q plots for FP using GLM, GLM (Q), GLM (PCA), MLM (K), MLM (PCA+K), and MLM (Q+K).
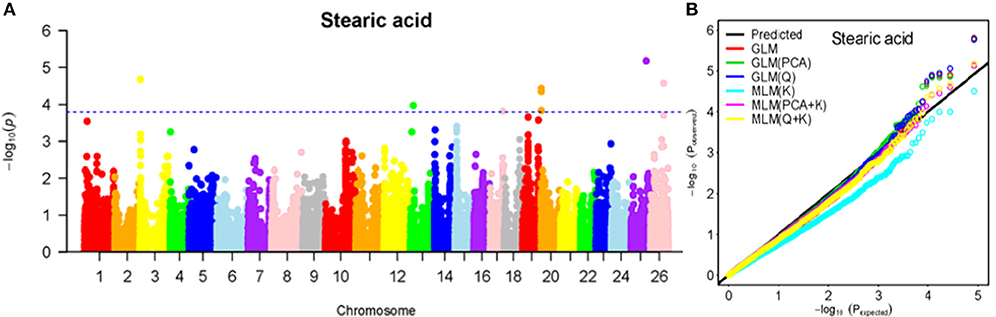
Figure 6. Summary of GWAS results for SA. (A) Manhattan plot for SA GWAS results. The threshold value was set at –log(p) > 3.80. (B) Q-Q plots for FP using GLM, GLM (Q), GLM (PCA), MLM (K), MLM (PCA+K), and MLM (Q+K).
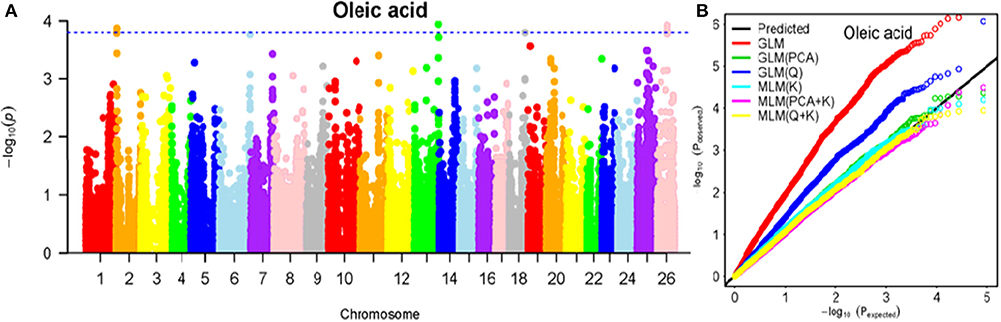
Figure 7. Summary of GWAS results for OA. (A) Manhattan plot for OA GWAS results. The threshold value was set at –log(p) > 3.80. (B) Q-Q plots for FP using GLM, GLM (Q), GLM (PCA), MLM (K), MLM (PCA+K), and MLM (Q+K).
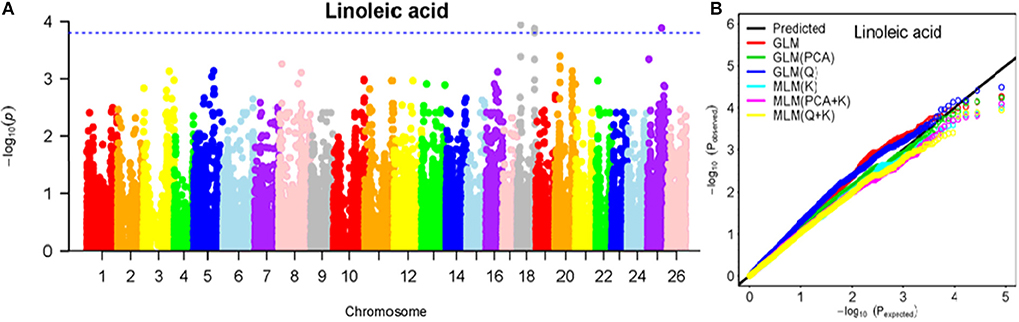
Figure 8. Summary of GWAS results for LA. (A) Manhattan plot for TA GWAS results. The threshold value was set at –log(p) > 3.80. (B) Q-Q plots for FP using GLM, GLM (Q), GLM (PCA), MLM (K), MLM (PCA+K), and MLM (Q+K).
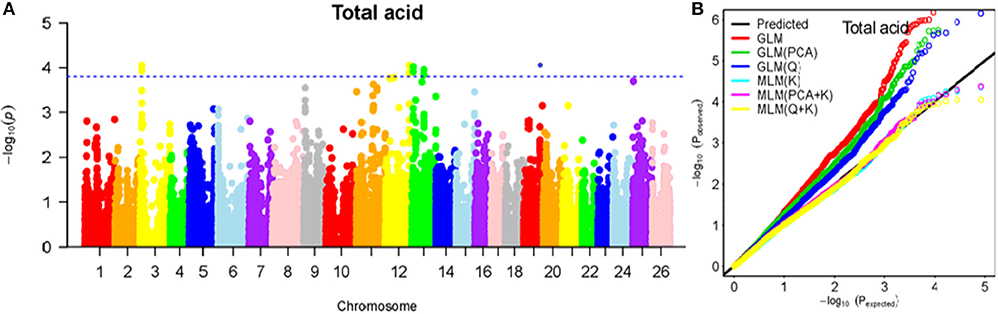
Figure 9. Summary of GWAS results for TA. (A) Manhattan plot for LA GWAS results. The threshold value was set at –log(p) > 3.80. (B) Q-Q plots for FP using GLM, GLM (Q), GLM (PCA), MLM (K), MLM (PCA+K), and MLM (Q+K).
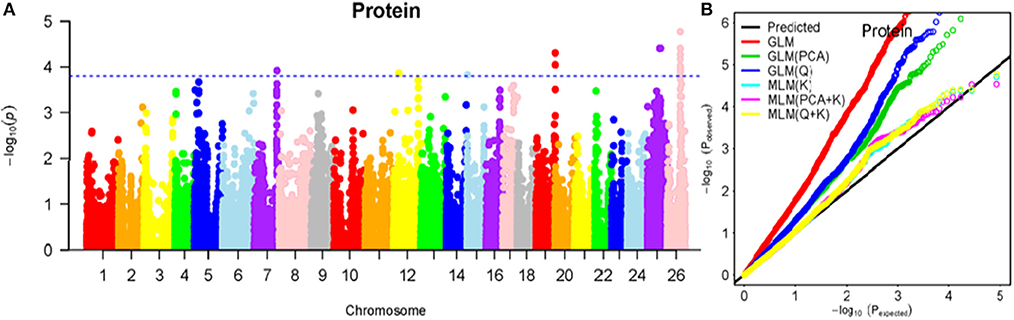
Figure 10. Summary of GWAS results for PR. (A) Manhattan plot for PR GWAS results. The threshold value was set at –log(p) > 3.80. (B) Q-Q plots for FP using GLM, GLM (Q), GLM (PCA), MLM (K), MLM (PCA+K), and MLM (Q+K).
The BLUPed traits and 41,815 SNP markers were used in the association analysis. With the Q+K model, 47 significantly associated SNP markers (–log(p) > 3.80) were identified for seven cottonseed nutrient traits (Table S2, Table 5; Figures 4A–10A). In addition, 40, 44, 39, 36, and 30 of the 47 SNP markers were verified in the GLM, GLM (Q), GLM (PCA), MLM (K), and MLM (PCA + K) models, respectively, suggesting the repeatability and reliability of the MLM (Q + K) model (Table S2). Furthermore, most of the significant SNP markers associated with the BLUPed traits were also detected in a single environment (Table 6), thereby suggesting the reliability of the marker-BLUPed trait associations. Among the 47 significant SNP markers, 2, 4, 8, 4, 4, 8, and 17 SNP markers were associated with MA, OA, SA, PA, LA, TA, and PR, respectively. The phenotypic variation explained by these SNP markers (R2) ranged from 7.3 to 13.3%, with an average of 9.5%.
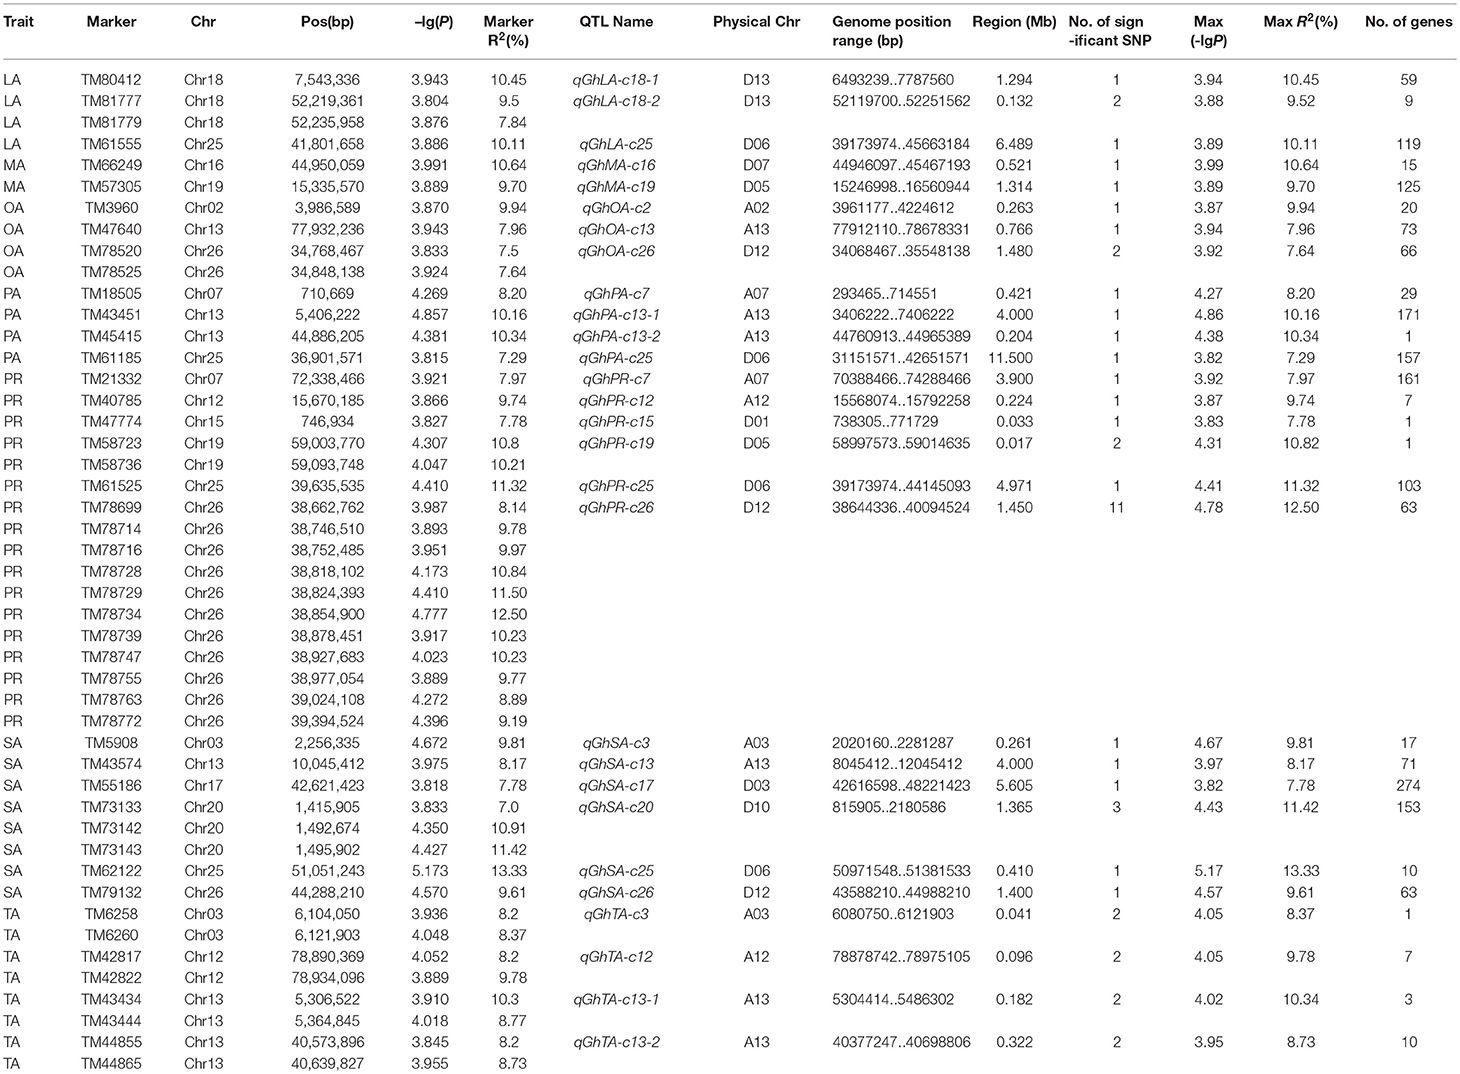
Table 5. Significant SNPs, QTLs, and candidate genes associated with seven cottonseed nutrient traits.
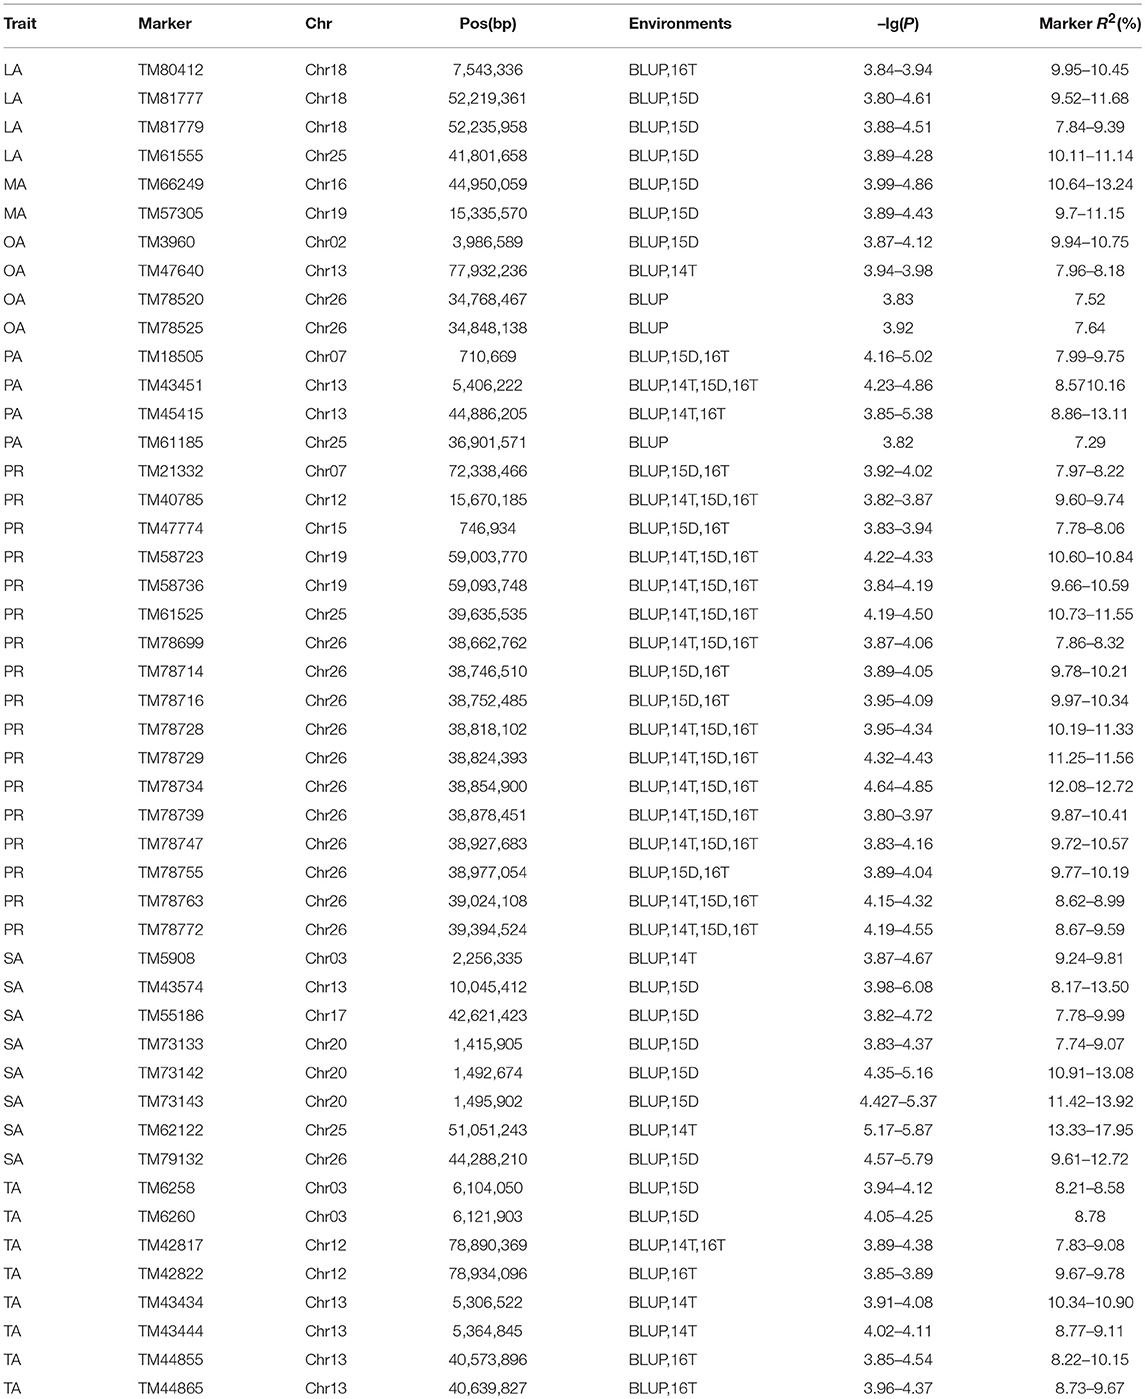
Table 6. Significant SNP markers associated with BLUPed traits shared with those markers detected in a single environment.
If the distance between the lead SNP and following SNP markers was less than the LD decay distance among each chromosome or the pairwise r2 (the LD statistic) between the lead SNP and the following SNP markers was >0.1, then these SNP markers were set as a confidence interval for a QTL. Consequently, from the 47 associated SNP markers (Table 5; Table S3), 28 QTLs were identified on 13 chromosomes, including four pairs of homologous chromosomes (A03-D03, A07-D07, A12-D12, and A13-D13) containing 19 QTLs (67.9%). For PR, six QTLs were located on six chromosomes, explaining 7.78–12.50% of the observed phenotypic variation (PV). Four QTLs conferring TA, located on three chromosomes (A03, A12, and A13) explained 8.37–10.34% of the PV. As for fatty acid composition, six QTLs for SA were mapped to six chromosomes and accounted for 7.78–13.33% of the PV. The number of QTLs controlling LA, MA, OA, and PA was 3, 2, 3, and 4, and the PV explained was 9.52–10.45%, 9.70–10.64%, 7.64–9.94%, and 7.29–10.34%, respectively (Table 5; Table S3).
The number of significant SNP markers within the QTL regions varied from 1 to 11. Nine QTL regions contained two or more significant SNP markers, of which the qGhPR-c26 region contained the maximum of 11 significant SNP markers (Table 5). According to the physical positions of SNP markers intervals for QTLs, the 28 QTLs were assigned to physical regions on the G. hirsutum (TM-1) genome, and a total of 1,789 genes were localized to these riveted regions (Table 5). Each QTL region contained 1 to 274 genes, with an average of 64 genes.
Candidate Gene Approach
There was only one QTL, qGhPR-c26, which encompassed more than five significant SNPs. Thus, the LD decay distance of that QTL was narrow and less than 1 Mb at r2 < 0.1. The qGhPR-c26 accounted for 10.09% of the PR (total protein) variation, and the minimum P-value was 0.0000167. Combining the QTL qGhPR-c26 (D12:338644336..0094524) and the LD heatmap (TM78688_TM78690 – TM78740_TM78747: D12:38600352..38927683) (Figure 11), the candidate region was further narrowed down to the region D12:38644336..3892683, and eight genes were located in this region (Table S4). All the candidate genes of fatty acid and total protein were already annotated in A. thaliana (Table S5). Of these, Gh_D12G1162 and Gh_D12G1165 were preferentially expressed in the ovules at 5, 10, and 20 DPA, and Gh_D12G1161 was preferentially expressed in the ovules at 20, 25, and 35 DPA, based on the TM-1 gene expression database (Tables S4, S5).
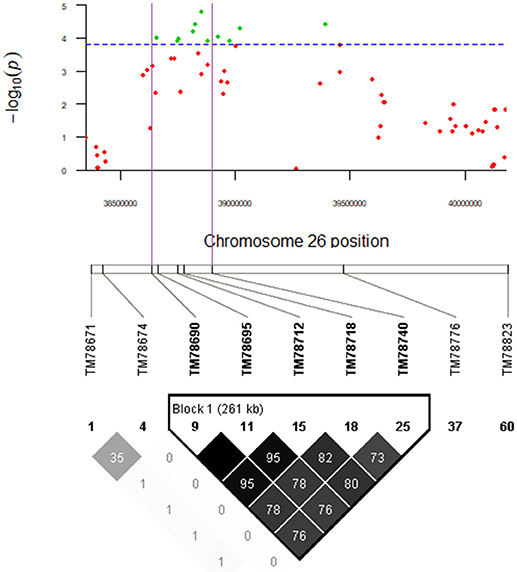
Figure 11. qGhPR-c26 on Chr26 (D12: 38644336..40094524) was associated with protein content in seed. Manhattan plot shown for the D12: 38644336..40094524 region. The green plot in purple region of Manhattan plot and the bold SNP markers in Block 1 (261kb) were significantly associated with PR.
According to the TM-1 gene expression database (Zhang et al., 2015), a number of genes located in the QTL confidence intervals in the present study had specific temporal and spatial expression patterns in the roots, stems, leaves, and ovules (5 DPA, 10 DPA, 20 DPA, 25 DPA, and 35 DPA). Therefore, these genes are considered to be involved in the corresponding features. For example, the genes particularly or preferentially expressed in the ovule may be associated with seed oil content and protein content. After screening, 89 genes preferentially expressed in the ovules were found and were considered as the potential candidate genes for 21 QTLs (Table S6). The number of genes located in one QTL region ranged from 5 for TA to 26 for SA.
The annotation information of A. thaliana was also used as a reference for the screening of candidate genes (Table S7). Several genes coding key enzymes in fatty acid synthesis were screened out from the fatty acid-related QTL regions. For example, Gh_D13G1748, located in qGhLA-c18-2 (Table S8), was annotated to encode the acyl carrier protein 5, which modulates the fatty acid composition in A. thaliana (Huang et al., 2017b). SA is the substrate for the synthesis of OA. The gene, Gh_D12G1429, located in qGhSA-c26, was annotated to encode fatty acyl-ACP thioesterase B (FATB), which enhances the quality of cottonseed oil with high OA (Liu et al., 2017a). The β-ketoacyl-acyl carrier protein synthase III (KAS III) is one of the main factors affecting the initiation step of the fatty acid chain, involving a Claisen condensation of the acetyl-CoA starter unit with the first extender unit, malonyl-ACP, to form acetoacetyl-ACP (Dawe et al., 2003; Abugrain et al., 2017). The qGhSA-c17 region contained a KAS III gene, Gh_D03G1548, implying its involvement in fatty acid synthesis.
Discussion
Correlation and Simultaneous Improvement of Cottonseed Protein and Oil
Cottonseed, an important by-product of cotton, is produced in large amounts every year around the world, and has been used in solving health and starvation problems caused by the increasing world population (Cai et al., 2010; Liu et al., 2017b). The improvement of cottonseed through breeding has been gaining increasing attention in the recent years. However, the well documented negative correlation between cottonseed protein and oil and the complex genetic control hinder their simultaneous improvement in the conventional cotton breeding programs (Song and Zhang, 2007; Yu et al., 2012; Badigannavar and Myers, 2015; Liu et al., 2015a,b). We also detected such negative correlation between cottonseed protein and oil and found that of the five fatty acid compositions measured, only OA is negatively correlated to PR. The other four fatty acids, namely, SA, PA, LA, and MA, showed significant positive or very weak non-significant correlation with PR (Table 3). These findings suggest that the TA-PR negative correlation might be due to, at least to some extent, the OA-PR negative correlation in this panel. These results implied the possibility to increase PR together with SA, PA, LA, and MA by maintaining the OA level in breeding. The strong, negative relationship between oil and protein could be because of the linked QTLs/SNP markers that separately regulate their concentrations or due to the pleiotropic effects of some QTLs/SNP markers (Chung et al., 2003). In the present study, we detected qGhLA-c25 with the additive effect to increase LA, and qGhPR-c25 having an additive effect to reduce PR, within the same region on Chr25. Thus, this region is difficult to use in improving LA and PR simultaneously.
Precision in GWAS
GWAS is an alternative approach that makes use of a number of recombination events that have occurred within the evolutionary history of natural populations, circumventing the limitations of linkage map analysis (Rafalski, 2010). GWAS has been widely used to detect QTLs and to dissect the genetic architecture of complex quantitative traits in plants (Edwards et al., 2013; Saïdou et al., 2014). Population genetic diversity levels, phenotyping accuracy, marker density, and statistical algorithms are the major factors influencing the power of GWAS.
Therefore, an association population should cover a large number of accessions to encompass the genetic diversity as much as possible. However, working with large populations may be prone to errors because of the differences in field environments and management measures, especially for the cotton being a large-plant crop, which could decrease the detection accuracy of association analysis (Liu et al., 2015b). Hence, core or mini-core collection is a useful choice. In addition, adding exotic germplasm to increase the level of geographical distribution and phenotypic variation of the population is a common practice. The upland cotton panel was a sub collection from 274 accessions and covered a large geographical distribution, with a relatively high average PIC of 0.267 and a high phenotypic variation (Table 2).
For cottonseed oil and protein content, both additive and non-additive (including dominance) effects have been reported (Kohel, 1980; Dani and Kohel, 1989; Wu et al., 2009, 2010). Recently, significant epistatic effects on the oil and protein content were also detected in the study of Du et al. (2018). They also detected a significant interaction effect between epistasis and environment only for the oil content. In our study, the environment was also responsible for a sizeable portion of the observed total variations in oil and protein content, and the interaction between the genotype and the environment in oil concentration was larger than that for total protein content. Due to strong genotype × environment interactions in complex quantitative traits, phenotyping under multi-environments is usually adopted to eliminate/minimize the environment effect in GWAS. Despite such an approach, a significant proportion of the genetic variation is still unaccounted for, and the accuracy of prediction is usually low. Evidence shows that the accuracy of prediction can be improved when the phenotypes are regressed on hundreds of thousands of variants simultaneously using whole-genome regression (WGR) models (de et al., 2013). The BLUP, which is a commonly adopted WGR method with high prediction accuracy in plant and animal breeding populations (de et al., 2013; Huang et al., 2017a), was used to estimate the phenotypic performance in the present study.
Marker density is another important factor influencing the power of GWAS. On cotton chromosomes, the distribution of recombination rate and genes/markers showed a close association (Shen et al., 2017). Only with enough marker density, the true LD distribution and decay distance, which influence the resolution and capacity of the QTLs in GWAS, could be detected. With the release of the whole genome sequence of G. hirsutum (Li et al., 2015; Zhang et al., 2015), a high-density SNP chip, CottonSNP80K, was developed and verified to be a reliable, efficient, and high-throughput tool for genotyping G. hirsutum accessions and genome analysis (Cai et al., 2017). This SNP chip was used for genotyping of the association panel in this study and resulted in an average polymorphic marker density of 1SNP/46.267Kb genome-widely, varying from 1SNP/81.972Kb (Chr02) to 1SNP/26.252Kb (Chr16), which fulfilled the requirement for GWA mapping.
The use of appropriate statistical algorithms is also essential for GWAS. To reduce the errors related to population structure and kinship, the optimal model, MLM(Q+K) was selected by comparing six models using the quantile–quantile analysis. The results indicated that this strategy was effective. The 196 accessions were assigned to two subpopulations based on the peak of Δk. The sub2 contained accessions mostly from YRR, whereas the sub1 possessed genotypes with wide geographic origins (Figure 3A). These results indicated that extensive exotic introductions or use in crosses of parents originating from diverse geographic regions in China and other cotton-growing countries contributed to gene exchange among cotton accessions (Zhao et al., 2015; Nie et al., 2016; Huang et al., 2017a). This is in general agreement with the common practice of cultivating breeding populations obtained by crossing parents with different genetic relationships and backgrounds to achieve on-going improvements in targeted traits (Hao et al., 2017). Finally, 47 significant SNPs located in 28 QTLs were identified for seven seed nutrient traits, of which 40, 44, 39, 36, and 30 loci were shared with GLM, GLM(Q), GLM(PCA), MLM(K), and MLM(PCA+K), respectively.
LD Decay in Upland Cotton
The previous studies showed that the LD decay influenced the resolution and capacity of GWAS, and varied among different species and populations. In Zea mays, Glycine max, Oryza sativa, and Brassica napus, the LD decay distances were <100 kb, <600 kb, <1 Mb, and <6 Mb, respectively (Hyten et al., 2007; Huang et al., 2017a). The LD decay distance also varied in upland cotton populations from 3.4 to 25 cM (Abdurakhmonov et al., 2008; Fang et al., 2013; Saeed et al., 2014). Different subpopulations showed variable LD decay speed (Cai et al., 2017; Li et al., 2017). A previous study showed that subpopulations with a rapid LD decay experience higher selective pressure during evolution (Cai et al., 2017). With the approximate ratio of 1.75 cM/Mb (Wang et al., 2015), the LD decay distance in this study would be 5.60~5.78 cM (3.20~3.30 Mb) when r2 = 0.1 in the whole genome. This result showed a slower LD decay in upland cotton, which agrees with the findings of Huang et al. (2017a). This slower LD decay may be caused mainly by the short cotton breeding history in China and the low rate of outcrossing, and possibly by the loss of genetic variation due to inbreeding and founder effect (Mackay and Powell, 2007; Li et al., 2013b; Huang et al., 2017a).
Furthermore, the estimates of LD provide insights into the haplotype block structure of the various chromosomes, providing researchers with a way to efficiently select markers and infer genotypes based on nearby loci (Reddy et al., 2017). In the study of Reddy et al. (2017), adjacent and pairwise measurements of LD were calculated and the average LD decay in G. hirsutum was 117 Kb, which was shorter than that calculated using multi-locus LD with 200 step windows in our study. The shorter LD decays were useful for identifying the QTL intervals that resulted in identifying less spurious candidate genes in GWAS experiments. However, we used the longer LD decay in this study in order to cover more candidate genes possibly related to the traits, which would be identified with the TM-1 gene expression database and candidate gene function or annotation analysis in future studies.
In addition, LD decays varied among chromosomes from 0.2 to 5.75 Mb in this study (Table 4; Figure S2). LD decays in Chr02, Chr03, Chr04, Chr11, Chr12, Chr19, Chr20, Chr21, Chr22, and Chr26 were relatively lower (<1.00 Mb), whereas those in Chr06, Chr08, Chr17, Chr23, and Chr25 were higher (>3.00 Mb). The chromosomes with slower LD decay might be involved in the domestication process (Li et al., 2013b), whereas the chromosomes with higher LD decay underwent frequent selection and intensive utilization in breeding (Huang et al., 2017a). In the present study, 22 of all 28 QTLs were on chromosomes with relative lower LD decay (< 2.00 Mb), which agreed with the fact that less attention had been paid to cottonseed nutrient traits compared to yield and fiber-related traits in cotton breeding practices. Homologous chromosomes Chr04 (A04) - Chr22 (D04) and Chr11 (A11) - Chr21 (D11) had similar lower levels of LD, implying that these experienced parallel evolution during the domestication process. Besides, the LD distances among the rest of the homologous chromosomes were different, indicating that a pair of homologous chromosomes had evolved differently.
Stable and New QTLs Conferring Cottonseed Oil and Protein Content
Stability of QTLs/markers across populations, environments, and genetic backgrounds is essential for MAS in breeding practices. GWAS is an efficient method to identify QTLs and dissect the genetic control of complex quantitative traits (Saeed et al., 2014; Islam et al., 2016; Cai et al., 2017; Huang et al., 2017a; Du et al., 2018). Compared to the agronomic and quality traits of cotton, very few reports in linkage mapping (Song and Zhang, 2007; Yu et al., 2012; Liu et al., 2015a), even less in GWAS (Badigannavar and Myers, 2015; Liu et al., 2015b) have been previously reported. In addition, fewer stable QTLs have been verified in earlier investigations (Yu et al., 2012; Liu et al., 2015a,b). Through comparing the physical position of the associated/linked markers aligned to TM-1 physical map using the automated batch BLASTN search with E ≤ 1e−10, the QTLs were detected herein and in previous reports (Song and Zhang, 2007; Yu et al., 2012; Badigannavar and Myers, 2015; Liu et al., 2015a,b). Of the 28 QTLs detected in this study, four QTLs (Table S8) were also detected in the previous studies (Yu et al., 2012; Liu et al., 2015a). Briefly, in the co-confidence interval of qGhLA-c25 and qGhPA-c25 detected herein, a seed crude oil QTL, qOil-c25-1 (linked to SSR BNL3103), was detected (Yu et al., 2012). The qGhTA-c12 for TA in this work shared a confidence interval with a previously mapped QTL qOil2-c12-1 (BNL4059-BNL2717) for cottonseed oil (Yu et al., 2012). The qGhSA-c3 for SA of the present work located about 2 Kb away from the SSR NAU3016 associated with SA (Liu et al., 2015a).
In addition to the four stable QTLs mentioned above, some new QTLs including 18 for seed oil and fatty acid composition and six for seed protein were also identified in this work and their stability needs to be verified. Besides comparison of QTLs identified in different works, candidate gene function or annotation analysis is an alternative method widely used in preliminary verification of the detected QTLs. The annotation information of the candidate genes in the QTL regions (Table S7) will no doubt contribute to the further verification of these QTLs/genes. Particularly, the candidate region of qGhPR-c26 for PR (total protein) contained 8 genes (Gh_D12G1160 - Gh_D12G1167) annotated with Arabidopsis thaliana, SwissProt, InterProtscan, and GO function (Table S4). The candidate gene Gh_D12G1162 (GIF1: GRF1-interacting factor 3), which plays an important role in the governing of cell proliferation by means of cell cycle regulation and in other developmental characteristics associated with the function of shoot apical meristem, was identified in A. thaliana (Lee et al., 2014; Table S4). Gh_D12G1163 (KCS1), which is considered as the rate-limiting key enzyme by which the substrate and tissue specificities of fatty acid elongation are also decided in higher plants (Xiao et al., 2016), may affect the ratio of oil and protein in cottonseed. The genes, Gh_D12G1160 and Gh_D12G1161, coding the basic helix-loop-helix (bHLH) DNA-binding family proteins, which have been identified and characterized functionally in many plants with a critical role in the control of various biological processes including growth, development, and responses to various stresses (Gangappa and Chattopadhyay, 2013; Yastreb et al., 2016), may be related to the development of ovule and even to the protein accumulation during the development of seed. The genes, Gh_D12G1164, Gh_D12G1166, and Gh_D12G1167 (D-arabinono-1,4-lactone oxidase family protein), are related to oxidoreductase activity, D-arabinono-1,4-lactone oxidase activity, FAD binding, and catalytic activity in sperm cells and hypocotyls. Gh_D12G1165 encodes a plant invertase/pectin methylesterase inhibitor superfamily protein. In addition, the TM-1 gene expression database showed that three genes, Gh_D12G1162, Gh_D12G1165, and Gh_D12G1161, were expressed preferentially in the ovules (Table S4; Zhang et al., 2015). Therefore, these three genes were very likely to be involved in the protein synthesis and accumulation in cottonseeds.
In future verification studies, these candidate genes might be identified by detecting the expression of these genes during the different development stages of target regions and/or by inhibiting or overexpressing these genes.
Author Contributions
X-LS and X-ZS designed the experiments. YY and X-LS wrote the manuscript. XW, HX, LW, QW, JT, WF, and GZ helped in collecting phenotypic data. MS helped analyze the results and revised the manuscript. YY, XW, and LW performed most of the experiments and contributed equally to this work. All authors read and approved the final manuscript.
Funding
This research was financially supported by the National Key Research and Development Program (2018YFD0100303) and the Major Projects for Transgenic Breeding of China (2017ZX08005-004-006), the System of Modern Agriculture Industrial Technology (SDAIT-03-03/05), the Natural Science foundation (ZR2017MC057) and the Agricultural Seed Project (cotton variety development, 2014-2017) of Shandong Province, and the Innovation Projects for improvement of Saline Land (2015) of Shandong Agricultural University.
Conflict of Interest Statement
The authors declare that the research was conducted in the absence of any commercial or financial relationships that could be construed as a potential conflict of interest.
Acknowledgments
We thank Professor Sishen Li (Agronomy College, Shandong Agricultural University, Taian, Shandong, China) for his help with the genetic calculations and LetPub (www.letpub.com) for its linguistic assistance during the preparation of this manuscript.
Supplementary Material
The Supplementary Material for this article can be found online at: https://www.frontiersin.org/articles/10.3389/fpls.2018.01359/full#supplementary-material
References
Abdurakhmonov, I. Y., Kohel, R. J., Yu, J. Z., Pepper, A. E., Abdullaev, A. A., Kushanov, F. N., et al. (2008). Molecular diversity and association mapping of fiber quality traits in exotic G. hirsutum L. germplasm. Genomics 92, 478–487. doi: 10.1016/j.ygeno.2008.07.013
Abugrain, M. E., Brumsted, C. J., Osborn, A. R., Philmus, B., and Mahmud, T. (2017). A highly promiscuous ß-ketoacyl-acp synthase (kas) III-like protein is involved in pactamycin biosynthesis. ACS Chem. Biol. 12, 362–366. doi: 10.1021/acschembio.6b01043
Badigannavar, A., and Myers, G. O. (2015). Genetic diversity, population structure and marker trait associations for seed quality traits in cotton (Gossypium hirsutum). J. Genet. 94, 87–94. doi: 10.1007/s12041-015-0489-x
Branham, S. E., Wright, S. J., Reba, A., and Linder, C. R. (2015). Genome-wide association study of Arabidopsis thaliana identifies determinants of natural variation in seed oil composition. J. Hered. 107, 248–256. doi: 10.1093/jhered/esv100
Cai, C., Zhu, G., Zhang, T., and Guo, W. (2017). High-density 80 K SNP array is a powerful tool for genotyping G. hirsutum accessions and genome analysis. BMC Genomics 18:654. doi: 10.1186/s12864-017-4062-2
Cai, Y., Xie, Y., and Liu, J. (2010). Glandless seed and glanded plant research in cotton. A review. Agron. Sustain. Dev. 30, 181–190. doi: 10.1051/agro/2008024
Calati, R., Porcelli, S., Giegling, I., Hartmann, A. M., Möller, H. J., De, R. D., et al. (2011). Catechol-o-methyltransferase gene modulation on suicidal behavior and personality traits: review, meta-analysis and association study. J. Psychiatr. Res. 45, 309–321. doi: 10.1016/j.jpsychires.2010.07.004
Cao, Y., Li, S., Wang, Z., Chang, F., Kong, J., Gai, J., et al. (2017). Identification of major quantitative trait loci for seed oil content in soybeans by combining linkage and genome-wide association mapping. Front. Plant Sci. 8:1222. doi: 10.3389/fpls.2017.01222
Cavanagh, C., Morell, M., Mackay, I., and Powell, W. (2008). From mutations to MAGIC: resources for gene discovery, validation and delivery in crop plants. Curr. Opin. Plant Biol. 11, 215–221. doi: 10.1016/j.pbi.2008.01.002
Chung, J., Babka, H. L., Graef, G. L., Staswick, P. E., Lee, D. J., Cregan, P. B., et al. (2003). The seed protein oil and yield QTL on soybean linkage group I. Crop Sci. 43, 1053–1067. doi: 10.2135/cropsci2003.1053
Dani, R. G., and Kohel, R. J. (1989). Maternal effects and generation mean analysis of seed-oil content in cotton (Gossypium hirsutum L.). Theor. Appl. Genet. 77, 569–575. doi: 10.1007/BF00274282
Dawe, J. H., Porter, C. T., Thornton, J. M., and Tabor, A. B. (2003). A template search reveals mechanistic similarities and differences in beta-ketoacyl synthases (KAS) and related enzymes. Proteins Struct. Funct. Bioinformatics 52, 427–435. doi: 10.1002/prot.10421
de, L. C. G., Vazquez, A. I., Fernando, R., Klimentidis, Y. C., and Sorensen, D. (2013). Prediction of complex human traits using the genomic best linear unbiased predictor. PLoS Genet. 9:e1003608. doi: 10.1371/journal.pgen.1003608
Du, X., Liu, S., Sun, J., Zhang, G., Jia, Y., Pan, Z., et al. (2018). Dissection of complicate genetic architecture and breeding perspective of cottonseed traits by genome-wide association study. BMC Genomics 19:451. doi: 10.1186/s12864-018-4837-0
Earl, D. A., and Vonholdt, B. M. (2012). STRUCTURE HARVESTER: a website and program for visualizing structure output and implementing the Evanno method. Conserv. Genet. Resour. 4, 359–361. doi: 10.1007/s12686-011-9548-7
Edwards, D., Batley, J., and Snowdon, R. J. (2013). Accessing complex crop genomes with next-generation sequencing. Theor. Appl. Genet. 126, 1–11. doi: 10.1007/s00122-012-1964-x
Evanno, G., Regnaut, S., and Goudet, J. (2005). Detecting the number of clusters of individuals using the software STRUCTURE: a simulation study. Mol. Ecol. 14, 2611–2620. doi: 10.1111/j.1365-294X.2005.02553.x
Fang, D. D., Hinze, L. L., Percy, R. G., Li, P., Deng, D., and Thyssen, G. (2013). A microsatellite-based genome-wide analysis of genetic diversity and linkage disequilibrium in upland cotton (Gossypium hirsutum L.) cultivars from major cotton-growing countries. Euphytica 191, 391–401. doi: 10.1007/s10681-013-0886-2
Fang, L., Wang, Q., Hu, Y., Jia, Y., Chen, J., Liu, B., et al. (2017). Genomic analyses in cotton identify signatures of selection and loci associated with fiber quality and yield traits. Nat. Genet. 49, 1089–1098. doi: 10.1038/ng.3887
Gacek, K., Bayer, P. E., Bartkowiak-Broda, I., Szala, L., Bocianowski, J., Edwards, D., et al. (2017). Genome-wide association study of genetic control of seed fatty acid biosynthesis in Brassica napus. Front. Plant Sci. 7:2062. doi: 10.3389/fpls.2016.02062
Gangappa, S. N., and Chattopadhyay, S. (2013). MYC2 differentially regulates GATA-box containing promoters during seedling development in Arabidopsis. Plant Signal. Behav. 8:e25679. doi: 10.4161/psb.25679
Gore, M. A., Fang, D. D., Poland, J. A., Zhang, J., Percy, R. G., and Cantrell, R. G. (2014). Linkage map construction and quantitative trait locus analysis of agronomic and fiber quality traits in cotton. Plant Genome 7, 1–10. doi: 10.3835/plantgenome2013.07.0023
Hanny, B. W., Meredith, W. R., Bailey, J. C., and Harvey, A. J. (1978). Genetic relationships among chemical constituents in seeds, flower buds, terminals, and mature leaves of cotton. Crop Sci. 18, 1071–1074. doi: 10.2135/cropsci1978.0011183X001800060042x
Hao, X., Plastow, G., Zhang, C., Xu, S., Hu, Z., Yang, T., et al. (2017). Genome-wide association study identifies candidate genes for piglet splay leg syndrome in different populations. BMC Genet. 18:64. doi: 10.1186/s12863-017-0532-4
Huang, C., Nie, X., Shen, C., You, C., Li, W., Zhao, W., et al. (2017a). Population structure and genetic basis of the agronomic traits of upland cotton in China revealed by a genome-wide association study using high-density SNPs. Plant Biotechnol. J. 15, 1374–1386. doi: 10.1111/pbi.12722
Huang, J., Xue, C., Wang, H., Wang, L., Schmidt, W., Shen, R., et al. (2017b). Genes of acyl carrier protein family show different expression profiles and overexpression of acyl carrier protein 5 modulates fatty acid composition and enhances salt stress tolerance in Arabidopsis. Front. Plant Sci. 8:987. doi: 10.3389/fpls.2017.00987
Hyten, D. L., Choi, I. Y., Song, Q., Shoemaker, R. C., Nelson, R. L., Costa, J. M., et al. (2007). Highly variable patterns of linkage disequilibrium in multiple soybean populations. Genetics 175, 1937–1944. doi: 10.1534/genetics.106.069740
Islam, M. S., Thyssen, G. N., Jenkins, J. N., Zeng, L., Delhom, C. D., Mccarty, J. C., et al. (2016). A MAGIC population-based genome-wide association study reveals functional association of GhRBB1_A07 gene with superior fiber quality in cotton. BMC Genomics 17:903. doi: 10.1186/s12864-016-3249-2
Jakobsson, M., and Rosenberg, N. A. (2007). CLUMPP: a cluster matching and permutation program for dealing with label switching and multimodality in analysis of population structure. Bioinformatics 23, 1801–1806. doi: 10.1093/bioinformatics/btm233
Javed, N., Geng, J., Tahir, M., Mcvetty, P. B. E., Li, G., and Duncan, R. W. (2016). Identification of QTL influencing seed oil content, fatty acid profile and days to flowering in Brassica napus L. Euphytica 207, 191–211. doi: 10.1007/s10681-015-1565-2
Jiao, X., Zhao, X., Zhou, X. R., Green, A. G., Fan, Y., Wang, L., et al. (2013). Comparative transcriptomic analysis of developing cotton cotyledons and embryo axis. PLoS ONE 8:e71756. doi: 10.1371/journal.pone.0071756
Kohel, R. J. (1980). Genetic studies of seed oil in cotton. Crop Sci. 20, 784–787. doi: 10.2135/cropsci1980.0011183X002000060026x
Lee, B. H., Wynn, A. N., Franks, R. G., Hwang, Y. S., Lim, J., and Kim, J. H. (2014). The Arabidopsis thaliana GRF - INTERACTING FACTOR gene family plays an essential role in control of male and female reproductive development. Dev. Biol. 386, 12–24. doi: 10.1016/j.ydbio.2013.12.009
Li, C., Miao, H., Wei, L., Zhang, T., Han, X., and Zhang, H. (2014a). Association mapping of seed oil and protein content in Sesamum indicum l. using ssr markers. PLoS ONE 9:e105757. doi: 10.1371/journal.pone.0105757
Li, F., Fan, G., Lu, C., Xiao, G., Zou, C., Kohel, R. J., et al. (2015). GGenome sequence of cultivated Upland cotton (Gossypium hirsutum TM-1) provides insights into genome evolution. Nat. Biotechnol. 33, 524–530. doi: 10.1038/nbt.3208
Li, F., Fan, G., Wang, K., Sun, F., Yuan, Y., Song, G., et al. (2014b). Genome sequence of the cultivated cotton Gossypium arboreum. Nat. Genet. 46, 567–572. doi: 10.1038/ng.2987
Li, H., Peng, Z., Yang, X., Wang, W., Fu, J., Wang, J., et al. (2013a). Genome-wide association study dissects the genetic architecture of oil biosynthesis in maize kernels. Nat. Genet. 45, 43–50. doi: 10.1038/ng.2484
Li, T., Ma, X., Li, N., Zhou, L., Liu, Z., Han, H., et al. (2017). Genome-wide association study discovered candidate genes of Verticillium wilt resistance in upland cotton (Gossypium hirsutum L.). Plant Biotechnol. J. 15, 1520–1532. doi: 10.1111/pbi.12734
Li, Y. H., Zhao, S. C., Ma, J. X., Li, D., Yan, L., Li, J., et al. (2013b). Molecular footprints of domestication and improvement in soybean revealed by whole genome re-sequencing. BMC Genomics 14:579. doi: 10.1186/1471-2164-14-579
Lian, J., Lu, X., Yin, N., Ma, L., Lu, J., Liu, X., et al. (2017). Silencing of BnTT1 family genes affects seed flavonoid biosynthesis and alters seed fatty acid composition in Brassica napus. Plant Science 254, 32–47. doi: 10.1016/j.plantsci.2016.10.012
Liu, D., Liu, F., Shan, X., Zhang, J., Tang, S., Fang, X., et al. (2015a). Construction of a high-density genetic map and lint percentage and cottonseed nutrient trait QTL identification in upland cotton (Gossypium hirsutum L.). Mol. Genet. Genom. 290, 1683–1700. doi: 10.1007/s00438-015-1027-5
Liu, F., Zhao, Y. P., Zhu, H. G., Zhu, Q. H., and Sun, J. (2017a). Simultaneous silencing of GhFAD2-1, and GhFATB, enhances the quality of cottonseed oil with high oleic acid. J. Plant Physiol. 215, 132–139. doi: 10.1016/j.jplph.2017.06.001
Liu, G., Mei, H., Wang, S., Li, X., Zhu, X., and Zhang, T. (2015b). Association mapping of seed oil and protein contents in upland cotton. Euphytica 205, 637–645. doi: 10.1007/s10681-015-1450-z
Liu, H., Quampah, A., Chen, J., Li, J., Huang, Z., He, Q., et al. (2017b). QTL mapping with different genetic systems for nine nonessential amino acids of cottonseeds. Mol. Genet. Genom. 292, 671–684. doi: 10.1007/s00438-017-1303-7
Liu, X., Zhao, B., Zheng, H. J., Hu, Y., Lu, G., Yang, C. Q., et al. (2015c). Gossypium barbadense genome sequence provides insight into the evolution of extra-long staple fiber and specialized metabolites. Sci. Rep. 5:14139. doi: 10.1038/srep14139
Lu, C. F., Napier, J. A., Clemente, T. E., and Cahoon, E. B. (2011). New frontiers in oilseed biotechnology: meeting the global demand for vegetable oils for food, feed, biofuel, and industrial applications. Curr. Opin. Biotechnol. 22, 252–259. doi: 10.1016/j.copbio.2010.11.006
Mackay, I., and Powell, W. (2007). Methods for linkage disequilibrium mapping in crops. Trends Plant Sci. 12, 57–63. doi: 10.1016/j.tplants.2006.12.001
Merk, H. L., Yarnes, S. C., Deynze, V., Tong, et al. (2012). Trait diversity and potential for selection indices based on variation among regionally adapted processing tomato germplasm. Autism Res. Official J. Int. Soc. Autism Res. 137, 427–437.
Mezmouk, S., Dubreuil, P., Bosio, M., Décousset, L., Charcosset, A., Praud, S., et al. (2011). Effect of population structure corrections on the results of association mapping tests in complex maize diversity panels. Theor. Appl. Genet. 122, 1149–1160. doi: 10.1007/s00122-010-1519-y
Nie, X., Huang, C., You, C., Li, W., Zhao, W., Shen, C., et al. (2016). Genome-wide SSR-based association mapping for fiber quality in nation-wide upland cotton inbreed cultivars in China. BMC Genomics 17:352. doi: 10.1186/s12864-016-2662-x
Paterson, A. H., Wendel, J. F., Gundlach, H., Guo, H., Jenkins, J., Jin, D., et al. (2012). Repeated polyploidization of Gossypium genomes and the evolution of spinnable cotton fibres. Nature 492, 423–427. doi: 10.1038/nature11798
Qi, Z., Wu, Q., Han, X., Sun, Y., Du, X., Liu, C., et al. (2011). Soybean oil content QTL mapping and integrating wth meta-analysis method for mining genes. Euphytica 179, 499–514. doi: 10.1007/s10681-011-0386-1
Rafalski, J. A. (2010). Association genetics in crop improvement. Curr. Opin. Plant Biol. 13, 174–180. doi: 10.1016/j.pbi.2009.12.004
Reddy, U. K., Nimmakayala, P., Abburi, V. L., Reddy, C. V., Saminathan, T., Percy, R. G., et al. (2017). Genome-wide divergence, haplotype distribution and population demographic histories for Gossypium hirsutum and Gossypium barbadense as revealed by genome-anchored SNPs. Sci. Rep. 7:41285. doi: 10.1038/srep41285
Reinprecht, Y., Poysa, V. W., Yu, K., Rajcan, I., Ablett, G. R., and Pauls, K. P. (2006). Seed and agronomic qtl in low linolenic acid, lipoxygenase-free soybean (Glycine max (L.) Merrill) germplasm. Genome 49, 1510–1527. doi: 10.1139/g06-112
Saeed, M., Guo, W. Z., and Zhang, T. Z. (2014). Association mapping for salinity tolerance in cotton (Gossypium hirsutum L.) germplasm from US and diverse regions of China. Aust. J. Crop Sci. 8, 338–346.
Saïdou, A. A., Thuillet, A. C., Couderc, M., Mariac, C., and Vigouroux, Y. (2014). Association studies including genotype by environment interactions: prospects and limits. BMC Genet. 15:3. doi: 10.1186/1471-2156-15-3
Shasidhar, Y., Vishwakarma, M. K., Pandey, M. K., Janila, P., Variath, M. T., Manohar, S. S., et al. (2017). Molecular mapping of oil content and fatty acids using dense genetic maps in groundnut (Arachis hypogaea L.). Front. Plant Sci. 8:794. doi: 10.3389/fpls.2017.00794
Shen, C., Li, X., Zhang, R., and Lin, Z. (2017). Genome-wide recombination rate variation in a recombination map of cotton. PLoS ONE 12:e0188682. doi: 10.1371/journal.pone.0188682
Sinha, D., and Murugavelh, S. (2016). Biodiesel production from waste cotton seed oil using low cost catalyst: engine performance and emission characteristics. Perspect. Sci. 8, 237–240. doi: 10.1016/j.pisc.2016.04.038
Sneath, P. H. A., and Sokal, R. R. (1973). Numerical Taxonomy: The Principles and Practice of Numerical Classification. San Francisco, CA: W. H. Freeman.
Song, X. L., and Zhang, T. Z. (2007). Identification of quantitative trait loci controlling seed physical and nutrient traits in cotton. Cotton Sci. 17, 243–251. doi: 10.1017/S0960258507834957
Stewart, J. M., Oosterhuis, D. M., Heitholt, J. J., and Mauney, J. R. (2010). Physiology of Cotton. Dordrecht: Springer. doi: 10.1007/978-90-481-3195-2
Sun, C., Wang, B., Yan, L., Hu, K., Liu, S., Zhou, Y., et al. (2016). Genome-wide association study provides insight into the genetic control of plant height in rapeseed (Brassica napus L.). Front. Plant Sci. 7:1102. doi: 10.3389/fpls.2016.01102
Sun, Z., Wang, X., Liu, Z., Gu, Q., Zhang, Y., Li, Z., et al. (2017). Genome-wide association study discovered genetic variation and candidate genes of fibre quality traits in Gossypium hirsutum L. Plant Biotechnol. J. 15, 982–996. doi: 10.1111/pbi.12693
Tian, F., Bradbury, P. J., Brown, P. J., Hung, H., Sun, Q., Flint-Garcia, S., et al. (2011). Genome-wide association study of leaf architecture in the maize nested association mapping population. Nat. Genet. 43, 159–162. doi: 10.1038/ng.746
Wan, H., Chen, L., Guo, J., Li, Q., Wen, J., Yi, B., et al. (2017). Genome-wide association study reveals the genetic architecture underlying salt tolerance-related traits in rapeseed (Brassica napus L.). Front. Plant Sci. 8:593. doi: 10.3389/fpls.2017.00593
Wang, M., Tu, L., Lin, M., Lin, Z., Wang, P., Yang, Q., et al. (2017). Asymmetric subgenome selection and cis-regulatory divergence during cotton domestication. Nat. Genet. 49, 579–587. doi: 10.1038/ng.3807
Wang, S., Chen, J., Zhang, W., Hu, Y., Chang, L., Fang, L., et al. (2015). Sequence-based ultra-dense genetic and physical maps reveal structural variations of allopolyploid cotton genomes. Genome Biol. 16, 108. doi: 10.1186/s13059-015-0678-1
Wu, J., Jenkins, J. N., Mccarty, J. C., and Thaxton, P. (2009). Seed trait evaluation of Gossypium barbadense L. chromosomes / arms in a G. hirsutum L. background. Euphytica 167, 371–380. doi: 10.1007/s10681-009-9896-5
Wu, J., Mccarty, J. C., and Jenkins, J. N. (2010). Cotton chromosome substitution lines crossed with cultivars: genetic model evaluation and seed trait analyses. Theor. Appl. Genet. 120, 1473–1483. doi: 10.1007/s00122-010-1269-x
Xiao, G. H., Wang, K., Huang, G., and Zhu, Y. X. (2016). Genome-scale analysis of the cotton KCS gene family revealed a binary mode of action for gibberellin a regulated fiber growth. J. Integr. Plant Biol. 58, 577–589. doi: 10.1111/jipb.12429
Yastreb, T. O., Kolupaev, Y. E., Lugovaya, A. A., and Dmitriev, A. P. (2016). Content of osmolytes and flavonoids under salt stress in arabidopsis thaliana plants defective in jasmonate signaling. Appl. Biochem. Microbiol. 52, 210–215. doi: 10.1134/S0003683816020186
Yu, J., and Buckler, E. S. (2006). Genetic association mapping and genome organization of maize. Curr. Opin. Biotechnol. 17, 155–160. doi: 10.1016/j.copbio.2006.02.003
Yu, J., Yu, S., Fan, S., Song, M., Zhai, H., Li, X., et al. (2012). Mapping quantitative trait loci for cottonseed oil, protein and gossypol content in a Gossypium hirsutum × Gossypium barbadense, backcross inbred line population. Euphytica 187, 191–201. doi: 10.1007/s10681-012-0630-3
Yuan, D., Tang, Z., Wang, M., Gao, W., Tu, L., Jin, X., et al. (2015). The genome sequence of sea-island cotton (Gossypium barbadense) provides insights into the allopolyploidization and development of superior spinnable fibres. Sci. Rep. 5:17662. doi: 10.1038/srep17662
Zhang, T., Hu, Y., Jiang, W., Fang, L., Guan, X., Chen, J., et al. (2015). Sequencing of allotetraploid cotton (Gossypium hirsutum L. acc. TM-1) provides a resource for fiber improvement. Nat. Biotechnol. 33, 531–537. doi: 10.1038/nbt.3207
Keywords: cottonseed oil, fatty acid, seed protein, genome-wide association study, SNP, quantitative trait loci, cottonseed composition
Citation: Yuan Y, Wang X, Wang L, Xing H, Wang Q, Saeed M, Tao J, Feng W, Zhang G, Song X-L and Sun X-Z (2018) Genome-Wide Association Study Identifies Candidate Genes Related to Seed Oil Composition and Protein Content in Gossypium hirsutum L. Front. Plant Sci. 9:1359. doi: 10.3389/fpls.2018.01359
Received: 18 December 2017; Accepted: 28 August 2018;
Published: 22 October 2018.
Edited by:
Jose I. Hormaza, Instituto de Hortofruticultura Subtropical y Mediterránea La Mayora (IHSM), SpainReviewed by:
Umesh K. Reddy, West Virginia State University, United StatesAureliano Bombarely, Virginia Tech, United States
Copyright © 2018 Yuan, Wang, Wang, Xing, Wang, Saeed, Tao, Feng, Zhang, Song and Sun. This is an open-access article distributed under the terms of the Creative Commons Attribution License (CC BY). The use, distribution or reproduction in other forums is permitted, provided the original author(s) and the copyright owner(s) are credited and that the original publication in this journal is cited, in accordance with accepted academic practice. No use, distribution or reproduction is permitted which does not comply with these terms.
*Correspondence: Xian-Liang Song, c29uZ3hsOTk5QDE2My5jb20=
Xue-Zhen Sun, c3VueHpAc2RhdS5lZHUuY24=
†These authors have contributed equally to this work