 Dong Ho Suh
 Eun Sung Jung2†
 Choong Hwan Lee
- 1Department of Bioscience and Biotechnology, Konkuk University, Seoul, South Korea
- 2Department of Systems Biotechnology, Konkuk University, Seoul, South Korea
Berries have been used as valuable sources of polyphenols for human health; however, injudicious uses of berries are widespread without regard to the specific metabolite constituent of each berry. We classified 6 different edible berries (honeyberry, blueberry, mandarin melonberry, mulberry, chokeberry, and Korean black raspberry) based on their metabolite distributions in biosynthetic pathways by non-targeted metabolite profiling and bioactive correlation analysis. Principal component analysis revealed a distinct clustering pattern of metabolites for each berry. Metabolic pathway analysis revealed different biosynthetic routes of secondary metabolites in each berry. Mandarin melonberry contains a relatively higher proportion of genistein, genistein glycoside, and genistein-derived isoflavonoids and prenylflavonoids than the other berries. Various anthocyanin glycosides, synthesized from dihydroquercetin and cyanidin, were more abundant in chokeberry and honeyberry, whereas high levels of flavonoid-and anthocyanins-rutinoside forms were observed in Korean black raspberry. The levels of anthocyanins derived from dihydromyricetin were high in blueberry. The highest anti-oxidant activity was observed in chokeberry and Korean black raspberry, which is positively related to the proportional concentration of flavonoids, phenolics, and anthocyanins. The lowest sugar contents were observed in Korean black raspberry, highest acidity in honeyberry, and lowest acidity in mandarin melonberry, which were specific characteristics among the berries. Taken together, biosynthetic pathway and physicochemical characteristics analyses revealed that the different synthesized routes of flavonoids and anthocyanins and associated bio-activities may be distinct features in each berry and explain their phenotypic diversity at the molecular level.
Introduction
Edible berries are among the most important sources of polyphenols (e.g., phenolic acids, flavonoids, anthocyanins, and tannins), which are closely associated with human health. Several studies have shown that many bioactive components found in berries have potent anti-oxidant, antimicrobial, anticancer, anti-inflammatory, and anti-neurodegenerative effects (Devore et al., 2012; Nile and Park, 2014). There are various edible berries, including blueberry, cranberry, bilberry, lingonberry, blackberry, red and black raspberry, cloudberry, red and black currants, honeysuckle berry, and black mulberry (Häkkinen et al., 1999; Mikulic-Petkovsek et al., 2012b). Although berries belong to many different genera such as Lonicera, Vaccinium, Cudrania, Morus, Aronia, and Rubus, many people consider berries to be a single type. While the main bio-active compounds in major berries have been examined, their metabolite profiles remain unclear. Recently, the use of berries has increased substantially; they are not only consumed as fresh fruits, but also utilized as extracts in processed products, including yogurts, fruit and vegetable beverages, jams, and dietary supplements (Clegg et al., 2011; Gironés-Vilaplana et al., 2012; Roopchand et al., 2013; Sun-Waterhouse et al., 2013; Nile and Park, 2014). Considering the rapid expansion of applications using berries and importance of their efficient use, it is crucial to understand their nutritional profiles.
Metabolomics has significantly advanced our fundamental understanding of the natural variance in metabolite composition between plants (Schauer and Fernie, 2006) and enabled biosynthesis of natural products derived from plants with bioactivity, which have potential applications for human health (Sumner et al., 2015). Particularly, a non-targeted metabolomics approach can be used for characterization and classification between plants based on differential or characteristic metabolites in the species (Díaz et al., 2016). Among them, metabolic pathway based non-targeted metabolomics has been used to study a wide variety of plants such as rice (Jung et al., 2013), pitayas (Suh et al., 2014), hot peppers (Jang et al., 2015), sorghums (Turner et al., 2016), and grape berry (Wang et al., 2017). The general genes and metabolites of flavonoid and anthocyanin biosynthetic pathway are discovered in model plants (Lepiniec et al., 2006), and the differences of anthocyanin production and distribution are regulated by genetic and environmental conditions (Wang et al., 2017). There is a lack of research on comparative analysis to reveal berry specific expression of genes or metabolites in biosynthetic pathway, even though each berry has different metabolic compositions and unique properties. Thus, the major objective of this study was to examine six different edible berries by determining their nutritional profiles based on metabolic pathway analysis to identify specific metabolic pathway markers vital for determining berry quality. Additionally, physicochemical characteristics and bioactivities were determined for each berry.
Materials and Methods
Chemicals
Methanol, acetonitrile, and water were purchased from Fisher Scientific (Waltham, MA, USA). Diethylene glycol, gallic acid, naringin, methoxyamine hydrochloride, pyridine, N-methyl-N-(trimethylsilyl) trifluoroacetamide (MSTFA), 6-hydroxy-2,5,7,8- tetramethylchroman-2-carboxylic acid, hydrochloric acid, potassium persulfate, 2,2′-azinobis (3-ethylbenzothiazoline-6-sulfonic acid) diammonium salt (ABTS), hydrochloride, 2,4,6- tris(2-pyridyl)-trizine (TPTZ), iron(III) chloride hexahydrate, sodium acetate, acetic acid, sodium carbonate, sodium hydroxide, 1,1-diphenyl-2-picrylhydrazyl (DPPH), formic acid, and standard compounds were obtained from Sigma Chemical Co. (St. Louis, MO, USA).
Sample Information and Preparation
Various batches of six species from six different genera of edible berries (3 batches for Lonicera caerulea, honeyberry, 5 for Vaccinium corymbosum, blueberry, 6 for Cudrania tricuspidata, mandarin melon berry, 6 for Morus alba, mulberry, 7 for Aronia melanocarpa, chokeberry, and 7 for Rubus coreanus, korean black raspberry) were purchased from a local farm. Detailed information regarding the harvest year and location of the corresponding berries is listed in Table 1. Each fresh berry was freeze-dried for 7 days and then ground into a fine powder with a mortar and pestle. Each powdered sample was stored at−20°C until metabolite extraction.
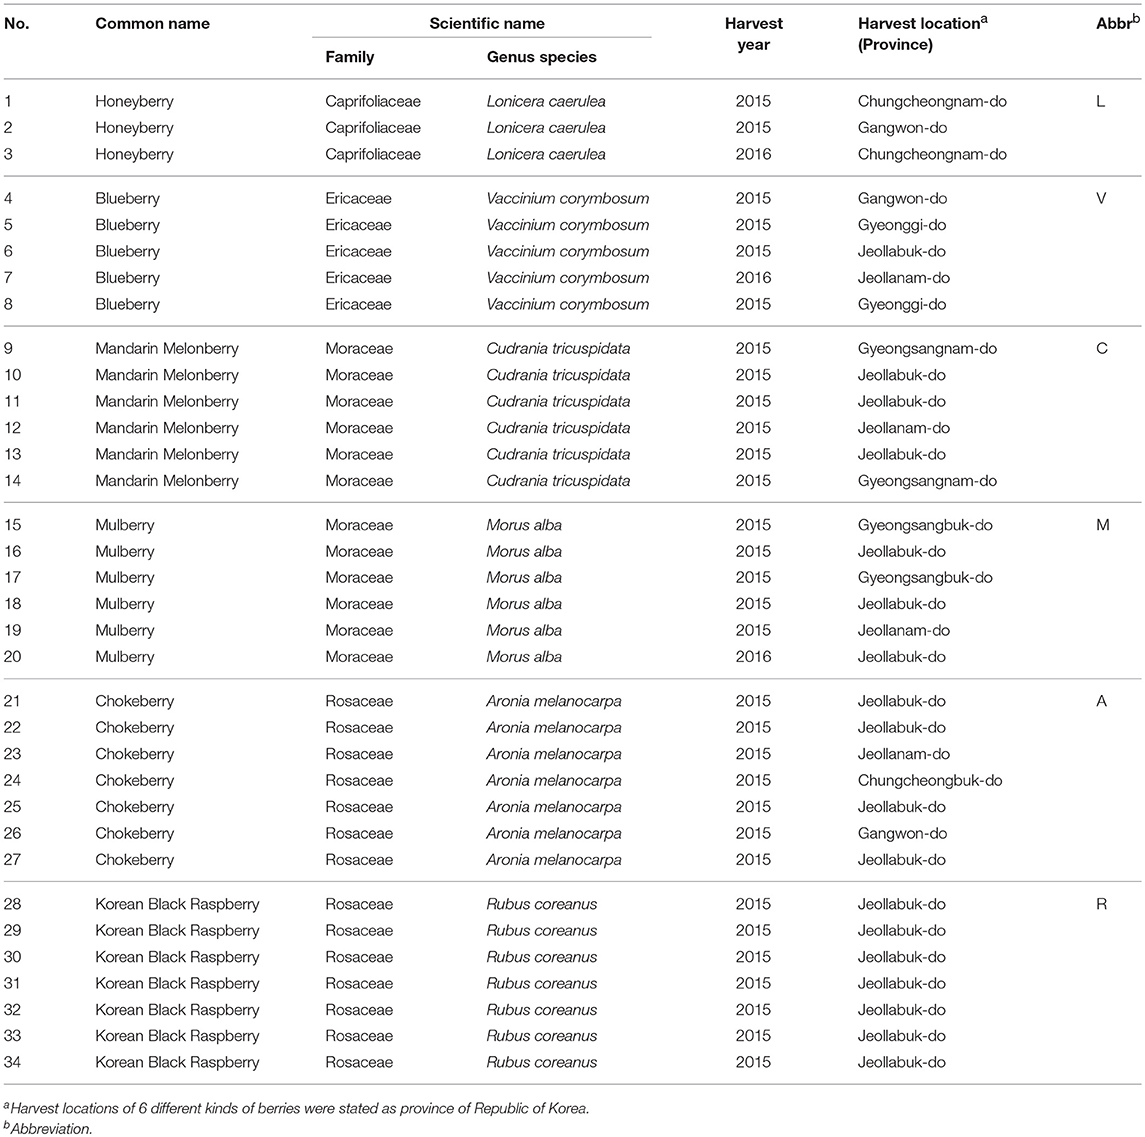
Table 1. Information of 6 kinds of edible berry samples.
Metabolite Extraction
Each powdered sample (100 mg) was extracted twice with 1 mL of mixed solvent (methanol/water/HCL, 80/19.9/0.1, v/v) and 20 μL of internal standard (0.1 mg/mL, ampicillin) using a MM400 mixer mill (Retsch®; Haan, Germany) at a frequency of 30 s−1 for 10 min. After extraction, the extract was centrifuged at 12,578 g for 5 min at 4°C (Hettich Zentrifugen Universal 320, Tuttlingen, Germany). Supernatants were collected into a single e-tube and sieved through a 0.2-μm polytetrafluoroethylene filter, and then completely dried using a speed vacuum concentrator (Modulspin 31; BioTron, Inc., Bucheon-si, Korea). The dried samples were used for instrument analysis and bio-activity assays.
UPLC-Q-TOF-MS and UHPLC-ESI-IT-MS/MS Analysis
The dried extract samples were re-dissolved with mixed solvent for ultra-high-performance liquid chromatography linear trap quadrupole tandem mass spectrometry (UHPLC-LTQ-MS/MS) analyses and ultra-performance liquid chromatography-quadrupole-time of flight (UPLC-Q-TOF) MS. The final concentration of all analytes was 30 mg/mL. UHPLC-LTQ-MS/MS analysis was performed using a LTQ XLTM ion-trap mass spectrometer (Thermo Fisher Scientific) coupled with a DIONEX UHPLC system that included an UltiMate 3000 RS pump, UltiMate 3000 RS autosampler, UltiMate 3000 column compartment, and UltiMate 3000 variable wavelength detector (Dionex Corporation, Sunnyvale, CA, USA). Chromatographic separation was performed on a Syncronis C18 column (100 × 2.1 mm, 1.7 μm particle size; Thermo Fisher Scientific) and the injection volume was 10 μL. The flow rate was 0.3 mL/min and column temperature was 40°C. The mobile phase consisted of 0.1% formic acid in water (solvent A) and 0.1% formic acid in acetonitrile (solvent B). The initial condition was 5% of solvent B for 1 min, which was increased to 65% of solvent B over 14 min and increased to 100% of solvent B over 3 min, and then isothermally held for 3 min. The system was returned to the initial condition over a gradient and maintained for 3 min. The total run time was 25 min. Mass spectra were acquired over the range of m/z 100–1,000 in both negative and positive ion modes. The source voltage was ±5 kV, collision voltage was 39 V, and capillary temperature was 275°C. Tandem mass spectrometry analysis was conducted by turbo data-dependent scan-type scanning under conditions identical to those used for MS scanning. Quality control samples were analyzed after every 10 samples to obtain reliable MS data.
For UPLC-Q-TOF-MS analysis, a Waters ACQUITY UPLC system (Waters Corp., Milford, MA, USA) equipped with a binary solvent delivery system, auto-sampler, and UV detector was used. Chromatographic separation was performed on a Waters ACQUITY BEH C18 column (i.d., 100 × 2.1 mm, 1.7 μm particle size) and the injection volume was 5 μL. The column temperature was 37°C and flow rate was 0.3 mL/min. The mobile phase consisted of 0.1% v/v formic acid in water (A) and 0.1% v/v formic acid in acetonitrile (B). The initial condition was 5% B for 1 min, which was then linearly increased to 100% B over 9 min. The total run time was 14 min, including re-equilibration of the column to the initial condition. For MS experiments, Waters Q-TOF Premier MS (Micromass MS Technologies, Manchester, UK) was operated in both negative and positive ion modes with an m/z range of 100–1,000. The source temperature was 100°C, collision energy was 10 eV, and collision gas flow was 0.3 mL/min. The desolvation gas was 650 L/h at a temperature of 300°C. The capillary voltage and sample cone voltage were 2.5 kV and 50 V, respectively. The V mode was used for the mass spectrometer, and data were collected in centroid mode with a scan accumulation of 0.2 s. Leucine encephalin was used as the reference lock mass (m/z 554.2615) by independent LockSpray interference.
Data Processing and Multivariate Statistical Analysis
UHPLC-LTQ-MS data were acquired with Xcalibur software (version 2.00, Thermo Fisher Scientific) and converted into netCDF format (*.cdf) using the same Xcalibur software, Peak detection, retention time correction, and alignment were conducted using the MetAlign software package (http://www.metalign.nl). The resulting data were exported to an Excel spreadsheet (Microsoft; Redmond, WA, USA). Multivariate statistical analysis was performed using SIMCA-P+ 12.0 software (Umetrics; Umeå, Sweden). The data sets were auto-scaled (unit variance scaling) and mean-centered in a column-wise fashion. The significantly different metabolites between berries were selected based on variable importance projection (VIP) values, and significance was tested by analysis of variance (ANOVA) and Duncan's multiple range tests using PASW Statistics 18 software (SPSS, Inc., Chicago, IL, USA). Selected metabolites were tentatively identified by comparing mass spectra, retention time, mass fragment patterns, UV absorbance, and elemental compositions derived from UHPLC-LTQ-IT-MS/MS and UPLC-Q-TOF-MS analyses considering standard compounds, in-house library, and published references. The heatmap and correlation map were constructed by MeV software (http://www.tm4.org/).
Determination of Antioxidant Activity by ABTS, DPPH, and FRAP
Three antioxidant activity tests, including ABTS, DPPH, and ferric reduction ability of plasma (FRAP), were performed using slightly modified procedures described previously (Jung et al., 2013). For the ABTS assay, 7 mM ABTS was dissolved in 2.45 mM potassium persulfate solution and the sample was incubated in the dark for 1 day at room temperature to obtain a dark-blue colored solution. The solution was then diluted until the absorbance reached 0.7 ± 0.02 at 734 nm using a microplate reader (Spectronic Genesys 6, Thermo Electron, Waltham, mA, USA). Twenty microliters of sample were then mixed with 180 μL of diluted ABTS solution in 96-well plates and allowed to react for 6 min in the dark. Absorbance was measured at 734 nm using a microplate reader.
For the DPPH assay, 20 μL of sample extract was mixed with 180 μM of 0.2 mM DPPH ethanol solution in 96-well plates for 20 min at room temperature. Absorbance was measured at 515 nm using a microplate reader.
The FRAP assay was conducted with freshly prepared FRAP reagent, which was made by combining mixed acetate buffer (pH 3.6), 10 mM TPTZ (in 40 mM HCl solution), and 20 mM FeCl3•6H2O (in distilled water) in a ratio of 10:1:1, respectively. Ten microliters of each sample were then mixed with 300 μL of FRAP reagent in 96-well plates for 6 min at 37°C. The absorbance was measured at 570 nm using a microplate reader. All results were presented as the Trolox equivalent antioxidant capacity (mM), with the standard solution concentration curve ranging from 0.0078 to 1.000 mM, and all experiments were carried out in triplicate.
Determination of Total Phenolic, Flavonoid, and Anthocyanin Contents
Total phenolic content was measured using the Folin-Ciocalteu colorimetric method. Briefly, 100 μL of 0.2N Folin-Ciocalteu's phenol reagent was added to 20 μL of each sample in 96-well plates. After incubation in the dark for 5 min, 80 μL of 7.5% sodium carbonate solution was added to the mixture, which was then incubated in the dark for an additional 60 min at room temperature. The absorbance was measured at 750 nm using a microplate reader (Spectronic Genesys 6). The results were presented as gallic acid equivalent concentration (ppm), and the standard solution concentration curve ranged from 1.9531 to 500 ppm.
To analyze total flavonoid content, 180 μL of 90% diethylene glycol (in distilled water), 20 μL of 1N NaOH, and 20 μL of each sample were mixed in 96-well plates, and then incubated in the dark for 60 min at room temperature. The absorbance was measured at 405 nm using a microplate reader. The results were presented as the naringin equivalent concentration (ppm), and the standard solution concentration curve ranged from 0.7813 to 200 ppm.
To measure the total anthocyanin content, two buffer systems, potassium chloride (pH 1.0) and sodium acetate (pH 4.5), were analyzed by the pH differential method using a microplate reader. Twenty microliters of sample were mixed with 180 μL of corresponding buffer, with the resulting solution was read against a blank at 515 and 750 nm. Absorbance was calculated as: A = (A515–A750 nm) pH 1.0 – (A515–A750 nm) pH 4.5. The concentration of monomeric anthocyanin pigment was expressed as milligrams of cyanidin-3-glucoside and calculated as:
where A is the absorbance, Mr is the molecular weight (449.2), DF is the dilution factor, and ε is the molar absorptivity (269,000). All experiments were conducted in triplicate.
Determination of Physiochemical Characters-Sugar Content, Titratable Acidity, and pH
Fresh berry fruits were squeezed using gauze to obtain the fresh juice extract. The sugar contents (100 μL of each fresh juice extract) were measured using a sugar meter (HANNA Instruments, Woonsocket, RI, USA). Each juice extract (3 mL) was diluted with distilled water (27 mL) and the pH was measured using a pH meter (Thermo Fisher). Titratable acidity was estimated by titrating the fresh juice extracts with 0.1N NaOH solution to a pH of 8.4. All experiments were carried out in triplicate.
Results
Non-Targeted Metabolite Profiling of 6 Different Edible Berries
The 6 edible berries showed quite different morphological features, i.e., shape, color, and size (Figure 1A). To compare the taxonomic classification between gene- and metabolite-based analysis among 6 different edible berries, we constructed a phylogenetic tree based on the National Center for Biotechnology Information (NCBI) taxonomy database (Figure 1B) and chemotaxonomic dendrogram by hierarchical cluster analysis derived from LC-MS based metabolite profiling (Figure 1C). According to phylogenetic tree, there were 2 characteristic branches; honeyberry and blueberry, and other berry genera. Other berry genera were also divided depending on their family. Mandarin melonberry and mulberry, which belong to the family Moraceae, were clustered and distinguished from the Rosaceae family, which includes chokeberry and Korean black raspberry (Table 1). The results of chemotaxonomic classification derived from LC-MS metabolite profiling showed different patterns from the phylogenetic tree (Figure 1C). The first branch was divided into chokeberry and other berry genera, and these berry genera were divided into mandarin melonberry and the remaining 4 berry genera. Honeyberry and blueberry were clustered and distinguished from the sub-branch of mulberry and Korean black raspberry. Both taxonomic trees were well-separated by each genus but showed different patterns.
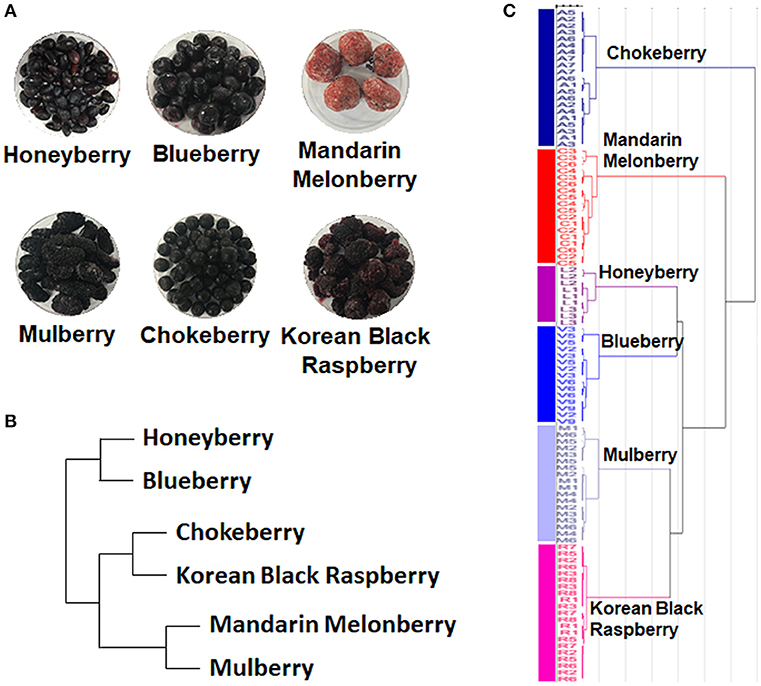
Figure 1. Photographs of the fruits (A) and results of taxonomic classification based on gene (B) and metabolites (C) in 6 different kinds of edible berries. Taxonomic classification based on gene results on a NCBI taxonomy database and metabolite results of metabolite profiling using UHPLC-LTQ-IT-MS/MS.
To distinguish differences in metabolites among the 6 different edible berries (total of 34 berries), non-targeted metabolite profiling was performed by UHPLC-ESI-IT-MS/MS combined with multivariate analysis. The principle component analysis (PCA) score plot (Figure 2A) revealed that all 6 edible berries differed from each other and clustered depending on their genus rather than various environment factors, and showed similar results in the partial least squares-discriminant analysis score plot (Figure 2B). The metabolites significantly contributing to discrimination among berries were selected based on the VIP value (>1.0) from partial least squares-discriminant analysis and p value (< 0.05) from one-way ANOVA. Although berry samples were collected from different locations at various time (Table 1), the PCA score plot showed that metabolic differences between berry samples mostly depended on their phylogeny rather than on other factors. A total of 51 metabolites were identified, of which only 44 significantly differed between the 6 different edible berries (Table 2). These metabolites were 12 anthocyanins (4 cyanidin derivatives, 2 petunidin derivatives, 3 malvidin derivatives, delphinidin 3-arabinoside, pelargonidin-rutinoside, and peonidin 3-glucoside), 29 flavonoids (3 kaempferol derivatives, 2 genistein derivatives, 10 quercetin derivatives, 2 myricetin derivatives, 5 isoflavonoids, 4 prenylated flavonoids, apigenin 6-C-glucoside 8-C-arabinoside, epicatechin, and sanggenon G), and 3 miscellaneous metabolites. Significantly different metabolites among the 6 different edible berries were visualized by heat map analysis (Figure 2C). In honeyberry, the levels of several anthocyanins (peonidin 3-glucoside and cyanidin diglucoside), 4 quercetin derivatives, dicaffeoylquinic acid, and loganic acid were higher than those in other berries, while many types of anthocyanins were high in blueberry. The flavonoid contents, particularly isoflavonoids and prenylated flavonoids, were significantly high in mandarin melonberry. Chokeberry and Korean black raspberry contained different flavonoids. The results of non-targeted metabolite profiling showed that berries had different quantities and varieties of metabolites, particularly flavonoids and anthocyanins, and further information is needed to evaluate the characteristic phenotypes of each berry genus.
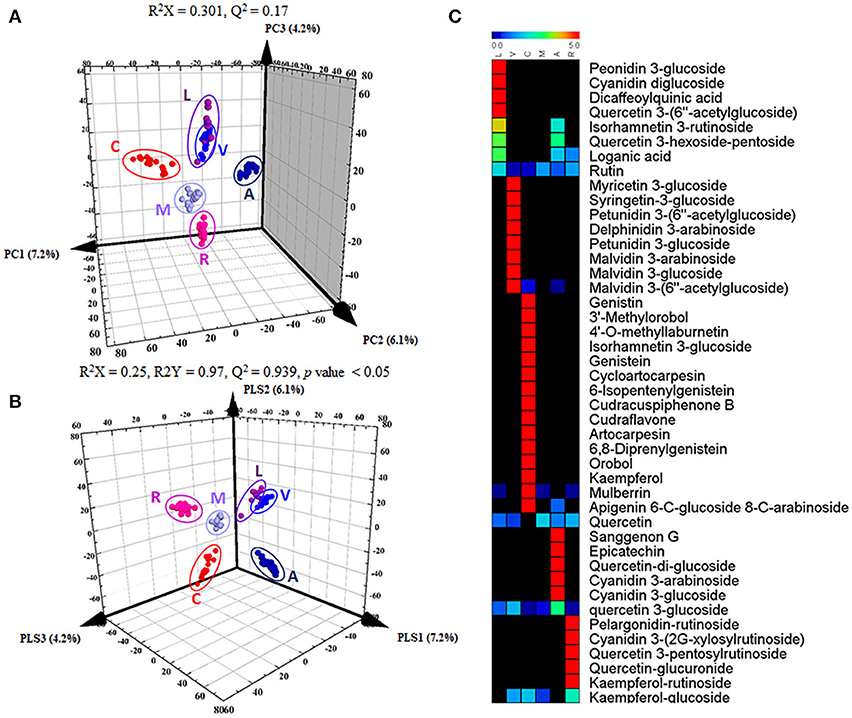
Figure 2. Results of 3D-PCA score plot (A), 3D-PLSDA score plot (B), and heat map analysis (C) in 6 different kinds of edible berries derived from UHPLC-LTQ-IT-MS/MS data. In heat map analysis, significantly differed metabolites were determined (VIP > 1.0 and I value < 0.05). L, honeyberry; V, blueberry; C, mandarin melonberry; M, mulberry; A, chokeberry; R, Korean black raspberry.
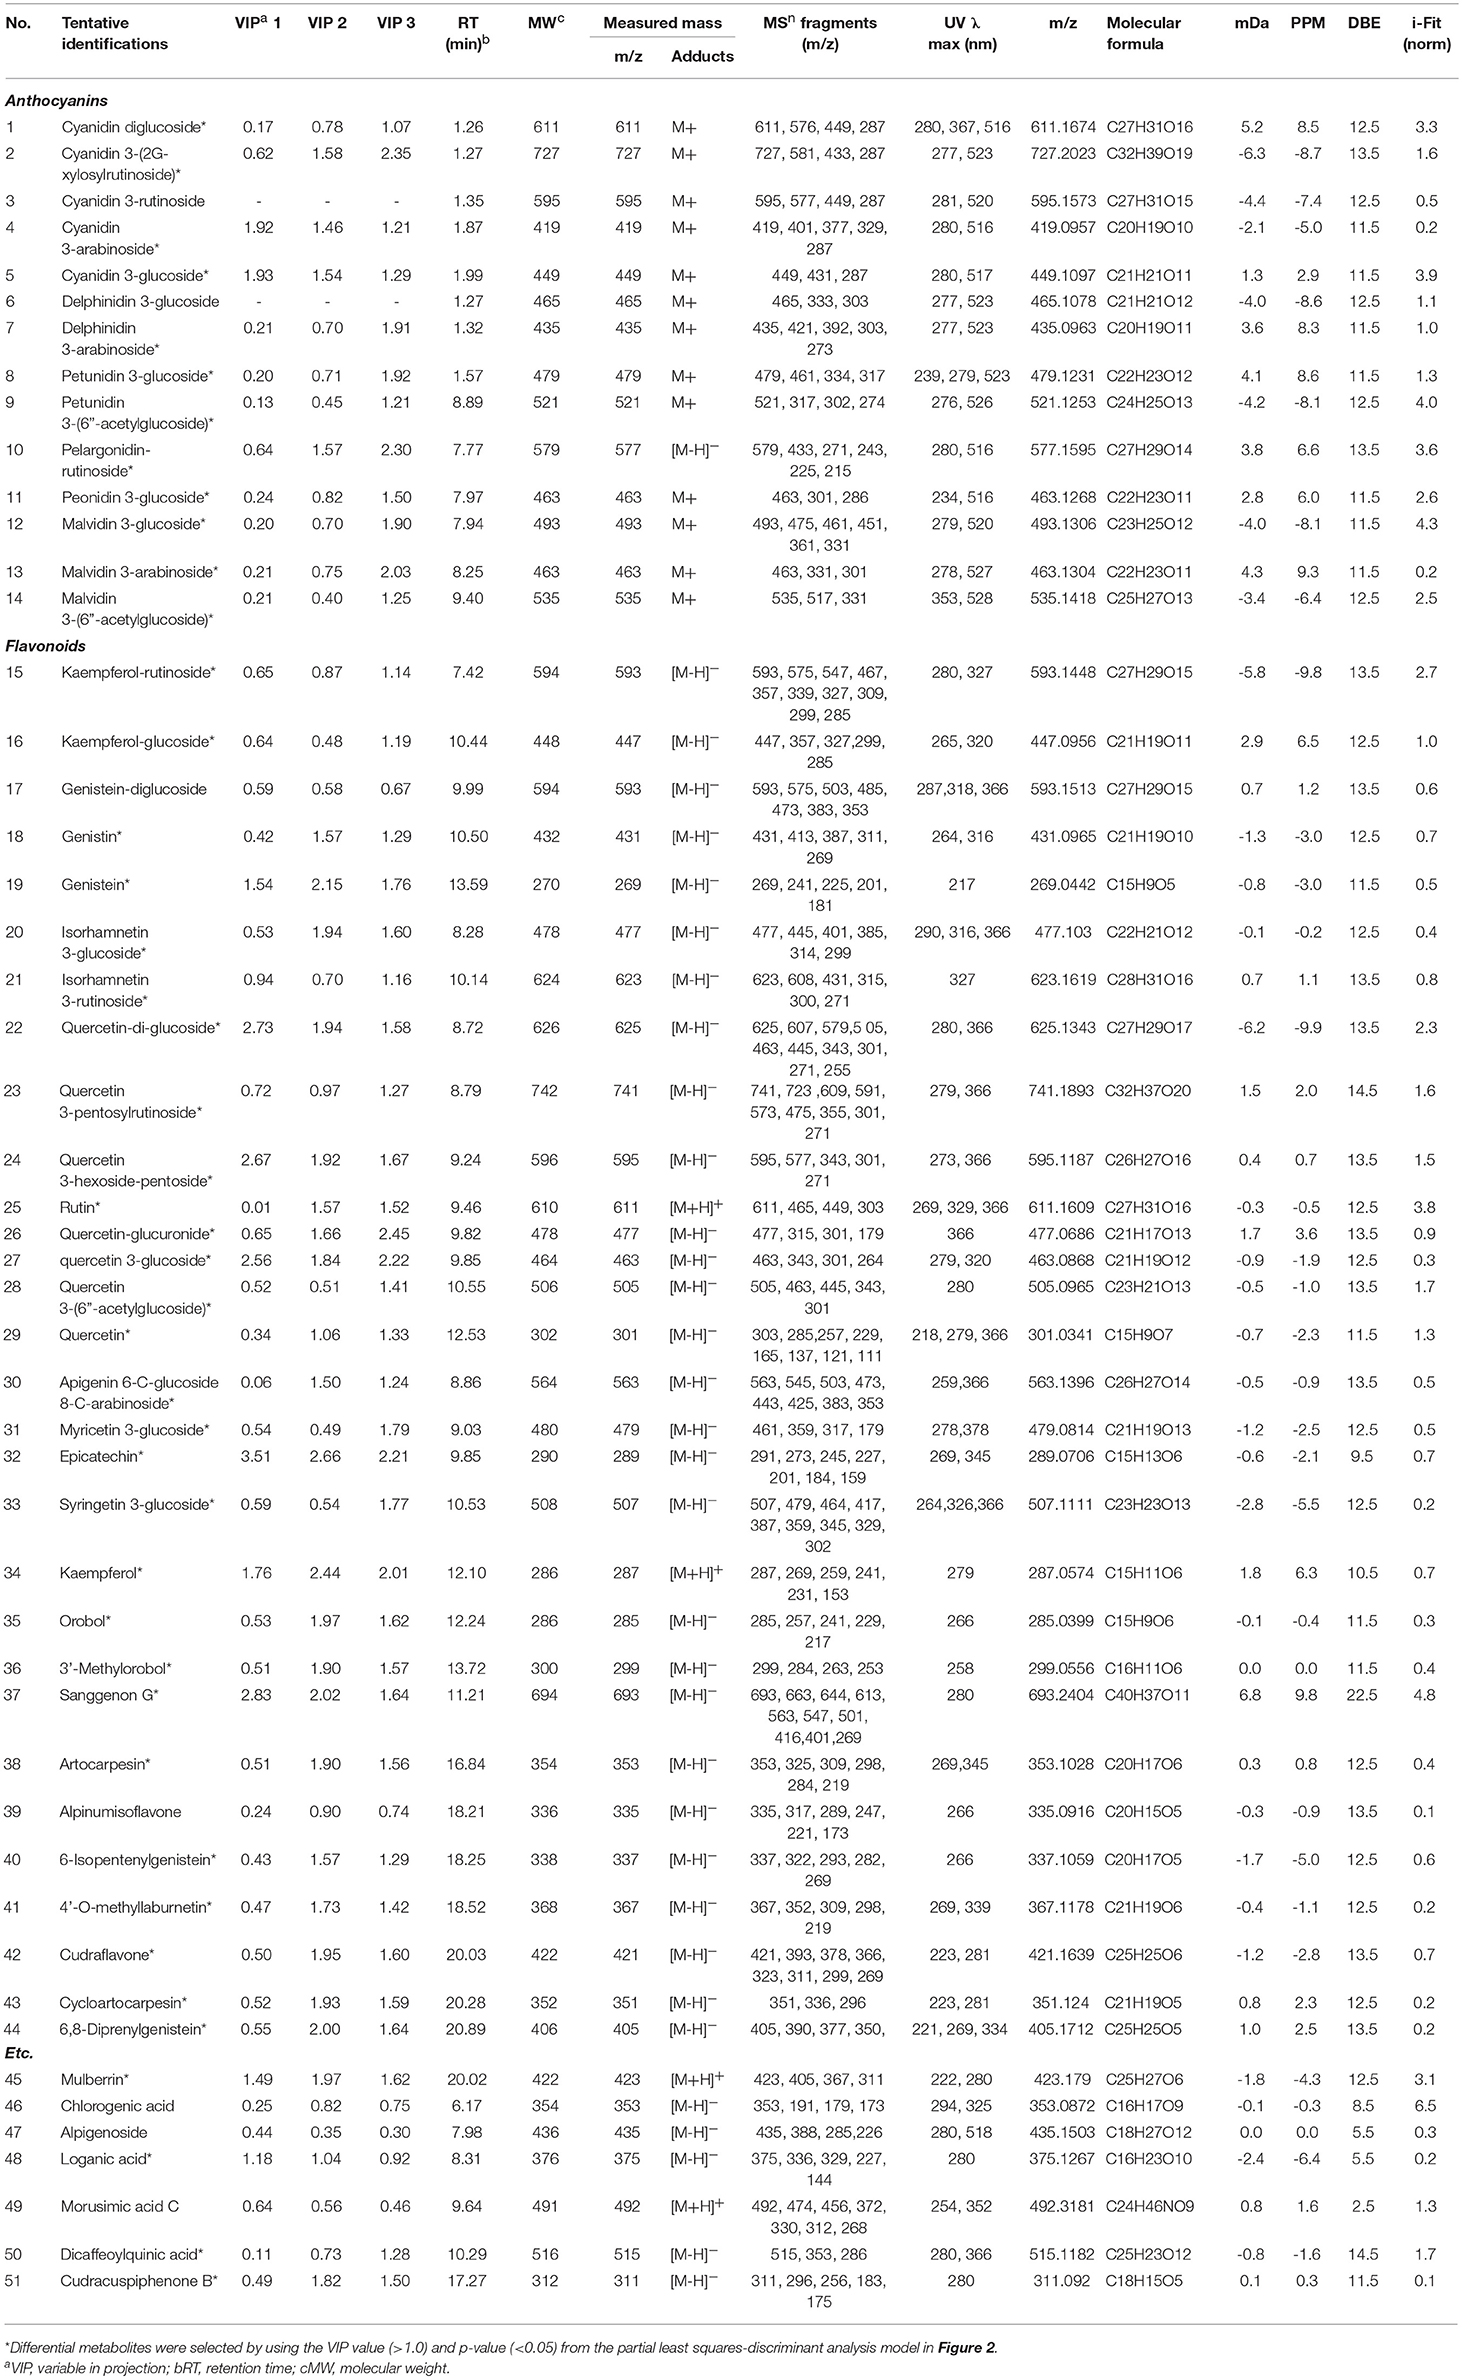
Table 2. Differential metabolites in 6 kinds of edible berries derived from the UHPLC-LTQ-IT-MS/MS and UPLC-Q-TOF-MS analyses.
Differences in Physicochemical Characteristics and Anti-Oxidant Activities in 6 Edible Berries
Comparison of physicochemical characteristics, anti-oxidant activities, and contents of total phenolic, total flavonoid, and total anthocyanin among the 6 edible berries were examined to evaluate the palatability and quality characteristics of berries. The physicochemical characters sugar content, titratable acidity, and pH were measured (Table 3). The observed average sugar contents were similar among honeyberry, blueberry, mandarin melonberry, mulberry, and chokeberry, but relatively higher than that in Korean black raspberry. The pH and titratable acidity indicates the relative acidity and flavors of the berries. According to results, the relative acidity among berries was as follows: honeyberry (L) >> Korean black raspberry (R) > blueberry (V) = chokeberry (A) ≥ mulberry (M) >> mandarin melonberry (C). Particularly high acidity is observed in honeyberry, while low acidity is in mandarin melonberry.
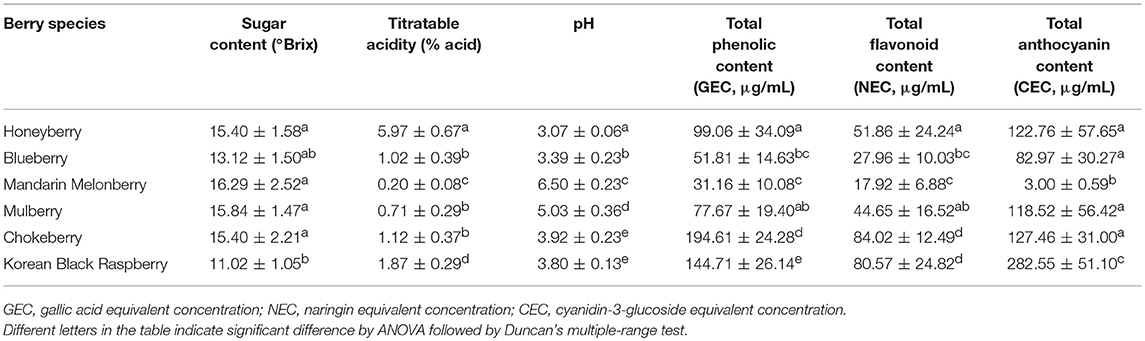
Table 3. Physicochemical characters of 6 kinds of edible berries.
Considerable differences of anti-oxidant activity were observed among berries as follows: chokeberry (A) ≥Korean black raspberry (R) >honeyberry (L) ≥mulberry (M) >blueberry (V) >mandarin melonberry (C) (Figure 3). About 10-fold anti-oxidant activities difference was showed between the highest (chokeberry and Korean black raspberry) and the lowest (mandarin melonberry). The total phenolic content and total flavonoid content levels of berries showed similar tendency with anti-oxidant activities (Table 3). However, the result of total anthocyanin content levels showed different distributions in berries as antioxidant activities as follows: Korean black raspberry (R) >honeyberry (L) = mulberry (M) = chokeberry (A) ≥blueberry (V) >mandarin melonberry (C).
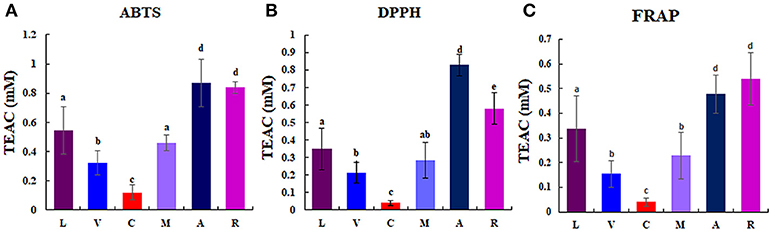
Figure 3. Results of anti-oxidant activities [ABTS (A), DPPH (B), FRAP (C)] in 6 different edible berries. Different letters in the bar graph indicate significant difference by ANOVA followed by Duncan's multiple-range test (p value < 0.05). TEAC: trolox equivalent antioxidant capacity. L, honeyberry; V, blueberry; C, mandarin melonberry; M, mulberry; A, chokeberry; R, Korean black raspberry.
These results demonstrated that the 6 different edible berries have unique phenotypes, physicochemical characteristics, and bioactivities. Through metabolic pathway analysis, we detected significantly different metabolites, explaining the differences in phenotypes among the berries.
Comparison of Metabolic Pathway Markers and Bioactivity Correlations in 6 Edible Berries
Based on the list of identified metabolites, a secondary metabolite biosynthesis pathway of berries was proposed (Figure 4). To construct the biosynthetic pathways in different berries, we mostly referred to the KEGG (Kyoto Encyclopedia of Genes and Genomes) database and some literatures (Zifkin et al., 2012; Jaakola, 2013; Hyun et al., 2014). To evaluate the metabolic pathway markers of each berry, the relative average value of each metabolite was determined for the metabolic pathway, including biosynthesis of various anthocyanins and flavonoids. Anthocyanins and flavonoids, which were present in all berries examined, are synthesized through p-coumaroyl-CoA; however the biosynthetic routes of flavonoids and anthocyanins differed in each berry. Mandarin melonberry specifically contained several flavonoids biosynthesized from the intermediate precursor naringenin. These flavonoids were mainly composed of genistein (19), genistein glycosides (17, 18), and genistein-derived isoflavonoids and prenylflavonoids including orobol (35), 3′-methylorbol (36), alpinumisoflavone (39), 4′-o-methyllaburnetin (41), artocarpesin (38), 6-isopentenylgenistein (40), cudraflavone (42), cycloartocarpesin (43), 6,8-diprenylgenistein (44), and mulberrin (45). In addition, kaempferol (34) and isorhamnetin 3-glucoside (20) were specific to mandarin melonberry and are biosynthesized from the precursors dihydrokaempferol and isorhamnetin, respectively. Rutinoside contained flavonoids and anthocyanins such as dihydrokaempferol-derived pelagonidin-rutinoside (10) and kaempferol-rutinosie (15), dihydroquercein-derived cyanidin 3-rutinoside (3), cyanidin 3-(2G-xylosylrutinoside) (2), and quercetin 3-pentoxylrutinoside (23), which were synthesized specifically in Korean black raspberry. Anthocyanins, which are synthesized from the intermediate precursors dihydroquercetin and cyanidin, were abundant in chokeberry and honeyberry, except for the rutinoside forms; cyanidin 3-glucoside (5), cyanidin 3-arabinose (4), epicatechin (32) were high in chokeberry and cyanidin-diglucoside (1) peonidin 3-glucoside (11) were high in honeyberry. Metabolites biosynthesized from quercetin did not show high contents in certain types of berries but were detected in several berries simultaneously. Significantly high levels of anthocyanins, biosynthesized from dihydromyricetin, including myricetine 3-glucoside (31), syringetin 3-glucoside (33), delphinidin glycoside (6, 7), petunidin glycoside (8, 9), and malvidin glycoside (12, 13, 14), were observed in blueberry.
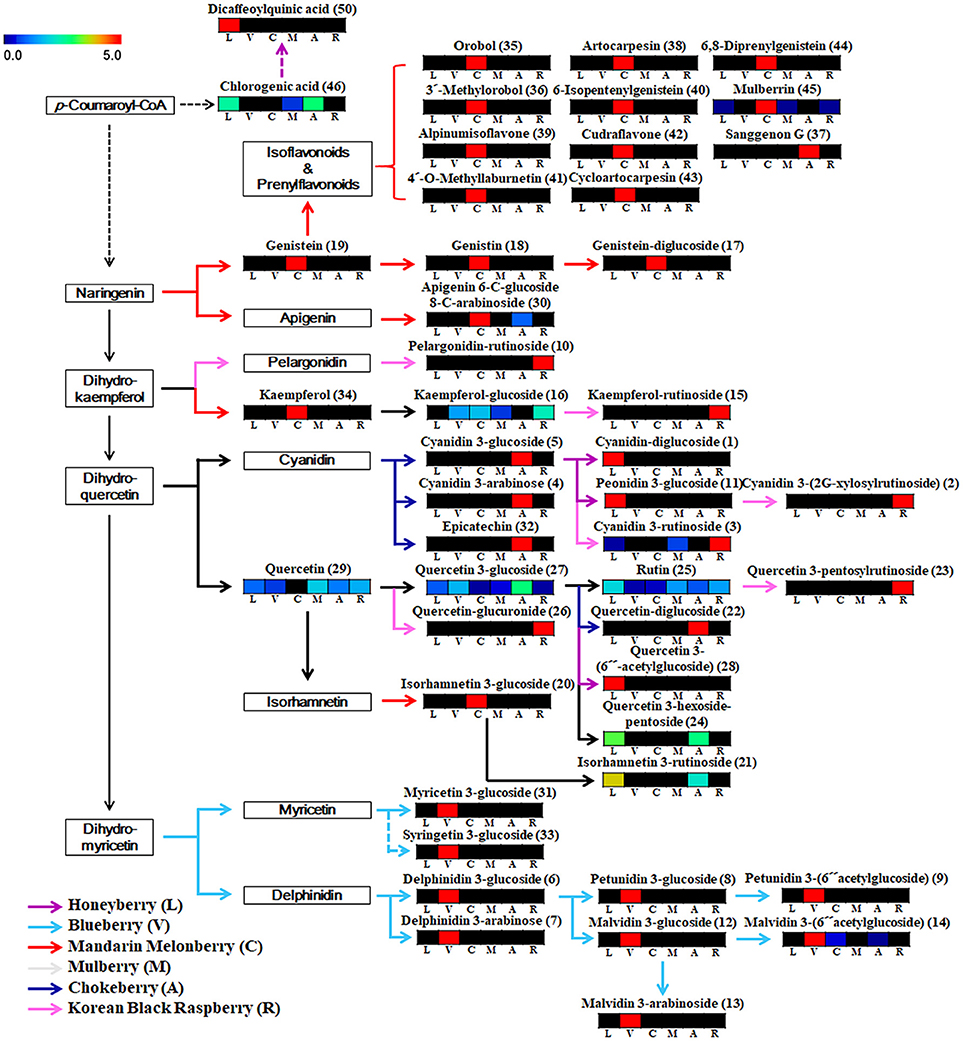
Figure 4. Schematic diagram of the biosynthetic pathway and relative content of metabolites in 6 different kinds of edible berries. The relative contents are presented as fold-changes normalized using the average of all values. The biosynthetic pathway was modified from the KEGG database (http://www.genome.jp/kegg/). L, honeyberry; V, blueberry; C, mandarin melonberry; M, mulberry; A, chokeberry; R, Korean black raspberry. Numbers on the biosynthetic pathway correspond to the metabolic numbers in Table 2.
To evaluate the contribution of metabolites to anti-oxidant activities, we performed correlation analysis between significantly discriminate metabolites and bio-activities (Figure S1). Among them, several anthocyanin glycosides [cyanidin 3-(2G-xylosylrutinoside) and pelargonidin-rutinoside] and flavonoids (kaempferol-rutinoside, quercetin 3-pentosylrutinoside, and quercetin-glucuronide), which were specifically distributed in Korean black raspberry, showed a positive correlation with bio-activities. In addition, chokeberry specifically distributed metabolites (cyanidin 3-arabinoside, cyanidin 3-glucoside, quercetin-di-glucoside, quercetin 3-glucoside, epicatechin, and sanggenon G) and metabolites highly distributed in both chokeberry and honeyberry (isorhamnetin 3-rutinoside and quercetin 3-hexoside-pentoside) were highly correlated with bio-activities. Thus, consumption of various types of berries with different metabolite compositions may have overall nutritional benefits.
Discussion
Recently, consumption of berries has rapidly increased because of their well-known high polyphenol contents (e.g., phenolic acids, flavonoids, and anthocyanins), which can prevent various diseases and disorders (Nile and Park, 2014). Many studies have examined these bio-activities such as for specific polyphenols by targeted analysis of a few berries (Wang et al., 2014a; Ramirez et al., 2015; Ancillotti et al., 2016). In this study, we performed non-targeted metabolite profiling of 6 different edible berries to compare the metabolite distributions and found differences in secondary metabolites biosynthesis routes among the berries. Our results agree with those of previous studies that compared the levels of anthocyanins, phenolics, and antioxidant capacity among different small berries (Moyer et al., 2002; Szajdek and Borowska, 2008). According to taxonomic classification (Figures 1B,C), the result of chemotaxonomic classification showed different patterns in the phylogenetic tree. These results indicate that various anthocyanins and flavonoids are positively correlated with anti-oxidant activities; however, different forms of anthocyanin and flavonoid in each berry type can reveal the unique antioxidant activities of various species. Berries are exceptionally rich sources of antioxidant polyphenols, but most metabolites showed different distribution patterns in each berry, as the major types of these metabolites varied among berries, which may be related to differences in the regulation of gene expression (Zifkin et al., 2012). Most of key regulatory genes and enzymes controlling anthocyanin and flavonoid biosynthetic pathway were well discovered in model plants such as grape berry (Wang et al., 2017), Arabidopsis (Lepiniec et al., 2006), and blueberry (Zifkin et al., 2012). However, those of genes in other kinds of berries are relatively not yet been investigated. According to genomic information of berries, 144 nucleotide sequences and 82 proteins from honeyberry (Lonicera caerulea); 319 nucleotide sequences and 135 proteins from blueberry (Vaccinium corymbosum); 45 nucleotide sequences and 24 proteins from mandarin melonberry (Cudrania tricuspidata); 4,386 nucleotide sequences and 686 proteins from mulberry (Morus alba); 47 nucleotide sequences and 101 proteins from chokeberry (Aronia melanocarpa); 141 nucleotide sequences and 17 proteins from Korean black raspberry (Rubus coreanus) have been deposited in NCBI database. Therefore, large disparity of genomic researches among berries were observed, and further researches are needed for fully understanding of anthocyanin and flavonoid biosynthetic pathway in berry. Comparative metabolomics could provide different anthocyanin and flavonoid compositions in biosynthetic pathway of each berry, which could be an important information for connection with genomic research.
Blueberry (V. corymbosum) is the most popular berry species and has been widely studied to determine its polyphenol profiles, bio-activities (Heinonen, 2007; Castrejón et al., 2008; Lee et al., 2014), and related gene expression (Zifkin et al., 2012). This species is also known to have high anti-oxidant activity, but showed average anti-oxidant activities among the 6 edible berries evaluated in this study (Figure 3). Various anthocyanin glycosides derived from an intermediate precursor, dihydromyricetin, including myricetin-, syringetin-, delphinidin-, petunidin-, and malvidin-glycosides were specifically higher in blueberry than in other berries (Figure 4). Specific anthocyanin accumulation can be explained by gene expression of related genes such as flavonol synthase, anthocyanidin synthase, UDP-Glc:flavonoid-3-O-glycosyltransferase, and anthocyanin-O-methyltransferase, which are expressed during the development of blueberry fruit (Zifkin et al., 2012).
According to the results of multivariate statistical analysis, chokeberry was clearly separated from the other berries in the PCA score plot (Figure 2A). In terms of bio-activities, chokeberry showed the highest anti-oxidant activity and an average sugar content, titratable acidity, and pH among the berries. Chokeberry contained higher levels of cyanidin-derived cyanidin monoglycoside and epicatechin than other berries according to biosynthetic pathway analysis (Figure 4), which may be related to its high anti-oxidant activity. This is consistent with the results of a previous study (Szajdek and Borowska, 2008). Differentially accumulated anthocyanin forms show large discrepancies in antioxidant capacity. Zheng and Wang reported that chokeberry (Aronia species) has significantly higher anti-oxidant activities than blueberry (Vaccinium species), and this variation was related to the distribution of phenolic compounds according to the relatively high levels of cyanidin monoglycosides and caffeic acid derivative in chokeberry and various dihydromyricetin-derived anthocyanin glycosides in blueberry (Zheng and Wang, 2003). However, further studies are needed to confirm these secondary metabolite distributions in berries with related gene expression.
The anti-oxidant capacity of Korean black raspberry was similar to that of chokeberry species. According to our results and another report, higher anti-oxidant activity is affected by high concentrations of total phenolic, flavonoids, and anthocyanins (Figure 3, Table 3; Choi and Kwak, 2014). In Korean black raspberry, particularly high contents of anthocyanin-rutinoside derivatives [pelargonidin-rutinoside, cyanidin 3-rutinoside, and cyanidin 3-(2G-xylosylrutinoside)] and some flavonoid-rutinoside derivatives (kaempferol-rutinoside and quercetin 3-pentosylrutinoside) were observed. Identical metabolite distribution patterns were observed in another study (Tian et al., 2006; Veberic et al., 2015) and related gene expression was confirmed (Hyun et al., 2014). Rubus coreanus chalcone isomerase 2 was shown to increase the levels of anthocyanin rutinosides in Korean black raspberry (R. coreanus) by Arabidopsis complementation analysis. Additionally, up-regulation of F3′3-, DFR4, and LDOX1 was observed during fruit ripening (Hyun et al., 2014). Furthermore, Korean black raspberry showed the lowest sugar content and relatively high titratable acidity among berries. According to a previous report, the sweet tastes and flavor of berry fruit is affected by not only high sugar contents, but also low levels of organic acids. The lowest sugar contents in Korean black raspberry were verified not only among the 6 edible berries in this study, but also among 25 wild or cultivated berry species reported previously (Mikulic-Petkovsek et al., 2012a).
Most flavonoids derived from naringenin were identified by mandarin melonberry-specific detection by non-targeted metabolite profiling, except for sanggenon G and apigenin 6-C-glucoside 8-C-arabinoside (Figure 4). Mandarin melonberry contained high levels of various flavonoids other than anthocyanins, such as prenylated flavonoids and isoflavonoids (Shin et al., 2015; Suh et al., 2016). Prenylated flavonoids are synthesized by C. tricuspidata isoliquiritigenin 3′-dimethylallyltransferase, flavonoid prenyltransferases, which catalyze the prenylation of several chalcones (Wang et al., 2014b). According to its physicochemical characteristics, mandarin melonberry has a sweet taste possibly because of its high levels of sugar and low contents of titratable acidity compared to other berries (Table 3). Furthermore, this berry showed the lowest anti-oxidant activities. According to previous reports, the anti-oxidant activity of flavonoids depends on the nuclear structures and types of substitutions. Several studies reported that most of anthocyanins have higher anti-oxidant capacities than other flavonoids because their flavylium cationic structure has several hydroxyl groups and different substituents in ring B at low pH (Rice-Evans et al., 1996; Heim et al., 2002; Yan et al., 2002; Zhang et al., 2008).
Honeyberry and mulberry showed similar patterns in bio-activities and physicochemical characteristics, including anti-oxidant activities, sugar content, total phenolic content, total flavonoid content, and total anthocyanin content. Particularly, honeyberry had the highest acidity among the berries. High organic acid levels accumulated during the fruit ripening of honeyberry, which may be related to its high acidity and sour taste (Lee et al., 2015). In the biosynthetic pathway, similar to chokeberry, dihydroquercetin-derived anthocyanins were detected in honeyberry, but no identical compounds were found.
In contrast, no specific anthocyanins or flavonoids synthesis routes were found in mulberry. Several metabolites including quercetin, quercetin 3-glucoside, rutin, chlorogenic acid, and kaempferol-glucoside were identified in the metabolic pathway of mulberry, but with no significantly high levels among berries. Mulberry is relatively unknown compared to other berries. Few studies have examined mulberry and its bio-active compounds. Several studies reported that mulberry contains pyrrole alkaloids as major secondary metabolites (Asano et al., 2001; Kim et al., 2013). In our results, morusimic acid C, a pyrrole alkaloid compound, showed specifically high content in mulberry (Figure S2). However, no alkaloid compounds other than morusimic acid C were found in this study. This may be because of differences in the structure and chromatographic behaviors between flavonoids and alkaloids (He, 2000; Ding et al., 2007). To identify the unique characteristics of mulberry species from among other berries, additional studies are needed.
Conclusion
In this study, we performed metabolite comparisons of 6 different edible berries to examine their biosynthetic pathways using non-targeted metabolite profiling and measured the anti-oxidant activity and physicochemical parameters to explain the different characters of each berry. We demonstrated that each berry has different anthocyanin and flavonoid compositions by biosynthetic pathway analysis and that these differences affected the nutritional benefits of berries. This biosynthetic pathway-based non-targeted metabolite profiling improves the understanding of differences in the metabolite distribution among berry species without bias and provides correct ingredients information for potential applications of important plants. Further studies focusing on robust multi-omics approaches are required to fully understand the biosynthesis of secondary metabolite differences among berries.
Author Contributions
CL supervised and took complete responsibility for this project. DS performed data processing, statistical analysis, and wrote the article. GL measured the physicochemical characters and MS analysis. EJ discussed the results and wrote the article.
Funding
This paper was supported by Konkuk University in 2017.
Conflict of Interest Statement
The authors declare that the research was conducted in the absence of any commercial or financial relationships that could be construed as a potential conflict of interest.
Supplementary material
The Supplementary Material for this article can be found online at: https://www.frontiersin.org/articles/10.3389/fpls.2018.01462/full#supplementary-material
Figure S1. Correlation map analysis between bio-activities and significantly discriminant metabolites in 6 different kinds of edible berries.
Figure S2. Heatmap of 6 different types of edible berries derived from UHPLC-LTQ-IT-MS/MS data. L, honeyberry; V, blueberry; C, mandarin melonberry; M, mulberry; A, chokeberry; R, Korean black raspberry.
References
Ancillotti, C., Ciofi, L., Pucci, D., Sagona, E., Giordani, E., Biricolti, S., et al. (2016). Polyphenolic profiles and antioxidant and antiradical activity of Italian berries from Vaccinium myrtillus L. and Vaccinium uliginosum L. subsp. gaultherioides (Bigelow) S.B. Young. Food chem. 204, 176–184. doi: 10.1016/j.foodchem.2016.02.106
Asano, N., Yamashita, T., Yasuda, K., Ikeda, K., Kizu, H., Kameda, Y., et al. (2001). Polyhydroxylated alkaloids isolated from mulberry trees (Morus alba L.) and silkworms (Bombyx mori L.). J. Agric. Food Chem. 49, 4208–4213. doi: 10.1021/jf010567e
Castrejón, A. D. R., Eichholz, I., Rohn, S., Kroh, L. W., and Huyskens-Keil, S. (2008). Phenolic profile and antioxidant activity of highbush blueberry (Vaccinium corymbosum L.) during fruit maturation and ripening. Food Chem. 109, 564–572. doi: 10.1016/j.foodchem.2008.01.007
Choi, I. S., and Kwak, E. J. (2014). Comparison of antioxidant activities and bioactive compounds between Bokbunja (Rubus coreanus Miq.) and other berries. Food Sci. Biotechnol. 23, 1677–1682. doi: 10.1007/s10068-014-0228-8
Clegg, M. E., Pratt, M., Meade, C. M., and Henry, C. J. K. (2011). The addition of raspberries and blueberries to a starch-based food does not alter the glycaemic response. Br. J. Nutr. 106, 335–338. doi: 10.1017/S0007114511001450
Devore, E. E., Kang, J. H., Breteler, M., and Grodstein, F. (2012). Dietary intakes of berries and flavonoids in relation to cognitive decline. Ann. Neurol. 72, 135–143. doi: 10.1002/ana.23594
Díaz, R., Gallart-Ayala, H., Sancho, J. V., Nuñez, O., Zamora, T., Martins, C. P., et al. (2016). Told through the wine: a liquid chromatography–mass spectrometry interplatform comparison reveals the influence of the global approach on the final annotated metabolites in non-targeted metabolomics. J. Chromatogr. A 1433, 90–97. doi: 10.1016/j.chroma.2016.01.010
Ding, L., Luo, X., Tang, F., Yuan, J., Liu, Q., and Yao, S. (2007). Simultaneous determination of flavonoid and alkaloid compounds in citrus herbs by high-performance liquid chromatography–photodiode array detection–electrospray mass spectrometry. J. Chromatogr. B 857, 202–209. doi: 10.1016/j.jchromb.2007.07.018
Gironés-Vilaplana, A., Mena, P., García-Viguera, C., and Moreno, D. A. (2012). A novel beverage rich in antioxidant phenolics: maqui berry (Aristotelia chilensis) and lemon juice. LWT Food Sci. Technol. 47, 279–286. doi: 10.1016/j.lwt.2012.01.020
Häkkinen, S., Heinonen, M., Kärenlampi, S., Mykkänen, H., Ruuskanen, J., and Törrönen, R. (1999). Screening of selected flavonoids and phenolic acids in 19 berries. Food Res. Int. 32, 345–353. doi: 10.1016/S0963-9969(99)00095-2
He, X. G. (2000). On-line identification of phytochemical constituents in botanical extracts by combined high-performance liquid chromatographic–diode array detection–mass spectrometric techniques. J. Chromatogr. A 880, 203–232. doi: 10.1016/S0021-9673(00)00059-5
Heim, K. E., Tagliaferro, A. R., and Bobilya, D. J. (2002). Flavonoid antioxidants: chemistry, metabolism and structure-activity relationships. J. Nutr. Biochem. 13, 572–584. doi: 10.1016/S0955-2863(02)00208-5
Heinonen, M. (2007). Antioxidant activity and antimicrobial effect of berry phenolics–a Finnish perspective. Mol. Nutr. Food Res. 51, 684–691. doi: 10.1002/mnfr.200700006
Hyun, T. K., Lee, S., Rim, Y., Kumar, R., Han, X., Lee, S. Y., et al. (2014). De-novo RNA sequencing and metabolite profiling to identify genes involved in anthocyanin biosynthesis in Korean black raspberry (Rubus coreanus Miquel). PLoS ONE 9:e88292. doi: 10.1371/journal.pone.0088292
Jaakola, L. (2013). New insights into the regulation of anthocyanin biosynthesis in fruits. Trends Plant Sci. 18, 477–483. doi: 10.1016/j.tplants.2013.06.003
Jang, Y. K., Jung, E. S., Lee, H. A., Choi, D., and Lee, C. H. (2015). Metabolomic characterization of Hot pepper (Capsicum annuum “CM334”) during fruit development. J. Agric. Food Chem. 63, 9452–9460. doi: 10.1021/acs.jafc.5b03873
Jung, E. S., Lee, S., Lim, S. H., Ha, S. H., Liu, K. H., and Lee, C. H. (2013). Metabolite profiling of the short-term responses of rice leaves (Oryza sativa cv. Ilmi) cultivated under different LED lights and its correlations with antioxidant activities. Plant Sci. 210, 61–69. doi: 10.1016/j.plantsci.2013.05.004
Kim, S. B., Chang, B. Y., Jo, Y. H., Lee, S. H., Han, S. B., Hwang, B. Y., et al. (2013). Macrophage activating activity of pyrrole alkaloids from Morus alba fruits. J. Ethnopharmacol. 145, 393–396. doi: 10.1016/j.jep.2012.11.007
Lee, H. J., Suh, D. H., Jung, E. S., Park, H. M., Jung, G. Y., Do, S. G., et al. (2015). Metabolomics of Lonicera caerulea fruit during ripening and its relationship with color and antioxidant activity. Food Res. Int. 78, 343–351. doi: 10.1016/j.foodres.2015.09.017
Lee, S., Jung, E. S., Do, S. G., Jung, G. Y., Song, G., Song, J. M., et al. (2014). Correlation between species-specific metabolite profiles and bioactivities of blueberries (Vaccinium spp.). J. Agric. Food Chem. 62, 2126–2133. doi: 10.1021/jf405272b
Lepiniec, L., Debeaujon, I., Routaboul, J. M., Baudry, A., Pourcel, L., Nesi, N., et al. (2006). Genetics and biochemistry of seed flavonoids. Annu. Rev. Plant Biol. 57, 405–430. doi: 10.1146/annurev.arplant.57.032905.105252
Mikulic-Petkovsek, M., Schmitzer, V., Slatnar, A., Stampar, F., and Veberic, R. (2012a). Composition of sugars, organic acids, and total phenolics in 25 wild or cultivated berry species. J. Food Sci. 77, C1064–C1070. doi: 10.1111/j.1750-3841.2012.02896.x
Mikulic-Petkovsek, M., Slatnar, A., Stampar, F., and Veberic, R. (2012b). HPLC–MSn identification and quantification of flavonol glycosides in 28 wild and cultivated berry species. Food Chem. 135, 2138–2146. doi: 10.1016/j.foodchem.2012.06.115
Moyer, R. A., Hummer, K. E., Finn, C. E., Frei, B., and Wrolstad, R. E. (2002). Anthocyanins, phenolics, and antioxidant capacity in diverse small fruits: vaccinium, Rubus, and Ribes. J. Agric. Food Chem. 50, 519–525. doi: 10.1021/jf011062r
Nile, S. H., and Park, S. W. (2014). Edible berries: bioactive components and their effect on human health. Nutrition 30, 134–144. doi: 10.1016/j.nut.2013.04.007
Ramirez, J. E., Zambrano, R., Sepúlveda, B., Kennelly, E. J., and Simirgiotis, M. J. (2015). Anthocyanins and antioxidant capacities of six Chilean berries by HPLC–HR-ESI-ToF-MS. Food Chem. 176, 106–114. doi: 10.1016/j.foodchem.2014.12.039
Rice-Evans, C. A., Miller, N. J., and Paganga, G. (1996). Structure-antioxidant activity relationships of flavonoids and phenolic acids. Free Radic. Biol. Med. 20, 933–956. doi: 10.1016/0891-5849(95)02227-9
Roopchand, D. E., Kuhn, P., Rojo, L. E., Lila, M. A., and Raskin, I. (2013). Blueberry polyphenol-enriched soybean flour reduces hyperglycemia, body weight gain and serum cholesterol in mice. Pharmacol. Res. 68, 59–67. doi: 10.1016/j.phrs.2012.11.008
Schauer, N., and Fernie, A. R. (2006). Plant metabolomics: towards biological function and mechanism. Trends Plant Sci. 11, 508–516. doi: 10.1016/j.tplants.2006.08.007
Shin, G. R., Lee, S., Lee, S., Do, S. G., Shin, E., and Lee, C. H. (2015). Maturity stage-specific metabolite profiling of Cudrania tricuspidata and its correlation with antioxidant activity. Ind. Crops Prod., 70, 322–331. doi: 10.1016/j.indcrop.2015.01.048
Suh, D. H., Jung, E. S., Park, H. M., Kim, S. H., Lee, S., Jo, Y. H., et al. (2016). Comparison of metabolites variation and antiobesity effects of fermented versus nonfermented mixtures of Cudrania tricuspidata, Lonicera caerulea, and soybean according to fermentation in vitro and in vivo. PLoS ONE 11:e0149022. doi: 10.1371/journal.pone.0149022
Suh, D. H., Lee, S., Kim, Y. S., Cho, S. K., Lee, S., et al. (2014). Metabolite profiling of red and white pitayas (Hylocereus polyrhizus and Hylocereus undatus) for comparing betalain biosynthesis and antioxidant activity. J. Agric. Food Chem. 62, 8764–8771. doi: 10.1021/jf5020704
Sumner, L. W., Lei, Z., Nikolau, B. J., and Saito, K. (2015). Modern plant metabolomics: advanced natural product gene discoveries, improved technologies, and future prospects. Nat. Prod. Rep. 32, 212–229. doi: 10.1039/C4NP00072B
Sun-Waterhouse, D., Zhou, J., and Wadhwa, S. S. (2013). Drinking yoghurts with berry polyphenols added before and after fermentation. Food Control 32, 450–460. doi: 10.1016/j.foodcont.2013.01.011
Szajdek, A., and Borowska, E. J. (2008). Bioactive compounds and health-promoting properties of berry fruits: a review. Plant Foods Hum. Nutr. 63, 147–156. doi: 10.1007/s11130-008-0097-5
Tian, Q., Giusti, M. M., Stoner, G. D., and Schwartz, S. J. (2006). Characterization of a new anthocyanin in black raspberries (Rubus occidentalis) by liquid chromatography electrospray ionization tandem mass spectrometry. Food Chem. 94, 465–468. doi: 10.1016/j.foodchem.2005.01.020
Turner, M. F., Heuberger, A. L., Kirkwood, J. S., Collins, C. C., Wolfrum, E. J., Broeckling, C. D., et al. (2016). Non-targeted metabolomics in diverse sorghum breeding lines indicates primary and secondary metabolite profiles are associated with plant biomass accumulation and photosynthesis. Front. Plant Sci. 7:953. doi: 10.3389/fpls.2016.00953
Veberic, R., Slatnar, A., Bizjak, J., Stampar, F., and Mikulic-Petkovsek, M. (2015). Anthocyanin composition of different wild and cultivated berry species. LWT Food Sci. Technol. 60, 509–517. doi: 10.1016/j.lwt.2014.08.033
Wang, L., Sun, X., Weiszmann, J., and Weckwerth, W. (2017). System-level and granger network analysis of integrated proteomic and metabolomic dynamics identifies key points of grape berry development at the interface of primary and secondary metabolism. Front. Plant Sci., 8:1066. doi: 10.3389/fpls.2017.01066
Wang, L. J., Su, S., Wu, J., Du, H., Li, S. S., Huo, J. W., et al. (2014a). Variation of anthocyanins and flavonols in Vaccinium uliginosum berry in Lesser Khingan Mountains and its antioxidant activity.Food Chem.160, 357–364. doi: 10.1016/j.foodchem.2014.03.081
Wang, R., Chen, R., Li, J., Liu, X., Xie, K., Chen, D., et al. (2014b). Molecular characterization and phylogenetic analysis of two novel regio-specific flavonoid prenyltransferases from Morus alba and Cudrania tricuspidata. J. Biol. Chem. 289, 35815–35825. doi: 10.1074/jbc.M114.608265
Yan, X., Murphy, B. T., Hammond, G. B., Vinson, J. A., and Neto, C. C. (2002). Antioxidant activities and antitumor screening of extracts from cranberry fruit (Vaccinium macrocarpon). J. Agric. Food Chem. 50, 5844–5849. doi: 10.1021/jf0202234
Zhang, Y., Seeram, N. P., Lee, R., Feng, L., and Heber, D. (2008). Isolation and identification of strawberry phenolics with antioxidant and human cancer cell antiproliferative properties. J. Agric. Food Chem. 56, 670–675. doi: 10.1021/jf071989c
Zheng, W., and Wang, S. Y. (2003). Oxygen radical absorbing capacity of phenolics in blueberries, cranberries, chokeberries, and lingonberries. J. Agric. Food Chem. 51, 502–509. doi: 10.1021/jf020728u
Zifkin, M., Jin, A., Ozga, J. A., Zaharia, L. I., Schernthaner, J. P., Gesell, A., et al. (2012). Gene expression and metabolite profiling of developing highbush blueberry fruit indicates transcriptional regulation of flavonoid metabolism and activation of abscisic acid metabolism. Plant Physiol. 158, 200–224. doi: 10.1104/pp.111.180950
Keywords: berry, metabolomics, biosynthetic pathway, polyphenol, anti-oxidant activity
Citation: Suh DH, Jung ES, Lee GM and Lee CH (2018) Distinguishing Six Edible Berries Based on Metabolic Pathway and Bioactivity Correlations by Non-targeted Metabolite Profiling. Front. Plant Sci. 9:1462. doi: 10.3389/fpls.2018.01462
Received: 20 March 2018; Accepted: 13 September 2018;
Published: 02 October 2018.
Edited by:
Flavia Guzzo, Università degli Studi di Verona, ItalyReviewed by:
Inger Martinussen, Norwegian Institute of Bioeconomy Research (NIBIO), NorwayVinay Kumar, Central University of Punjab, India
Copyright © 2018 Suh, Jung, Lee and Lee. This is an open-access article distributed under the terms of the Creative Commons Attribution License (CC BY). The use, distribution or reproduction in other forums is permitted, provided the original author(s) and the copyright owner(s) are credited and that the original publication in this journal is cited, in accordance with accepted academic practice. No use, distribution or reproduction is permitted which does not comply with these terms.
*Correspondence: Choong Hwan Lee, Y2hsZWUxMjNAa29ua3VrLmFjLmty
† These authors have contributed equally to this work