 Surbhi Grewal1*
 Stella Hubbart-Edwards1
 Caiyun Yang1
 Duncan Scholefield1
 Stephen Ashling1
 Amanda Burridge2
 Paul Anthony Wilkinson2
 Ian P. King1
 Julie King1
- 1Nottingham BBSRC Wheat Research Centre, Plant and Crop Sciences, School of Biosciences, The University of Nottingham, Loughborough, United Kingdom
- 2Cereal Genomics Lab, Life Sciences Building, School of Biological Sciences, University of Bristol, Bristol, United Kingdom
Tritcum urartu (2n = 2x = 14, AuAu), the A genome donor of wheat, is an important source for new genetic variation for wheat improvement due to its high photosynthetic rate and disease resistance. By facilitating the generation of genome-wide introgressions leading to a variety of different wheat–T. urartu translocation lines, T. urartu can be practically utilized in wheat improvement. Previous studies that have generated such introgression lines have been unable to successfully use cytological methods to detect the presence of T. urartu in these lines. Many have, thus, used a variety of molecular markers with limited success due to the low-density coverage of these markers and time-consuming nature of the techniques rendering them unsuitable for large-scale breeding programs. In this study, we report the generation of a resource of single nucleotide polymorphic (SNP) markers, present on a high-throughput SNP genotyping array, that can detect the presence of T. urartu in a hexaploid wheat background making it a potentially valuable tool in wheat pre-breeding programs. A whole genome introgression approach has resulted in the transfer of different chromosome segments from T. urartu into wheat which have then been detected and characterized using these SNP markers. The molecular analysis of these wheat-T. urartu recombinant lines has resulted in the generation of a genetic map of T. urartu containing 368 SNP markers, spread across all seven chromosomes of T. urartu. Comparative analysis of the genetic map of T. urartu and the physical map of the hexaploid wheat genome showed that synteny between the two species is highly conserved at the macro-level and confirmed the presence of the 4/5 translocation in T. urartu also present in the A genome of wheat. A panel of 17 wheat-T. urartu recombinant lines, which consisted of introgressed segments that covered the whole genome of T. urartu, were also selected for self-fertilization to provide a germplasm resource for future trait analysis. This valuable resource of high-density molecular markers specifically designed for detecting wild relative chromosomes and a panel of stable interspecific introgression lines will greatly enhance the efficiency of wheat improvement through wild relative introgressions.
Introduction
Common wheat has a narrow worldwide gene pool, descended from a very small number of spontaneous interspecific hybrids that originated from two natural amphiploidisation events. Domestication of wheat has further reduced its genetic variation. However, interspecific crossing with wheat’s distant wild relatives has recently been employed to overcome this genetic bottleneck (Gill et al., 2011; King et al., 2017; Zhang et al., 2017; Grewal et al., 2018). Moreover, wheat’s progenitors are being regarded as useful sources of genetic variation for many biotic and abiotic traits (Cox, 1997; Qiu et al., 2005; Börner et al., 2015; Cox et al., 2017; King et al., 2018).
Triticum urartu Thum. ex Gandil. (2n = 2x = 14; genome AuAu) is the A-genome donor of tetraploid wheat T. turgidum subsp. durum (2n = 2x = 42; genome AABB) and hexaploid wheat T. aestivum (2n = 2x = 42; genome AABBDD) (Dvorak et al., 1993) and its chromosomes are homologous to chromosomes of the A genome of bread wheat (Chapman et al., 1976). Thus, interspecific crossing between T. urartu and bread wheat would potentially enable transfer of desirable traits from the chromosomes of the wild diploid wheat into cultivated hexaploid wheat through direct hybridization. Previous research has shown that T. urartu carries many agronomically important traits, such as high net photosynthetic rate (Austin et al., 1982, 1986; Morgan and Austin, 1986) and disease resistance (Rouse and Jin, 2011; Sheedy et al., 2012), which can be exploited for improving wheat’s narrow gene pool (Qiu et al., 2005; Martín et al., 2008).
For a successful interspecific crossing program, it is vital to be able to detect the presence of and distinguish between the parental chromosomes/alleles in the hybrids. Since T. urartu is the donor of wheat’s A genome, traditional cytogenetic methods, such as genomic in situ hybridisation (GISH) and fluorescent in situ hybridisation (FISH), are unable to clearly distinguish between the A genome chromosomes of wheat and those of T. urartu in the interspecific hybrid. It also does not help that there are currently very few cytogenetic markers used for the analysis of A genome chromosomes (Adonina et al., 2015).
Previous attempts have been made at crossing T. urartu with other diploid wheat (Johnson and Dhaliwal, 1976; Fricano et al., 2014), tetraploid wheat (Johnson and Dhaliwal, 1976; Valkoun, 2001; Alvarez et al., 2009; Rodríguez-Suárez et al., 2011), and hexaploid wheat (Dvořák, 1976, 1978; Qiu et al., 2005). However, due to the lack of efficient cytogenetic methods for the detection of T. urartu chromatin in the hybrids, some studies have resorted to the use of microsatellite markers for detecting the presence of T. urartu alleles in wheat (Qiu et al., 2005; Rodríguez-Suárez et al., 2011). However, these markers do not provide a high-density coverage of the T. urartu genome. In addition, these techniques are low throughput and have limited success and are thus, not suitable for use in large-scale pre-breeding programs. Next-generation sequencing technologies and high-throughput single nucleotide polymorphism (SNP) marker development and corresponding SNP-arrays allow faster and more accurate detection of introgressions from wild relatives into wheat (Tiwari et al., 2014, 2015; King et al., 2017, 2018; Grewal et al., 2018).
In this study, we present a resource of SNP markers, spread across all seven chromosomes of T. urartu, which were used to identify T. urartu chromatin in the hexaploid wheat background. The aim of the research was to attempt to transfer chromosome segments from T. urartu into hexaploid wheat using a whole-genome introgression approach i.e., to exploit genetic variation from the entire genome of T. urartu rather than concentrate on a single introgression for a single trait, and characterize the population with a custom-designed SNP genotyping array (Winfield et al., 2016; King et al., 2017). Using these SNP markers, we were able to detect and characterize wheat-T. urartu recombinants which allowed us to generate a genetic map for T. urartu consisting of 368 SNP markers. A panel of 17 wheat-T. urartu recombinant lines were then selected for self-fertilization to provide a germplasm resource consisting of the whole genome of T. urartu introgressed into hexaploid wheat. Development of such high-density molecular markers specific for wild relative chromosomes and a panel of stable interspecific introgression lines will greatly enhance the efficiency of wheat improvement through wild relative introgressions.
Materials and Methods
Plant Materials
Hexaploid wheat T. aestivum cv. Paragon ph1/ph1 mutant (2n = 6x = 42) was pollinated with T. urartu (accessions 1010001, 1010002, 1010006, and 1010020 obtained from Germplasm Resource Unit, JIC; 2n = 2x = 14) to produce F1 interspecific hybrids (Figure 1). The origin, according to the GRU database Seedstor, of accessions 1010001, 1010002, and 1010006 is from Armenia and that of accession 1010020 is unknown. There is no trait data available for these accessions in particular and were thus, chosen at random.
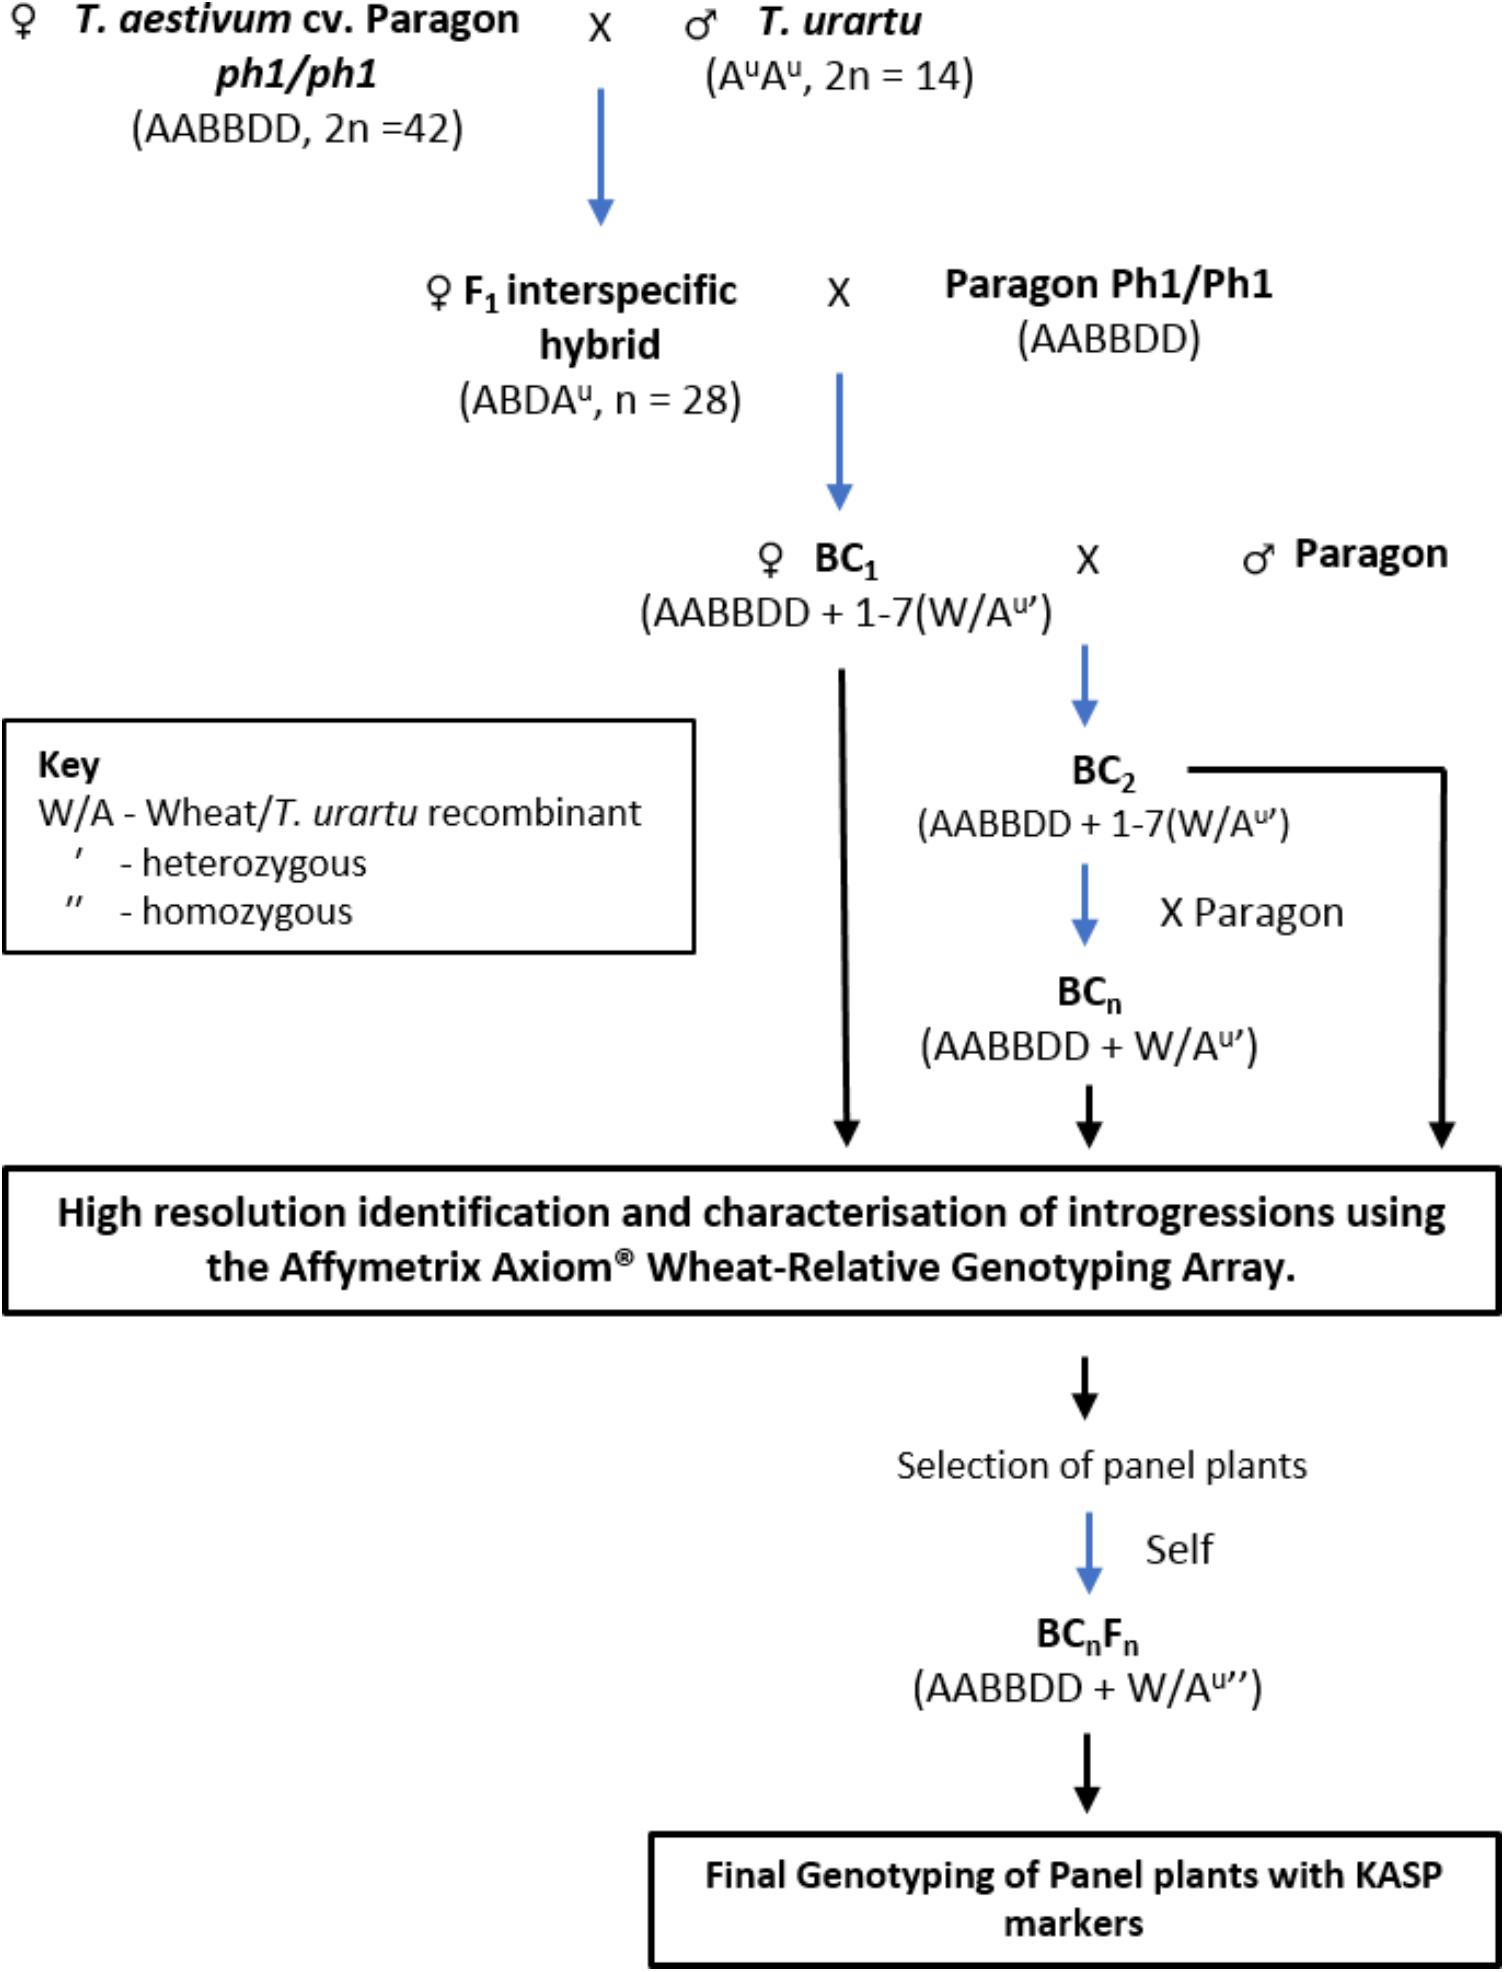
FIGURE 1. A summary of the crossing program followed to obtain interspecific wheat-Tritcum urartu introgression lines.
In the F1 hybrids, it was expected that recombination between chromosomes of T. urartu and wheat would occur, during gametogenesis, in absence of the Ph1 pairing locus resulting in the production of wheat-T. urartu recombinants. These recombinant chromosomes would subsequently be transmitted to the progeny of these hybrid lines to generate T. urartu introgressions. After being grown to maturity, the F1 hybrids were used as the female and backcrossed with Paragon wheat, carrying the wild-type Ph1 locus intact, to generate a BC1 population. The BC1 individuals were then recurrently pollinated with Paragon Ph1/Ph1 to produce BC2, BC3, and BC4 populations (Figure 1). Three heads from each plant in each backcross population were bagged to allow self-fertilization. Cross fertility was calculated as the number of crosses setting seed.
Genotyping via an Axiom® SNP Array
To detect introgressed chromosomes and chromosome segments from T. urartu into wheat, an array of circa 35 K SNPs, known as the Axiom® Wheat-Relative Genotyping Array (available via Thermo Fisher Scientific), was used (King et al., 2017). In summary, the array is composed of SNPs each showing polymorphisms for the ten wild relatives relative to the wheat genotypes under study. All the SNPs incorporated in this array formed part of the Axiom® 820 K SNP array (Winfield et al., 2016). Detailed methods and protocols of the construction of the arrays is reported by Burridge et al. (2017). The data set for the Axiom® 820 K array is available from www.cerealsdb.uk.net (Winfield et al., 2012a). This array is facilitating cost-effective, high-throughput and high resolution screening of wheat-wild relative introgressions. Table 2 shows the number of putative SNPs, for each linkage group (LG), between T. urartu and wheat included on the array.
The Axiom® Wheat-Relative Genotyping Array was used to genotype 264 samples in total. Control samples included three replicates of each of parental lines, i.e., wheat cv. Paragon and T. urartu (all accessions were pooled into one sample). It should be noted that all the SNPs used on the array were also selected to be polymorphic between Paragon and all accessions of T. urartu used in this program. Call rate for a sample was calculated as the percentage of the number of SNP probes on the array that resulted in a definitive genotype call (AA, AB, and BB) for that sample. The equipment, software, procedures, and criteria used for this genotyping are as described by King et al. (2017).
Genetic Mapping of T. urartu Chromosomes
Along with triplicates of the two parental lines, 258 lines comprising BC1, BC2, and BC3 populations of T. urartu were genotyped altogether (different generations were combined in order to have sufficient numbers of individuals) using the Axiom® Wheat-Relative Genotyping Array. As described by King et al. (2017), only the Poly High Resolution (PHR) SNP markers were used for further marker analysis. PHR markers were co-dominant, polymorphic and generated minor allele calls for at least two of the three replicates of T. urartu. FlapjackTM was used to disregard SNP markers which showed (i) heterozygous calls for either parent(s), (ii) no polymorphism between the wheat parents and T. urartu and/or, (iii) no calls for either parent(s) (Milne et al., 2010; v.1.14.09.24). The remaining markers were sorted into LGs in JoinMap® 4.0 (Van Ooijen, 2011) with a LOD score of 30 using the genotype classification code “(a,h)”, where “a” is the genotype of the first parent and “h” is the genotype of the F1 hybrid. “BCpxFy” was used as the population code for each dataset which donates an advanced backcross inbred line family, where the backcross parent p had genotype “a”, x is the number of backcrosses including the one for creating the BC1 and y is the number of selfings, i.e., BCa1F0 is equivalent to BC1. The seven highest-ranking LGs were selected for downstream analysis. These were exported and assigned to chromosomes using information from the Axiom® Wheat HD Genotyping Array (Winfield et al., 2012b). Erroneous markers that had more than 20% missing genotype calls were removed. LG data was used to produce a genetic map using MapChart 2.3 (Voorrips, 2002). In some cases, physical map information was employed to order loci. Graphical genotype visualization was performed using Graphical GenoTypes 2.0 (GGT; van Berloo, 2008).
Selection of Panel Lines
After genotyping, all backcrossed lines with three or less segments introgressed from T. urartu were considered for construction of a panel of plants with various homozygous segments. For that purpose, a set of lines that potentially had overlapping, different sized introgressions from T. urartu spanning the length of each LG were selected for self-fertilization to eventually produce a panel of homozygous single segment lines that covered the entire genome of T. urartu.
Comparative Analysis
Synteny analysis was carried out using sequence information of the markers located on the genetic map of T. urartu. The sequences of the mapped markers were used in BLAST (e-value cut-off of 1e-05) against the wheat genome IWGSC RefSeq v1.0 (Alaux et al., 2018; International Wheat Genome Sequencing Consortium [IWGSC] et al., 2018) to obtain the corresponding physical positions of the top hit in A, B, and D genomes of wheat. The sequences were also used in BLAST against the T. urartu reference genome sequence (Ling et al., 2018) to obtain the top hit on the Tu chromosomes. To generate the figures, map positions of the loci on the genetic map of T. urartu were scaled up by a factor of 100,000 to match the corresponding physical positions of the loci on the wheat A genome and the T. urartu (Tu) genome. Figure 5 was visualized using Circos plots (v. 0.69; Krzywinski et al., 2009) to observe (a) correlation between the markers on the genetic map of T. urartu and their physical positions on the Tu genome sequence and (b) synteny between the markers mapped on the Au genome of T. urartu and the A genome of wheat. Corresponding genetic and physical positions of the markers on T. urartu and wheat, respectively, are shown in Supplementary Table S1.
Results
Generating Introgressions From T. urartu Into Hexaploid Wheat
A crossing program was initiated to generate gene introgressions from T. urartu into wheat cv. Paragon (Figure 1) using the ph1 mutant method (Grewal et al., 2018). A total of 1902 crosses were made between wheat and T. urartu and their derivatives leading to the generation of 18441 crossed seed and 14193 self-fertilized seed. The number of seeds sown, germination rate, cross fertility and seed set, etc., are summarized in Table 1.
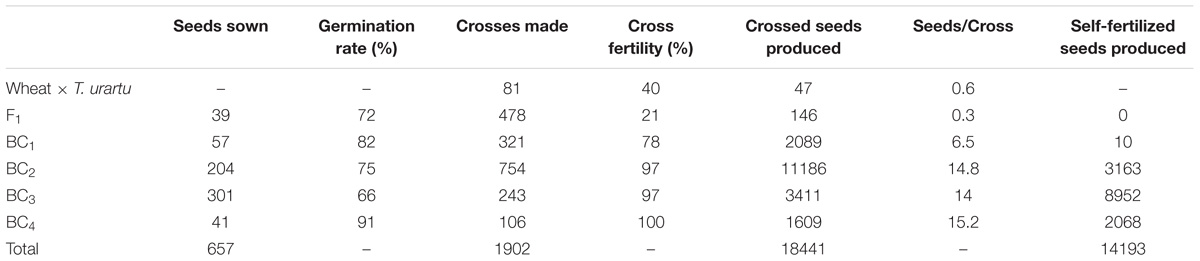
TABLE 1. Number of seeds produced and germinated in relation to the number of crosses carried out, cross fertility and the number of self-fertilized seed produced for each generation of the introgression program for Tritcum urartu into wheat.
Hexaploid bread wheat was used as the female parent to avoid problems with exotic cytoplasm. Sufficient viable F1 seeds were achieved without embryo rescue (Table 1). The F1 hybrids were backcrossed with Paragon wheat with the Ph1 gene intact to generate the backcross populations. F1 hybrids exhibited the highest levels of infertility since they had a cross fertility of only 21% as compared to 78, 97, 97, and 100% from the crossed ears of the BC1, BC2, BC3, and BC4 generations. A further indication of the infertility of the F1 was shown by the fact that this generation set no self-seed in contrast to the other generations. Since the ABDAu tetraploids were sterile, they were pollinated without emasculation. 478 crosses between the F1 hybrids and Paragon wheat resulted in 146 BC1 seeds. Approximately half of these BC1 seeds were germinated of which 43 adult plants were obtained. These BC1 plants also had low fertility with 24 out of 34 self-fertilized heads producing no seed. However, fertility was restored in the subsequent backcross generations.
Molecular Marker Analysis of Wheat-T. urartu Introgression Lines
There are 18,287 SNPs between T. urartu and wheat on the Axiom® Wheat-Relative Genotyping Array which were evenly spread over all seven LGs (Table 2). This array was used to screen genomic DNA prepared from 258 backcross lines between wheat and T. urartu along with control samples. Genotype calls were generated, and the sample call rate ranged from 83.2 to 99.9% with an average of 98.9% for the 264 samples. The lowest call rates were obtained for the three T. urartu samples with an average of 86.8%. Even though the Affymetrix software classified the scores for each of the probes into six cluster patterns, only those calls classified as PHR (3168) were used for genotyping as these are optimum quality.
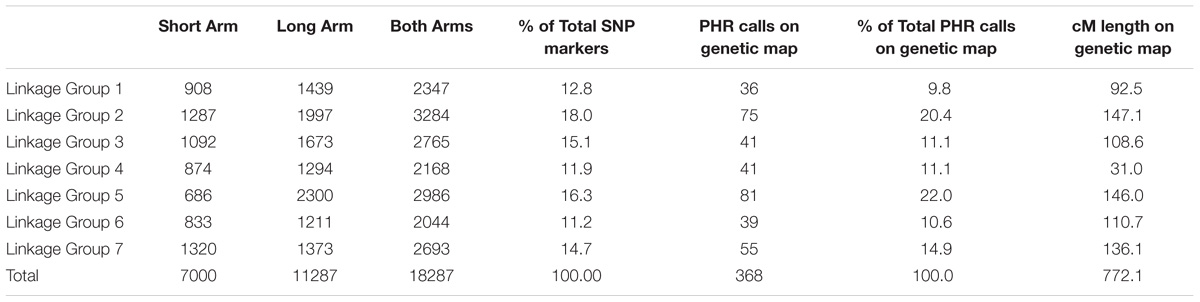
TABLE 2. Number of SNP markers polymorphic between wheat and T. urartu on the Affymetrix Axiom® Wheat-Relative Genotyping Array for each linkage group of the Au genome and final number of SNP markers mapped onto the genetic map of the Au genome of T. urartu obtained through Poly High Resolution (PHR) calling.
After filtering out 2509 good quality PHR SNPs using FlapjackTM, JoinMap® was used to genetically map the markers by analyzing the corresponding genotypes of all lines. In order to get strongly linked loci a high LOD score was used which led to the establishment of seven LGs that were composed of 368 SNPs and represented the seven chromosomes of T. urartu (Figure 2). Within the mapped PHR SNPS, LG 5 had the highest number of SNPs (22%) while LG 1 had the lowest (9.8%). A genetic map was constructed (Figure 2) with a total map length of 772.1 cM (Table 2) and an average chromosome length of 110.3 cM. It should be noted that the germplasm used to generate these linkage maps did not constitute proper mapping populations and in fact we combined different generations in order to have sufficient numbers. Therefore, the cM distances in the map generated should be treated with considerable caution. However, the map did allow the ordering of the markers and hence, the identification and tracking of segments through backcross generations.
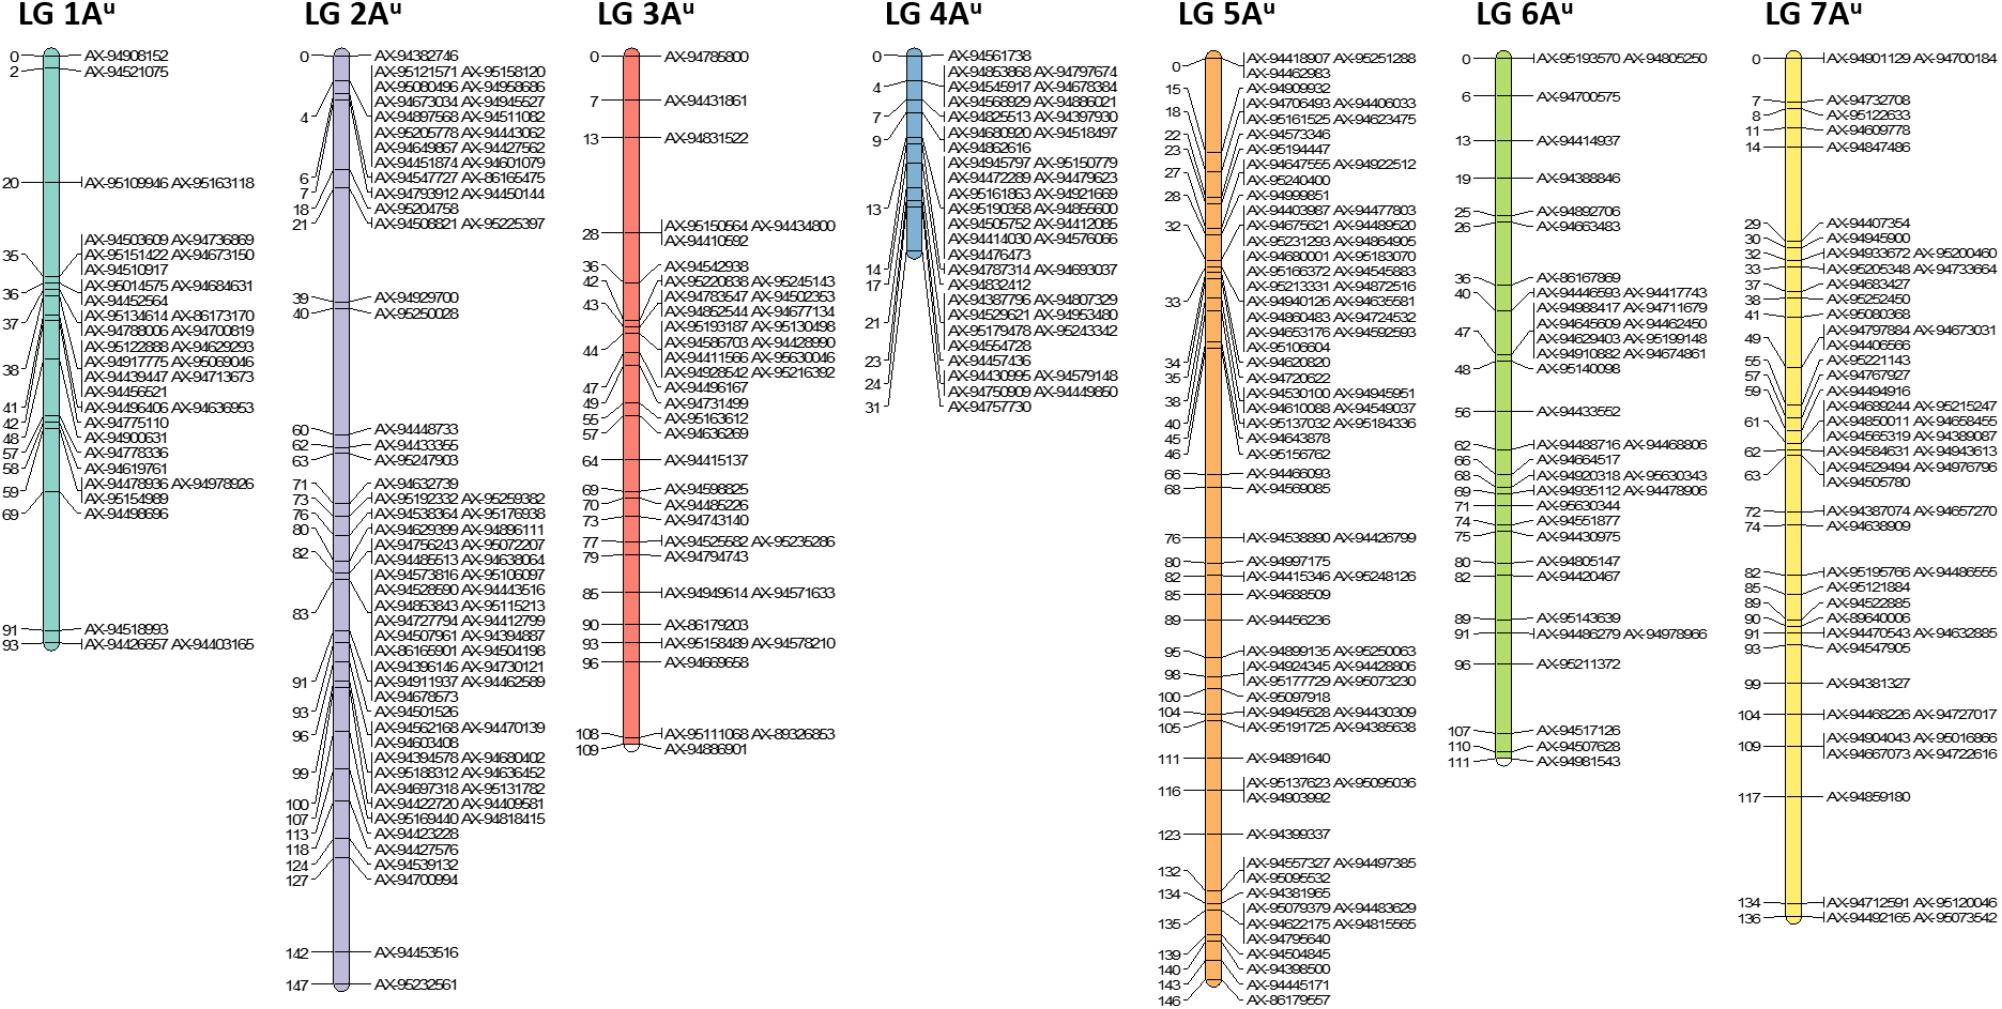
FIGURE 2. Genetic linkage map of T. urartu showing 368 SNP markers spread across seven linkage groups (LGs).
Detection of Introgressions and Panel Selection
In Figure 3, an example of how the genetic map allowed the tracking of T. urartu introgressions, through the backcrossed populations, is shown. Presence of T. urartu, shown in colored segments, could be visualized through GGT bar diagrams which allowed the graphical representation of the genotyping data for each line, i.e., the markers on the genetic map. The dark blue region of the GGT bars represent the wheat allele for a marker. Introgressions could be tracked from the BC1 plant (BC1-293), which carried T. urartu segments from each of the seven LGs, through to the single segment BC4 lines (BC4-112B and BC4-112C). Of the two BC2 plants (BC2-218A and BC2-218B) originating from the BC1 plant, both carrying segments from six T. urartu LGs, BC2-218B was propagated further to produce two BC3 plants, BC3-134A and BC3-134C. The former was further backcrossed to produce two BC4 plants, each with a different T. urartu segment.
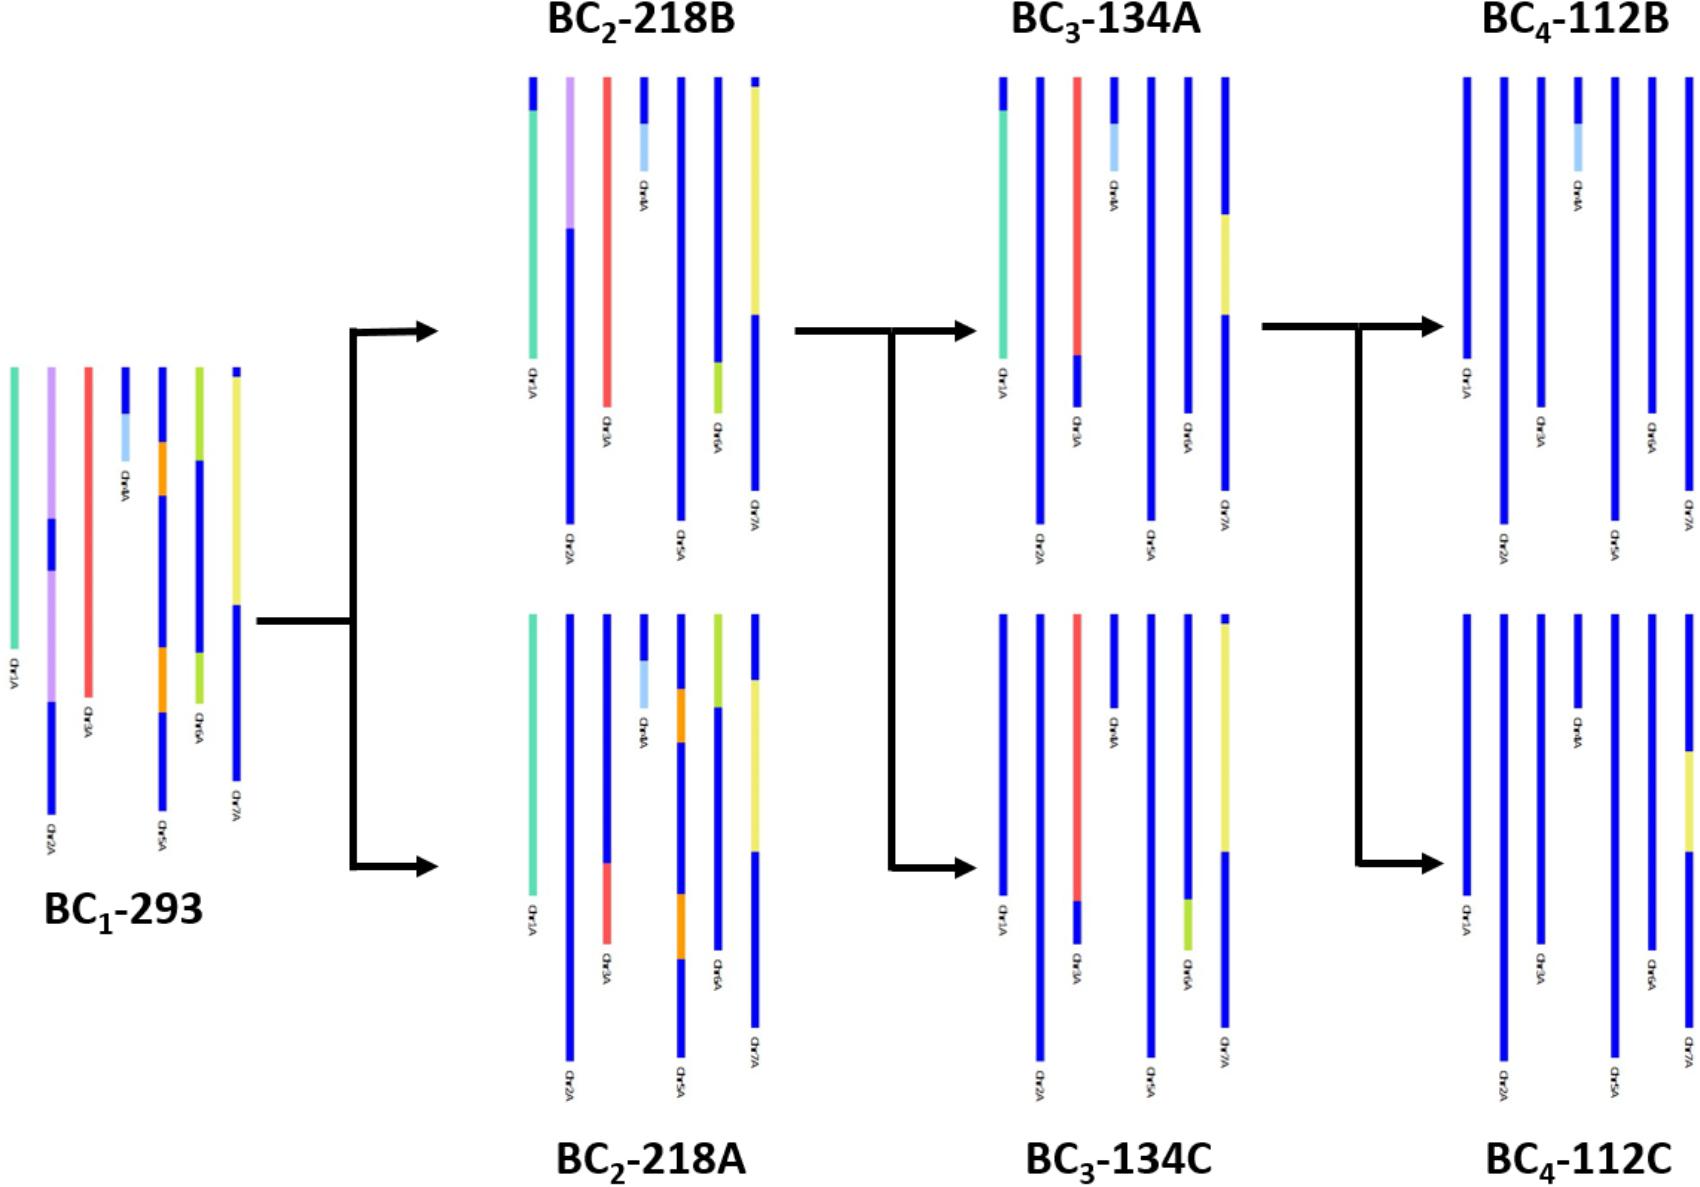
FIGURE 3. A graphical representation of SNP characterisation of T. urartu introgressions into a hexaploid wheat background in four consecutive generations, i.e., BC1, BC2, BC3, and BC4, through GGT bar diagrams. Wheat genotype is represented in dark blue and T. urartu genotype is represented in a different color for each LG.
Furthermore, all lines with 3 or less segments from T. urartu were considered for self-fertilization. From these, 17 lines were selected which had a combination of introgressed segments that would overlap to cover the entire genome of T. urartu as shown in Figure 4 and Supplementary Table S2. In lines with multiple segments, each segment is color-coded with the same color, i.e., T. urartu segments in different LGs of the same color in Figure 4 belong to one introgression line. This panel of T. urartu introgression lines, where each line contained between 1 and 3 segments, are currently being self-fertilized for downstream trait analysis.
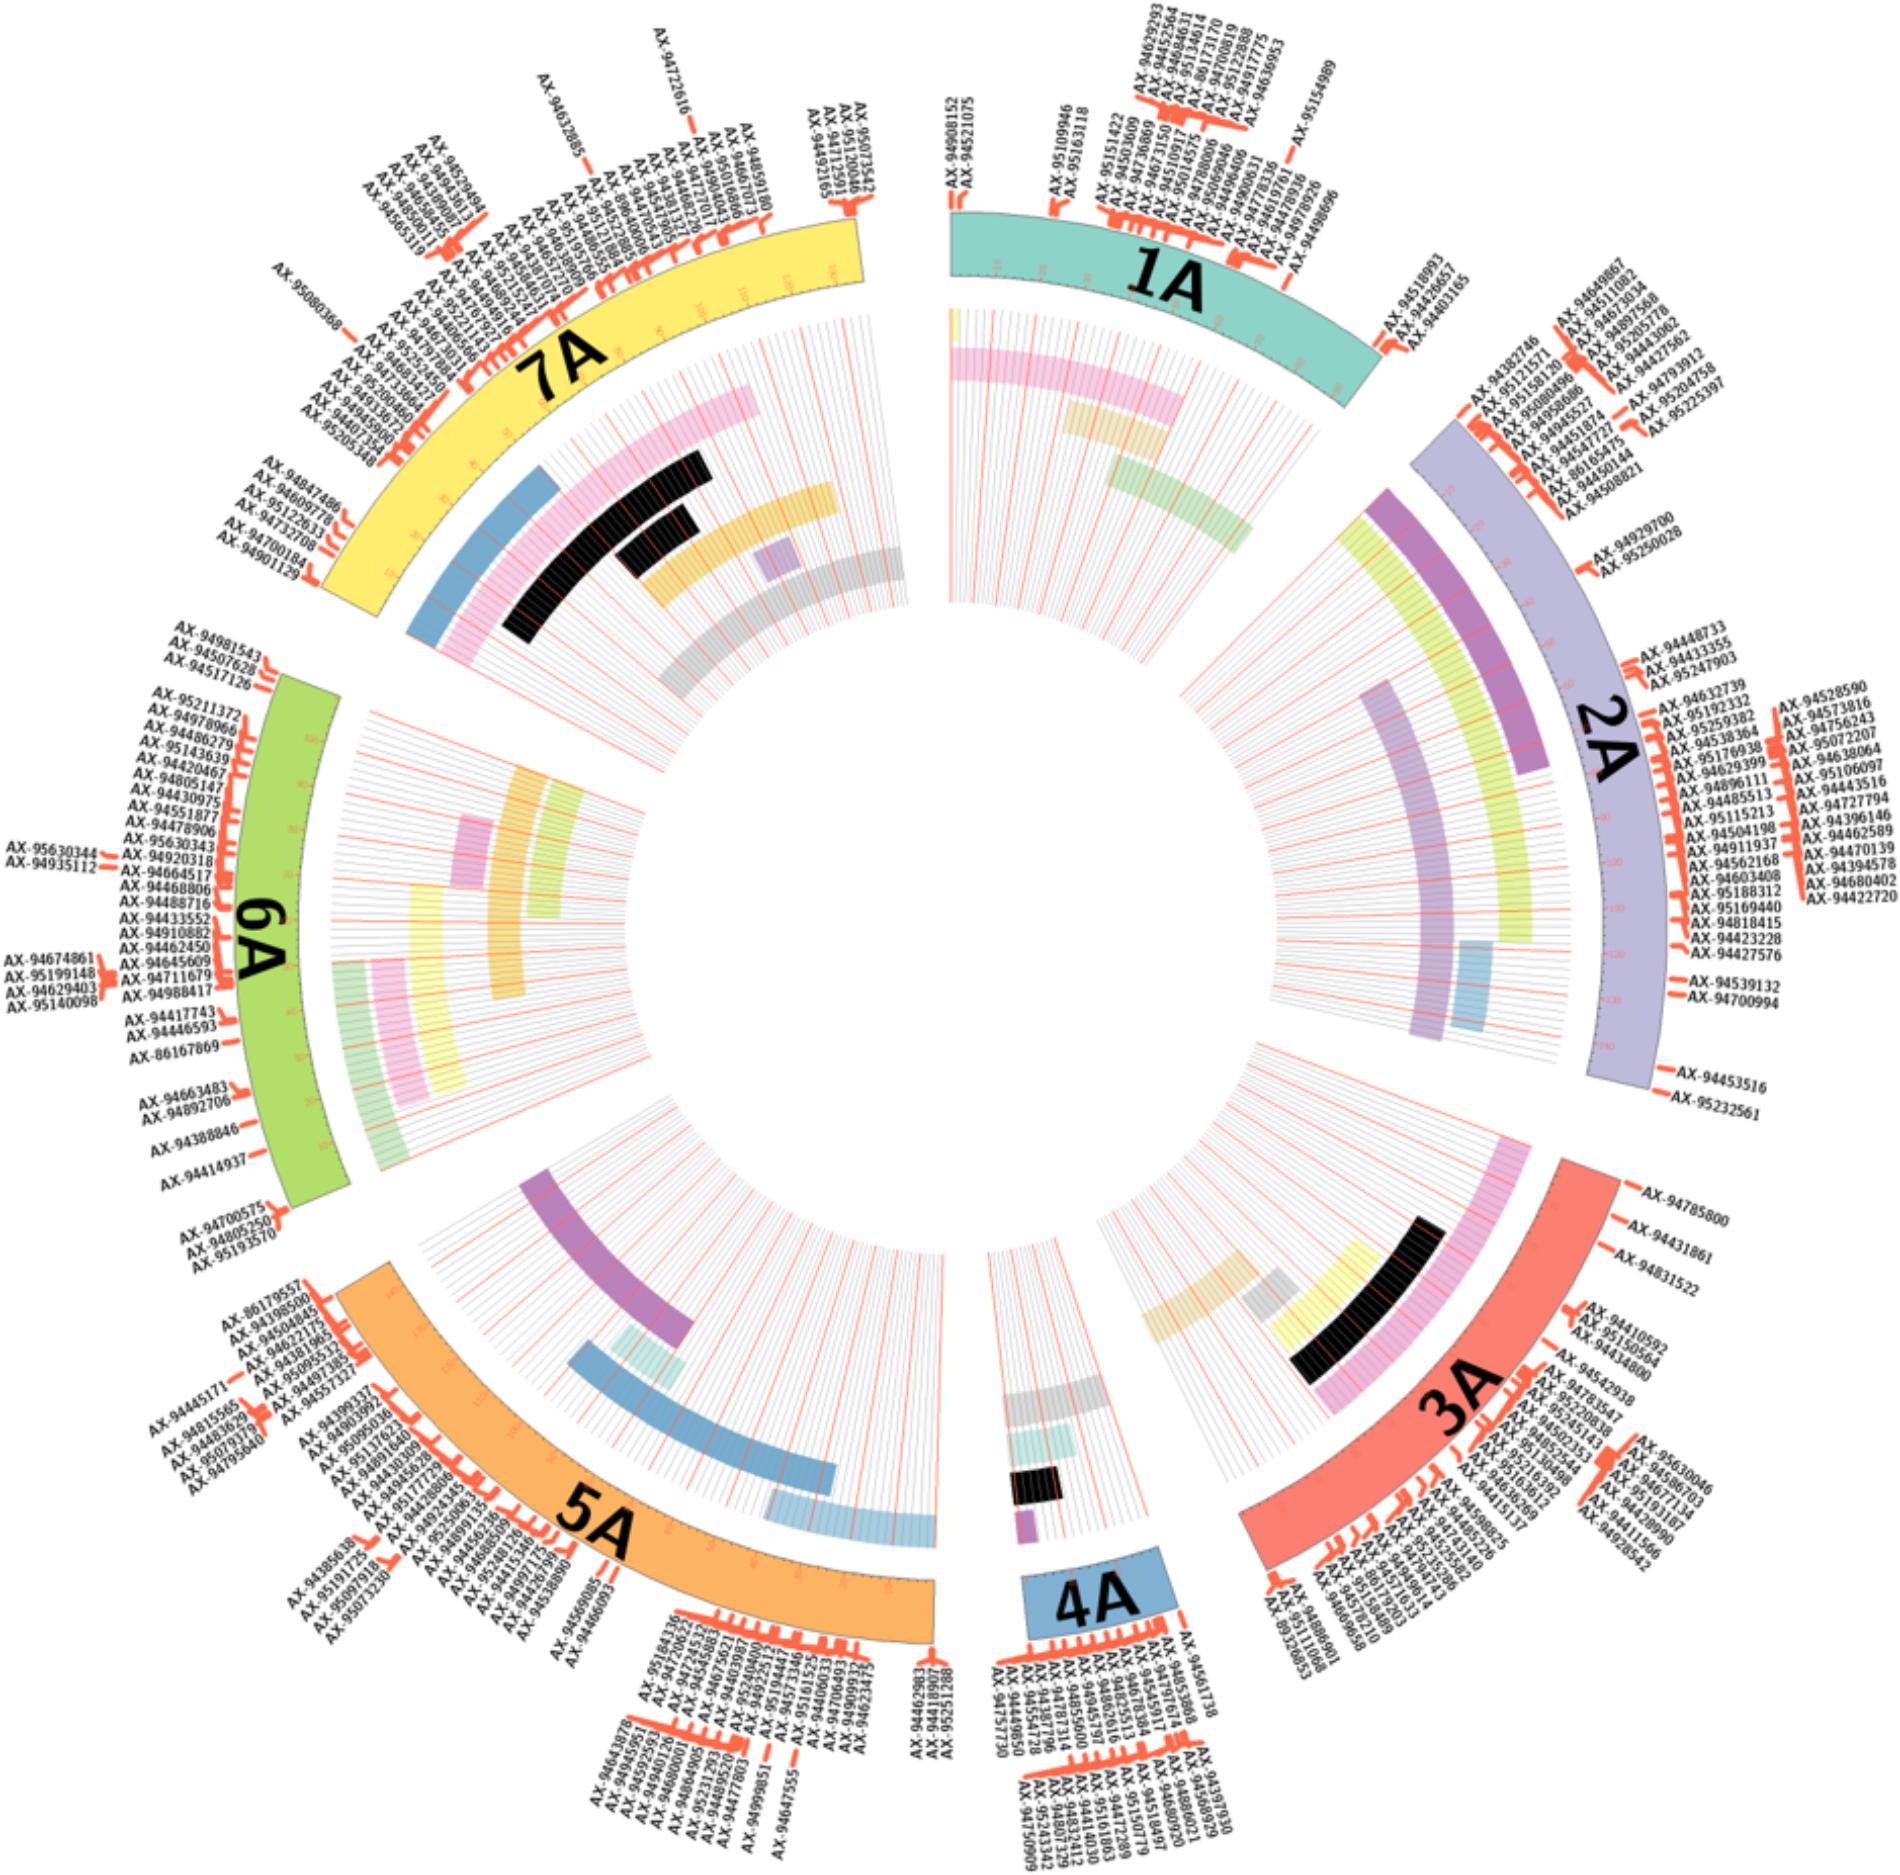
FIGURE 4. A graphical representation of various sized segments of T. urartu, along its linkage map, in introgression lines involved in panel selection. For each of the seven LGs, the map positions of the corresponding molecular markers are reported. Black bars represent single chromosome segments of T. urartu detected in the introgression lines, while bars with the same color indicate multiple chromosome segments of T. urartu detected in a single introgression line. In total, 17 lines with overlapping segments that covered the entire genome of T. urartu were selected for a panel of lines that would undergo self-fertilization for downstream trait analysis.
Comparative Analysis of Wheat and T. urartu Genomes
A BLAST analysis of the 368 marker sequences on the Au genome map against their physical positions on the T. urartu genome (Tu chromosomes) indicated that the order of markers on the genetic map correlates well with their physical order on the Tu chromosomes. 341 markers resulted in a BLAST hit against the Tu genome sequence. Figure 5A shows that the seven LGs of mapped markers on the Au genome also map back to their corresponding Tu chromosome group, i.e., markers in LG 1 had a BLAST top hit on chromosome Tu1, and the markers are well distributed on each of the seven Tu chromosomes.
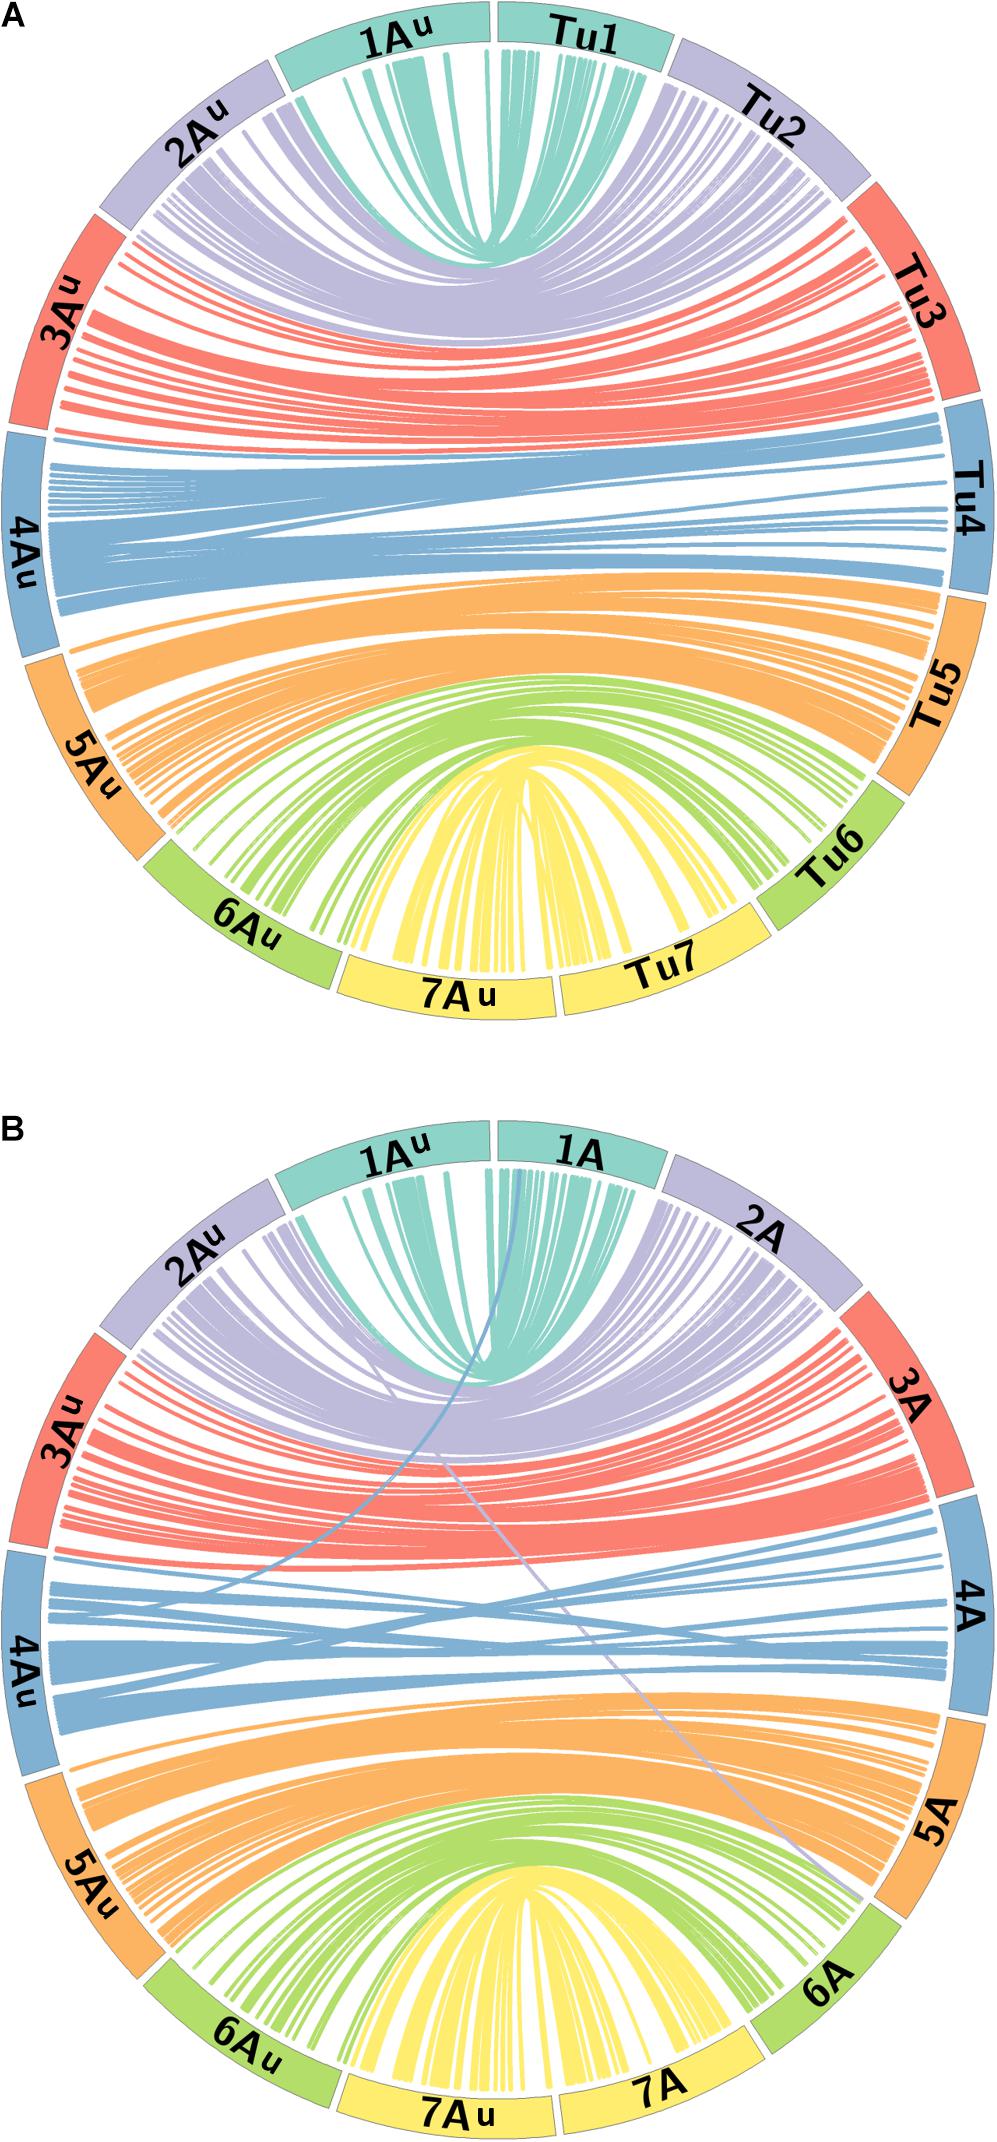
FIGURE 5. Comparative analysis between the Au genome loci on the genetic map of T. urartu and their physical positions on (A) the Tu chromosomes and (B) the A genome of wheat. Homeologous chromosomes from 7 LGs between T. urartu and wheat are displayed as ideograms of the same color. Lines connect genetic map positions of markers in the Au genome (left of plot) to their physical map positions (right of plot) on the (A) Tu chromosomes and (B) the A genome of wheat. Lines joining Au and wheat A chromosomes with the same color as the ideograms indicate synteny through mapping in homeologous LGs. Lines between the Au and the wheat A genome that end in a different colored ideogram in the wheat genome point to mapping in non-homoeologous LGs.
A macro-colinearity analysis was carried out to determine any occurrences of major chromosome rearrangements in the A genome during or after the formation of hexaploid wheat. Marker sequences on the genetic map of T. urartu were also used in BLAST analysis against the wheat Chinese Spring genome assembly. Physical position for the top hit from the A genome of wheat, where available, and for the overall top hit (maximum sequence identity match) for either of the 3 wheat genomes was obtained (Supplementary Table S1). The BLAST results showed that 92.4, 74.7, and 76.4% of the markers had a significant BLAST hit on the A, B, and D genomes of wheat, respectively. Of these BLAST hits, 73.9, 13.6, and 19.8% of the markers had an overall top hit on the A, B, and D genomes of wheat, respectively, with some showing the same score for the top hit for more than one genome.
Figure 5B shows the syntenic relationship between the seven LGs of the Au genome of T. urartu and the A genome of wheat with colored lines showing significant synteny and collinearity. Some gene rearrangements are indicated where single markers cross map to positions on non-homeologous wheat chromosomes. The only major disruption in collinearity between the two species is that the wheat chromosome 4A has an inversion compared to T. urartu chromosome 4Au. The latter has the 4/5 translocation like wheat but does not carry the 4/7 translocation observed for chromosomes 4A and 7B of wheat (Liu et al., 1992; Devos et al., 1995). This data demonstrates the close syntenic relationship between the A genome of wheat and T. urartu.
Discussion
Tritcum urartu is a potentially important source of genetic variation for a wide variety of agronomically important traits (Austin et al., 1982; Qiu et al., 2005; Martín et al., 2008; Rouse and Jin, 2011; Sheedy et al., 2012). Using the ph1 mutant approach, wheat-T. urartu recombinant lines have been generated in this study (Figure 1) suggesting that recombination can occur between hexaploid wheat and T. urartu chromosomes. Similar crossing strategies have been used previously to generate wheat-wild relative recombination (Grewal et al., 2018). Moreover, a high rate of recombination allowed generation of a genetic map for T. urartu indicating that the chromosomes of T. urartu and the A genome of bread wheat have high homology.
Cross fertility is lowest in the F1 hybrids at 21% but increases substantially in the back-cross generations reaching 100% in the BC4 population (Table 1). This was expected since the inter-specific F1 hybrids were haploid for the A, B, D, and Au genomes and the frequency of recombination between chromosomes from different genomes is likely to be very low leading to unviable gametes. However, cross fertility and seeds set per cross increase remarkably in the backcross generations and self-fertility is restored after only two backcrosses.
Traditional cytogenetic methods such as GISH are not helpful in detecting the presence of T. urartu chromatin in the wheat background in an interspecific hybrid since T. urartu is the A genome donor of common wheat (Dvorak et al., 1993). In addition to traditional FISH probes such as pSc119.2 and pAs1, probe pTm30, essentially a (GAA)n microsatellite marker, has been shown to produce major hybridization sites on the A genome chromosomes of diploid wheats including T. urartu (Adonina et al., 2015). However, these FISH probes are still not able to distinguish between all A genome chromosomes and they demonstrate polymorphisms between accessions of different diploid and hexaploid wheats (Adonina et al., 2015). Moreover the (GAA)n microsatellite marker has been shown to distinguish between A genome chromosomes of diploid wheats such as T. urartu, T. boeticum, and T. monococcum but not between the A genome chromosomes of T. urartu and hexaploid wheat (Megyeri et al., 2012; Adonina et al., 2015). This makes detection of chromosomes originating from wild diploid A genome species, such as T. urartu, difficult in the presence of the A genome chromosomes of hexaploid wheat.
In the absence of clear cytogenetic characterisation of wheat-T. urartu introgression lines, SNP markers prove vital in enabling the detection of T. urartu chromosomes in a wheat background. The Axiom® Wheat-Relative Genotyping Array has been successfully validated as a high throughput genotyping platform consisting of SNP markers that are able to detect the presence of various wheat wild relatives in a hybrid line (King et al., 2017, 2018; Grewal et al., 2018). In previous studies that have used this array, the introgressions detected by the SNP markers were also validated by GISH studies thereby indicating that the array was successful at detecting the presence of various sized segments of wild relatives in a wheat background. In this study using the same array, 368 SNPs were mapped into seven LGs that represented the genetic map of T. urartu with a total map length of 772.1 cM (Figure 2). The average chromosome length was found to be 110.3 cM, however, for chromosome 4Au it was calculated to be 31 cM (Table 2) due to the least number of recombination events in this LG as compared to the others. This was possibly due to the rearrangement of wheat chromosome 4A (Devos et al., 1995) which impacted the recombination between chromosomes 4A and 4Au. This result is supported by the comparative analysis of the markers on the genetic map of textitT. urartu and their orthologous sequences on the Tu chromosomes and the wheat A genome (Figure 5). The comparison of the chromosomes showed high levels of collinearity and synteny between the two species, including the presence of the 4A/5A translocation in T. urartu which has been previously reported (King et al., 1994), except in LG 4 where the wheat chromosome 4A showed an inversion as compared to chromosome 4Au. However, it should be noted that the SNP markers described in this paper are not able to distinguish which of the genomes of wheat the T. urartu introgressions have recombined with. The introgressions were produced using the ph1 system and therefore it is possible that recombination has taken place between the T. urartu and the B or D genomes of wheat as well as the A genome. It is possible to use multi-color GISH to distinguish the A, B and D genomes of wheat (King et al., 2017; Grewal et al., 2018) and thus, visualize an A-B or A-D recombinant. However, because of the ph1 system used in this work, it is possible that recombination could have also occurred between the three genomes of wheat. It would therefore be impossible to determine which A genome (A or Au) was involved in any recombination event with the B or D genomes of wheat. We are currently developing a set of wheat genome specific markers which will enable the identification of the wheat genome involved in the recombination once the introgression lines are homozygous and stable, i.e., these markers would be able to detect which of the wheat genome regions had been replaced by the T. urartu introgressions.
Through marker assisted selection, the T. urartu segments were tracked in the backcross populations (Figure 3) leading to identification of lines with three or fewer segments that were eventually self-fertilized. From these lines, a panel of 17 interspecific lines, having various sized introgressions that potentially span the entire genome of T. urartu, is also described in this study (Figure 4). These lines aim to provide a valuable germplasm resource for phenotyping program, with the aim of transferring a wide variety of traits from T. urartu into all regions of the wheat genome for the introduction of genetic variation.
Data Availability
The raw genotyping data supporting the conclusions of this manuscript will be made available by the authors, without undue reservation, to any qualified researcher.
Author Contributions
JK, SG, CY, SH-E, DS, SA, and IK carried out the crossing program. SH-E, DS, SA, and CY prepared the samples for genotyping. AB ran the samples on the array. SG analyzed the genotyping data and constructed the genetic map. SG and PW worked on the comparative studies. IK and JK conceived and designed the experiments. SG wrote the manuscript with assistance from JK. All authors have read and approved the final manuscript.
Funding
This work was supported by the Biotechnology and Biological Sciences Research Council (Grant No. BB/J004596/1) as part of the Wheat Improvement Strategic Programme (WISP). The funding body played no role in the design of the study and collection, analysis, and interpretation of data and in writing the manuscript.
Conflict of Interest Statement
The authors declare that the research was conducted in the absence of any commercial or financial relationships that could be construed as a potential conflict of interest.
Acknowledgments
We thank Prof. Keith Edwards and Dr. Sacha Allen at Bristol University for their technical assistance in the genotyping.
Supplementary Material
The Supplementary Material for this article can be found online at: https://www.frontiersin.org/articles/10.3389/fpls.2018.01565/full#supplementary-material
References
Adonina, I. G., Goncharov, N. P., Badaeva, E. D., Sergeeva, E. M., Petrash, N. V., and Salina, E. A. (2015). (GAA)n microsatellite as an indicator of the A genome reorganization during wheat evolution and domestication. Comp. Cytogenet. 9, 533–547. doi: 10.3897/CompCytogen.v9i4.5120
Alaux, M., Rogers, J., Letellier, T., Flores, R., Alfama, F., Pommier, C., et al. (2018). Linking the international wheat genome sequencing consortium bread wheat reference genome sequence to wheat genetic and phenomic data. Genome Biol. 19:111. doi: 10.1186/s13059-018-1491-4
Alvarez, J. B., Caballero, L., Nadal, S., Ramírez, M. C., and Martín, A. (2009). Development and gluten strength evaluation of introgression lines of triticum urartu in durum wheat. Cereal Res. Commun. 37, 243–248. doi: 10.1556/CRC.37.2009.2.11
Austin, R. B., Morgan, C. L., and Ford, M. A. (1986). Dry matter yields and photosynthetic rates of diploid and hexaploid triticum species. Ann. Bot. 57, 847–857. doi: 10.1093/oxfordjournals.aob.a087169
Austin, R. B., Morgan, C. L., Ford, M. A., and Bhagwat, S. G. (1982). Flag leaf photosynthesis of Triticum aestivum and related diploid and tetraploid species. Ann. Bot. 49, 177–189. doi: 10.1093/oxfordjournals.aob.a086238
Börner, A., Ogbonnaya, F. C., Röder, M. S., Rasheed, A., Periyannan, S., and Lagudah, E. S. (2015). “Aegilops tauschii introgressions in wheat,” in Alien Introgression in Wheat, eds M. Molnár-Láng, C. Ceoloni, and J. Doležel (Cham: Springer), 245–271.
Burridge, A. J., Winfield, M. O., Allen, A. M., Wilkinson, P. A., Barker, G. L. A., Coghill, J., et al. (2017). “High-density SNP genotyping array for hexaploid wheat and its relatives,” in Wheat Biotechnology: Methods and Protocols, eds P. L. Bhalla and M. B. Singh (New York, NY: Springer), 293–306.
Chapman, V., Miller, T. E., and Riley, R. (1976). Equivalence of the a genome of bread wheat and that of Triticum urartu. Genet. Res. 27, 69–76. doi: 10.1017/S0016672300016244
Cox, T. S., Wu, J., Wang, S., Cai, J., Zhong, Q., and Fu, B. (2017). Comparing two approaches for introgression of germplasm from Aegilops tauschii into common wheat. Crop J. 5, 355–362. doi: 10.1016/j.cj.2017.05.006
Devos, K. M., Dubcovsky, J., Dvorak, J., Chinoy, C. N., and Gale, M. D. (1995). Structural evolution of wheat chromosomes 4A, 5A, and 7B and its impact on recombination. Theor. Appl. Genet. 91, 282–288. doi: 10.1007/bf00220890
Dvořák, J. (1976). The relationship between the genome of Triticum urartu and the A and B genomes of Triticum aestivum. Can. J. Genet. Cytol. 18, 371–377. doi: 10.1139/g76-045
Dvořák, J. (1978). Effect of the removal of genes promoting homoeologous chromosome pairing on chromosome pairing in Triticum aestivum x Triticum urartu Amphiploids. Can. J. Genet. Cytol. 20, 539–544. doi: 10.1139/g78-063
Dvorak, J., Terlizzi, P., Zhang, H. B., and Resta, P. (1993). The evolution of polyploid wheats: identification of the A genome donor species. Genome 36, 21–31. doi: 10.1139/g93-004
Fricano, A., Brandolini, A., Rossini, L., Sourdille, P., Wunder, J., Effgen, S., et al. (2014). Crossability of Triticum urartu and Triticum monococcum wheats, homoeologous recombination, and description of a panel of interspecific introgression lines. G3 4, 1931–1941. doi: 10.1534/g3.114.013623
Gill, B. S., Friebe, B. R., and White, F. F. (2011). Alien introgressions represent a rich source of genes for crop improvement. Proc. Natl. Acad. Sci. U.S.A. 108, 7657–7658. doi: 10.1073/pnas.1104845108
Grewal, S., Yang, C., Edwards, S. H., Scholefield, D., Ashling, S., Burridge, A. J., et al. (2018). Characterisation of Thinopyrum bessarabicum chromosomes through genome-wide introgressions into wheat. Theor. Appl. Genet. 131, 389–406. doi: 10.1007/s00122-017-3009-y
International Wheat Genome Sequencing Consortium [IWGSC], Appels, R., Eversole, K., Feuillet, C., Keller, B., Rogers, J., et al. (2018). Shifting the limits in wheat research and breeding using a fully annotated reference genome. Science 361:eaar7191. doi: 10.1126/science.aar7191
Johnson, B. L., and Dhaliwal, H. S. (1976). Reproductive Isolation of Triticum boeoticum and Triticum urartu and the origin of the tetraploid wheats. Am. J. Bot. 63, 1088–1094. doi: 10.2307/2441653
King, I. P., Purdie, K. A., Liu, C. J., Reader, S. M., Pittaway, T. S., Orford, S. E., et al. (1994). Detection of interchromosomal translocations within the Triticeae by RFLP analysis. Genome 37, 882–887. doi: 10.1139/g94-125
King, J., Grewal, S., Yang, C. Y., Hubbart, S., Scholefield, D., Ashling, S., et al. (2017). A step change in the transfer of interspecific variation into wheat from Amblyopyrum muticum. Plant Biotechnol. J. 15, 217–226. doi: 10.1111/pbi.12606
King, J., Grewal, S., Yang, C. Y., Hubbart Edwards, S., Scholefield, D., Ashling, S., et al. (2018). Introgression of Aegilops speltoides segments in Triticum aestivum and the effect of the gametocidal genes. Ann. Bot. 121, 229–240. doi: 10.1093/aob/mcx149
Krzywinski, M. I., Schein, J. E., Birol, I., Connors, J., Gascoyne, R., Horsman, D., et al. (2009). Circos: an information aesthetic for comparative genomics. Genome Res. 19, 1639–1645. doi: 10.1101/gr.092759.109
Ling, H.-Q., Ma, B., Shi, X., Liu, H., Dong, L., Sun, H., et al. (2018). Genome sequence of the progenitor of wheat a subgenome Triticum urartu. Nature 557, 424–428. doi: 10.1038/s41586-018-0108-0
Liu, C. J., Atkinson, M. D., Chinoy, C. N., Devos, K. M., and Gale, M. D. (1992). Nonhomoeologous translocations between group 4, 5 and 7 chromosomes within wheat and rye. Theor. Appl. Genet. 83, 305–312. doi: 10.1007/bf00224276
Martín, M. A., Martín, L. M., and Alvarez, J. B. (2008). Polymorphisms at the Gli-A u 1 and Gli-A u 2 loci in wild diploid wheat (Triticum urartu). Euphytica 163, 303–307. doi: 10.1007/s10681-008-9656-y
Megyeri, M., Farkas, A., Varga, M., Kovács, G., Molnár-Láng, M., and Molnár, I. (2012). Karyotypic analysis of Triticum monococcum using standard repetitive DNA probes and simple sequence repeats. Acta Agronomica Hungarica 60, 87–95. doi: 10.1556/AAgr.60.2012.2.1
Milne, I., Shaw, P., Stephen, G., Bayer, M., Cardle, L., Thomas, W. T. B., et al. (2010). Flapjack – graphical genotype visualization. Bioinformatics 26, 3133–3134. doi: 10.1093/bioinformatics/btq580
Morgan, C. L., and Austin, R. B. (1986). Analysis of fluorescence transients of DCMU-treated leaves of Triticum species to provide estimates of the densities of photosystem II reaction centres. Photosynth. Res. 7, 203–219. doi: 10.1007/bf00014675
Qiu, Y. C., Zhou, R. H., Kong, X. Y., Zhang, S. S., and Jia, J. Z. (2005). Microsatellite mapping of a Triticum urartu Tum. derived powdery mildew resistance gene transferred to common wheat (Triticum aestivum L.). Theor. Appl. Genet. 111, 1524–1531. doi: 10.1007/s00122-005-0081-5
Rodríguez-Suárez, C., Ramírez, M. C., Martín, A., and Atienza, S. G. (2011). Applicability of chromosome-specific SSR wheat markers for the introgression of Triticum urartu in durum wheat breeding programmes. Plant Genet. Resour. 9, 439–444. doi: 10.1017/S147926211100061X
Rouse, M. N., and Jin, Y. (2011). Stem rust resistance in a-genome diploid relatives of wheat. Plant Dis. 95, 941–944. doi: 10.1094/PDIS-04-10-0260
Sheedy, J. G., Thompson, J. P., and Kelly, A. (2012). Diploid and tetraploid progenitors of wheat are valuable sources of resistance to the root lesion nematode Pratylenchus thornei. Euphytica 186, 377–391. doi: 10.1007/s10681-011-0617-5
Tiwari, V. K., Wang, S., Danilova, T., Koo, D. H., Vrana, J., Kubalakova, M., et al. (2015). Exploring the tertiary gene pool of bread wheat: sequence assembly and analysis of chromosome 5M(g) of Aegilops geniculata. Plant J. 84, 733–746. doi: 10.1111/tpj.13036
Tiwari, V. K., Wang, S., Sehgal, S., Vrána, J., Friebe, B., Kubaláková, M., et al. (2014). SNP discovery for mapping alien introgressions in wheat. BMC Genomics 15:273. doi: 10.1186/1471-2164-15-273
Valkoun, J. J. (2001). Wheat pre-breeding using wild progenitors. Euphytica 119, 17–23. doi: 10.1023/A:1017562909881
van Berloo, R. (2008). GGT 2.0: versatile software for visualization and analysis of genetic data. J. Hered. 99, 232–236. doi: 10.1093/jhered/esm109
Van Ooijen, J. W. (2011). Multipoint maximum likelihood mapping in a full-sib family of an outbreeding species. Genet. Res. 93, 343–349. doi: 10.1017/S0016672311000279
Voorrips, R. E. (2002). MapChart: software for the graphical presentation of linkage maps and QTLs. J. Hered. 93, 77–78. doi: 10.1093/jhered/93.1.77
Winfield, M. O., Allen, A. M., Burridge, A. J., Barker, G. L. A., Benbow, H. R., Wilkinson, P. A., et al. (2016). High-density SNP genotyping array for hexaploid wheat and its secondary and tertiary gene pool. Plant Biotechnol. J. 14, 1195–1206. doi: 10.1111/pbi.12485
Winfield, M. O., Wilkinson, P. A., Allen, A. M., Barker, G. L., Coghill, J. A., Burridge, A., et al. (2012). Targeted re-sequencing of the allohexaploid wheat exome. Plant Biotechnol. J. 10, 733–742. doi: 10.1111/j.1467-7652.2012.00713.x
Keywords: wheat, T. urartu, introgression, interspecific hybrid, SNP, genetic mapping
Citation: Grewal S, Hubbart-Edwards S, Yang C, Scholefield D, Ashling S, Burridge A, Wilkinson PA, King IP and King J (2018) Detection of T. urartu Introgressions in Wheat and Development of a Panel of Interspecific Introgression Lines. Front. Plant Sci. 9:1565. doi: 10.3389/fpls.2018.01565
Received: 17 August 2018; Accepted: 08 October 2018;
Published: 29 October 2018.
Edited by:
Soren K. Rasmussen, University of Copenhagen, DenmarkReviewed by:
Luke Douglas Ramsay, The James Hutton Institute, United KingdomIstván Molnár, Centre for Agricultural Research (MTA), Hungary
Copyright © 2018 Grewal, Hubbart-Edwards, Yang, Scholefield, Ashling, Burridge, Wilkinson, King and King. This is an open-access article distributed under the terms of the Creative Commons Attribution License (CC BY). The use, distribution or reproduction in other forums is permitted, provided the original author(s) and the copyright owner(s) are credited and that the original publication in this journal is cited, in accordance with accepted academic practice. No use, distribution or reproduction is permitted which does not comply with these terms.
*Correspondence: Surbhi Grewal, c3VyYmhpLmdyZXdhbEBub3R0aW5naGFtLmFjLnVr