 Guillaume Charrier
 André Lacointe
 Thierry Améglio
- INRA, PIAF, Université Clermont Auvergne, Clermont-Ferrand, France
The leafless period is often considered as inactive, although trees have to actively modulate their metabolism through the cold acclimation/deacclimation processes, to cope with frost exposure during winter and to restore growth ability in spring. Carbon metabolism is a key component of these processes through the osmotic control of extracellular ice formation and the trophic control of bud growth. The influence of temperature on the inter-conversion between starch and soluble carbohydrate has been evidenced for years, but we are currently missing an operational tool to predict starch vs. soluble carbohydrate contents during this period, which should allow to better predict frost hardiness. For this purpose, we exposed 1-year-old branches of Juglans regia to constant temperature for one to 3 weeks and measured the changes in carbohydrate composition at three periods (autumn, winter, and spring). As expected, the temperature significantly affected the changes in carbohydrate composition, but the water content and the sampling period were also relevant. Higher starch hydrolysis was observed at low temperature (<5°C) for all sampling periods. Starch hydrolysis was also observed at warm temperature, but in autumn only. These data were used to compare three modeling approaches simulating the changes in carbohydrate composition through enzymatic analogy. The most empirical and the most mechanistic approach did not succeed to simulate external observations (Root Mean Standard Error of Prediction (RMSEP) > 30 mg.g DM−1, Efficiency (Eff) <0), whereas the intermediate model was more efficient (RMSEP = 15.19 mg.g DM−1, Eff = 0.205 and 16.61 mg.g DM−1, Eff = 0.366, for GFS (Glucose + Fructose + Sucrose) and starch, respectively). The accuracy of the model was further improved when using field data for calibration (RMSEP = 5.86 mg.g DM−1, Eff = 0.962; RMSEP = 10.56 mg.g DM−1, Eff = 0.752, for GFS and starch, respectively). This study provided an operative tool to simulate carbohydrate dynamics over leafless period that could predict frost hardiness with approx. 3.4°C accuracy with temperature, water content and initial starch and soluble carbohydrate measurements. It should now be tested under various meteorological conditions and biological systems.
Introduction
In frost-exposed habitats (i.e., from temperate to boreal areas), perennial plants have to cope with freezing stress every winter. Successful transitions between growing seasons are therefore achieved through timely cold acclimation and subsequent deacclimation (Kalberer et al., 2006; Arora and Taulavuori, 2016). In parallel, bud growth is limited, first (in fall and winter) by endodormancy, then (in late winter and early spring) by ecodormancy, i.e., respective inhibition by intrinsic and environmental factors (mainly temperature; Lang et al., 1987). Trees are indeed cold acclimating during the endodormancy stage, then cold de-acclimating during the ecodormancy stage (Charrier et al., 2011). Despite the apparent ‘inactivity’ of plants and during a period where energy input is very limited or null, especially in deciduous species, cold acclimation is a complex process, involving numerous physiological mechanisms, prior to frost exposure (Pearce et al., 1996; Pearce, 2004; Charrier et al., 2015a).
Solute content (i.e., carbohydrates, organic or amino acids) increases and water content decreases in relation to frost hardiness in many perennial species (Reuther, 1971; Levitt, 1980; Guy, 1990; Gusta et al., 2004; Morin et al., 2007; Charrier et al., 2013a, 2015b). Different compounds, with contrasted efficiencies, have been observed across species, in relation to specific metabolism (Sakai, 1960, 1962) e.g., polyols (sorbitol or mannitol) in Rosaceae (e.g., Sorbus aucuparia; Sakai, 1966b; Raese et al., 1977; Ichiki and Yamaya, 1982, glucose, fructose and sucrose (GFS) in Juglans sp (Améglio et al., 2004; Poirier et al., 2010). Nitrogen metabolism may be involved as well resulting in amino acids (Smith, 1968) and proline accumulation (Withers and King, 1979). The intracellular concentration lowers the freezing temperature of the cytoplasm (ca. 1.86 K per mol solutes per kg water; (Cavender-Bares, 2005), which in turn favors ice nucleation to occur in the less concentrated apoplastic compartment. The ratio between GFS and water content thus accurately predict frost hardiness across seasons and organs in walnut trees, according to the osmo-hydric model (Charrier et al., 2013b). The extremely low water potential of ice (−1.16 MPa.K−1 below freezing temperature) pulls water molecules out through the membrane, further increasing solute concentration (Charra-Vaskou et al., 2015; Charrier et al., 2015b; Arora, 2018). Furthermore, solutes maintain a solvation layer thus protecting the surface of membranes and the macromolecules (Sakai, 1962; Heber and Santarius, 1973; Steponkus et al., 1977; Yoon et al., 1998, Kasuga et al., 2006, 2007).
Carbon metabolism exhibits significant changes throughout the leafless period (Sauter, 1988; Witt and Sauter, 1994; Lacointe et al., 1995; Wong et al., 2003; Poirier et al., 2010). Starch is almost totally hydrolyzed into osmotically active compounds from the end of the growing season through the mid-winter and re-synthesized during late winter and early spring (Siminovitch et al., 1953; Sakai, 1966a; Harms and Sauter, 1992; Sauter and Wellenkamp, 1998; Wong et al., 2003). Those carbohydrate dynamic changes can be related to changes in enzymatic activities such as α-amylase, β-amylase, sucrose synthase, sucrose phosphate synthase (Witt and Sauter, 1994; Schrader and Sauter, 2002). For instance, α-amylase and starch phosphorylase are activated by cold temperatures (Elle and Sauter, 2000). Furthermore, α-amylase is more tightly bound to starch grains at low temperature, optimizing starch hydrolysis (Witt and Sauter, 1995; Witt et al., 1995; Sauter et al., 1998). The expression in β-amylase is activated by both cold and warm temperatures (Kaplan and Guy, 2004). Starch conversion into soluble carbohydrates is consequently optimal at low temperatures (<10°C in poplar; Sauter, 1988). However, starch is also hydrolyzed at warmer temperature (i.e., >15°C) in Salix sp. (Sakai, 1966c) or Juglans sp. (Améglio et al., 2001; Charrier and Améglio, 2011). At the end of the winter, cells contain a low amount of starch but very high amount of soluble sugars.
Frost deacclimation is observed when temperature increases in late winter—early spring. According to Kalberer et al. (2006), this process is two-fold, including active and passive processes. Active deacclimation is induced by warm temperatures and involves structural and functional changes in relation to starch re-synthesis (Charrier et al., 2013a,b) and resumption of root water uptake (Pogosyan and Sakai, 1969). Passive deacclimation is a response to moderate warming (lower than 5K increase) via increased respiration, consuming cryoprotective solutes (Ögren, 1996). However, deacclimated plants are able to re-harden rapidly compared to the initial rate of hardening (2 days vs. 15 days, Chen and Li, 1980a,b). All enzymes involved in the starch hydrolytic pathway sharply decrease before or just after bud break resulting in starch re-synthesis (Witt and Sauter, 1994; Schrader and Sauter, 2002; Wong et al., 2003). After budbreak, soluble carbon compounds are transported within the xylem to carbon sinks (i.e., growing buds; Sauter, 1980, 1981, 1982; Sauter and Ambrosius, 1986; Améglio et al., 2000; Alves et al., 2001; Bonhomme et al., 2009). At this period, soluble carbohydrate supply the growth of buds and developing organs (i.e., leaves, roots and shoots; Marquat et al., 1999; Maurel et al., 2004). About one third of the reserves is used for the construction of the new leaves (Larcher, 1995). An accurately simulation of the carbohydrate metabolism is therefore crucial to assess frost hardiness along the frost-exposed period, and also to predict growth patterns after dormancy release.
Cold acclimation is controlled by environmental factors, mainly temperature and photoperiod (Aronsson, 1975; Christersson, 1978; Arora and Rowland, 2011; Pagter and Williams, 2011). Numerous models of cold acclimation, based on empirical relations between environmental factors and current frost hardiness level, have been developed so far (Fuchigami et al., 1982; Greer and Warrington, 1982; Leinonen, 1996; Jönsson et al., 2004; Ebel et al., 2005; Ferguson et al., 2011). However, although relevant in the current context, this cannot explain how a cold deprived tree would be able to harden (Schwarz, 1970; Alves et al., 2001; Charrier and Améglio, 2011). These observations suggest that starch to soluble carbohydrate conversion occurring at warm temperature (i.e., >15°C; Sakai, 1966c; Améglio et al., 2001) would induce cold acclimation (Charrier and Améglio, 2011). Despite the strong mechanistic link between osmotic compounds and frost hardiness, and the relation between environmental factors and synthesis of osmotic compounds, no process-based model has been developed so far that could predict frost hardiness (i.e., the highest temperature that would induce frost damages) in relation to carbohydrate metabolism and environmental factors, mainly the temperature. Previous studies reported an integrated response of frost hardiness to temperature averaged over several days and weeks (16 days in Poirier et al., 2010).
The present study aimed at constructing an operative model simulating the hydrolysis of starch into soluble osmotica, which would subsequently induce higher frost hardiness. We assumed that the dynamics of starch and soluble carbohydrates can be described by the catalytic activities under the control of phenological and thermal parameters. We examined the correlations between frost hardiness, carbohydrates, or water contents with temperature averaged on various periods (1–30 days) and selected one and three weeks delay to consider the integrated response. To feed the model with additional data, we thus stored walnut branches at constant temperature for 1–3 weeks at different periods, autumn (beginning of endodormancy stage), winter (transition between endo- and ecodormancy) and spring (middle of ecodormancy stage) and measured soluble carbohydrates and starch after storage. In comparison to initial conditions, we were able to calibrate a simple model of carbon metabolism that was confronted to field observations, which is an essential step toward process-based prediction of frost hardiness and trophic control of bud growth over the dormant period.
Materials and Methods
Plant Material
Mature European walnut trees (15–20 year-old Juglans. regia L. cv. Franquette) were grown in two different orchards in central France (low: 45° 46′ N 03°08′ E, 340 m a.s.l., and high elevation: 45°43′N 03° 01′ E 880 m a.s.l.). During five consecutive winters (2008–2012), one branch per tree (longer than 0.5 m) was harvested every month on the same five trees (natural conditions dataset NC, hereafter). During winter 2008–2009, 14 additional branches per tree were harvested for controlled-temperature treatment in autumn (22nd October 2008; beginning of endodormancy stage), winter (19th January 2009; transition between endo- and ecodormancy), and spring (17th March 2009; middle of ecodormancy stage) on five other trees (Year 1 from controlled conditions dataset CC, hereafter). During winter 2009–2010, 14 additional branches per tree were harvested for controlled-temperature treatment in autumn (4th November 2009), and 6 additional in winter (26th January 2010), and spring (30th March 2010) on five other trees (Year 2 from controlled conditions dataset, hereafter). To deplete the amount of non-structural carbohydrates (NSC), we almost completely defoliated three trees from the same variety (removing ca. 3,500 leaves and leaving only two terminal leaves for sap flow to be maintained) during the growing season (from 25th July 2009 until leaf fall).
Controlled-Temperature Treatment
After sampling, one branch per tree was immediately used for carbohydrate and water content measurement (t0). To take into account any memory effect (i.e., the effect of the previous climatic history of the tree on physiological variables) and select an optimal treatment period, thermal variables (i.e., minimum, maximum, and average temperature) were averaged over 0 (i.e., current) to 30 days with 1 day increment (Table S1). Given the correlations between physiological and thermal variables, samples were stored for one to three weeks (see results). The basal cut ends of other branches from the CC dataset were sealed with wax and stored at constant temperature, humidity and light for seven (t7) and 19–21 days. During year 1, branches were stored at different temperatures i.e., −3, +1, +5, +10, +15, +20, and +25°C with constant photoperiod (i.e., Autumn: 10 h light/14 h night; Winter: 9 h light/15 h night and Spring: 12 h light/12 h night; see Table S2 for a detailed description of the different treatments). The second year, the complete set of temperature was repeated during autumn, but only three temperatures were tested during winter and spring: −3, +15, and +25°C.
Frost Hardiness Test
For the NC dataset, sampled branches from each individual were cut into six 5-cm long segments and exposed to four different freezing temperatures among this set of temperatures: −5, −10, −15, −20, −30°C, −40°C, then thawed to assess frost hardiness (FH) using the electrolyte leakage method. Depending on the season, either the highest or the lowest temperatures were not used. Two supplementary subsamples were exposed to control temperature (+5°C) and maximal freezing temperature (ca. −75°C). Freezing and thawing rates were set to 5 K.h−1. Supplementary details are provided in Charrier and Améglio (2011).
Water Content
Small pieces between segments used for FH tests were sampled along the branch. Fresh matter weights (FM) were measured, then the samples were frozen with liquid nitrogen. After freeze-drying, dry matter weights (DM) were measured and water content (WC) was calculated as:
Carbohydrate Extraction and Quantification
Lyophilized samples (m > 2 g) were ground to a powder that was used (50 mg) to extract and measure the soluble carbohydrate content using HPLC method. Starch content was measured using enzymatic method. Details are provided in Charrier and Améglio (2011).
Carbohydrate Metabolism Modeling
Description of the Model
Change in carbohydrate composition was simulated as the result of different chemical reactions through the winter dynamics of related enzymatic activities impacting three functional components: reserve (i.e., starch), soluble carbohydrates (i.e., GFS representing approx. 90% of soluble carbohydrates in Juglans sp), and respiration (temperature-dependent but unregulated CO2 efflux). Chemical reactions were limited by enzymatic activities (i.e., acting as limiting factors). Slower molecular movements inducing fewer collisions between substrates and enzymes (lower temperatures) and higher protein denaturation (higher temperatures) alter the enzymatic reaction rates. Enzymatic activities were therefore optimal at a given temperature (μi). Although the slope at low and high temperatures may be different, we chose a symmetric Gaussian function to limit the number of parameters of the model. As observed in the literature (Sakai, 1966c), starch hydrolysis was considered under the dependence of two enzymatic activities with contrasted optimal temperatures i.e., cold (k1c) and mild temperatures (k1m), whereas starch re-synthesis (k2) and respiration (R) were assumed depending each on a single reaction:
The enzymatic activity was considered under the dependency of the phenological stage PS divided into two different phases: endodormancy and ecodormancy, which occur sequentially (Hänninen and Kramer, 2007). Endodormancy is released by chilling temperatures (Lang et al., 1987). The cumulative action of chilling temperatures is quantified as “Chilling Units,” CU(t), according to the inverse of the Richardson function as defined in (Chuine et al., 2016) (Equation 3) with a zero starting value.
with CU(t), the cumulated chilling units at day t, Thigh the temperature threshold above which the daily mean temperature θ(t) has no chilling effect, and Tlow the temperature threshold below which the chilling effect is constant (linearly decreasing over the [Tlow; Thigh] range).
When CU(t) reaches the threshold value CUcrit (see Table 1 for parameter values), endodormancy is released and ecodormancy stage initiates. The cumulative effect of mild temperatures on within-bud growth, i.e., ecodormancy status, was quantified as “Forcing Units” FU(t), modeled as a sigmoid function (Equation 4, Caffarra et al., 2011).
with FU(t), the cumulated forcing units at day t, slp (−0.244°C−1), the slope of the function at the temperature inducing half of the maximal apparent growth rate T50 (13.46°C).
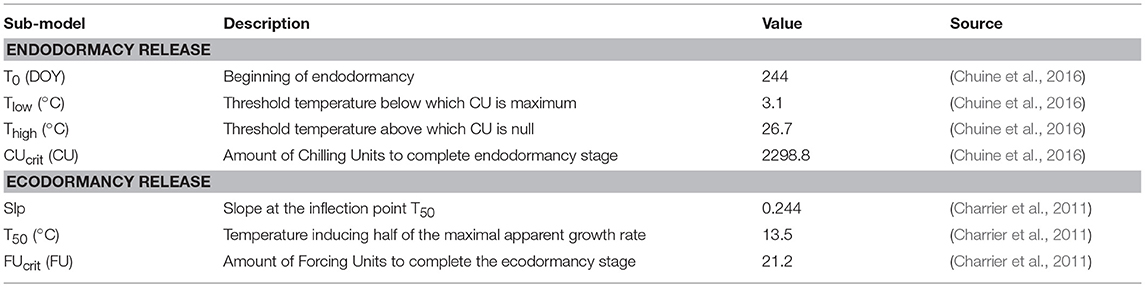
Table 1. Parameters for the phenological model.
When FU(t) reaches the value FUcrit, endormancy is over with bud breaking. This lead to the definition of a phenological stage (PS) as the ratio between thermal time (i.e., Chilling CU and Forcing Units FU for endo- and ecodormancy, respectively) and thermal requirements (CUcrit and FUcrit for endo- and ecodormancy, respectively). The parameters used to describe the influence of environmental parameters on dormancy status (endo- and ecodormancy release) and to compute CU, FU and PS were fixed according to the literature (Charrier et al., 2011, 2018; Chuine et al., 2016). The model assumes a sequential transition between endo- and ecodormancy and PS is an index ranging from 0 (beginning of endodormancy) to 2 (budburst), with 1 being the transition between endo- and ecodormancy:
Considering the effect of annual cycle and temperature on enzymatic activities, the catalytic rates (ki; i = 1c, 1m or 2) depended on temperature (θ, in °C) and phenological stage (PS) according to a combination of linear and Gaussian functions:
where ai and bi are coefficients that modulate enzymatic activity with phenological stage, θ is the mean temperature of the day, μi is the optimal temperature for maximal activity, and σi is the standard deviation.
Significant changes are expected to occur in the catalytic rate during the transition from endodormancy to ecodormancy, ai and bi are therefore assigned different values for PS lower vs. higher than 1 (ai endo, ai eco, bi endo, and bi eco). However, to prevent sharp changes in the carbon metabolism at the transition between endo- and ecodormancy, the catalytic rate at this time, kitrans, was defined as follows:
with ai endo = (ki trans + di endo)/2, bi endo = (ki trans - di endo)/2, ai eco = (ki trans + di eco)/2, bi eco = (ki trans + di eco)/2, to reduce the number of parameters to fit (di being the difference between ai and bi).
The respiration rate was modulated by the current water content (assuming linear variation between two successive sampling dates) and temperature but not substrate concentration (k3; order 0).
where a3 and b3 are coefficients that modulate respiration in relation with water content, RMax is the maximum respiration rate at Tref, θ is the mean temperature of the day, Q10 is the temperature coefficient and Tref is a reference temperature (i.e., 15°C).
GFS contents were calculated at a daily scale, with distinct optimal temperature (μi) for the different catalytic rates using air temperature and water content at the daily scale and initial GFS and Starch contents as inputs. The different formalisms, along the continuum from empirical to mechanistic, were compared.
The direct effect of the temperature on catalytic activity was simulated by the simple model:
As the observed variability in carbohydrate composition was reduced after normalization of the daily change in GFS and starch by the initial (i.e., at t0) amount of starch and GFS, respectively (Figures 3A–F; Figures S1–S3; Tables S4–S8), we developed the intermediate model based on the mechanistic assumption that the change in the amount of the product of an enzymatic reaction can be limited by the amount of substrate:
where k1c + k1m and k2 correspond to the starch hydrolyzing activity and re-synthesis, respectively.
According to Michaelis-Menten kinetics, stating that the product formation ultimately depended on the catalytic activity (ki), the enzyme ([E]) and substrate concentrations ([S]) and the Michaelis constant (KM), with vMax = ki·[E], we developed the complete model:
where and correspond to the starch hydrolyzing activity and re-synthesis, respectively.
For all models, starch content can be derived from the following equation:
Finally, the ability of the model to predict frost hardiness (FH) was tested via the unified osmo-hydric model developed by Charrier et al. (2013a). The depression of the freezing point in cells favors the liquid water to crystallize in the apoplastic compartment, subsequently leading to cellular dehydration and further concentration. This model, which was developed across various organs (from fine roots to buds) and tissues (bark, and xylem) of walnut trees J. regia describes the depression of the freezing point and related FH through the nonlinear interaction between GFS (predicted by the carbon metabolism model) and WC (fixed according to observations).
Optimization of the Parameters
Water content was fixed according to the observations with linear interpolation between two observations. The sets of parameters (n = 19, 19, and 22, for simple, intermediate and complex, respectively; Table S3) were calibrated (i) using the data from the CC dataset and compared to NC dataset as a validation, or (ii) splitting the NC dataset into two separate datasets for calibration (NC1) and validation (NC2). The optimization was performed by minimizing the residual sum of square between simulated values and measured data of starch and GFS using the Nelder Mead algorithm (package nloptr in R). The algorithm was run up to 200,000 times until convergence (relative tolerance = 10−8) starting from 100 sets of initial values distributed within a realistic range of the values for each parameter, according to an optimized Latin Hypercube Sample to avoid ending in a local minimum (package lhs).
Statistical Analysis
The correlations between physiological (frost hardiness, starch, GFS and water contents) and meteorological variables from the closest weather stations (ca. 2 km away from the orchards) were measured using Pearson's product-moment coefficient (ρ).
The performance of each model was estimated via different indexes:
where SStot and SSres are the total and residual sums of square, respectively.
where n is the number of observations.
Results
Correlation Between Physiological and Thermal Variables
The correlation between physiological (GFS, starch, frost hardiness and water content) and thermal (minimum, average and maximum temperature averaged over the last 1–30 days before harvest) variables were all highly significant (P < 0.0005; Table S1). However, the correlation coefficient (ρ) was slightly higher for maximum than mean or minimum temperature, except for water content, for which minimum temperature was better correlated. Over the last 7 days before sampling (from day 0 to 7), ρ increased with the number of days integrated in the calculation and became relatively stable over a longer period. The highest ρ was observed for frost hardiness vs. average maximal temperature averaged over 22 days (ρ = 0.896; P < 0.0001; Figure 1A). A similar period (23 day-long) was observed for highest ρ between water content and minimal temperature (ρ = 0.674; P < 0.0001; Figure 1B). Soluble carbohydrates and starch contents exhibited stronger correlations with maximal temperature calculated over ca. two weeks: GFS over 14 days (ρ = −0.800; P < 0.0001; Figure 1C) and starch over 15 days (ρ = 0.681; P < 0.0001; Figure 1D). However, when removing the observations from the leafy period (i.e., before leaf fall, or after budburst, as presented in open symbols in Figure 1D), much stronger correlation was observed between starch content and temperature averaged over 30 day-long periods (ρ = 0.884; P < 0.0001).
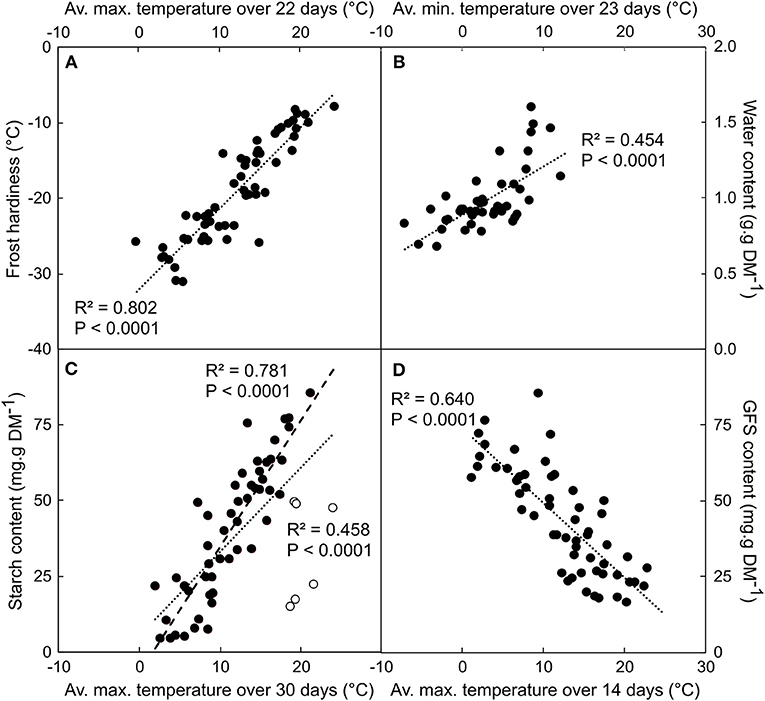
Figure 1. Correlation between frost hardiness (A), water (B), starch (C), and GFS (D) contents depending on average maximum (or minimal for water content) temperature calculated over 22 (FH), 14 (GFS), 30 (Starch), and 23 (WC) days period. Data were collected during six different winter dynamics from 2007 until 2012. Each point represents the mean of n = 5 replicates. Open circles in (C) represent data collected during the leafy period that were included or not in the linear regression (dotted and dashed line, respectively).
Controlled-Temperature Treatment and Changes in Non-Structural Carbohydrates
According to the correlations described above, branches that were sampled at different seasons were exposed to constant temperature for one to three weeks. The total amount of NSC within a branch was significantly affected by temperature, but differences related to the period of sampling also appeared. Daily losses in total non-structural carbohydrates (δNSC per day) were higher in autumn (−2.38 ± 0.21 mg.g DM−1.day−1; mean ± SE, data not shown) than in spring (−1.08 ± 0.20 mg.g DM−1.day−1, data not shown) and winter (−0.28 ± 0.12 mg.g DM−1.day−1, data not shown). Warmer temperature increased the loss in total non-structural carbohydrate content during autumn (P = 0.031), but not in spring (P = 0.280) nor winter (P = 0.486). The logarithmic variation in NSC per day [log(δNSC.day−1)] was significantly correlated with temperature (P = 0.0233) and with the interaction between temperature and initial water content of the branch (P = 0.0135; Table S4). Accordingly, the variation in NSC with respect to temperature [i.e., expressed as the slope of the regression between the logarithmic variation in NSC per day and the temperature: log(δNSC.day−1.K−1)] was significantly correlated with the initial water content of the branch (P = 0.005; Figure 2). Higher respiratory losses with warmer temperature were indeed recorded when water content was higher than one.
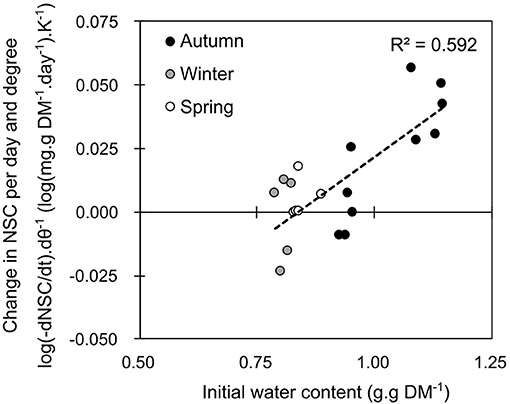
Figure 2. Average daily loss in total non-structural carbohydrates (log(dNSC) per Kelvin) over 7 days of constant temperature treatment depending on initial water content. Each point represents the estimate of the slope from seven branches of an individual tree exposed to seven different temperature from −3 to +25°C.
Qualitative composition of NSCs varied in relation to temperature, season, year and treatment (Tables S5–S7). Based on the mechanistic assumption that the change in the amount of the product of an enzymatic reaction can be limited by the amount of substrate, we normalized the daily change in GFS and starch by the initial amount of starch and GFS, respectively. For illustrative purpose, we fitted the variation in GFS normalized by starch content as the convolution of three different Gaussian functions, two positive representing the cold and warm active hydrolysis and one negative representing the starch re-synthesis (Figure 4). In autumn, GFS increased and starch decreased for all temperatures with two peak values at 0 and +15°C, whereas lower changes were observed at ca. +10°C (Figures 3A,B). During winter, GFS increase was observed at low temperature (<0°C), whereas a decrease in GFS and increase in starch was observed at warmer temperature (Figures 3C,D). During spring, GFS only increased for temperature lower than 1°C, whereas starch was relatively stable (Figures 3E,F). Finally, low temperature (< 0°C) induced an increase in GFS content (i.e., promoting starch hydrolysis into GFS) for all the different periods (P = 0.2646; Figure 4). At warm temperature (ca. 17.5°C), slightly higher GFS content was observed than at colder temperature (Figures 4A,B). GFS decrease, and presumably starch re-synthesis, was observed during winter and spring at mild temperature (> 8°C). Despite very similar optimal temperature for the different catalytic activity (cold hydrolysis: −0.27 < μ1c < 0°C; mild hydrolysis: 15.12 < μ1m < 19.33°C and starch re-synthesis: 12.00 < μ1c < 14.49°C; Figure 4), the catalytic rate varied along the leafless period.
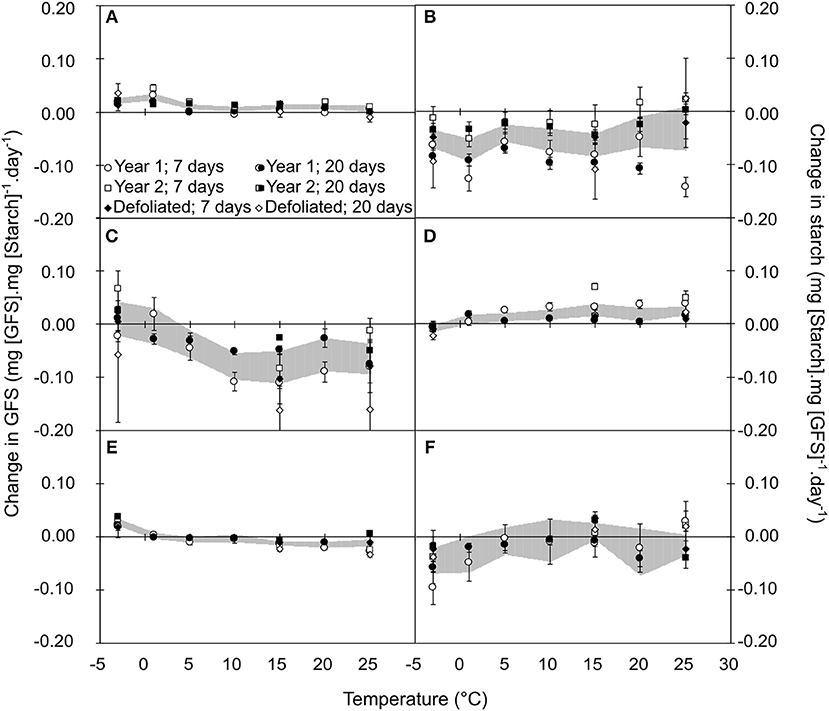
Figure 3. Relative variation in GFS (A,C,E) and Starch (B,D,F) normalized by Starch and GFS, respectively, after 7 (open symbols) and 20 days (closed symbols) of constant temperature treatment during autumn (A,B), winter (C,D), and spring (E,F). Each point represents the mean and standard error of n = 5 replicates (year 1 and 2) or n = 3 replicates (defoliated trees). Shaded areas represent the confidence interval at 95% for the bulk of six cases, to indicate the general trend.
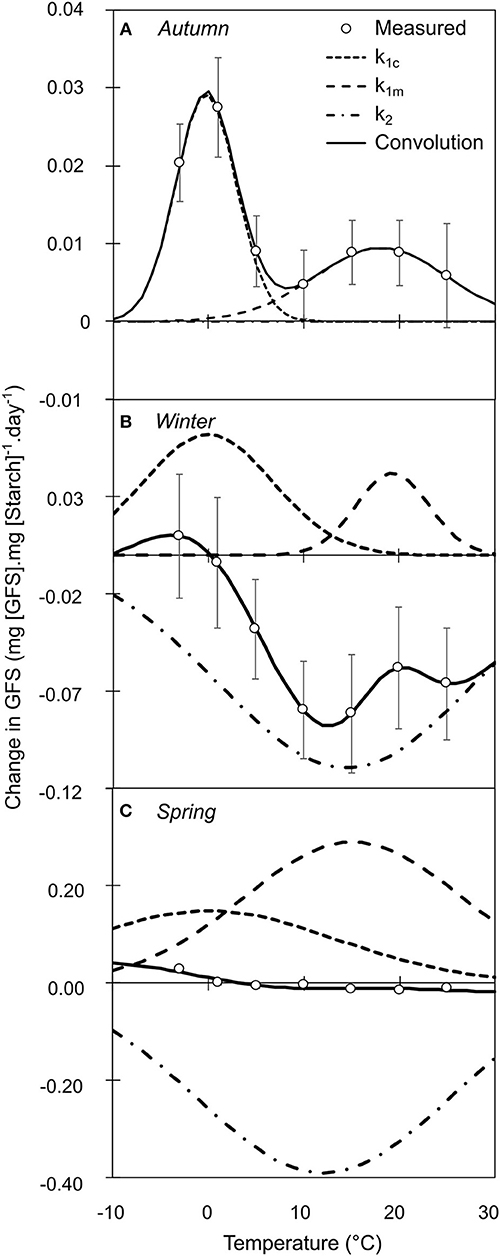
Figure 4. Relative variation in GFS normalized by initial Starch content after constant temperature treatment during autumn (A), winter (B), and spring (C). Each point represents the mean and standard error of n = 26 replicates, across the 2 years of experiment. The black line represents the convolution of three distinct sigmoid functions (k1c: short dash; k1w: long dash and k2: dash-and-dot). The elementary sigmoid functions were relatively constant for optimal temperature, although their maximal value varied over winter.
The different enzymatic reactions driving carbohydrate metabolism under the dependence of temperature, phenological stage and water content were modeled in accordance with these observation, including the allowed range for the different parameters (μi and σi; Figures 2 –4; Table S3). The different models predicted the changes in GFS, with fairly good accuracy (RMSE = 11.12–11.78 g.g DM−1 and Eff = 0.355–0.426 for the different models; Table 2). The changes in starch content were more accurately predicted by the intermediate model (RMSE = 15.57 g.g DM−1; Eff = 0.530) than by the others (RMSE = 18.47 and 18.44, Eff = 0.340 and 0.341 for simple and complete version, respectively). For the intermediate model, the predicted values from NC dataset (i.e., field data) were relatively accurate for GFS (RMSEP = 15.19 mg.g DM−1 and Eff = 0.205) and for starch (16.61 mg.g DM−1 and Eff = 0.366; Figure 5). The two other models did not predict realistic values, with negative efficiencies and low accuracy (RMSEP > 30 mg.g DM−1 for GFS and Starch).
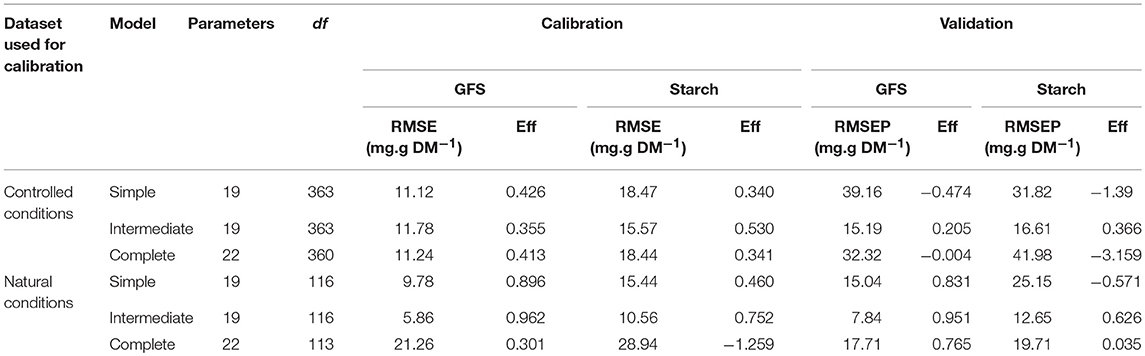
Table 2. Comparison between different models of carbohydrate metabolism depending on the architecture of the model (simple, intermediate, complete) and on the dataset used for calibration (CC and NC1 datasets).
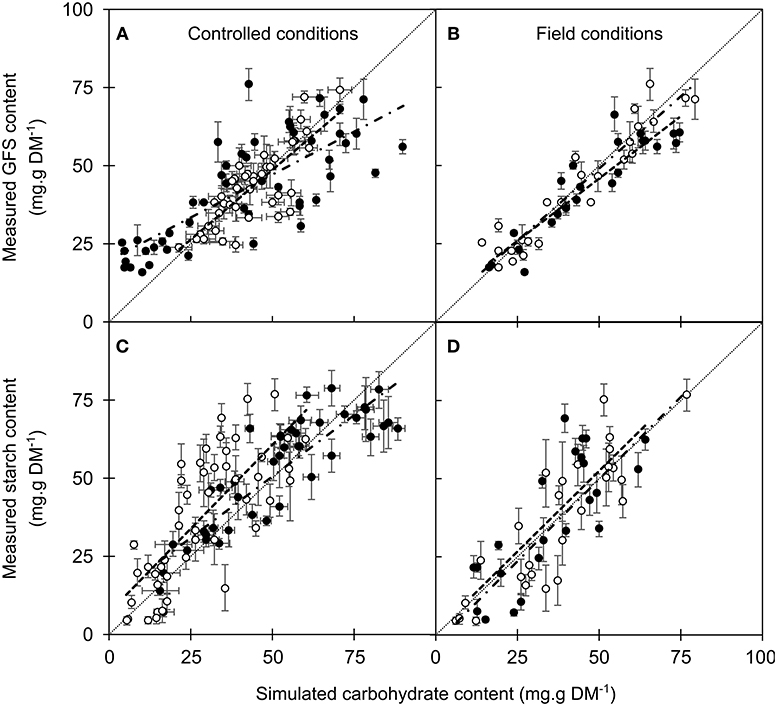
Figure 5. Measured vs. simulated values of soluble carbohydrates (GFS; A,B) and starch content (C,D), respectively. The intermediate model was calibrated either on controlled (A,C) or field conditions (B,D). Symbols and bars represent the mean and the standard error from 5–10 replicates (controlled conditions) or 5 replicates (field data) and open and closed circles represent calibration and validation datasets, respectively. Dashed and dot-and-dashed lines represent the linear regression between measured and simulated values in the calibration and validation datasets, respectively.
The performance of the models to predict NC observations was improved when NC1 dataset was used for calibration. The simple and complete models both failed to properly simulate carbohydrates changes with NC2 dataset (RMSEP higher than 15, low Eff). However, the intermediate model was more accurate and efficient for both calibration (RMSE = 5.86 and 10.56 mg.g DM−1; Eff = 0.962 and 0.752 for GFS and Starch, respectively) and validation (RMSEP = 7.84 and 12.65 mg.g DM−1; Eff = 0.951 and 0.626 for GFS and Starch, respectively; Figures 5, 6). The selected years for calibration also affected the accuracy of the model to predict GFS and starch contents (Table S9). The highest accuracy was observed when the temperatures during autumn were the coldest and among the most variable (2007–2008 and 2008–2009).
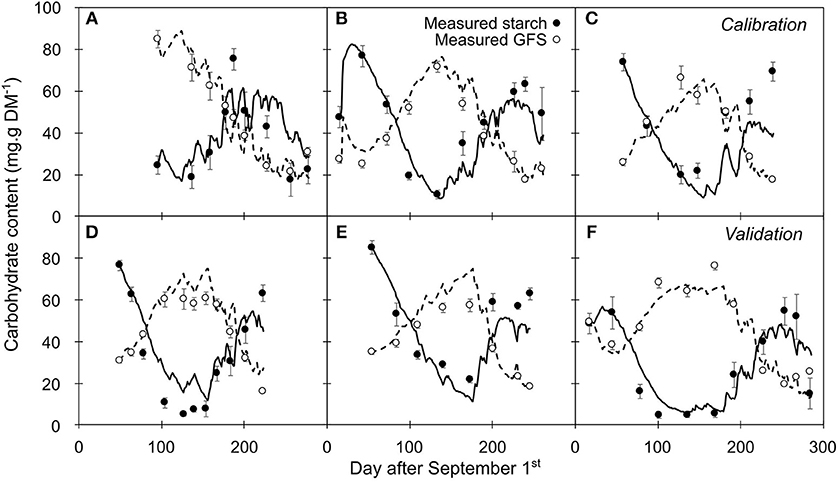
Figure 6. Seasonal variation in carbohydrate as measured and simulated by the intermediate model (GFS: open circle and dashed line, respectively; starch: closed circle and solid line, respectively). (A–C) Time series representing the data used for calibration. (D–F) External data used as a validation. Symbols and bars represent the mean and the standard error from five replicates.
The changes in GFS and starch contents were relatively well predicted for the calibration (NC1; Figures 6A–C) and validation dynamics (NC2; Figures 6D–F). However, although the accuracy in GFS prediction remained similar along the leafless period (RMSEP = 7.92 and 7.79 g.g−1 DM, for endodormancy and ecodormancy stage, respectively), starch content was more accurately predicted during endo (RMSEP = 9.58 g.g−1 DM) than during ecodormancy (RMSEP = 14.28 g.g−1 DM). This trend was more pronounced at the end of the endodormancy stage (RMSEP = 18.78 g.g−1 DM, when PS > 1.5) whereas GFS was still accurately predicted (RMSEP = 5.55 g.g−1 DM).
Finally, the accuracy and robustness of this model to predict frost hardiness was tested using the osmo-hydric model (depending on the relation between GFS and WC), calibrated on measured GFS and WC on calibration dataset. The prediction was very accurate with any of the tested dataset, and even slightly better using both models in combination: simulated vs. measured GFS values as input data, calibration vs. validation dataset (RMSE = 3.47°C and RMSEP = 3.55°C; RMSE = 3.68°C and RMSEP = 3.38°C, for the osmo-hydric model alone and combined with the intermediate model, respectively; Figure 7A). The discrepancy between both model was therefore very low (RMSE = 1.14°C), with no significant bias (P = 0.085; Figure 7B).
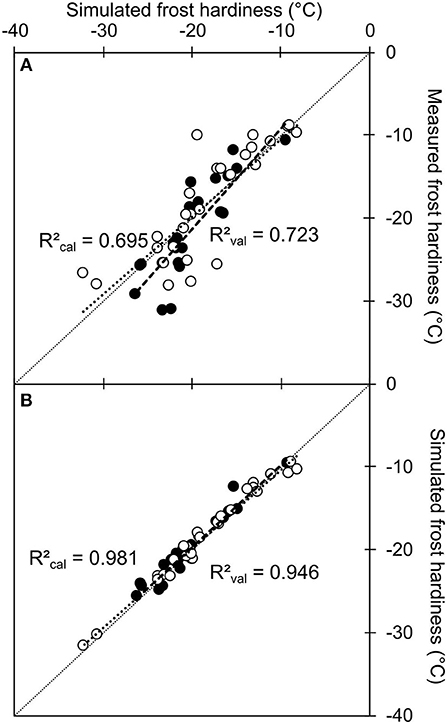
Figure 7. Simulated values of frost hardiness using the direct osmo-hydric model combined with the intermediate model simulating carbohydrate metabolism vs. measured values (A) or simulated values using the direct osmo hydric model alone (B). The model used to calculate frost hardiness (; Charrier et al., 2013a) was calibrated on measured GFS and WC value: a = −5.32 and b = 1.71. The calibration (open circles) and validation data (closed circles) were the same as Figure 6. Symbols represent the mean from five replicates (measured values). In both panels, short and long dashed lines represent the linear regression and respective regression coefficients (R2calandR2val) between values in the calibration and validation datasets, respectively.
Discussion
Carbon metabolism is a key component of plant ability to cope with environmental constraints (Hartmann and Trumbore, 2016), especially freezing stress during the dormant period (Gusta et al., 2004; Morin et al., 2007). Temperature affects the conversion between starch and soluble carbohydrates in different species e.g., Populus sp, Salix sp (Sakai, 1966c; Sauter, 1988). However, despite these primary observations, we were missing a model that could simulate the dynamics of carbohydrate composition, and related frost hardiness. Based on steady temperature treatments over 1–3 weeks, we tested different models to predict the dynamic equilibrium between these carbon pools. The most empirical and the most mechanistic models both failed to simulate properly the dynamics in GFS and starch under field conditions. However, the intermediate version (i.e., simulating the change in catalytic activity in relation with the substrate concentration, but without specified affinity) did accurately predict changes in GFS and starch over several years. The accuracy of the model was improved when the calibration was performed on field observations (NC1 dataset) rather from the controlled-conditions experiment (CC dataset). Furthermore, the selected years for calibration also affected the accuracy of the model to predict GFS and starch contents (Table S9). The highest accuracy was indeed observed when the temperatures during autumn were cold and variable. This observation confirms the importance of the temperature in the simulated process.
Different physiological variables, namely water and GFS contents, are relevant to predict frost hardiness in walnut trees (Poirier et al., 2010; Charrier et al., 2013a). Unfortunately, the measurement of these variables is time consuming and based on destructive analysis, which makes them only usable with difficulty for real-time predictions. However, the dynamic change in carbohydrate is driven by the temperature and the period of measurement (Sauter et al., 1996; Améglio et al., 2004; Poirier et al., 2010). Temperature is correlated with these physiological variables with an integrated response over 14–30 days (Figure 1; Table S1). It is interesting to note that although starch and GFS were better correlated over 30 and 14 days, respectively, frost hardiness which is correlated to both variables is better correlated over an intermediate time period (22 days). However, when data obtained at the edges of the leafless period (i.e., before leaf fall, or after budburst, i.e., sampled in mid-September or after May 10th, respectively) were included, the correlation was weaker (Figure 1), probably because carbon input (photosynthesis and leaf starch remobilization before leaf senescence) and outputs (root exportation and growth) occurs.
Nevertheless, the different correlations revealed an integrated response that could be explained by two factors: (i) the modulation of catalytic rate for the different reactions driving carbon metabolism (Witt and Sauter, 1994, 1995) and (ii) thermal inertia that could induce a deviation between air and organ temperature (Yamada and Takahashi, 2004). To minimize the effect of thermal inertia and previous thermal experience of the tree, sampled branches were kept under constant temperature for up to 3 weeks.
Temperature influences the carbohydrate metabolic rates as shown by the changes in NSC, GFS and starch contents over 1 and 3 weeks (Figure 2; Figures S1–S3). Interestingly, respiration, estimated by the change in NSCs was affected by both the temperature and its interaction with water content of the organ (Figure 2; Table S4). To date, the respiration of woody organs during the dormant period has been related to the carbohydrate content of the organ (Ögren, 2000). Here, we show that hydrated tissues would maintain higher metabolic activity, in interaction with temperature, accelerating the energy consumption over a period with low carbon input. Higher water contents during the growing season would increase the branch maintenance respiration compared to the leafless period, although Q10 remains relatively constant (ca. 1.7; Damesin et al., 2002). The value of the Q10 optimized by the model (Q10 = 2.64) was higher, although compatible with previous observation (e.g., 2.4 in Quercus alba, during the dormant period; Damesin et al., 2002). Finally, the interaction between warm temperature and high water content could therefore prevent trees from developing proper frost hardiness during autumn as shown by Charrier and Améglio (2011).
The controlled-temperature experiments revealed the influence of four factors on starch-to-soluble carbohydrate interconversion, namely temperature, season, years and treatment. Under controlled conditions, the normalization of the potential product by its respective substrate (GFS and starch by starch and GFS, respectively) decreased the heterogeneity across years and treatments (as revealed by the decrease in both variation coefficient and P-values; Tables S4–S6). Low temperature (<5°C) promoted starch hydrolysis and GFS increase across seasons, whereas, significant GFS increase was observed at warm temperature (>12°C) during autumn only (Figures 3–5). Although different enzymes (α-amylase, β-amylase, sucrose synthase, sucrose phosphate synthase) are involved in carbon metabolism during the dormant period (Witt and Sauter, 1994; Schrader and Sauter, 2002), their activity is modulated throughout the dormant period, as revealed by the change in GFS (Figure 5). The α-amylase activity is increasing at the onset of endodormancy (Elle and Sauter, 2000), and further progressively decreases (Witt and Sauter, 1994, 1995), as simulated by the model (Figures S4,S5). Another amylase activity could also significantly hydrolyze starch molecules. The β-amylase activity, which is induced by both cold and warm temperatures, would also be a good candidate (Kaplan and Guy, 2004). This enzyme has been observed in chloroplasts, vacuole and cytoplasm (Kaplan et al., 2006).
Integrating the results from controlled conditions experiment, three approaches were tested to simulate the catalytic rates driving carbon metabolism: an empirical (Simple: strict temperature control), an intermediate (temperature and substrate concentration control) and a mechanistic approach (complete: temperature, substrate concentration, and enzymatic affinity for the substrate). The respiration rate was modeled in relation to temperature and water content (Equation 6; Figure 2). The rate of starch to GFS conversion was highly variable across seasons (Figures 3–5). The enzymatic rates driving the reactions were modeled in relation to phenological stage (i.e., as a ratio of endo- and ecodormancy fulfillment: Equation 4). Although the three approaches were efficient to simulate the data used for calibration, only the intermediate approach was robust enough to simulate external values (Table 2). The empirical approach did not reflect biological reality (i.e., activity is limited by the presence of the substrate), whereas the mechanistic approach could not properly simulate the different reactions involved in the metabolic pathway (i.e., several enzymes with probably very different affinities kM). The intermediate model was the most accurate presumably because it reflects the underlying (enzymatic) processes, simulating the limiting chemical reaction, without integrating the possible variation in kM.
Finally, the model developed here was relatively efficient to predict change in starch, GFS and frost hardiness over several years under field conditions. This model included more simulated processes and related parameters than a straightforward model (e.g., osmo-hydric model). However, with respect to frost hardiness, the accuracy was similar to the osmo-hydric model previously developed on the same species (Charrier et al., 2013a; Figure 7), despite the propagation of uncertainty that is inherent to model coupling.
The prediction in starch content during the late ecodormancy (PS > 1.5) was less accurate whereas not in GFS. During this period, root water uptake is resumed when soil temperature reach 8°C, which induces the model to simulate higher losses in carbohydrate through respiration. Accurate measurements in respiration in relation with other physiological parameters would thus help to confirm this hypothesis (as stated Equation 6) as it may have major consequences on global carbon cycle in temperate areas, if warmer winters have to be expected. Warm temperatures and high water contents may lead to dramatic negative carbon balance that would affect both winter frost hardiness and spring growth resumption. However, despite the lower accuracy in starch content during spring, the prediction in frost hardiness remained fairly good for two reasons: (i) high water contents at this period has stronger influence on FH computation and (ii) GFS prediction remained good.
Even though more parameters have to be optimized than the osmo-hydric model, the model developed in this study provides an operative tool to simulate carbohydrate dynamics and related frost hardiness for the whole leafless period. It only requires one sampling date for initial carbohydrate content measurement at the beginning of endodormancy, and, relatively simple, water content and temperature data, avoiding costly and time-consuming measurements. In walnut trees, significant genotypic effect has been observed for eco-dormancy release and cold deacclimation (Charrier et al., 2011). Calibrating such a model on different walnut genotypes would bring new perspectives in identifying the variability in carbon metabolism related iso-enzymes and unraveling the genetic basis in frost hardiness variability (Guàrdia et al., 2016; Charrier et al., 2018). This could help the breeder for genetic analysis, especially when current production areas are expected to shift due to climate change. Other potential application in predicting the effect of warmer winters on dormancy and carbon metabolism (Pagter et al., 2015) and bud growing ability and organ development via the release of trophic limitation (Bonhomme et al., 2009). However, in its current state, the use of the current model for unraveling the genetic bases of FH variability or bud growth ability remains very speculative, and it should now deserve calibrating and testing under various meteorological conditions and biological systems.
Author Contributions
GC and TA conceived the original screening and research plans; GC performed the experiments and measurements. GC and AL analyzed the data and developed the different models. GC wrote the article with contributions of all the authors.
Conflict of Interest Statement
The authors declare that the research was conducted in the absence of any commercial or financial relationships that could be construed as a potential conflict of interest.
Acknowledgments
This work was supported by INRA–department of Agronomy and Environment, and the Agence Nationale de la Recherche of the French government through the program Investissements d'Avenir (16-IDEX-0001 CAP 20-25). We are grateful to Christophe Serre for frost hardiness measurements, to Brigitte Girard, Brigitte Saint-Joanis, and Marc Vandame for biochemical analysis and to Agnes Guilliot and Mélanie Decourteix for their help in the controlled-temperature experiments.
Supplementary Material
The Supplementary Material for this article can be found online at: https://www.frontiersin.org/articles/10.3389/fpls.2018.01746/full#supplementary-material
References
Alves, G., Sauter, J. J., Julien, J. L., Fleurat-Lessard, P., Améglio, T., Guilliot, A., et al. (2001). Plasma membrane H+-ATPase, succinate and isocitrate deshydrogenases activities of vessel-associated cells in Walnut trees. J. Plant Physiol. 158, 1263–1271. doi: 10.1078/0176-1617-00503
Améglio, T., Cochard, H., Lacointe, A., Ewers, F. W., Sauter, J., Martignac, M., et al. (2001). Adaptation to cold temperature and response to freezing in walnut tree. Ed. E. Germain, Acta Horticulturae, 544, 247–254. doi: 10.17660/ActaHortic.2001.544.33
Améglio, T., Decourteix, M., Alves, G., Valentin, V., Sakr, S., Julien, J. L., et al. (2004). Temperature effects on xylem sap osmolarity in walnut trees: evidence for a vitalistic model of winter embolism repair. Tree Physiol. 24, 785–793. doi: 10.1093/treephys/24.7.785
Améglio, T., Guilliot, A., Lacointe, A., Alves, G., Julien, J. L., Petel, G., et al. (2000). Water relation in winter: effect on budbreak of walnut tree. CAB International 2000. Dormancy in Plants, eds J. D. Wiemont and J. Crabbé (Wallingford, UK: CABI Publishing), 109–120.
Aronsson, A. (1975). Influence of Photo-and Thermoperiod on the Initial Stages of Frost Hardening and Dehardening of Phytotron-Grown Seedlings of Scots Pine (Pinus silvestris L.) and Norway Spruce (Picea abies (L.) Karst.) (No. 128).
Arora, R. (2018). Mechanism of freeze-thaw injury and recovery: a cool retrospective and warming up to new ideas. Plant Sci. 270, 301–313. doi: 10.1016/j.plantsci.2018.03.002
Arora, R., and Rowland, L. J. (2011). Physiological research on winter-hardiness: deacclimation resistance, reacclimation ability, photoprotection strategies, and a cold acclimation protocol design. Hortscience 46, 1070–1078.
Arora, R., and Taulavuori, K. (2016). Increased risk of freeze damage in woody perennials VIS-À-VIS climate change: importance of deacclimation and dormancy response. Front. Environ. Sci. 4:44. doi: 10.3389/fenvs.2016.00044
Bonhomme, M., Peuch, M., Améglio, T., Rageau, R., Guilliot, A., Decourteix, M., et al. (2009). Carbohydrate uptake from xylem vessels and its distribution among stem tissues and buds in walnut (Juglans regia L.). Tree Physiol. 30, 89–102. doi: 10.1093/treephys/tpp103
Caffarra, A., Donnelly, A., Chuine, I., and Jones, M. B. (2011). Modelling the timing of Betula pubescens budburst. I. Temperature and photoperiod: a conceptual model. Clim. Res. 46, 147–157. doi: 10.3354/cr00980
Cavender-Bares, J. (2005). Impacts of freezing on long distance transport in woody plants. In Vascular transport in plants (pp. 401–424). doi: 10.1016/B978-012088457-5/50021-6
Charra-Vaskou, K., Badel, E., Charrier, G., Ponomarenko, A., Bonhomme, M., Foucat, L., et al. (2015). Cavitation and water fluxes driven by ice water potential in Juglans regia during freeze–thaw cycles. J. Exp. Botany 67, 739–750. doi: 10.1093/jxb/erv486
Charrier, G., and Améglio, T. (2011). The timing of leaf fall affects cold acclimation by interactions with air temperature through water and carbohydrate contents. Environ. Exp. Botany 72, 351–357. doi: 10.1016/j.envexpbot.2010.12.019
Charrier, G., Bonhomme, M., Lacointe, A., and Améglio, T. (2011). Are budburst dates, dormancy and cold acclimation in walnut trees (Juglans regia L.) under mainly genotypic or environmental control? Int. J. Biometeorol. 55, 763–774. doi: 10.1007/s00484-011-0470-1
Charrier, G., Chuine, I., Bonhomme, M., and Améglio, T. (2018). Assessing frost damages using dynamic models in walnut trees: exposure rather than vulnerability controls frost risks. Plant Cell Environ. 41, 1008–1021. doi: 10.1111/pce.12935
Charrier, G., Cochard, H., and Améglio, T. (2013b). Evaluation of the impact of frost resistances on potential altitudinal limit of trees. Tree Physiol. 33, 891–902. doi: 10.1093/treephys/tpt062
Charrier, G., Ngao, J., Saudreau, M., and Améglio, T. (2015a). Effects of environmental factors and management practices on microclimate, winter physiology, and frost resistance in trees. Front. Plant Sci. 6:259. doi: 10.3389/fpls.2015.00259
Charrier, G., Poirier, M., Bonhomme, M., Lacointe, A., and Améglio, T. (2013a). Frost hardiness in walnut trees (Juglans regia L.): how to link physiology and modelling? Tree Physiol. 33, 1229–1241. doi: 10.1093/treephys/tpt090
Charrier, G., Pramsohler, M., Charra-Vaskou, K., Saudreau, M., Améglio, T., Neuner, G., et al. (2015b). Ultrasonic emissions during ice nucleation and propagation in plant xylem. New Phytol. 207, 570–578. doi: 10.1111/nph.13361
Chen, H. H., and Li, P. H. (1980a). Biochemical changes in tuberbearing Solanum species in relation to frost hardiness during cold acclimation. Plant Physiol. 66, 414–421. doi: 10.1104/pp.66.3.414
Chen, H. H., and Li, P. H. (1980b). Characteristics of cold acclimation and deacclimation in tuber-bearing Solanum species. Plant Physiol. 65, 1146–1148. doi: 10.1104/pp.65.6.1146
Christersson, L. (1978). The influence of photoperiod and temperature on the development of frost hardiness in seedlings of Pinus silvestris and Picea abies. Physiol. Plantarum 44, 288–294. doi: 10.1111/j.1399-3054.1978.tb08634.x
Chuine, I., Bonhomme, M., Legave, J. M., García de Cortázar-Atauri, I., Charrier, G., Lacointe, A., et al. (2016). Can phenological models predict tree phenology accurately in the future? The unrevealed hurdle of endodormancy break. Glob. Change Biol. 22, 3444–3460. doi: 10.1111/gcb.13383
Damesin, C., Ceschia, E., Le Goff, N., Ottorini, J. M., and Dufrêne, E. (2002). Stem and branch respiration of beech: from tree measurements to estimations at the stand level. N. Phytol. 153, 159–172. doi: 10.1046/j.0028-646X.2001.00296.x
Ebel, R. C., Campbell, B. L., Nesbitt, M. L., Dozer, W. A., Linsey, J. K., and Wilkins, B. S. (2005). A temperature index model to estimate long-term freeze-risk of Satsuma mandarins grown on the northern coast of the Gulf of Mexico. J. Am. Soc. Horticultural Sci. 130, 500–507.
Elle, D., and Sauter, J. J. (2000). Seasonal changes of activity of a starch granule bound endoamylase and of a starch phosphorylase in poplar wood (Populus × canadensis Moench ‘robusta’) and their possible regulation by temperature and phytohormones. J. Plant Physiol. 156, 731–740. doi: 10.1016/S0176-1617(00)80239-4
Ferguson, J. C., Tarara, J. M., Mills, L. J., Grove, G. G., and Keller, M. (2011). Dynamic thermal time model of cold hardiness for dormant grapevine buds. Ann. Botany 107, 389–396. doi: 10.1093/aob/mcq263
Fuchigami, L. H., Weiser, C. J., Kobayashi, K., Timmis, R., and Gusta, L. V. (1982). A degree growth stage (GS) model and cold acclimation in temperate woody plants. Plant cold hardiness and freezing stress. Mech. Crop Implications 2, 93–116.
Greer, D. H., and Warrington, I. J. (1982). Effect of photoperiod, night temperature, and frost incidence on development of frost hardiness in Pinus radiata. Funct. Plant Biol. 9, 333–342.
Guàrdia, M., Charrier, G., Vilanova, A., Savé, R., Améglio, T., and Aletà, N. (2016). Genetics of frost hardiness in Juglans regia L. and relationship with growth and phenology. Tree Genet. Genomes 12, 83. doi: 10.1007/s11295-016-1038-3
Gusta, L. V., Wisniewski, M., Nesbitt, N. T., and Gusta, M. L. (2004). The effect of water, sugars, and proteins on the pattern of ice nucleation and propagation in acclimated and nonacclimated canola leaves. Plant Physiol. 135, 1642–1653. doi: 10.1104/pp.103.028308
Guy, C. L. (1990). Cold acclimation and freezing stress tolerance: role of protein metabolism. Ann. Rev. Plant Biol. 41, 187–223. doi: 10.1146/annurev.pp.41.060190.001155
Hänninen, H., and Kramer, K. (2007). A framework for modelling the annual cycle of trees in boreal and temperate regions. Silva Fennica 41, 167–205. doi: 10.14214/sf.313
Harms, U., and Sauter, J. J. (1992). Changes in content of starch, protein, fat and sugars in the branchwood of Betula pendula Roth during fall. Holzforschung Int. J. Biol. Chem. Phys. Technol. Wood 46, 455–462.
Hartmann, H., and Trumbore, S. (2016). Understanding the roles of nonstructural carbohydrates in forest trees–from what we can measure to what we want to know. New Phytol. 211, 386–403. doi: 10.1111/nph.13955
Heber, U., and Santarius, K. A. (1973). Cell death by cold and heat and resistance to extreme temperatures: mechanisms of hardening and dehardening. Temperature Life 1973, 232–263.
Ichiki, S., and Yamaya, H. (1982). “Sorbitol in tracheal sap of dormant apple (Malus domestica Borkh) shoots as related to cold hardiness,” in Plant Cold Hardiness and Freezing Stress. Mechanisms and Crop Implications, Vol. 2., eds A. Sakai and P. H. Li (New York, NY: Academic Press), 181–187.
Jönsson, A. M., Linderson, M. L., Stjernquist, I., Schlyter, P., and Bärring, L. (2004). Climate change and the effect of temperature backlashes causing frost damage in Picea abies. Glob. Planet. Change 44, 195–207. doi: 10.1016/j.gloplacha.2004.06.012
Kalberer, S. R., Wisniewski, M., and Arora, R. (2006). Deacclimation and reacclimation of cold-hardy plants: current understanding and emerging concepts. Plant Sci. 171, 3–16. doi: 10.1016/j.plantsci.2006.02.013
Kaplan, F., and Guy, C. L. (2004). β-Amylase induction and the protective role of maltose during temperature shock. Plant Physiol. 135, 1674–1684. doi: 10.1104/pp.104.040808
Kaplan, F., Sung, D. Y., and Guy, C. L. (2006). Roles of betaamylase and starch breakdown during temperatures stress. Physiol. Plantarum 126, 120–128. doi: 10.1111/j.1399-3054.2006.00604.x
Kasuga, J., Arakawa, K., and Fujikawa, S. (2007). High accumulation of soluble sugars in deep supercooling Japanese white birch xylem parenchyma cells. N. Phytol. 174, 569–579. doi: 10.1111/j.1469-8137.2007.02025.x
Kasuga, J., Mizuno, K., Miyaji, N., Arakawa, K., and Fujikawa, S. (2006). Role of intracellular contents to facilitate supercooling capability in beech (Fagus crenata) xylem parenchyma cells. Cryoletters 27, 305–310.
Lacointe, A., Sauter, J. J., Améglio, T., Harms, U., Pellicer, V., and Frossard, J. S. (1995). “Carbohydrate and protein reserves in trees,” in EUROSIVA Contribution to Forest Tree Physiology, eds H. Sandermann and M Bonnet-Masimbert (Paris: Editions INRA les Colloques), 273–296.
Lang, G. A., Early, J. D., Martin, G. C., and Darnell, R. L. (1987). Endo-, para-, and ecodormancy: physiological terminology and classification for dormancy research. Hortsc. 22, 371–377.
Larcher, W. (1995). Ecophysiology and Stress Physiology of Functional Groups. Physiological Plant Ecology, Berlin: Springer-Verlag, 340–353.
Leinonen, I. (1996). A simulation model for the annual frost hardiness and freeze damage of Scots pine. Ann. Botany 78, 687–693. doi: 10.1006/anbo.1996.0178
Levitt, J. (1980). Responses of Plants to Environmental Stress, Vol. 1: Chilling, Freezing, and High Temperature Stresses. New York, NY: Academic Press.
Marquat, C., Vandamme, M., Gendraud, M., and Pétel, G. (1999). Dormancy in vegetative buds of peach: relation between carbohydrate absorption potentials and carbohydrate concentration in the bud during dormancy and its release. Sci. Horticulturae 79, 151–162. doi: 10.1016/S0304-4238(98)00203-9
Maurel, K., Leite, G. B., Bonhomme, M., Guilliot, A., Rageau, R., Pétel, G., et al. (2004). Trophic control of bud break in peach (Prunus persica) trees: a possible role of hexoses. Tree Physiol. 24, 579–588. doi: 10.1093/treephys/24.5.579
Morin, X., Améglio, T., Ahas, R., Kurz-Besson, C., Lanta, V., Lebourgeois, F., et al. (2007). Variation in cold hardiness and carbohydrate concentration from dormancy induction to bud burst among provenances of three European oak species. Tree Physiol. 27, 817–825. doi: 10.1093/treephys/27.6.817
Ögren, E. (1996). Premature dehardening in Vaccinium myrtillus during a mild winter: a cause for winter dieback?. Functional. Ecol. 10, 724–732. doi: 10.2307/2390507
Ögren, E. (2000). Maintenance respiration correlates with sugar but not nitrogen concentration in dormant plants. Physiol. Plantarum 108, 295–299. doi: 10.1034/j.1399-3054.2000.108003295.x
Pagter, M., Andersen, U. B., and Andersen, L. (2015). Winter warming delays dormancy release, advances budburst, alters carbohydrate metabolism and reduces yield in a temperate shrub. AoB Plants. 7. doi: 10.1093/aobpla/plv024
Pagter, M., and Williams, M. (2011). Frost dehardening and rehardening of Hydrangea macrophylla stems and buds. Hortscience 46, 1121–1126.
Pearce, R. S. (2004). “Adaptation of higher plants to freezing,” in Life in the Frozen State eds B. J. Fuller, N. Lane, and E. E. Benson (Boca Raton, London, New York, Washington D.C: CRC Press), 171–203.
Pearce, R. S., Dunn, M. A., Rixon, J. E., Harrison, P., and Hughes, M. A. (1996). Expression of cold-inducible genes and frost hardiness in the crown meristem of young barley (Hordeum vulgare L. cv. Igri) plants grown in different environments. Plant Cell Environ. 19, 275–290. doi: 10.1111/j.1365-3040.1996.tb00250.x
Pogosyan, K. S., and Sakai, A. (1969). Freezing resistance in grape vines. Low Temperature Sci. Ser. B 27, 125–142.
Poirier, M., Lacointe, A., and Améglio, T. (2010). A semi-physiological model of cold hardening and dehardening in walnut stem. Tree Physiol. 30, 1555–1569. doi: 10.1093/treephys/tpq087
Raese, J. T., Williams, M. W., and Billingsley, H. D. (1977). Sorbitol and other carbohydrates in dormant apple shoots as influenced by controlled temperatures. Cryobiology 14, 373–378. doi: 10.1016/0011-2240(77)90185-7
Reuther, G. (1971). Die Dynamik des kohlenhydratmetabolismus als kriterium der frostresistenz von obstgehölzen in abhängigkeit von der winterruhe. Berichte der Ber. Dtsch. Bot. Ges. 84, 571–583.
Sakai, A. (1960). Survival of the twig of woody plants at-−196°C. Nature 185:393. doi: 10.1038/185393a0
Sakai, A. (1962). Studies on the frost-hardiness of woody plants; 1. The causal relation between sugar content and frost-hardiness. Contrib. Institute Low Temperature Sci. 11, 1–40.
Sakai, A. (1966a). Temperature fluctuation in wintering trees. Physiol. Plantarum 19, 105–114. doi: 10.1111/j.1399-3054.1966.tb09080.x
Sakai, A. (1966b). Seasonal variations in the amount of polyhydric alcohol and sugar in fruit trees. J. Horticultural Sci. 41, 207–213. doi: 10.1080/00221589.1966.11514169
Sakai, A. (1966c). Studies of frost hardiness in woody plants. II. Effect of temperature on hardening. Plant Physiol. 41, 353–359. doi: 10.1104/pp.41.2.353
Sauter, J. J. (1980). Seasonal variation of sucrose content in the xylem sap of Salix. Z. Pflanzenphysiol 98, 377–391. doi: 10.1016/S0044-328X(80)80191-7
Sauter, J. J. (1981). Sucrose uptake in the xylem of Populus. Z. Pflanzenphysiol 103, 105–168. doi: 10.1016/S0044-328X(81)80146-8
Sauter, J. J. (1982). Efflux and reabsorption of sugars in the xylem. I. Seasonal changes in sucrose efflux in Salix. Z. Pflanzenphysiol 106, 325–336. doi: 10.1016/S0044-328X(82)80111-6
Sauter, J. J. (1988). Temperature-induced changes in starch and sugars in the stem of Populous × canadensis ‘robusta’. J. Plant Physiol. 132, 608–612.
Sauter, J. J., and Ambrosius, T. (1986). Changes in the partitioning of carbohydrates in the wood during bud break in Betula pendula Roth. J. Plant Physiol. 124, 31–43. doi: 10.1016/S0176-1617(86)80175-4
Sauter, J. J., Elle, D., and Witt, W. (1998). A starch granule bound endoamylase and its possible role during cold acclimation of parenchyma cells in poplar wood (Populus × canadensis Moench ‘robusta’). J. Plant Physiol. 153, 739–744.
Sauter, J. J., and Wellenkamp, S. (1998). Seasonal changes in content of starch, protein and sugars in the twig wood of Salix caprea L. Holzforschung 52, 255–262. doi: 10.1515/hfsg.1998.52.3.255
Sauter, J. J., Wisniewski, M., and Witt, W. (1996). Interrelationships between ultrastructure, sugar levels, and frost hardiness of ray parenchyma cells during frost acclimation and deacclimation in poplar (Populus × canadensis Moench ‘robusta’) Wood. J. Plant Physiol. 149, 451–461.
Schrader, S., and Sauter, J. J. (2002). Seasonal changes of sucrose-phosphate synthase and sucrose synthase activities in poplar wood (Populus × canadensis Moench ‘robusta’) and their possible role in carbohydrate metabolism. J. Plant Physiol. 159, 833–843. doi: 10.1078/0176-1617-00730
Schwarz, W. V. (1970). Der einfluss der photoperiode auf das austreiben, die frosthärte und die hitzeresistenz von zirben und alpenrozen. Flora 159, 258–285. doi: 10.1016/S0367-2530(17)31033-2
Siminovitch, D., Wilson, C. M., and Briggs, D. R. (1953). Studies on the chemistry of the living bark of the black locust in relation to its frost hardiness. V. Seasonal transformations and variations in the carbohydrates: starch-sucrose interconversions. Plant Physiol. 28, 383–400. doi: 10.1104/pp.28.3.383
Smith, D. (1968). Varietal chemical differences associated with freezing resistance in forage plants. Cryobiology 5, 148–159. doi: 10.1016/S0011-2240(68)80160-9
Steponkus, P. L., Garber, M. P., Myers, S. P., and Lineberger, R. D. (1977). Effects of cold acclimation and freezing on structure and function of chloroplast thylakoids. Cryobiology 14, 303–321. doi: 10.1016/0011-2240(77)90178-X
Withers, L. A., and King, P. J. (1979). Proline: a novel cryoprotectant for the freeze preservation of cultured cells of Zea mays L. Plant Physiol. 64, 675–678. doi: 10.1104/pp.64.5.675
Witt, W., Buchholz, A., and Sauter, J. J. (1995). Binding of endoamylase to native starch grains from poplar wood. J. Exp. Botany 46, 1761–1769. doi: 10.1093/jxb/46.11.1761
Witt, W., and Sauter, J. J. (1994). Enzymes of starch metabolism in poplar wood during fall and winter. J. Plant Physiol. 143, 625–631. doi: 10.1016/S0176-1617(11)81149-1
Witt, W., and Sauter, J. J. (1995). In vitro degradation of starch grains by phosphorylases and amylases from poplar wood. J. Plant Physiol. 146, 35–40. doi: 10.1016/S0176-1617(11)81964-4
Wong, B. L., Baggett, K. L., and Rye, A. H. (2003). Seasonal patterns of reserve and soluble carbohydrates in mature sugar maple (Acer saccharum). Can. J. Botany Revue Can. De Botanique 81, 780–788. doi: 10.1139/b03-079
Yamada, M., and Takahashi, H. (2004). Frost damage to Hemerocallis esculenta in a mire: relationship between flower bud height and air temperature profile during calm, clear nights. Can. J. Botany 82, 409–419. doi: 10.1139/b04-005
Keywords: carbohydrates, dormancy, enzymatic activity, starch, tree physiology, winter biology
Citation: Charrier G, Lacointe A and Améglio T (2018) Dynamic Modeling of Carbon Metabolism During the Dormant Period Accurately Predicts the Changes in Frost Hardiness in Walnut Trees Juglans regia L. Front. Plant Sci. 9:1746. doi: 10.3389/fpls.2018.01746
Received: 27 June 2018; Accepted: 09 November 2018;
Published: 05 December 2018.
Edited by:
Evelyne Costes, INRA UMR Amélioration Génétique et Adaptation des Plantes Méditerranéennes et Tropicales, FranceReviewed by:
Teemu Hölttä, University of Helsinki, FinlandAnita Solar, University of Ljubljana, Slovenia
Copyright © 2018 Charrier, Lacointe and Améglio. This is an open-access article distributed under the terms of the Creative Commons Attribution License (CC BY). The use, distribution or reproduction in other forums is permitted, provided the original author(s) and the copyright owner(s) are credited and that the original publication in this journal is cited, in accordance with accepted academic practice. No use, distribution or reproduction is permitted which does not comply with these terms.
*Correspondence: Guillaume Charrier, Z3VpbGxhdW1lLmNoYXJyaWVyQGlucmEuZnI=