 Jennifer R. Olins1†
 Li Lin1†
 Scott J. Lee1,2Gina M. Trabucco1,3Kirk J.-M. MacKinnon1,3
 Samuel P. Hazen1*
- 1Biology Department, University of Massachusetts, Amherst, MA, United States
- 2Plant Biology Graduate Program, University of Massachusetts, Amherst, MA, United States
- 3Molecular and Cellular Biology Graduate Program, University of Massachusetts, Amherst, MA, United States
Arabidopsis thaliana CELLULOSE SYNTHASE A4/7/8 (CESA4/7/8) are three non-redundant subunits of the secondary cell wall cellulose synthase complex. Transcript abundance of these genes can vary among genotypes and expression quantitative trait loci (eQTL) were identified in a recombinant population of the accessions Bay-0 and Shahdara. Genetic mapping and analysis of the transcript levels of CESAs between two distinct near isogenic lines (NILs) confirmed a change in CESA4 expression that segregates within that interval. We sequenced the promoters and identified 16 polymorphisms differentiating CESA4Sha and CESA4Bay. In order to determine which of these SNPs could be responsible for this eQTL, we screened for transcription factor protein affinity with promoter fragments of CESA4Bay, CESA4Sha, and the reference genome CESA4Col. The wall thickening activator proteins NAC SECONDARY WALL THICKENING PROMOTING FACTOR2 (NST2) and NST3 exhibited a decrease in binding with the CESA4Sha promoter with a tracheary element-regulating cis-element (TERE) polymorphism. While NILs harboring the TERE polymorphisms exhibited significantly different CESA4 expression, cellulose crystallinity and cell wall thickness were indistinguishable. These results suggest that the TERE polymorphism resulted in differential transcription factor binding and CESA4 expression; yet A. thaliana is able to tolerate this transcriptional variability without compromising the structural elements of the plant, providing insight into the elasticity of gene regulation as it pertains to cell wall biosynthesis and regulation. We also explored available DNA affinity purification sequencing data to resolve a core binding site, C(G/T)TNNNNNNNA(A/C)G, for secondary wall NACs referred to as the VNS element.
Introduction
While a primary cell wall surrounds all plant cells, a secondary cell wall is also found in xylem cells responsible for water transportation, structural fibers, and cells that serve as an outside barrier to the external environment. These thick and relatively inflexible walls are composed of a complex of cellulose, hemicelluloses, and the polyphenolic polymer lignin. Cellulose is the most abundant fraction in the majority of tissues and exists as long unbranched β-1,4-linked glucan chains. Cellulose chains coalesce in parallel to form a single microfibril via hydrogen bonding and van der Waals forces. Depending on their density and nature of the commingling polymers and linkages, microfibrils can contribute to a matrix that ranges from fairly elastic to extremely rigid. Aside from the obvious functional virtues to plants, secondary cell wall rich in cellulose are a valuable feedstock for the pulp and paper and the biofuel industries (Carroll and Somerville, 2009). Understanding the regulation of secondary cell wall composition, especially the effects of natural genetic variation, will facilitate enhanced gene modification and plant breeding for more efficient biomass production.
Cellulose is synthesized at the plasma membrane by multiple Cellulose Synthase A (CESA) proteins organized into rosette shaped complexes (Mueller and Brown, 1980). The rosette is composed of at least 18 CESA subunits organized into six globules, termed cellulose synthase complexes (CSCs) (Jarvis, 2013). There are ten proteins in the A. thaliana CESA family, while direct polymerization activity remains to be documented, all but CESA10 have been shown to be associated with cellulose biosynthesis (Guerriero et al., 2010). Mutations in a number of non-CESA genes, including members of the COBRA family, also exhibit polymerization defects (Ching et al., 2006; Sindhu et al., 2007; Zhang et al., 2010; Kotake et al., 2011). All members of the CESA superfamily, which includes the CESAs and seven CESA-like (CSL) families in eudicots, are integral membrane proteins; CESAs have two transmembrane domains in the N-terminus and six at the C-terminus, while CSLs are more variable (Somerville, 2006; Nixon et al., 2016; Little et al., 2018). Additionally, all ten CESA family members contain a LIM-like Zn-binding domain/RING finger, which is known to be involved in protein–protein interactions (Somerville, 2006). These attributes are in line with the finding that CESAs form a complex embedded in the cell membrane (Arioli et al., 1998; Fagard et al., 2000; Scheible et al., 2001; Taylor et al., 2003; Timmers et al., 2009). Across plant species and under most circumstances, three distinct non-redundant CESAs are required for optimal production of cellulose, and in plants, CESA1, 3, and one or more of 2/5/6/9 are involved in primary cell wall development, while CESA4, 7, and 8 are responsible for secondary cell wall biosynthesis (Kumar and Turner, 2015).
Early studies of knock-out mutations in CESA genes in A. thaliana first revealed the non-redundant nature of the secondary CESAs, as mutants harboring null mutations in any of the three secondary CESAs exhibited irregular cell walls and weaker stems (Taylor et al., 2000). To further understand the intricacies of the CESA genes, subsequent studies investigated the effects of more subtle changes in CESA expression. Virus-induced gene silencing (VIGS) of CESA genes in Nicotiana benthamiana led to dwarfed phenotypes and reduced cellulose content (Burton et al., 2000). A similar VIGS study in flax again resulted in plants of shorter stature that only displayed a slight reduction in sugar content (Chantreau et al., 2015). Comparable phenotypes were also observed in Brachypodium distachyon with compromised expression of CESA genes by use of artificial microRNAs, and more recently, it was shown that both CESA knock-down and overexpression induced similar biomass-compromised phenotypes in Panicum virgatum L. (Handakumbura et al., 2013; Mazarei et al., 2018).
Non-redundancy within secondary cell wall CESAs suggests the sensitive nature of cellulose synthesis and cell wall growth. In conjunction, the 18 CESAs in each rosette likely synthesize an individual β-1-4-glucan cellulose chain that coalesce in parallel to form a single microfibril via hydrogen bonding and van der Waals forces, though cases of 24-chain fibrils have been reported (Thomas et al., 2013). Variation among species in the orientation and size of the CSCs correlates with the size and thickness of microfibrils. Though the microfibrils have an organized, crystalline structure, the inner chains in the bundle tend to exhibit higher degrees of crystallinity, while sheath fibers are more disordered (Nixon et al., 2016). The degree of crystallinity within the microfibril has been found to be inversely correlated with the rate of polymerization. Moreover, disruptions to CESA domains that either encourage microfibril aggregation or membrane complex subunit associations show an overall reduction in crystallinity (Harris et al., 2012).
The expression of CESA genes and many others that encode additional cell wall components are highly co-regulated (Brown et al., 2005; Persson et al., 2005). A current model for transcriptional regulation of cell wall genes is a series of feed forward loops (Taylor-Teeples et al., 2015; Zhang et al., 2018). Transcription factors most commonly bind to the promoters of secondary cell wall genes associated with different classes of wall components as well as the promoters of other wall regulating transcription factors. Three phylogenetically distinct groups of NACs play the role of direct and indirect activators of cell wall gene expression: VNDs (VASCULAR-RELATED NAC-DOMAIN), NSTs (NAC SECONDARY WALL THICKENING), and SNDs (SECONDARY WALL-ASSOCIATED NAC DOMAIN PROTEIN) (Yao et al., 2012; Nakano et al., 2015). There are seven A. thaliana VNDs and all can activate xylem vessel cell differentiation (Kubo et al., 2005). Similarly, the NSTs positively activate cell wall thickening, but in fiber cells rather than vasculature (Mitsuda et al., 2007; Zhong et al., 2010). In A. thaliana, these include NST1, NST2, and NST3/SND1. The third clade, SNDs, consists of two A. thaliana genes, SND2 and SND3. Similar to the NSTs, SND2 and its orthologs in poplar, rice, and switchgrass can also directly and indirectly activate secondary cell wall thickening (Zhong et al., 2008; Hussey et al., 2011; Rao and Dixon, 2018; Ye et al., 2018). While these three classes of NAC transcription factors are distinct in their amino acid sequence as well as their role in wall development, they are reported to bind similar DNA sequences. The consensus sequence CTTNAAAGCNA, named the tracheary element-regulating cis-element (TERE), was initially identified in the promoters of genes associated with secondary cell wall formation and programmed cell death of vasculature (Pyo et al., 2007). Subsequently, VNDs, NSTs, and SNDs have been shown to bind directly and specifically to the TERE motif and a similar target, the secondary wall NAC-binding element [SNBE, (T/A)NN(C/T)(T/C/G)TNNNNNNNA(A/C)GN(A/C/T)(A/T)] (Pyo et al., 2007; Ohashi-Ito et al., 2010; Zhong et al., 2010; Taylor-Teeples et al., 2015; Ye et al., 2018). Thus, these NACs have both overlapping and distinct roles in the regulation of cell differentiation and secondary cell wall biosynthesis.
Naturally occurring genetic diversity offers a rich source from which to identify promising genes and variants for bioenergy crop breeding. Identification of markers associated with advantageous biomass accumulation traits has been carried out in chickpea, maize, sorghum, and other species, and such studies frequently pinpoint loci of CESA genes as potential targets (Shiringani and Friedt, 2011; Barrière et al., 2012; Zhao et al., 2013; Kujur et al., 2015). In addition, analysis of variable expression profiles among accessions has also been highlighted as a plant breeding tool, as exhibited by studies in sugarcane, loblolly pine, and shrub willow (Serapiglia et al., 2012; Palle et al., 2013; Kasirajan et al., 2018). Such studies contribute to the identification of candidate biomass accumulation genes, and also present a method of early selection in the breeding process. In general, transcriptome analysis suggests upregulation of CESA genes correlates with increased biomass (Serapiglia et al., 2012; Kujur et al., 2015; Kasirajan et al., 2018). In the present study, we investigated the causes and consequences of an eQTL at the CESA4 cis-eQTL in the A. thaliana Bayreuth (Bay-0) and Shakdara (Sha) recombinant inbred line (RIL) population (Loudet et al., 2002; West et al., 2007). We aimed to take advantage of the natural variation of A. thaliana to better understand the genotypic and phenotypic diversity for biofuel-relevant traits, specifically by studying the regulation of and variation in crystalline cellulose content within the plant cell wall.
Materials and Methods
Yeast One-Hybrid Protein-DNA Interaction Assays
Yeast one-hybrid protein–DNA interaction assays were conducted as previously described (Taylor-Teeples et al., 2015). The transcription factors were transformed into each yeast strain and the β-galactosidase activity was determined as previously described (Pruneda-Paz et al., 2009). Positive interactions were visually identified as incidence of yellow caused by the presence of ortho-nitrophenyl cleavage from colorless ortho-nitrophenyl-β-D-galactoside by β-galactosidase. The DNA bait strains were, similarly, tested for self-activation prior to screening, under selection but in the absence of any prey vector. A total of 34 E. coli strains harboring different A. thaliana transcription factors (Supplementary Table 1) were arrayed in 96-well plates and plasmids were prepared. proCESA4Col (539 bp), proCESA4Bay (539 bp), and proCESA4Sha (540 bp) were cloned and recombined with reporter genes. Promoter sequences and primers used are described in Supplementary Table 2. Nine of overlapping fragments of CESA4Col were independently cloned according to Pruneda-Paz et al. (2009). The oligonucleotides used to amplify promoter fragments are described in Supplementary Table 2. The screen was replicated in full to confirm the results and each clone was sequenced to re-confirm identity.
Electrophoretic Mobility Shift Assays
To express recombinant NST2 or SND1 protein, coding sequences were cloned and fused to glutathione S-transferase tag in the pDONR211 vector and then transferred into pDEST15 (Invitrogen). E. coli strain BL21-AI (Invitrogen) transformed with pDEST15-GST:NST2 were grown in liquid media to an OD600 of 0.4, treated with 0.2% L-arabinose to induce expression overnight and harvested by centrifugation the following day. Cells were treated with 1 mg/mL lysozyme on ice for 30 min in minimal volume of 1X PBS buffer and lysed by sonication. Cell lysates were clarified by centrifugation and incubated with 100 μL of glutathione sepharose beads (GE Healthcare, Pittsburg, PA, United States) for 30 min at 4°C with rotation. The beads were transferred to a column, washed with 10 volumes of 1X PBS. Protein was eluted in 100 mM Tris-HCl pH8.0, 100 mM NaCl and 3 mg/mL glutathione buffer and purified protein was re-suspended in 50% glycerol and stored at -80°C.
Three overlapping probes were generated for CESA4Bay-C, CESA4Bay-D, CESA4Bay-E, CESA4Sha-C, CESA4Sha-D, CESA4Sha-E promoter fragments using the same oligonucleotides described in Supplementary Table 2. Reactions were carried out in binding buffer (10 mM Tris, pH7.5, 50 mM KCl, 1 mM DTT, 2.5% glycerol, 5 mM MgCl2, 0.1% IGEPAL CA-630, and 0.05 μg/μl calf thymus DNA). Following the addition of 150 ng of protein from the GST purification eluate, reactions were incubated at room temperature for 30 min. Protein-DNA complexes were separated from the free DNA on 1% agarose/1X TAE gels at 4°C. The agarose gels were stained with ethidium bromide and bands visualized under UV light.
Characterization of Near Isogenic Lines
To develop NILs, RILs maintaining heterozygosity at the CESA4 locus in the F6 generation were identified (Loudet et al., 2002). One plant per RIL carrying a heterozygous CESA4 locus was identified via genotyping and selfed to obtain the F7 seeds. Within the F7 plants, pairs of lines were identified that were either homozygous for the CESA4Bay and CESA4Sha alleles to generate the NILs used in this study. The nearly isogenic lines analyzed in this study were developed from RIL93 and RIL350 segregating for the CESA4 region. Individual HIF plants were genotyped for the Bay-0 or Sha CESA4 allele by PCR of a 543 bp of CESA4 promoter with primers described in Supplementary Table 2. PCR products were subjected to restriction enzyme digestion with BsrDI (New England BioLabs, Ipswich, MA, United States) at 65°C for 2 h. The Sha allele incudes a BsRDI cut site (CGTTAC| NN) resulting in 401 and 142 bp fragments. The 543 bp Bay-0 allele contains no BrsDI restriction sites and remains undigested. Transcript abundance of CESA4 in the near isogenic lines (NILs) was quantified in 5 cm stems. Stem tissue was frozen in liquid nitrogen and pulverized with metal beads in a Retsch (Haan, Germany) Mixer Mill MM400. RNA extraction and cDNA synthesis was conducted as described above. Primers for CESA4 real-time PCR are described in Supplementary Table 2.
Quantification of Crystalline Cellulose
To quantify and compare levels of crystalline cellulose, the Updegraff assay as adapted and described by Kumar and Turner was used (Updegraff, 1969; Kumar and Turner, 2015). Briefly, alcohol-insoluble residue (AIR) samples were first prepared from senesced stem tissue; samples were weighed at this stage for later calculations. Then, 3 mL of an acetic/nitric acid solution (8:1:2, acetic acid: nitric acid: water) was added to AIR samples and incubated in a boiling water bath for 30 min. This step removes hemicellulose and lignin while leaving cellulose microfibrils intact. The remaining cellulosic material was then swelled in 67% sulfuric acid in a boiling water bath for 5 min to disorganize the polymers, and the subsequent monomers were finally analyzed with a sulfuric acid/anthrone colorimetric assay. Absorbance was measured at a wavelength of 620 nm with a SpectraMax M5 and corrected to a known glucose standard to calculate the percent cell wall composition of cellulose.
Quantification of Stem Thickness
To investigate the histological effects of expression variation on the cell wall, 100 μm cross sections were sliced using a Leica Biosystems VT1000S Vibrating-blade microtome. Sections were incubated on the bench top for 2 min in a 2% w/v phloroglucinol/ethanol solution (Fisher Scientific, Waltham, MA), mounted in a 1:1 concentrated hydrochloric acid: water solution, and immediately imaged using a Nikon Eclipse E200 microscope and a PixeLink scope camera. For each stem, three sections were imaged, and five cells from three different portions of each stem were measured to get an average of 45 measurements per biological sample.
Polarized Light Microscopy
To qualitatively analyze cellulose crystallinity under polarized light, internode segments were first cut on a vibratome into 100 μm sections, fixed in 2% glutaraldehyde and then embedded in Epon/Araldite (Sigma-Aldrich, St. Louis, MO, United States) before slicing into 0.5 μm sections on an Reichert-Jung, Ultracut E microtome (Vienna, Austria). Polarized light microscopy takes advantage of variation in the passage of light through crystalline structures to uncover discrete differences in crystallinity configurations. Specifically, the LC-PolScope (CRI, Cambridge, MA, United States) employed for this assay uses polarized light to measure birefringent retardance and the intensity of the images generated directly correlates to the retardance value, thus qualitative differences in crystallinity can be observed. Several stem samples from each HIF were imaged and analyzed.
DNA Affinity Purification Sequence Analysis
In order to determine a consensus VND, NST, and SND (VNS) protein binding motif, the MEME.txt motif files from O’Malley et al. (2016) were visually aligned based on nucleotide similarity and trimmed to a length of 13 bases. An average for each nucleotide, at each motif position was calculated using a bash script that referenced the aligned and trimmed motif files. The consensus matrix was then loaded into R and the Bioconductor package SeqLogo was used to generate the motif logo. A bash shell script counted each of the VNS motif variant across the A. thaliana TAIR 10 sequence assembly and for each DAP-seq set of binding sites. Sum of the counts determined the total number of VNS motif sites and percentages were calculated as the proportion of each motif variant relative to the sum and multiplied by 100. The process was repeated for the DAP-seq binding site data using the reference genome file as a guide to extract DAP-seq peak fasta sequences. ThenarrowPeak DAP-seq peak data files were then searched iteratively through each of the peak binding sites. The percentage shown for DAP-seq data represents the mean percentage across all binding site files.
Statistical Analysis
Correlation coefficients and tests of significance were calculated using Pearson’s correlation tests for all CESA genes pairwise using replicate gene expression data for Bay-0 and Sha parental lines and RILs using the rcorr function from the Hmisc library in R 3.2.5. Two tailed Student’s t-tests were carried out in Excel to assess gene expression, cell thickness, and cellulose content data sets. BoxPlots were generated with the BoxPlotR Web Tool (Spitzer et al., 2014).
Accession Numbers
CESA1 (At4g32410), CESA2 (At4g39350), CESA3 (At5g05170), CESA4 (At5g44030), CESA5 (At5g09870), CESA6 (At5g64740), CESA7 (At5g17420), CESA8 (At4g18780), CESA9 (At2g21770), CESA10 (At2g25540), NST1 (At2g46770), NST2 (At3g61910), NST3/SND1 (At1g32770), PP2AA3 (At1g13320), TIP41 (At4g34270).
Results
Natural Variation and Co-expression of the Secondary Wall CESAs
We explored the observation that CESA gene expression varied among different accessions of A. thaliana. West et al. (2007) measured the expression of 22,746 genes in replicated samples of the Bay-0/Sha RIL population. Above ground tissue of 211 short-day grown plants was assayed after 6 weeks of growth using the Affymetrix ATH1 GeneChip microarray. There was a continuous range of values and normal distributions were observed for the ten CESA genes known to play a role in the biosynthesis of cellulose in secondary cell walls (Figure 1A and Supplementary Figure 1). The midparent values (i.e., the values halfway between the two parents) and the median of the RILs for CESA4, CESA7, and CESA8 (Figure 1A) and the seven other CESA genes (Supplementary Figure 1) were very similar.
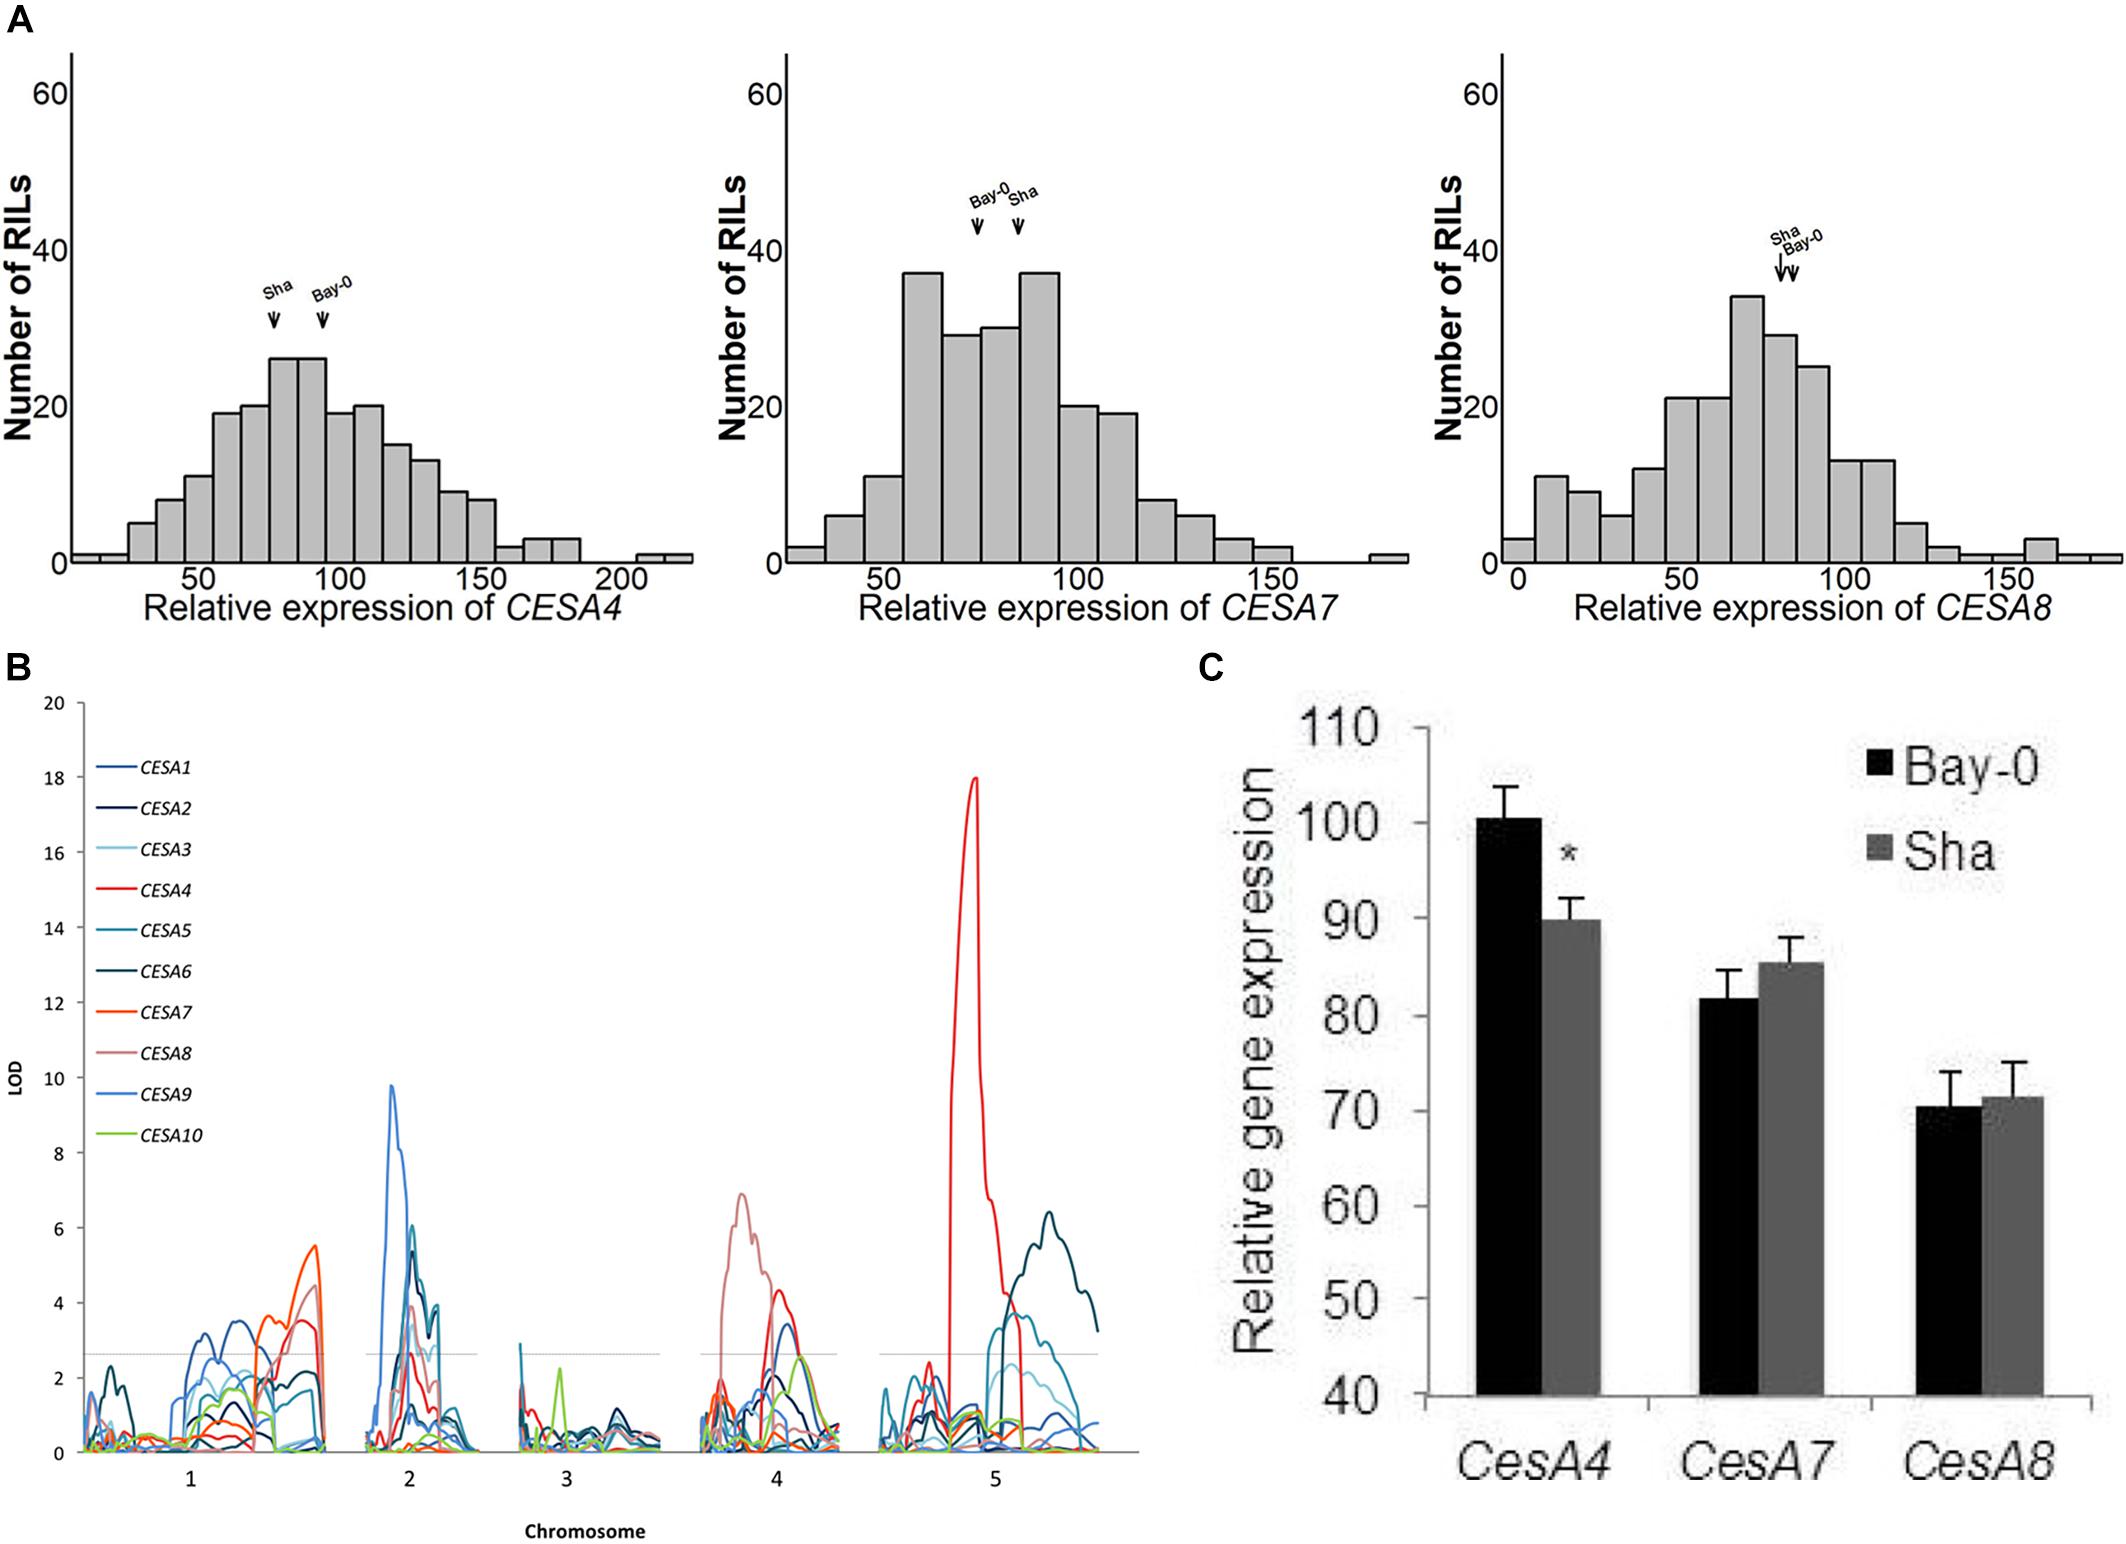
Figure 1. (A) Histograms of relative expression of CESA4/7/8 within the Bay-0 × Sha recombinant inbred line population (RIL). (B) Genetic mapping identified a CESA4 expression quantitative trait locus coincident with the physical position of the CESA4 locus on chromosome five. (C) Relative expression of CESA4/7/8 from RIL parents carrying Bay-0 or Sha allele. Lines carrying Bay-0 allele had significantly higher expression of CesA4, while no differences were observed between RILS for the expression of CESA7 or CESA8. ∗P < 0.01.
The CESA genes have been shown to be highly co-regulated within their functional classes. Three of the primary CESAs, CESA1, 3, and 6, had the most similar gene expression to each other in a meta analysis of gene expression and the same is true among the secondary CESAs: CESA4, 7, and 8 (Persson et al., 2005). Candidate genes for the transcriptional regulation of CESA gene expression have been successfully identified using the same type of analysis in various species (Brown et al., 2005; Persson et al., 2005; Yamaguchi et al., 2010; Ruprecht et al., 2011; Handakumbura et al., 2018). Among the Bay-0/Sha RILs, the expression of CESA4, 7, and 8 were significantly correlated as were the primary wall CESAs (Table 1).
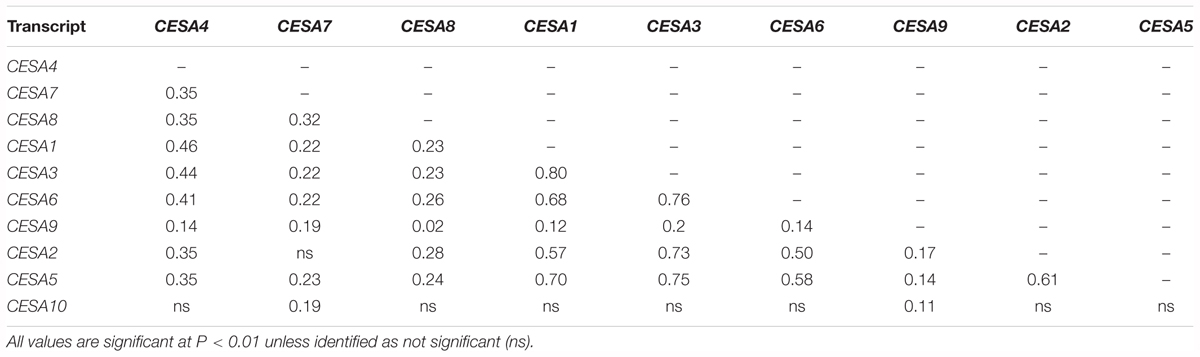
Table 1. Pairwise Pearson’s correlation coefficients of means of relative gene expression of the Bay-0/Sha recombinant inbred line population.
Secondary Wall CESA eQTL
Among the genes whose expression was measured using the ATH1 microarray, 69% were associated with an eQTL and each transcript was mapped to an average of 2.34 loci (West et al., 2007). To pinpoint the cause of CESA gene expression variation among RILs, we searched for eQTL for these genes (Figure 1B). An eQTL for each of the CESAs was mapped to a position of the genome outside of those genes, i.e., trans-eQTL (Figure 1B and Table 2). A trans-eQTL common to all three secondary wall CESA genes was found near the bottom of chromosome 1. Overlapping trans-eQTLs were identified for CESA4 and 8 on chromosomes 2 and 4. An eQTL unique to CESA4 with the greatest LOD score of 17.95 was found on chromosome 5, coincident with the CESA4 genomic locus. CESA4 transcript abundance in RILs varied significantly depending on the presence of the Bay-0 CESA4 promoter allele (CESA4Bay) or the Sha CESA4 promoter allele (CESA4Sha) (Figure 1C). No differences were observed for the expression of other secondary wall CESA genes, CESA7 or CESA8, between RILs with either CESA4Bay or CESA4Sha (Figure 1C).
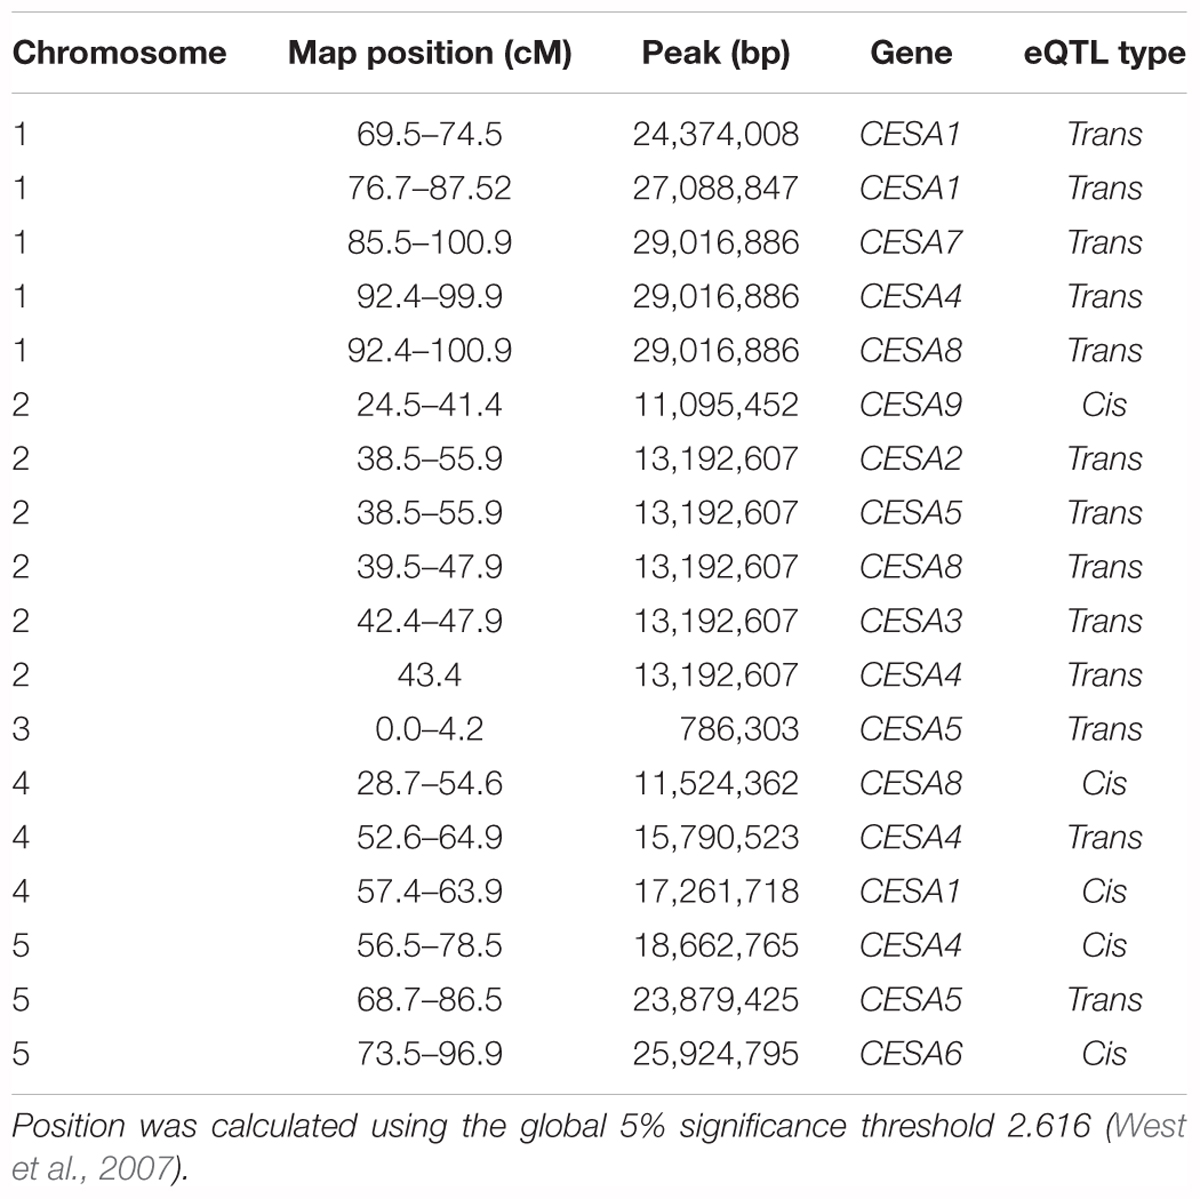
Table 2. Summary of CESA eQTL.
A SNP in the CESA4 Promoter at the CESA4 Cis-eQTL Induces Differential Binding of Cell Wall Thickening NAC Regulators
Possible mechanisms for such a cis-eQTL include functional polymorphisms in the promoter of the gene in question, and we hypothesized that this change may disrupt interaction of SND1 or NST2, which we previously identified to interact with the CESA4 promoter using yeast one-hybrid (Taylor-Teeples et al., 2015). As such, we sequenced the promoters of Bay-0, Sha, and Col-0 and identified 16 single nucleotide polymorphisms (SNPs) between CESA4Sha and CESA4Col and only two SNPs between CESA4Bay and CESA4Col (Figure 2). To specify which of the 16 SNPs were likely responsible for the CESA4 cis-eQTL, we screened nine overlapping fragments (A–I) of CESA4Bay and CESA4Sha promoters by yeast one-hybrid with CESA4Col promoter interacting proteins (Figures 2, 3A). In this assay, transcription factor proteins were fused to the Gal4 activation domain and each protein is tested for an interaction with the CESA4 promoter fragments immediately upstream of the lacZ reporter. A positive interaction can result in the cleavage from colorless ortho-nitrophenyl-β -D-galactoside by β-galactosidase resulting in a yellow color. The well-characterized wall thickening regulators SND1 and NST2 interacted with two CESA4Bay fragments (C and E) but only a single CESA4Sha fragment (E). One SNP in this region disrupts the second position of a perfect TERE motif in CESA4Sha fragment C (Figure 3B). This polymorphic fragment failed to interact with SND1 and NST2 (Figure 3A). This suggests the expression differences between CESA4Bay and CESA4Sha could have occurred as a consequence of differential binding of NST2 or SND1 proteins to the TERE motif in fragment C.
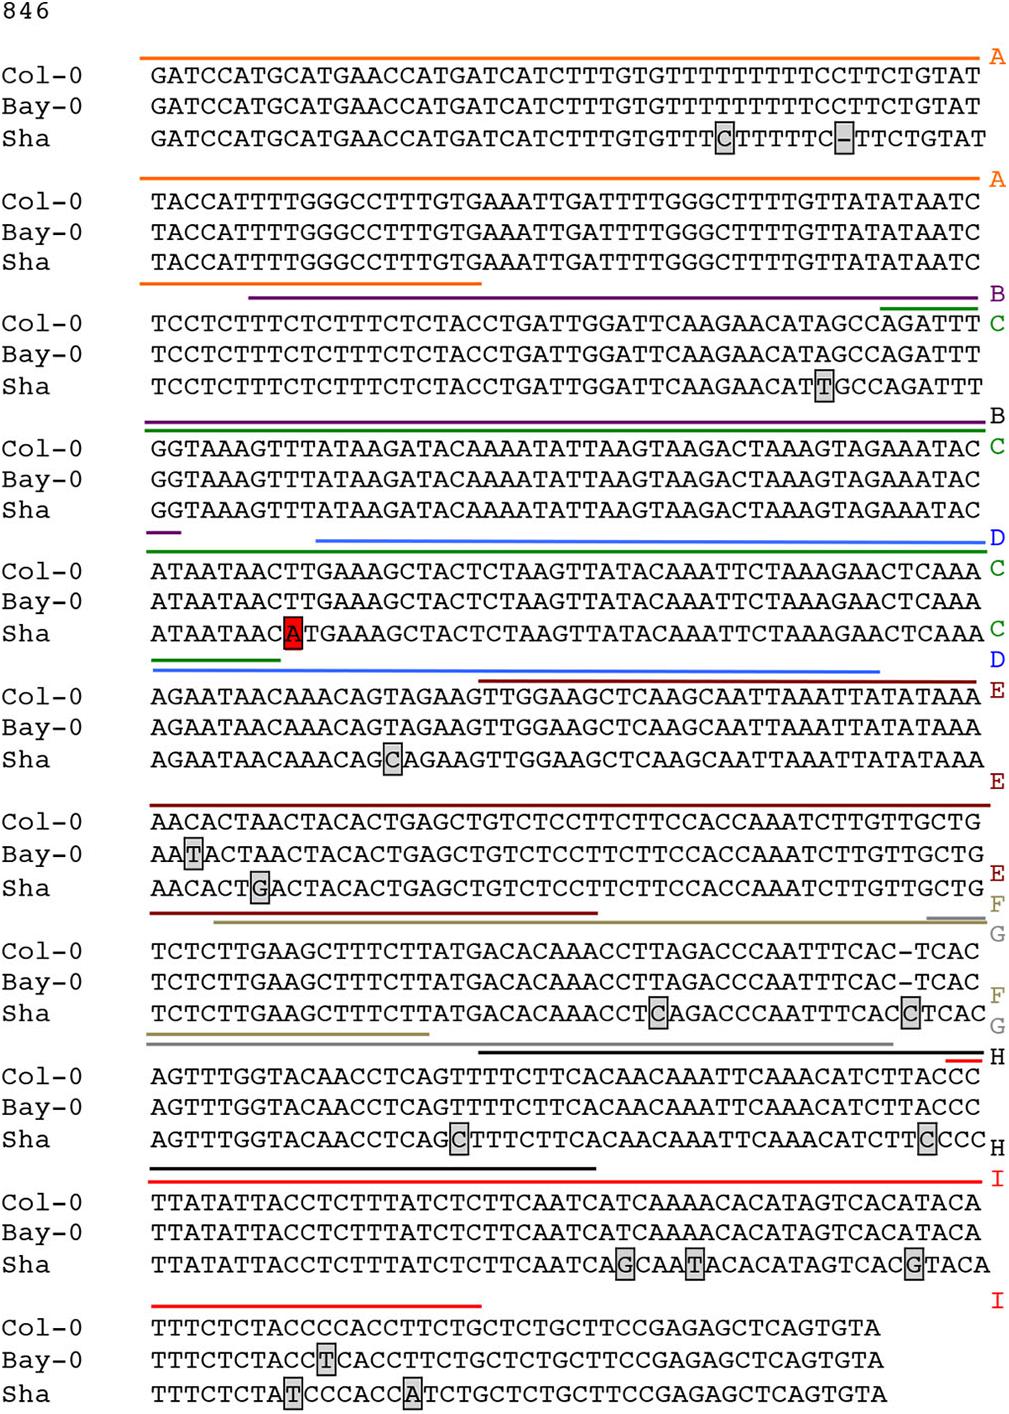
Figure 2. Sequence analysis of promoter of CESA4 for Col-0, Bay-0, and Sha accessions. Sequencing and alignment of CESA4 promoter contains only one single nucleotide polymorphism between CESA4Bay and CESA4Col and sixteen SNPs between CESA4Sha and CESA4Col. Colored lines and letter above the sequence indicate different fragments tested for affinity with NAC proteins. Boxes indicate sequence polymorphisms.
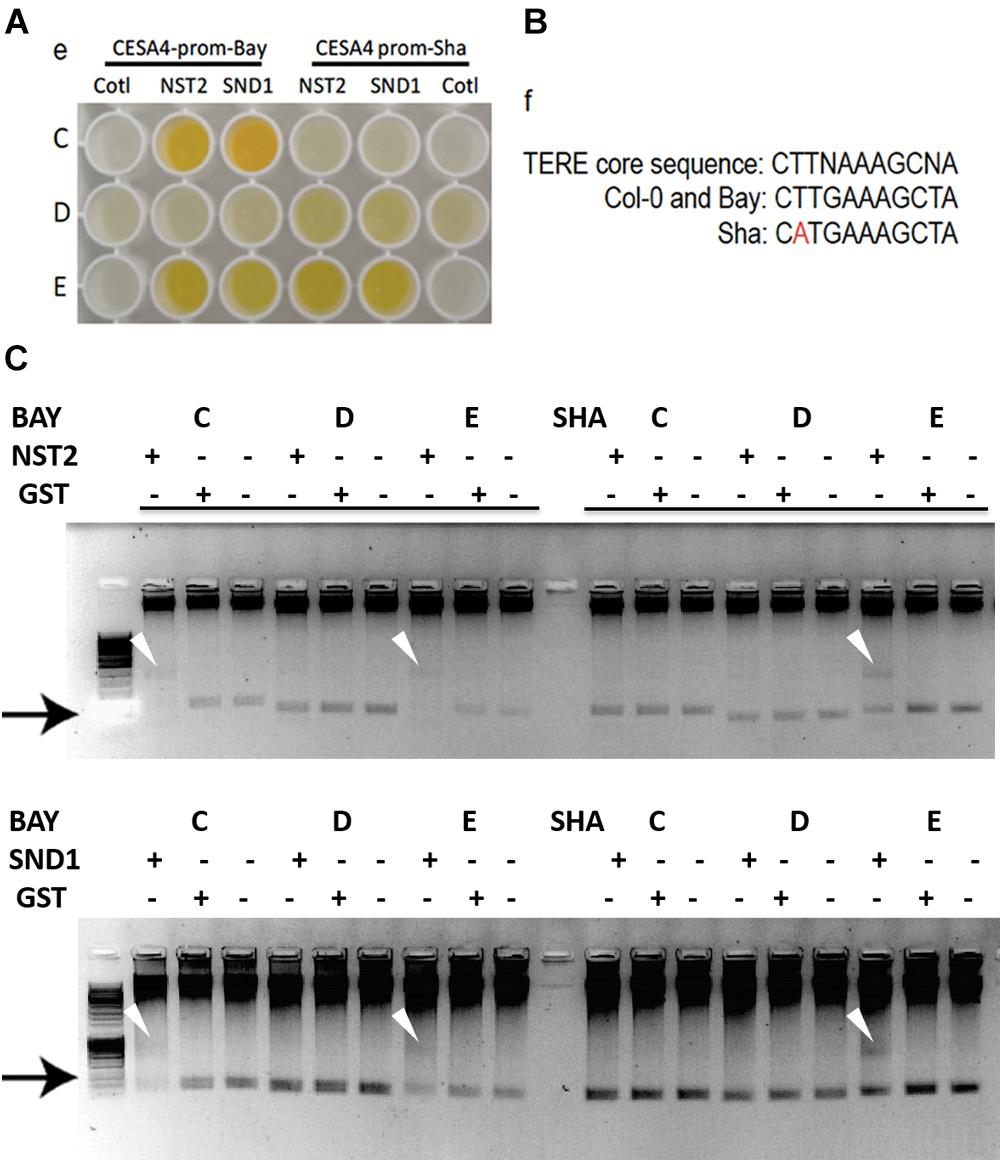
Figure 3. Yeast one-hybrid and protein–DNA interactions within CESA4 promoter. (A) Nine overlapping fragments (A–I) of CESA4Bay and CESA4Sha promoters were screened by yeast one-hybrid with CESA4Col promoter interacting proteins. SND1 and NST2 interacted with two CESA4Bay fragments (C and E) but only a single CESA4Sha fragment (E). (B) A single nucleotide polymorphism disrupts the second position of a perfect TERE motif in CESA4Sha fragment C. (C) Electrophoretic mobility shift assay for interactions between CESA4Bay and CESA4Sha promoters and NST2 and SND1. This polymorphic fragment CESA4Bay fragment C failed to interact with SND1 and NST2.
To further explore the possibility of this regulatory mechanism, EMSA was performed to confirm the differential protein-DNA with probes corresponding to CESA4 promoter fragments C, D, and E in the presence or absence of extracts of Escherichia coli expressing GST-NST2 and GST-SND1 (Figure 3C). As anticipated, differences in mobility were observed with the TERE motif-containing fragment C of CESA4Bay but not with the corresponding fragment of CESA4Sha, confirming our yeast one-hybrid observations. Also consistent with our yeast one-hybrid results, fragment D from both accessions did not produce a DNA species with retarded mobility, but the TERE motif-containing fragment E did in both cases. Bacterial extracts harboring the empty GST vector did not produce any comparable shifted species. Taken together, these data suggest that the CESA4Sha TERE motif polymorphism may result in diminished binding by SND1 and NST2 proteins.
CESA4 Is Differentially Expressed in CESA4Bay and CESA4Sha Near Isogenic Lines
Resolving the effects of the CESA4Bay and CESA4Sha cis-regulatory region is confounded by the entirety of the sequence variation between Bay-0 and Sha, which are maintained in different combinations among the RILs. To isolate the influence of the CESA4 locus, we identified RILs with residual heterozygosity at CESA4 and tested derived NILs. We isolated the NILs from heterozygous inbred family 93 (HIF93) and HIF350, segregating for the CESA4 promoter interval that demonstrated differential binding. Transcript abundance in developing stems containing CESA4Bay was twofold greater than that of CESA4Sha in both pairs of NILs (Figure 4). These results further support the differential binding between Bay-0 and Sha by NST2 and SND1, thus changing expression of CESA4.
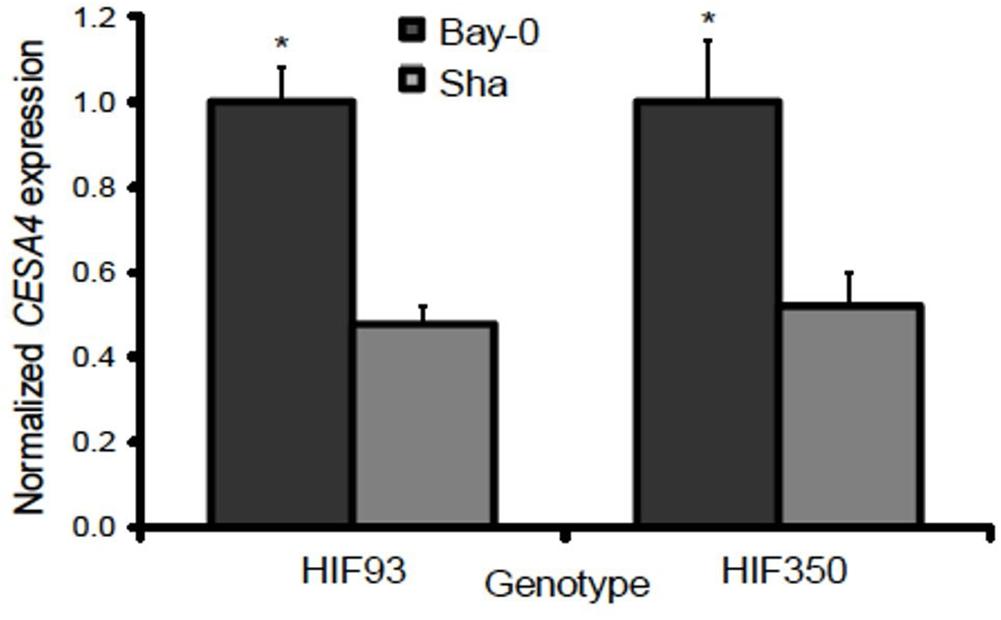
Figure 4. Normalized gene expression results from qPCR between heterogeneous inbred families (HIFs) segregating for parental Bay-0 and Sha alleles in CESA4 promoter region demonstrated differential binding. Transcript abundance in developing stems containing CESA4Bay was twofold greater than that of CESA4Sha in both pairs of NILs. ∗P < 0.01.
No Differences in Cell Wall Properties Were Observed Between CESA4Bay and CESA4Sha Near Isogenic Lines
Considering the critical role of CESA4 in plant structure, we wished to evaluate the phenotypic effect of the cis-eQTL. Bay-0 and Sha CESA4 NILs were indistinguishable at the macro level, but a subtle consequence at the cellular level remained a possibility. To explore the effect of the CESA4 cis-eQTL on cellulose, Bay-0 and Sha were first examined with stem histology to measure cell wall thickness. Stem cross sections were indistinguishable between NILs (Figure 5A). All xylem and interfascicular cells had well-defined edges and equivalent phloroglucinol staining. The CESA4Bay NIL93 exhibited an average cell wall thickness of 3.57 μm, which was slightly greater than the 3.07 μm thickness of their CESA4Sha NIL93 counterparts. The CESA4Bay NIL93 samples were quite variable with a standard deviation of 0.45 μm. Cell wall thickness of CESA4Bay and CESA4Sha NIL350 were almost identical, 2.86 and 2.85 μm, respectively (Figure 5B).
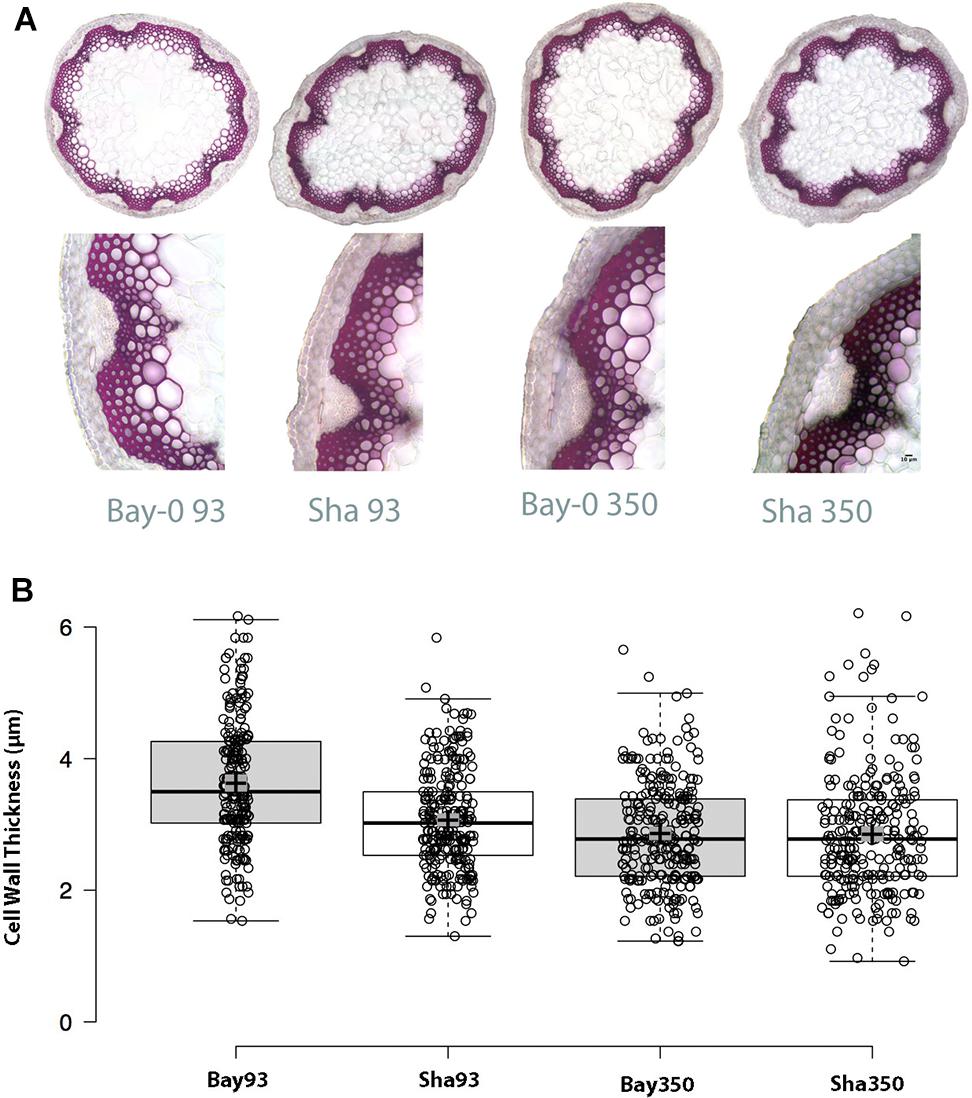
Figure 5. (A) Phloroglucinol stained cross sections with representative focus areas for measurements. (B) Cell wall thickness variation between Bay-0 and Sha NILS. CESA4Bay NIL93 was the only line to exhibit slightly thicker cell walls, while the other three lines were similar. Center lines show the medians; box limits indicate the 25th and 75th percentiles as determined by R software; whiskers extend 1.5 times the interquartile range from the 25th and 75th percentiles; crosses represent sample means with surrounding gray box indicating 95% confidence interval.
While no significant differences in overall lignin staining or cell thickness was observed, we hypothesized that the reduction in CESA4 expression may still compromise the cellulose crystalline structure of the NILs carrying the CESA4Sha allele. To evaluate this, we employed Updegraff assay to quantify crystalline cellulose and polarized light microscopy as a secondary indicator of crystallinity. Percent composition of crystalline cellulose was slightly higher in CESA4Bay NIL93 than CESA4Sha NIL93, 28.2% vs. 26.8%, but lower in CESA4Bay NIL350 that CESA4Sha NIL350, 27.0% vs. 29.2%. Percent cellulose crystallinity was marginally greater in the Bay-0 parental accession than Sha, 27.0% vs. 25.3% (Supplementary Figure 2). However, the NILs were not significantly different. Polarized light images of all samples mirrored brightfield images and were indistinguishable between NILs (Figure 6). Birefringent retardance was strong and consistent in xylem and interfascicular cells, revealing no difference in quantities or order of crystalline cellulose. The comparable phenotypes between NILs revealed in both the histological and chemical assays suggest the decreased CESA4 expression observed in CESA4Sha NILs does not disrupt cellulose abundance or crystallinity.
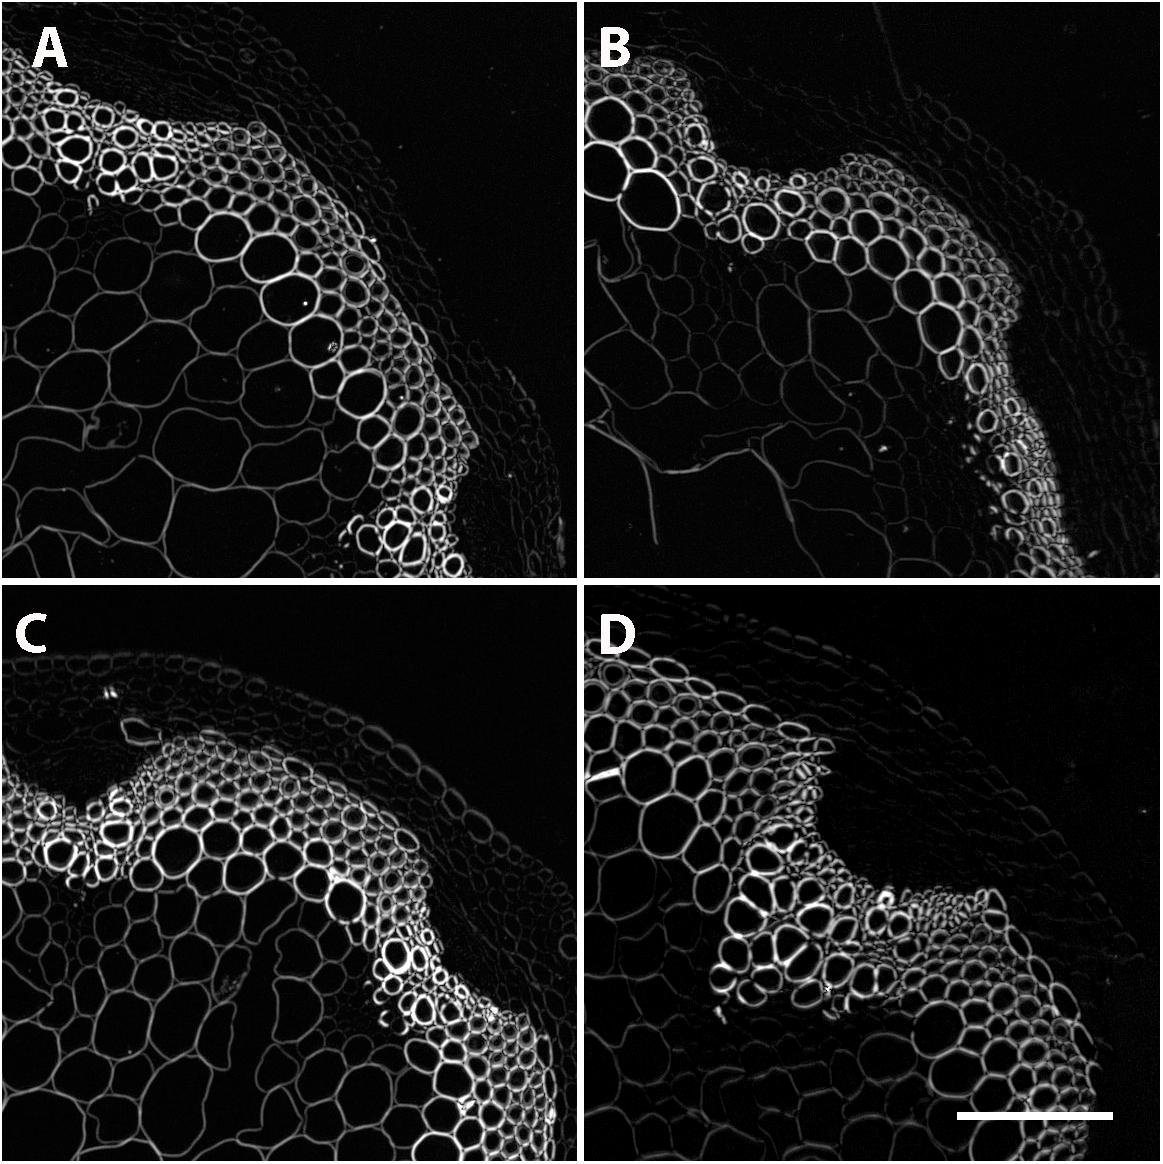
Figure 6. Polarized light microscopy on stem cross sections revealed no differences in crystallinity. Representative images of (A) Sha 93, (B) Bay-0 93, (C) Sha 350, and (D) Bay-0 350.
The Secondary Wall Associated NAC Proteins Bind the Same Sequence
The TERE and SNBE are compatible sequences, independently identified as binding sites of VND and NST NAC proteins (Pyo et al., 2007; Ohashi-Ito et al., 2010; Zhong et al., 2010). The TERE sequence, CTTNAAAGCNA, is consistent with the following internal sequence of the SNBE: CTTNNNNNNNA. To further resolve this binding site we explored the DNA affinity purification sequencing (DAP-seq) data previously generated for A. thaliana transcription factors and Col-0 genomic DNA (O’Malley et al., 2016). We searched the binding peaks of DAP-seq data for available VND, SND, and NST proteins: VND1, 2, 3, 4, 6, SND2, SND3, and NST1. The data included DNA sequence from libraries of DNA where methylcytosines were removed by PCR and unamplified libraries. There is a striking similarity between the top enriched motif described by the DAP-seq and the SNBE/TERE motif (Supplementary Table 3). The core DAP-seq derived motif similarity across all three groups of NACs is three positions flanking seven nucleotides of any sequence: C(G/T)TNNNNNNNA(A/C)G. We refer to this as the VND/NST/SND element (VNS, Figure 7). Interestingly, the motif appears to be palindromic depending on the variable positions. We searched the sequences of the binding sites and found the prefix CTT and AAG suffix to represent more than half of the total occurrences of the VNS, however, each possible sequence was similar to the frequency in the genome (Table 3). Therefore, there does not appear to be a preference for the variable positions. There was a low frequency of an A or a T in the first and last position of the binding site, respectively. The NAC binding site in the CESA4 promoter is consistent with both the TERE and a VNS, but with a T at the last position.
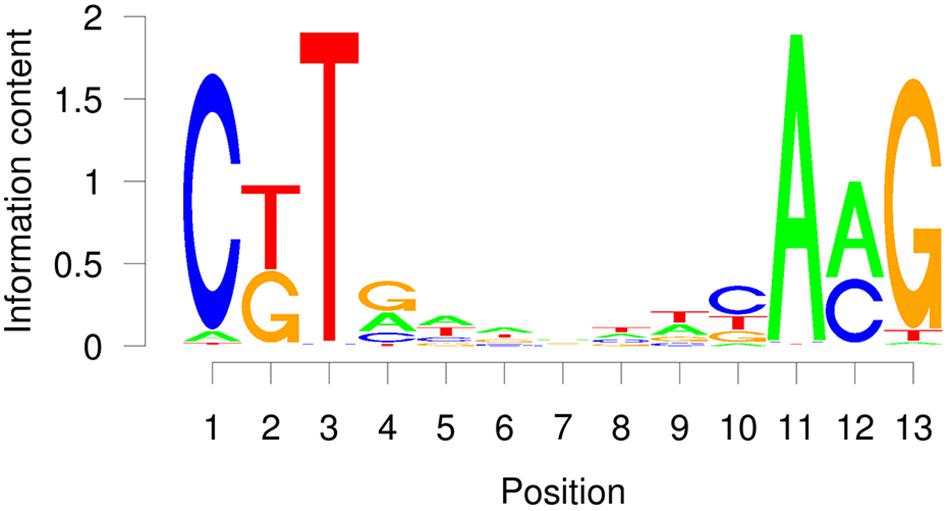
Figure 7. Average probability matrix motif for the VND, NST, and SND secondary cell wall NAC protein DAP-seq showing the probability of a nucleotide at each position.
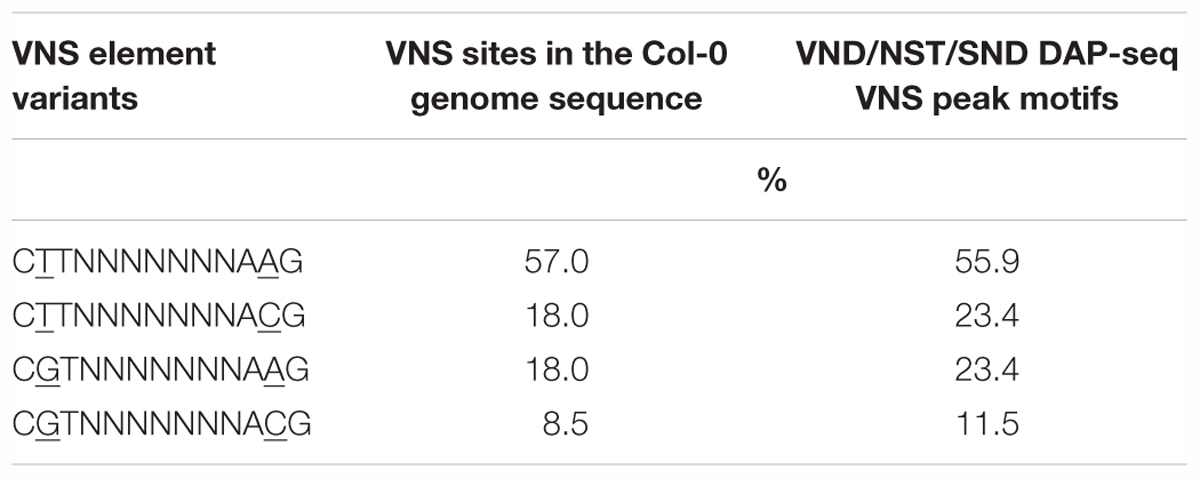
Table 3. Comparison of VND/NST/SND (VNS) NAC protein binding motif variants by percentage in the Arabidopsis thaliana genome.
Discussion
We investigated the variable expression of CESA4 in a RIL population of A. thaliana. After observation of an eQTL at the CESA4 locus, SNP analysis and transcription factor binding assays revealed a disruption in an otherwise perfect TERE motif in the CESA4Sha allele. Chemical and histological analysis of the cell wall composition was unable to detect any differences between NILs carrying the CESA4Bay or CESA4Sha allele.
Natural variation in transcript abundance and its association with growth and biomass traits has been documented in a number of instances. Analysis of transcript abundance in a Eucalyptus backcross population revealed downregulation of lignin biosynthesis genes is associated with an increase in growth rate (Kirst et al., 2004). Meanwhile, upregulation of genes may confer either positive or negative effects on biomass accumulation; eQTL analysis of high and low biomass pools of Poplar revealed that of the identified loci of differential expression, half were upregulated in high biomass trees and half were upregulated in low biomass trees (Du et al., 2015). Alternatively, genotypic variation of patterns of differential expression between mature and immature tissues can also be an indicator of advantageous biomass traits, as presented in a recent study of the sugarcane transcriptome, in which ShCESA4 and ShCESA7 were differentially expressed between top and bottom internodes in high fiber genotypes only (Kasirajan et al., 2018). Notably, increased expression of the CESAs is frequently associated with higher sugar content or biomass. In alfalfa, CESA4 was upregulated in genotypes exhibiting greater cellulose content, and similarly, upregulation of CESA4 in shrub willow was associated with increased total polysaccharide content (Yang et al., 2010; Serapiglia et al., 2012). Though the present study concurs with others that underline the occurrence of naturally variable expression patterns, it differs with the lack of an association between CESA4 expression and cellulose content. This study also diverges from previous reports of CESA expression, as the correlation coefficients among the secondary cell wall CESAs were relatively low (Appenzeller et al., 2004). This discrepancy is likely due to the low enrichment of secondary cell walls in the tissue tested.
Variation in transcript abundance among genotypes may be caused by non-synonymous or synonymous SNPs in coding regions, as well as SNPs in introns and 3′ and 5′UTR, as was reported in Pinus taeda, Eucalyptus, and Picea glauca (Kirst et al., 2004; Beaulieu et al., 2011; Palle et al., 2013). Such SNPs can induce either trans-eQTLs, functioning by affecting the expression of transcription factor targets or other regulatory interactions, or cis-eQTLs, modulating expression by discrepancies in promoter sequence, as presented here. Though non-coding regions face less selective pressure than coding sequences, development-specific expression profiles and regions responsible for transcription factor binding have been shown to have greater conservation of motifs in promoters across species (Creux et al., 2008; Ding et al., 2012). We describe a loss-of-function mutation to the TERE motif, complementing previous reports of the effects of aberrations to this 11 bp sequence (Pyo et al., 2007).
A number of studies have investigated the effects of perturbed CESA expression on biomass production, and several studies have underlined the flexibility of species to tolerate moderate discrepancies in expression. amiRNA inhibition of CESA4 expression in B. distachyon, in which BdCESA4 expression was reduced almost 10-fold, resulted in compromised cellulose production, yet the same study found that reduction in CESA7 expression by only 1.5-fold resulted in only moderate effects on cell wall composition (Handakumbura et al., 2013; Mazarei et al., 2018). A similar study of Panicum virgatum highlighted that modest reductions in expression caused no detectable changes to plant structure or biomass production, and only samples with a >40% reduction in expression were compromised in cell wall traits (Mazarei et al., 2018). Notably, studies reporting the most profound phenotypes typically discuss mutations in the coding region of genes or complete loss-of-function alleles (Tanaka et al., 2003; Taylor et al., 2003; Joshi et al., 2011).
The presence of loss-of-function cis-eQTLs across viable accessions found in variable geographic locations also underlines the ability of the plant genome to tolerate expression irregularities and perhaps poses more questions about posttranscriptional and translational regulation, as well as the role of local environment in trait variance (Vuylsteke and van Eeuwijk, 2008; Zan et al., 2016). The results suggest that regulatory mechanisms may be at play, highlighting the elasticity of the plant genome and proteome. A plethora of both naturally occurring and mutagenesis-induced transcript discrepancies have been associated with a structural or developmental phenotype, and the same was expected in this study. However, resistance to cellulose perturbation has also been reported. For example, co-suppression of several CESAs in barley (Hordeum vulgare) caused by constitutive expression using the CaMV35S promoter was only sometimes (25% of the time) associated with a compromised cell wall phenotype (Tan et al., 2015). Transgenic overexpression of each secondary cell wall CESA, CESA4, 7, and 8, resulted in lower transcript levels for all three endogenous secondary cell wall CESAs. Moreover, transcript levels of all three CESAs tended to correlate, regardless of which CESA cDNA was driven by the CaMV35S promoter, suggesting that regulatory mechanisms limited by synthase complex stoichiometry are at play (Tan et al., 2015).
Co-regulation of the CSC subunits at the transcript level was not reported in HIFs for this study, but posttranscriptional regulation poses another possible mechanism to explain the lack of phenotypic effect. While transcript analysis is a powerful tool and can provide invaluable data on genome regulation, stress response, and more, mRNA accumulation alone is not enough to draw definitive conclusions about protein expression. Indeed, the global correlation between the transcriptome and proteome in both prokaryotes and eukaryotes has been found to be weak, at best (Gygi et al., 1999; Washburn et al., 2003; Soto-Suárez et al., 2016). Posttranscriptional regulation mechanisms, half-life, and localization and interactions all may play a role in protein expression levels, causing them to differ from transcript abundance.
A number of studies have identified cases where protein expression of complex subunits is posttranscriptionally controlled and seemingly limited by complex stoichiometry; generally, mRNA levels of individual subunits have not been found to correlate with complex expression (Washburn et al., 2003; Hajduch et al., 2010; Lalanne et al., 2018). For example, it was found that the alpha and beta plastidial pyruvate kinase subunits had similar protein expression but discrepant transcript expression, suggesting that the requirements of complex assembly can be a regulatory factor in protein accumulation. A similar scenario could likely be occurring in the CSC, and further studies would benefit from an investigation of CESA protein expression levels.
Author Contributions
JO, LL, and SH conceived and designed the study. JO, LL, and GT acquired the data. JO, LL, SL, KM, and SH analyzed and interpreted the data. JO, LL, and SH drafted the manuscript.
Funding
This research was supported by the Office of Science Department of Energy Grant DE-SC0006621 and DE-FG02-08ER64700DE to SH.
Conflict of Interest Statement
The authors declare that the research was conducted in the absence of any commercial or financial relationships that could be construed as a potential conflict of interest.
Acknowledgments
We would like to thank Dr. Tobias Baskin for his assistance in collecting the polarized light images. We thank Olivier Loudet (INRA–Genetics and Plant Breeding, Versailles, France) for HIF lines.
Supplementary Material
The Supplementary Material for this article can be found online at: https://www.frontiersin.org/articles/10.3389/fpls.2018.01895/full#supplementary-material
References
Appenzeller, L., Doblin, M., Barreiro, R., Wang, H., Niu, X., Carrigan, L., et al. (2004). Cellulose synthesis in maize: isolation and expression analysis of the cellulose synthase (CesA) gene family. Cellulose 11, 287–299. doi: 10.1023/B:CELL.0000046417.84715.27
Arioli, T., Peng, L., Betzner, A. S., Burn, J., Wittke, W., Herth, W., et al. (1998). Molecular analysis of cellulose biosynthesis in Arabidopsis. Science 279, 717–720. doi: 10.1126/science.279.5351.717
Barrière, Y., Méchin, V., Lefevre, B., and Maltese, S. (2012). QTLs for agronomic and cell wall traits in a maize RIL progeny derived from a cross between an old Minnesota13 line and a modern Iodent line. Theor. Appl. Genet. 125, 531–549. doi: 10.1007/s00122-012-1851-5
Beaulieu, J., Doerksen, T., Boyle, B., Clément, S., Deslauriers, M., Beauseigle, S., et al. (2011). Association genetics of wood physical traits in the conifer white spruce and relationships with gene expression. Genetics 188:197. doi: 10.1534/genetics.110.125781
Brown, D. M., Zeef, L. A. H., Ellis, J., Goodacre, R., and Turner, S. R. (2005). Identification of novel genes in Arabidopsis involved in secondary cell wall formation using expression profiling and reverse genetics. Plant Cell 17, 2281–2295. doi: 10.1105/tpc.105.031542
Burton, R. A., Gibeaut, D. M., Bacic, A., Findlay, K., and Roberts, K. (2000). Virus-induced silencing of a plant cellulose synthase gene. Plant Cell 12:691. doi: 10.1105/tpc.12.5.691
Carroll, A., and Somerville, C. (2009). Cellulosic biofuels. Annu. Rev. Plant Biol. 60, 165–182. doi: 10.1146/annurev.arplant.043008.092125
Chantreau, M., Chabbert, B., Billiard, S., Hawkins, S., and Neutelings, G. (2015). Functional analyses of cellulose synthase genes in flax (Linum usitatissimum) by virus-induced gene silencing. Plant Biotechnol. J. 13, 1312–1324. doi: 10.1111/pbi.12350
Ching, A., Dhugga, K. S., Appenzeller, L., Meeley, R., Bourett, T. M., Howard, R. J., et al. (2006). Brittle stalk 2 encodes a putative glycosylphosphatidylinositol-anchored protein that affects mechanical strength of maize tissues by altering the composition and structure of secondary cell walls. Planta 224, 1174–1184. doi: 10.1007/s00425-006-0299-8
Creux, N. M., Ranik, M., Berger, D. K., and Myburg, A. A. (2008). Comparative analysis of orthologous cellulose synthase promoters from Arabidopsis, Populus and Eucalyptus: evidence of conserved regulatory elements in angiosperms. New Phytol. 179, 722–737. doi: 10.1111/j.1469-8137.2008.02517.x
Ding, J., Hu, H., and Li, X. (2012). Thousands of cis-regulatory sequence combinations are shared by Arabidopsis and poplar. Plant Physiol. 158:145. doi: 10.1104/pp.111.186080
Du, Q., Gong, C., Wang, Q., Zhou, D., Yang, H., Pan, W., et al. (2015). Genetic architecture of growth traits in Populus revealed by integrated quantitative trait locus (QTL) analysis and association studies. New Phytol. 209, 1067–1082. doi: 10.1111/nph.13695
Fagard, M., Desnos, T., Desprez, T., Goubet, F., Refregier, G., Mouille, G., et al. (2000). PROCUSTE1 encodes a cellulose synthase required for normal cell elongation specifically in roots and dark-grown hypocotyls of Arabidopsis. Plant Cell 12, 2409–2423. doi: 10.1105/tpc.12.12.2409
Guerriero, G., Fugelstad, J., and Bulone, V. (2010). What do we really know about cellulose biosynthesis in higher plants? J. Integr. Plant Biol. 52, 161–175. doi: 10.1111/j.1744-7909.2010.00935.x
Gygi, S. P., Rochon, Y., Franza, B. R., and Aebersold, R. (1999). Correlation between protein and mRNA abundance in yeast. Mol. Cell. Biol. 19:1720. doi: 10.1128/MCB.19.3.1720
Hajduch, M., Hearne, L. B., Miernyk, J. A., Casteel, J. E., Joshi, T., Agrawal, G. K., et al. (2010). Systems analysis of seed filling in Arabidopsis: using general linear modeling to assess concordance of transcript and protein expression. Plant Physiol. 152, 2078. doi: 10.1104/pp.109.152413
Handakumbura, P., Matos, D., Osmont, K., Harrington, M., Heo, K., Kafle, K., et al. (2013). Perturbation of Brachypodium distachyon CELLULOSE SYNTHASE A4 or 7 results in abnormal cell walls. BMC Plant Biol. 13:131. doi: 10.1186/1471-2229-13-131
Handakumbura, P. P., Brow, K., Whitney, I. P., Zhao, K., Sanguinet, K. A., Lee, S. J., et al. (2018). SECONDARY WALL ASSOCIATED MYB1 is a positive regulator of secondary cell wall thickening in Brachypodium distachyon and is not found in the Brassicaceae. Plant J. 96, 532–545. doi: 10.1111/tpj.14047
Harris, D. M., Corbin, K., Wang, T., Gutierrez, R., Bertolo, A. L., Petti, C., et al. (2012). Cellulose microfibril crystallinity is reduced by mutating C-terminal transmembrane region residues CESA1(A903V) and CESA3(T942I) of cellulose synthase. Proc. Natl. Acad. Sci. U.S.A. 109, 4098–4103. doi: 10.1073/pnas.1200352109
Hussey, S. G., Mizrachi, E., Spokevicius, A. V., Bossinger, G., Berger, D. K., and Myburg, A. A. (2011). SND2, a NAC transcription factor gene, regulates genes involved in secondary cell wall development in Arabidopsis fibres and increases fibre cell area in Eucalyptus. BMC Plant Biol. 11:173. doi: 10.1186/1471-2229-11-173
Jarvis, M. C. (2013). Cellulose biosynthesis: counting the chains. Plant Physiol. 163, 1485–1486. doi: 10.1104/pp.113.231092
Joshi, C. P., Thammannagowda, S., Fujino, T., Gou, J.-Q., Avci, U., Haigler, C. H., et al. (2011). Perturbation of wood cellulose synthesis causes pleiotropic effects in transgenic aspen. Mol. Plant 4, 331–345. doi: 10.1093/mp/ssq081
Kasirajan, L., Hoang, N. V., Furtado, A., Botha, F. C., and Henry, R. J. (2018). Transcriptome analysis highlights key differentially expressed genes involved in cellulose and lignin biosynthesis of sugarcane genotypes varying in fiber content. Sci. Rep. 8:11612. doi: 10.1038/s41598-018-30033-4
Kirst, M., Myburg, A., De Leon, J., Kirst, M., Scott, J., and Sederoff, R. (2004). Coordinated genetic regulation of growth and lignin revealed by quantitative trait locus analysis of cDNA microarray data in an interspecific backcross of eucalyptus. Plant Physiol. 135, 2368–2378. doi: 10.1104/pp.103.037960
Kotake, T., Aohara, T., Hirano, K., Sato, A., Kaneko, Y., Tsumuraya, Y., et al. (2011). Rice brittle culm 6 encodes a dominant-negative form of CesA protein that perturbs cellulose synthesis in secondary cell walls. J. Exp. Bot. 62, 2053–2062. doi: 10.1093/jxb/erq395
Kubo, M., Udagawa, M., Nishikubo, N., Horiguchi, G., Yamaguchi, M., Ito, J., et al. (2005). Transcription switches for protoxylem and metaxylem vessel formation. Genes Dev. 19, 1855–1860. doi: 10.1101/gad.1331305
Kujur, A., Bajaj, D., Upadhyaya, H. D., Das, S., Ranjan, R., Shree, T., et al. (2015). A genome-wide SNP scan accelerates trait-regulatory genomic loci identification in chickpea. Sci. Rep. 5:11166. doi: 10.1038/srep11166
Kumar, M., and Turner, S. (2015). Plant cellulose synthesis: CESA proteins crossing kingdoms. Phytochemistry 112, 91–99. doi: 10.1016/j.phytochem.2014.07.009
Lalanne, J.-B., Taggart, J. C., Guo, M. S., Herzel, L., Schieler, A., Li, G.-W. (2018). Evolutionary convergence of pathway-specific enzyme expression stoichiometry. Cell 173, 749.e738–761.e738. doi: 10.1016/j.cell.2018.03.007
Little, A., Schwerdt, J. G., Shirley, N. J., Khor, S. F., Neumann, K., Donovan, L. A., et al. (2018). Revised phylogeny of the cellulose synthase gene superfamily: insights into cell wall evolution. Plant Physiol. 177, 1124–1141. doi: 10.1104/pp.17.01718
Loudet, O., Chaillou, S., Camilleri, C., Bouchez, D., and Daniel-Vedele, F. (2002). Bay-0 × Shahdara recombinant inbred line population: a powerful tool for the genetic dissection of complex traits in Arabidopsis. Theor. Appl. Genet. 104, 1173–1184. doi: 10.1007/s00122-001-0825-9
Mazarei, M., Baxter, H. L., Li, M., Biswal, A. K., Kim, K., Meng, X., et al. (2018). Functional analysis of cellulose synthase CesA4 and CesA6 genes in switchgrass (Panicum virgatum) by overexpression and RNAi-Mediated gene silencing. Front. Plant. Sci. 9:114. doi: 10.3389/fpls.2018.01114
Mitsuda, N., Iwase, A., Yamamoto, H., Yoshida, M., Seki, M., Shinozaki, K., et al. (2007). NAC transcription factors, NST1 and NST3, are key regulators of the formation of secondary walls in woody tissues of Arabidopsis. Plant Cell 19, 270–280. doi: 10.1105/tpc.106.047043
Mueller, S. C., and Brown, R. M. (1980). Evidence for an intramembrane component associated with a cellulose microfibril-synthesizing complex in higher plants. J. Cell Biol. 84, 315. doi: 10.1083/jcb.84.2.315
Nakano, Y., Yamaguchi, M., Endo, H., Rejab, N. A., and Ohtani, M. (2015). NAC-MYB-based transcriptional regulation of secondary cell wall biosynthesis in land plants. Front. Plant Sci. 6:288. doi: 10.3389/fpls.2015.00288
Nixon, B. T., Mansouri, K., Singh, A., Du, J., Davis, J. K., Lee, J.-G., et al. (2016). Comparative structural and computational analysis supports eighteen cellulose synthases in the plant cellulose synthesis complex. Sci. Rep. 6:28696. doi: 10.1038/srep28696
Ohashi-Ito, K., Oda, Y., and Fukuda, H. (2010). Arabidopsis VASCULAR-RELATED NAC-DOMAIN6 directly regulates the genes that govern programmed cell death and secondary wall formation during xylem differentiation. Plant Cell 22, 3461–3473. doi: 10.1105/tpc.110.075036
O’Malley, R. C., Huang, S. C., Song, L., Lewsey, M. G., Bartlett, A., Nery, J. R., et al. (2016). Cistrome and epicistrome features shape the regulatory DNA landscape. Cell 165, 1280–1292. doi: 10.1016/j.cell.2016.04.038
Palle, S. R., Seeve, C. M., Eckert, A. J., Wegrzyn, J. L., Neale, D. B., and Loopstra, C. A. (2013). Association of loblolly pine xylem development gene expression with single-nucleotide polymorphisms. Tree Physiol. 33, 763–774. doi: 10.1093/treephys/tpt054
Persson, S., Wei, H., Milne, J., Page, G. P., and Somerville, C. R. (2005). Identification of genes required for cellulose synthesis by regression analysis of public microarray data sets. Proc. Natl. Acad. Sci. U.S.A. 102, 8633–8638. doi: 10.1073/pnas.0503392102
Pruneda-Paz, J. L., Breton, G., Para, A., and Kay, S. A. (2009). A functional genomics approach reveals CHE as a component of the Arabidopsis circadian clock. Science 323, 1481–1485. doi: 10.1126/science.1167206
Pyo, H., Demura, T., and Fukuda, H. (2007). TERE; a novel cis-element responsible for a coordinated expression of genes related to programmed cell death and secondary wall formation during differentiation of tracheary elements. Plant J. 51, 955–965. doi: 10.1111/j.1365-313X.2007.03180.x
Rao, X., and Dixon, R. A. (2018). Current models for transcriptional regulation of secondary cell wall biosynthesis in grasses. Front. Plant Sci. 9:399. doi: 10.3389/fpls.2018.00399
Ruprecht, C., Mutwil, M., Saxe, F., Eder, M., Nikoloski, Z., and Persson, S. (2011). Large-scale co-expression approach to dissect secondary cell wall formation across plant species. Front. Plant Sci. 2:23. doi: 10.3389/fpls.2011.00023
Scheible, W. R., Eshed, R., Richmond, T., Delmer, D., and Somerville, C. R. (2001). Modifications of cellulose synthase confer resistance to isoxaben and thiazolidinone herbicides in Arabidopsis Ixr1 mutants. Proc. Natl. Acad. Sci. U.S.A. 98, 10079–10084. doi: 10.1073/pnas.191361598
Serapiglia, M. J., Cameron, K. D., Stipanovic, A. J., and Smart, L. B. (2012). Correlations of expression of cell wall biosynthesis genes with variation in biomass composition in shrub willow (Salix spp.) biomass crops. Tree Genet. Genomes 8, 775–788. doi: 10.1007/s11295-011-0462-7
Shiringani, A. L., and Friedt, W. (2011). QTL for fibre-related traits in grain × sweet sorghum as a tool for the enhancement of sorghum as a biomass crop. Theor. Appl. Genet. 123:999. doi: 10.1007/s00122-011-1642-4
Sindhu, A., Langewisch, T., Olek, A., Multani, D. S., McCann, M. C., Vermerris, W., et al. (2007). Maize brittle Stalk2 encodes a COBRA-like protein expressed in early organ development but required for tissue flexibility at maturity. Plant Physiol. 145, 1444–1459. doi: 10.1104/pp.107.102582
Somerville, C. (2006). Cellulose synthesis in higher plants. Annu. Rev. Cell Dev. Biol. 22, 53–78. doi: 10.1146/annurev.cellbio.22.022206.160206
Soto-Suárez, M., Serrato, A. J., Rojas-González, J. A., Bautista, R., and Sahrawy, M. (2016). Transcriptomic and proteomic approach to identify differentially expressed genes and proteins in Arabidopsis thaliana mutants lacking chloroplastic 1 and cytosolic FBPases reveals several levels of metabolic regulation. BMC Plant Biol. 16:258. doi: 10.1186/s12870-016-0945-7
Spitzer, M., Wildenhain, J., Rappsilber, J., and Tyers, M. (2014). BoxPlotR: a web tool for generation of box plots. Nat. Methods 11, 121–122. doi: 10.1038/nmeth.2811
Tan, H.-T., Shirley, N. J., Singh, R. R., Henderson, M., Dhugga, K. S., Mayo, G. M., et al. (2015). Powerful regulatory systems and post-transcriptional gene silencing resist increases in cellulose content in cell walls of barley. BMC Plant Biol. 15:62. doi: 10.1186/s12870-015-0448-y
Tanaka, K., Murata, K., Yamazaki, M., Onosato, K., Miyao, A., and Hirochika, H. (2003). Three distinct rice cellulose synthase catalytic subunit genes required for cellulose synthesis in the secondary wall. Plant Physiol. 133, 73–83. doi: 10.1104/pp.103.022442
Taylor, N. G., Howells, R. M., Huttly, A. K., Vickers, K., and Turner, S. R. (2003). Interactions among three distinct CesA proteins essential for cellulose synthesis. Proc. Natl. Acad. Sci. U.S.A. 100, 1450–1455. doi: 10.1073/pnas.0337628100
Taylor, N. G., Laurie, S., and Turner, S. R. (2000). Multiple cellulose synthase catalytic subunits are required for cellulose synthesis in Arabidopsis. Plant Cell 12, 2529–2540. doi: 10.1105/tpc.12.12.2529
Taylor-Teeples, M., Lin, L., de Lucas, M., Turco, G., Toal, T. W., Gaudinier, A., et al. (2015). An Arabidopsis gene regulatory network for secondary cell wall synthesis. Nature 517, 571–575. doi: 10.1038/nature14099
Thomas, L., Forsyth, T., Šturcová, A., Kennedy, C., May, R., Altaner, C., et al. (2013). Structure of cellulose microfibrils in primary cell walls from collenchyma1. Plant Physiol. 161, 465–476. doi: 10.1104/pp.112.206359
Timmers, J., Vernhettes, S., Desprez, T., Vincken, J.-P., Visser, R. G. F., and Trindade, L. M. (2009). Interactions between membrane-bound cellulose synthases involved in the synthesis of the secondary cell wall. FEBS Lett. 583, 978–982. doi: 10.1016/j.febslet.2009.02.035
Updegraff, D. (1969). Semimicro determination of cellulose in biological materials. Anal. Biochem. 32, 420–424. doi: 10.1016/S0003-2697(69)80009-6
Vuylsteke, M., and van Eeuwijk, F. (2008). The use of general and specific combining abilities in a context of gene expression relevant to plant breeding. Euphytica 161, 115–122. doi: 10.1007/s10681-007-9452-0
Washburn, M. P., Koller, A., Oshiro, G., Ulaszek, R. R., Plouffe, D., Deciu, C., et al. (2003). Protein pathway and complex clustering of correlated mRNA and protein expression analyses in Saccharomyces cerevisiae. Proc. Natl. Acad. Sci. U.S.A. 100, 3107–3112. doi: 10.1073/pnas.0634629100
West, M., Kim, K., Kliebenstein, D., van Leeuwen, H., Michelmore, R., Doerge, R., et al. (2007). Global eQTL mapping reveals the complex genetic architecture of transcript-level variation in Arabidopsis. Genetics 175, 1441–1450. doi: 10.1534/genetics.106.064972
Yamaguchi, M., Goue, N., Igarashi, H., Ohtani, M., Nakano, Y., Mortimer, J. C., et al. (2010). VASCULAR-RELATED NAC-DOMAIN6 (VND6) and VND7 effectively induce transdifferentiation into xylem vessel elements under control of an induction system. Plant Physiol. 153, 906–914. doi: 10.1104/pp.110.154013
Yang, S. S., Xu, W. W., Tesfaye, M., Lamb, J. F. S., Jung, H.-J. G., VandenBosch, K. A., et al. (2010). Transcript profiling of two alfalfa genotypes with contrasting cell wall composition in stems using a cross-species platform: optimizing analysis by masking biased probes. BMC Genomics 11:323. doi: 10.1186/1471-2164-11-323
Yao, D., Wei, Q., Xu, W., Syrenne, R., Yuan, J., and Su, Z. (2012). Comparative genomic analysis of NAC transcriptional factors to dissect the regulatory mechanisms for cell wall biosynthesis. BMC Bioinformatics 13:S10. doi: 10.1186/1471-2105-13-S15-S10
Ye, Y., Wu, K., Chen, J., Liu, Q., Wu, Y., Liu, B., et al. (2018). OsSND2, a NAC family transcription factor, is involved in secondary cell wall biosynthesis through regulating MYBs expression in rice. Rice 11:36. doi: 10.1186/s12284-018-0228-z
Zan, Y., Shen, X., Forsberg, S. K. G., Carlborg, Ö. (2016). Genetic regulation of transcriptional variation in natural Arabidopsis thaliana accessions. G3 6:2319. doi: 10.1534/g3.116.030874
Zhang, M., Zhang, B., Qian, Q., Yu, Y., Li, R., Zhang, J., et al. (2010). Brittle culm 12, a dual-targeting kinesin-4 protein, controls cell-cycle progression and wall properties in rice. Plant J. 63, 312–328. doi: 10.1111/j.1365-313X.2010.04238.x
Zhang, J., Xie, M. A., Tuskan, G., Muchero, W., and Chen, J.-G. (2018). Recent advances in the transcriptional regulation of secondary cell wall biosynthesis in the woody plants. Front. Plant Sci. 9:135. doi: 10.3389/fpls.2018.01535
Zhao, H., Wang, B., He, J., Yang, J., Pan, L., Sun, D., et al. (2013). Genetic diversity and population structure of Miscanthus sinensis germplasm in China. PLoS One 8:e75672. doi: 10.1371/journal.pone.0075672
Zhong, R., Lee, C., and Ye, Z. H. (2010). Global analysis of direct targets of secondary wall NAC master switches in Arabidopsis. Mol. Plant 3, 1087–1103. doi: 10.1093/mp/ssq062
Keywords: CELLULOSE SYNTHASE A4, NAC transcription factor, expression QTL, VNS element, tracheary element-regulating cis-element
Citation: Olins JR, Lin L, Lee SJ, Trabucco GM, MacKinnon KJ-M and Hazen SP (2018) Secondary Wall Regulating NACs Differentially Bind at the Promoter at a CELLULOSE SYNTHASE A4 Cis-eQTL. Front. Plant Sci. 9:1895. doi: 10.3389/fpls.2018.01895
Received: 11 October 2018; Accepted: 06 December 2018;
Published: 21 December 2018.
Edited by:
Charles T. Anderson, Pennsylvania State University, United StatesReviewed by:
Nobutaka Mitsuda, National Institute of Advanced Industrial Science and Technology (AIST), JapanKanwarpal Singh Dhugga, Consultative Group on International Agricultural Research (CGIAR), United States
Copyright © 2018 Olins, Lin, Lee, Trabucco, MacKinnon and Hazen. This is an open-access article distributed under the terms of the Creative Commons Attribution License (CC BY). The use, distribution or reproduction in other forums is permitted, provided the original author(s) and the copyright owner(s) are credited and that the original publication in this journal is cited, in accordance with accepted academic practice. No use, distribution or reproduction is permitted which does not comply with these terms.
*Correspondence: Samuel P. Hazen, aGF6ZW5AYmlvLnVtYXNzLmVkdQ==
†These authors have contributed equally to this work