 Nicolò G. M. Cultrera1
 Vania Sarri2
 Livia Lucentini2
 Marilena Ceccarelli2
 Fiammetta Alagna3
 Roberto Mariotti1*
 Soraya Mousavi1
 Consolacion Guerrero Ruiz1
 Luciana Baldoni1
- 1Institute of Biosciences and Bioresources, National Research Council, Perugia, Italy
- 2Department of Chemistry, Biology and Biotechnology, University of Perugia, Perugia, Italy
- 3ENEA Italian National Agency for New Technologies Energy and Sustainable Economic Development, Trisaia Research Center, Rotondella, Italy
Gene sequence variation in cultivated olive (Olea europaea L. subsp. europaea var. europaea), the most important oil tree crop of the Mediterranean basin, has been poorly evaluated up to now. A deep sequence analysis of fragments of four genes, OeACP1, OeACP2, OeLUS and OeSUT1, in 90 cultivars, revealed a wide range of polymorphisms along all recognized allele forms and unexpected allele frequencies and genotype combinations. High linkage values among most polymorphisms were recorded within each gene fragment. The great sequence variability corresponded to a low number of alleles and, surprisingly, to a small fraction of genotype combinations. The distribution, frequency, and combination of the different alleles at each locus is possibly due to natural and human pressures, such as selection, ancestrality, or fitness. Phylogenetic analyses of allele sequences showed distant and complex patterns of relationships among cultivated olives, intermixed with other related forms, highlighting an evolutionary connection between olive cultivars and the O. europaea subspecies cuspidata and cerasiformis. This study demonstrates how a detailed and complete sequence analysis of a few gene portions and a thorough genotyping on a representative set of cultivars can clarify important issues related to sequence polymorphisms, reconstructing the phylogeny of alleles, as well as the genotype combinations. The identification of regions representing blocks of recombination could reveal polymorphisms that represent putatively functional markers. Indeed, specific mutations found on the analyzed OeACP1 and OeACP2 fragments seem to be correlated to the fruit weight.
Introduction
Cultivated olive (Olea europaea L. subsp. europaea var. europaea) is the most important oil tree crop of the Mediterranean basin. The species is characterized by an unusually rich germplasm, represented by a high number of traditional varieties, vegetatively propagated over 1000s of years (Baldoni et al., 2006), showing a patchy pattern of geographical distribution (Besnard et al., 2013; Diez et al., 2015; Mousavi et al., 2017). The origin and distribution of this genetic variation in the Mediterranean basin remain unclear. According to the most accredited hypotheses, the olive tree cultivation was introduced from the Near East, recognized as the first center of domestication during the early Neolithic period (Kaniewski et al., 2012; Zohary et al., 2012; Besnard et al., 2013, 2018; Mousavi et al., 2017). Multiple domestication events, probably, took place in different areas of the Mediterranean basin, with crosses among ancient varieties and wild plants (O. europaea subsp. europaea var. sylvestris, named as oleaster), followed by empirical local selection, probably associated to episodic varietal substitution, leading to the current varietal framework (Breton et al., 2009; Besnard et al., 2013, 2018; Hosseini-Mazinani et al., 2014; Diez et al., 2015).
Since this complex germplasm represents a valuable source of useful traits, a great effort is required to explore, manage, characterize and identify all genotypes. Molecular markers currently available for such purposes are still represented by some di-nucleotide microsatellites (Baldoni et al., 2009), small sets of poly-nucleotide EST-SSRs recently developed (de la Rosa et al., 2013a; Mariotti et al., 2016; Arbeiter et al., 2017) and lately by few nuclear SNPs (single nucleotide polymorphisms). These markers were identified on olive gene sequences and they have been used for cultivar genotyping (Reale et al., 2006; Consolandi et al., 2007; Hakim et al., 2009; Rossi et al., 2012; Kaya et al., 2013; Sabetta et al., 2013; Kalogianni et al., 2015; Uncu et al., 2015; Bazakos et al., 2016), or to reconstruct the phylogenetic relationships within the olive complex (Besnard et al., 2007; Besnard and El Bakkali, 2014; Biton et al., 2015).
Recently, next-generation sequencing technologies have been applied to discover polymorphisms at transcriptome and whole-genome level (Unver et al., 2017; Belaj et al., 2018). The efficiency of sequencing and SNP genotyping methodologies has rapidly increased, therefore, it is reasonable to expect that, due to their ubiquity in the genome, SNPs will soon become valuable markers for olive cultivar identification (Ben-Ari and Lavi, 2012; Cruz et al., 2016; Ipek et al., 2016; Marchese et al., 2016; Belaj et al., 2018). However, a high level of genome sequence information is required to identify and validate SNPs. For this reason, it is necessary to expand knowledge on the level and distribution of polymorphisms within gene sequences, mainly when genome data are still incomplete and referred to a few genotypes, as is the case of olive (Cruz et al., 2016; Unver et al., 2017). Valuable information on gene structure and allele arrangement will allow the discrimination among gene copies, as well as the identification of polymorphisms with a potential functional value (Swanson-Wagner et al., 2010; Lamesch et al., 2012; Luo et al., 2017; Mourad et al., 2018).
As already quoted, SNPs can be used to clarify the phylogenetic relationships among taxa (Andrello et al., 2017; Zhou et al., 2018), whereas gene phylogenies allowed to investigate the impact of selective pressure on single genes or members of gene families (Doebley et al., 2006; Fischer et al., 2011). A deep analysis of nuclear gene sequences could also reveal patterns of genome diversity useful for detecting selective sweeps or documenting the impact of genetic bottlenecks during domestication events (Wright et al., 2005; Fu, 2012; Liao et al., 2013; Nimmakayala et al., 2014; Huber et al., 2016; Marsden et al., 2016).
Taking this into account, an in-depth characterization of sequence portions of four genes in olive was undertaken in this work. Two acyl carrier protein (ACP) genes (Cultrera et al., 2014; De Marchis et al., 2016), a gene encoding for the sucrose transporter 1 (SUT1) (Conde et al., 2007) and another for lupeol synthase (LUS) (Alagna et al., 2015) were chosen on the basis of their proven functional role. Products of ACPs are essential cofactors involved in chloroplast fatty acid (FA) synthesis and desaturation, as well as in other metabolic pathways (Harwood, 1996; Suh et al., 1999; Byers and Gong, 2007; Li-Beisson et al., 2010; Tranbarger et al., 2011). The functional study of olive ACP loci showed that OeACP2 was mainly expressed during fruit development, suggesting its involvement in FA synthesis for triacylglycerol accumulation (Cultrera et al., 2014), meanwhile the overexpression of OeACP1 in tobacco plants resulted in a significant increase of oleic and linolenic acids (De Marchis et al., 2016). The SUT1 gene codes for a protein representing a central machinery for mediating sucrose cross-membrane transport into cells and distributing sugars throughout the plant (Dusotoit-Coucaud et al., 2009). Different loci have been identified among woody plants (Decourteix et al., 2006; Fan et al., 2009; Afoufa-Bastien et al., 2010). In olive, only a partial complementary DNA clone of SUT1 has been characterized (Conde et al., 2007; Alagna et al., 2012). The LUS gene, coding for an oxidosqualene cyclase (Shibuya et al., 1999; Sawai et al., 2006; Geisler et al., 2011), is involved in the production of a triterpene compound that strongly influences olive oil health quality (Saleem, 2009). Up to now, its sequence has been the most widely investigated in olive to search for polymorphisms useful for genotyping purposes (Reale et al., 2006; Hakim et al., 2009; Besnard and El Bakkali, 2014).
Polymorphic fragments of these genes were deeply analyzed within a large set of olive varieties, with the aims to: (i) understand the level of genomic variation within the chosen fragments; (ii) assign the alleles to each olive varieties; (iii) understand evolutionary and phylogenetic relationships among haplotypes, and (iv) verify potential correlations between detected polymorphisms and phenotypic traits.
Materials and Methods
Plant Material
A set of 90 olive varieties was included in the analysis (Table 1). DNA samples were derived from the olive DNA repository established at CNR – Institute of Biosciences and Bioresources (Perugia, Italy). Genetic identity of most varieties was previously ascertained through the use of well-established SSR markers (Sarri et al., 2006; Baldoni et al., 2009), whereas the others were directly genotyped for this work by means of the same set of markers (data not shown). Taking into account the clonal origin of olive cultivars, a single representative per cultivar was considered. To verify data repeatability, cultivars Oueslati and Zaity were analyzed twice. Samples of O. europaea subsp. cuspidata from Nepal and subsp. cerasiformis from the Canary Islands were used to clarify the ancestry and the phylogenetic relationships of the cultivar allele groups, whereas one sample of the related species Olea paniculata, belonging to the subgenus Paniculatae (Green, 2002), was used as an outgroup. Subspecies and O. paniculata samples also derived from the CNR-IBBR DNA repository.
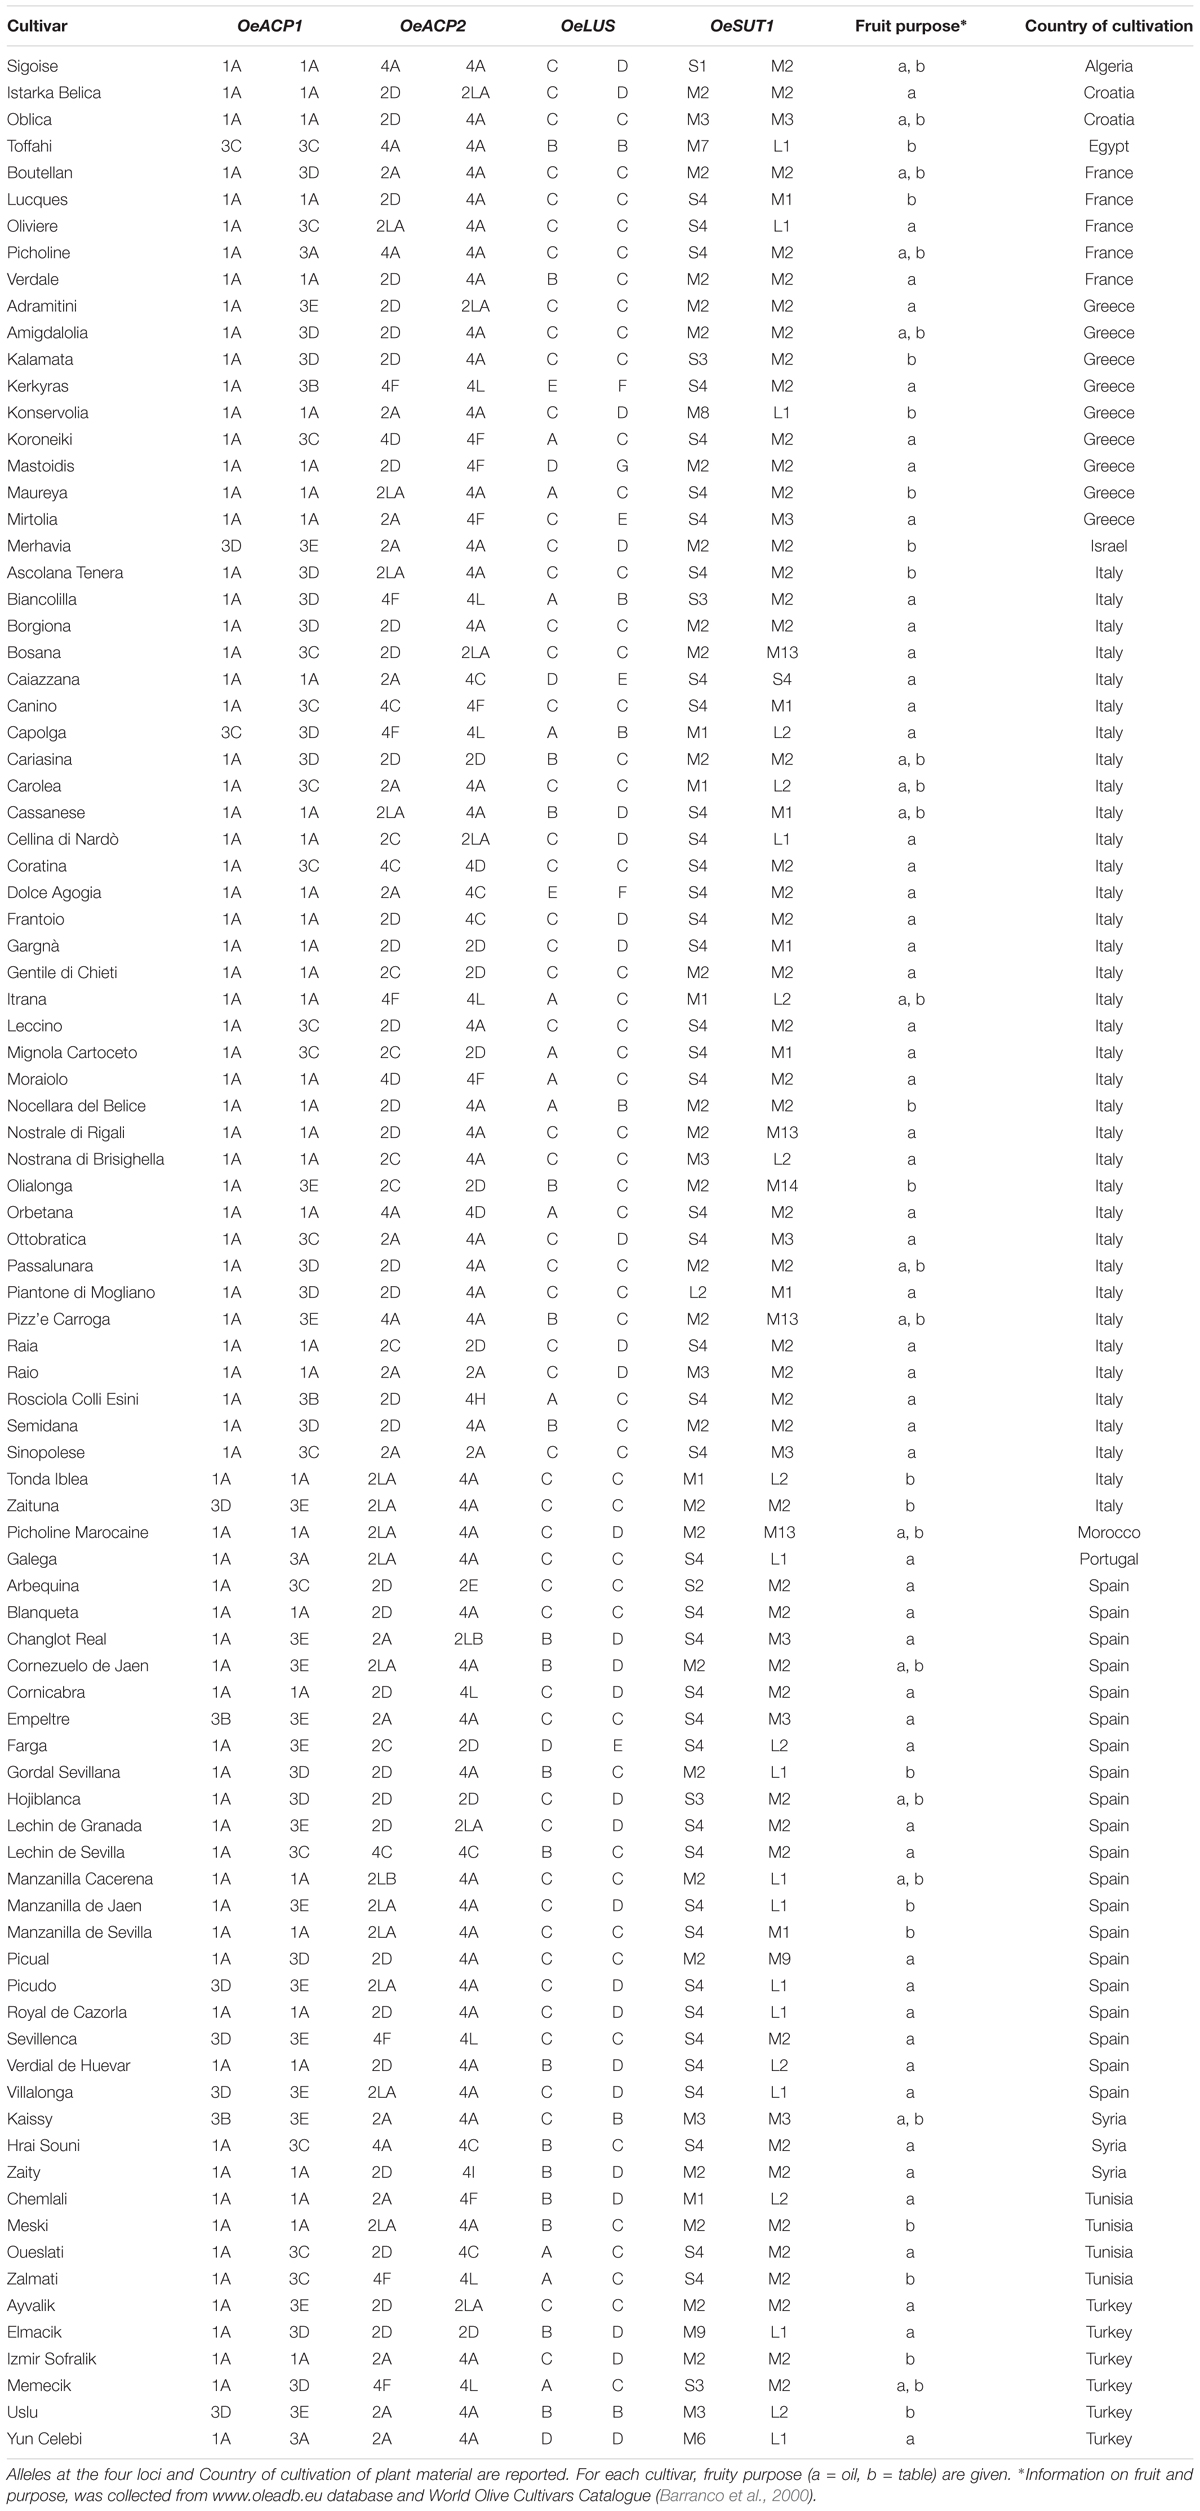
Table 1. List of the olive cultivars investigated.
PCR Amplification and Haplotype Characterization
The different gene portions were amplified from DNA of cv. Leccino, considering the availability of a good alignment of the genomic sequence of this cultivar (Barghini et al., 2014; Muleo et al., 2016).
The isolation of four OeACP1 and OeACP2 alleles was described in Cultrera et al. (2014), and their sequences were deposited in NCBI database (Accession Nos. KF303531–KF303532–KF303533–KF303534, respectively). The allele alignment for each gene allowed the detection of the polymorphic regions. A region was selected which includes different types of polymorphisms, including part of the first intron, the entire second exon and a large part of the second intron. Locus-specific primers were designed to amplify this partial gene sequences.
In order to obtain polymorphic LUS and SUT1 gene fragments, primers were designed on their cDNA sequences (AB025343.1 and DQ087178.1 at GenBank, respectively).
Amplifications were initially performed on a subset of 20 cultivars. PCR amplifications were carried out in a reaction volume of 25 μl containing 25 ng of template DNA, 2.5 μl of 10× PCR buffer, 0.5 mM of each dNTP, 1 μM of each primer and 1.0 U of GoTaq (Promega). Amplifications were performed on a thermal cycler PCR System 9600 (Applied Biosystems, Foster City, CA, United States), using the following cycling conditions: initial denaturation at 95°C for 5 min, followed by 50 cycles of 95°C for 30 s, 59°C for 30 s and 72°C for 90 s, with a final elongation at 72°C for 10 min. Amplicons of different lengths were obtained. Considering that different fragment lengths prevent direct sequencing, in order to identify and distinguish the two alleles at each of the 20 diploid genotypes, amplicons of each locus were cloned, by using pGEM-T Easy Vector (Promega) and E. coli XL1 blue strain. DNA from 10 colonies for each genotype was amplified using the ExTaq (Takara) following the manufacturer instructions for the reaction and PCR amplification. Direct sequencing in both directions of the PCR products was performed on an ABI 3130 Genetic Analyzer (Applied Biosystems-Hitachi, United States) using the ABI Prism BigDye Terminator v.3.1 Ready Reaction Cycle Sequencing Kit (Applied Biosystems). To evaluate the presence of polymorphisms, sequences were aligned by BioEdit 7.1.7 (BioEdit1) and by Geneious 6.1.6 (Geneious2). Afterward, new allele-specific primers were designed and applied to amplify distinct alleles at each locus in all 90 cultivars (Supplementary Table S1). The PCR products were directly sequenced. For varieties carrying alleles of the same length but showing nucleotide polymorphisms, their amplicons were cloned again, in order to assign each of them to a distinct allele.
In order to verify whether the obtained alleles effectively belong to a single locus, a co-segregation analysis was performed by genotyping 94 individuals of a F1 intervarietal cross progeny (Leccino × Dolce Agogia), through length and SNP markers at each locus heterozygous in at least one parental variety (data not shown).
The same cloning strategy was also applied to obtain at least one allele for each sample of the O. europaea subspecies cuspidata and cerasiformis and the related species O. paniculata.
The obtained sequences were used as queries in a BLAST search on the genome of the cultivars Farga (3Cruz et al., 2016) and Leccino (4Muleo et al., 2012), and O. europaea subsp. europaea var. sylvestris5,6, in order to find the position of these genes on the chromosome.
Data Analysis
At each locus, the number of SNPs, indels, SSRs and repeats was calculated. The frequency of polymorphisms was obtained by the ratio between number of polymorphisms and total fragment length. Linkage analysis among polymorphisms was evaluated through MapMaker/EXP Version 3.0b (Sharma and Kaur, 2014).
DnaSP was used to calculate the linkage disequilibrium (LD) among polymorphisms at each locus. The degree of LD was estimated by calculating r2 parameters and computing a non-linear regression line. The 180 fragments sequenced for each gene were analyzed, as well as the haplotypes inferred by the software. Due to the nature of the analyzed fragments, in this manuscript the terms ‘allele’ and ‘haplotype’ have been used as synonymous. The same software was used to detect the degree of intragenic recombination (IR) in real and inferred haplotypes at the four loci using genotypic data with the r2 parameter. The same software was used for haplotype reconstruction which was implemented by PHASE with 1,000 iterations, thinning intervals equal to 10 and 1,000 burn-in iterations, and either forcing or not the program to use the naive Gibbs sampler (GS options) (Stephens and Donnelly, 2003). The two-tailed Fisher’s exact test and the chi-square test were used to determine whether the associations between polymorphic sites were significant.
Median joining phylogenetic networks based on SNP and length markers for each allele were obtained by Network 4.6.11 software (Bandelt et al., 1999), including in the analysis one allele of the O. paniculata sample, used as an out-group, and one allele for each of the two subspecies cuspidata and cerasiformis.
The evolutionary history was inferred using the Neighbor-Joining method by MEGA7 software (Kumar et al., 2016). The optimal tree, related to all gene fragments, with the sum of branch length = 0.1183 is shown. The tree was drawn to scale branch lengths at the same units as those of the evolutionary distances used to infer the phylogenetic tree. The evolutionary distances were computed using the Maximum Composite Likelihood method and were given as units of the number of base substitutions per site. The analysis involved 90 nucleotide sequences for the total length of analyzed fragments. The bootstrap analysis was done by using 1,000 replicates. All the others NJ trees, including the analysis of haplotypes for each gene and the OeACP1–OeACP2 for 56 genotypes, were analyzed by following the same parameters through the same software.
To assess whether signatures of positive selection or demographic processes were present in each of the four candidate loci, three neutrality tests were separately performed (Tajima’s D, Fu and Li’s D and Fu and Li’s F) (Tajima, 1989; Fu and Li, 1993) on exons and introns of gene fragments, by using DnaSP 5.10.01 software (Librado and Rozas, 2009). Tajima’s D statistic is the most widely used neutrality test, while Fu and Li’s D is based on the fact that singletons, i.e., polymorphisms that only affect one individual in a sample, play a special role in the history of a population.
Following the neutrality test results, to verify the presence of any genotype/phenotype correlation for OeACP genes, a subset of 56 varieties from the Olive Varietal Collection established in Zagaria (Enna, Italy) was phenotyped for FA composition and fruit weight. Fruit samples were collected from two plants per cultivar, for 2 years and two dates/year. Methods of analysis refer to de la Rosa et al. (2013b). Based on biochemical data, cultivars were grouped into three classes for each trait (fresh fruit weight, percentage of palmitic, palmitoleic and oleic acids) (Supplementary Table S2). The range of each class was established taking into account that the distance between two consecutive classes was higher than the minimal difference within each class (Supplementary Table S3) and according to the data from Oleadb database7.
Furthermore, Box and Whisker plots were chosen to graphically show the correlations between genotype and phenotypic traits (Fisher et al., 2016). For each independent SNP or different groups of linkage, Box and Whisker plots were made by comparing distributions of each SNP genotype versus phenotypic trait by means of PAST 3.20 (Hammer et al., 2001). Differences among distributions of phenotypic traits disaggregated by genotypes were tested through Mann–Whitney test conducted through PAST 3.20. The marker effect estimates for each genotypic class (homozygous or heterozygous) for each SNP were estimated using the software package TASSEL 3.0 (Bradbury et al., 2007).
Finally, TASSEL was used to establish genotype/phenotype relationships by using the association analyses with general linear model (GLM) and mixed lineage model (MLM), the latter only for significant correlations by using kinship matrix obtained by the same software. A Q matrix was built by using the Bayesian model-based approach and the “Clustering with linked loci” module, as implemented in BAPS 6.0 (Corander et al., 2008), inferring hidden genetic structure for OeACP1 and OeACP2 genes, separately. This software uses a Bayesian model that accounts for the linkage present between polymorphic sites within aligned sequences. For each gene, BAPS carried out a genetic mixture analysis to determine the best partition of the data into K groups. The mixture analysis was run with 100 iterations, the input number of reference genotypes from each group was 10; the input number of iterations for reference genotype was 100, the minimum size of a group was 10. Subsequently, BAPS carried out a genetic admixture analysis to estimate admixture proportions within each genotype, taking into consideration the most likely number of K groups identified previously. TASSEL genotype alignments were first filtered using minimum counts of 56 sequences, with a minimum SNP frequency of 0.05 (minor allele frequencies were excluded due to instability), including all sites for each fragment.
Results
Identification of Gene Sequence Polymorphisms
Combined approaches, including cloning and direct sequencing performed by means of locus- and allele-specific primers, allowed us to distinguish all alleles at the four loci on 90 olive cultivars. Nucleotide diversity in the gene fragments is summarized in Table 2. Polymorphisms at each allele, their position on the sequence, amino acid changes and recombination sites are reported in Supplementary Table S4. As expected, nucleotide variations within introns were more numerous and informative than those within exons. In fact, the coding regions, representing a relatively short portion (20.4%) of the total length of the analyzed sequences, carried about 8.7% of variations, exclusively represented by SNPs. Conversely, introns carried most of polymorphisms (91.3%), including SNPs, indels, tandem repeats and simple sequence repeats (SSRs). The 196 total polymorphisms consisted of 174 SNPs, 13 indels, one tandem sequence found in OeSUT1, and eight SSRs, the latter exclusively present in the OeACP2 fragment.
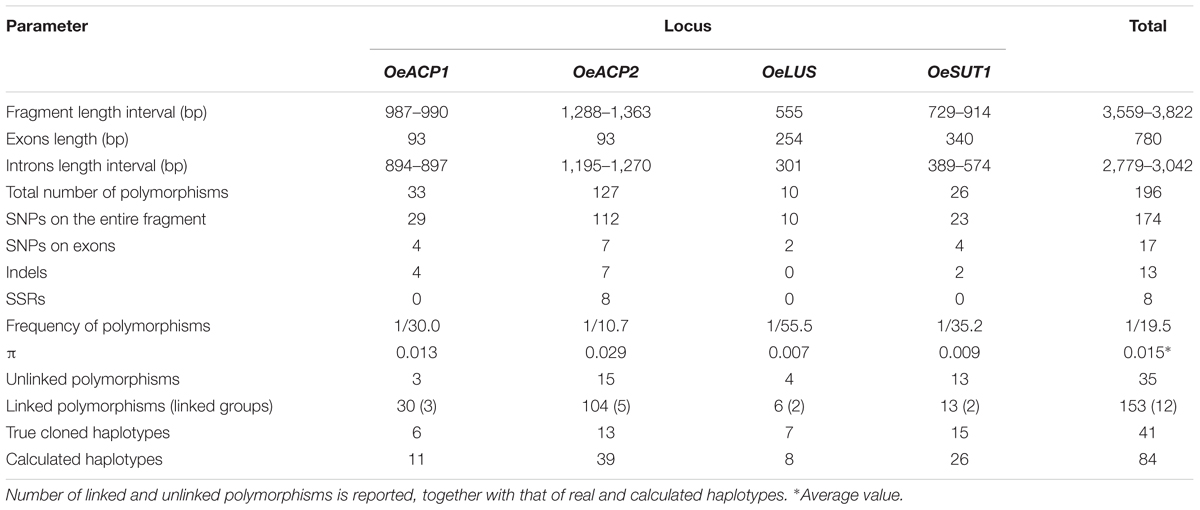
Table 2. Nucleotide diversity within the analyzed gene fragments.
Single nucleotide polymorphism frequency was 7.9 times higher than length polymorphisms (indels, repeated sequences, and SSRs). The variation density was one polymorphism every 19.5 bp (only one every 21.9 bp for SNPs), one every 45.9 bp on exons and one every 17 bp on introns. The 17 SNPs detected in coding regions included 11 transitions and six transversions, leading to amino acid changes only in the OeACP gene fragments, as detailed below.
OeACP1
The analysis of the OeACP1 allele fragments, with a maximum length of 990 bp, revealed 29 SNPs and four indels, giving a frequency of one polymorphism every 30 bp. A high degree of linkage was observed: on the 33 polymorphisms, only two SNPs at positions 407 and 503 and one indel at position 537 were unlinked, whereas the remaining (90.9%) were grouped in three linkage groups.
OeACP2
The OeACP2 allele fragments, with a maximum length of 1,363 bp, showed higher variability than that found in the other loci. The 127 polymorphisms included 112 SNPs, seven indels and eight SSRs, with a frequency of one polymorphism every 10.7 bp. The OeACP2 fragments carried insertions and various microsatellite regions, made up of mono-, di-, and tri-nucleotide motifs. As for OeACP1, a high linkage degree was observed: 104 polymorphisms (81.9%) were linked in five linkage groups.
OeLUS
In this gene fragment (555 bp), ranging from the seventh exon to a portion of the ninth exon, only 10 nucleotide mutations were detected, with a frequency of one every 55.5 bp. Four SNPs were unlinked, whereas the remaining were grouped into two linkage groups.
OeSUT1
Overall, the sequence analysis of the OeSUT1 allele fragments (maximum length of 914 bp) revealed 23 SNPs, two indels of 1 and 19 bp, respectively, and a motif of 166 bp that in some cultivars was repeated twice in a head-tail arrangement, generating a tandem repeated sequence. The alignment of the isolated gene fragments with the SUT1 sequence of other plant species – i.e., Populus trichocarpa (HM749897.1), Spinacia oleracea (X67125.1), Vitis vinifera (HQ323258.1), or Verbascum phoeniceum (FJ797307.1) – showed that the first exon of the olive gene was divided into two portions by a tandem repeated sequence made up of a 166 bp motif. By aligning this sequence with the collection of repetitive DNA elements of Dfam database (Dfam8), it was not identified as a part of a transposable element. The frequency of polymorphisms was one every 35.2 bp. Fifty percent of polymorphisms were linked into two linkage groups. No linked SNPs were found among the four gene fragments.
Characterization of Alleles and Genotypes
The list of alleles found at each locus, along with the corresponding GenBank accession numbers, is reported in Supplementary Table S5. A maximum of two alleles for each variety was observed, as expected in a diploid species as olive. A non-negligible percentage of homozygosity was detected (29.2% in total, apportioned as 41.1% in OeACP1, 12.2% in OeACP2, 38.9% in OeLUS, and 24.4% in OeSUT1). The co-segregation analysis of alleles confirmed that all four genes effectively belong to four distinct loci (data not shown).
OeACP1
Six alleles, clustered in two groups, were found for OeACP1. The allele named 1A was clearly distinct from the others, due to two deletions at positions 306 and 802 (TGTTGTT and TAG, respectively) and a 12 bp insertion at position 485, joined with 23 linked SNPs. Three out of the four indels were linked. The other alleles belonged to the same group called 3 (3A, 3B, 3C, 3D, 3E), and were distinguished among each other by a few polymorphisms. Three out of four polymorphisms found in exon two generated three amino acid changes (Supplementary Table S4): threonine instead of asparagine in allele 3B (position 217); proline (non-polar and hydrophobic) to arginine (basic, with an amine group in the side chain; position 259) and proline to serine (polar and hydrophilic; position 279), both in 1A allele, the most widely diffused among the analyzed cultivars, reaching 64% of total alleles. Data suggest that alleles did not combine randomly within the analyzed cultivars. In fact, a low number of allele combinations (genotypes) was observed: only 10 out of the 21 possible genotypes (47.6%) were detected. The homozygous 1A represented 40% of total genotypes, followed by 1A-3D and 1A-3C (both 16.7%) (Figure 1A, Table 1, and Supplementary Table S4).
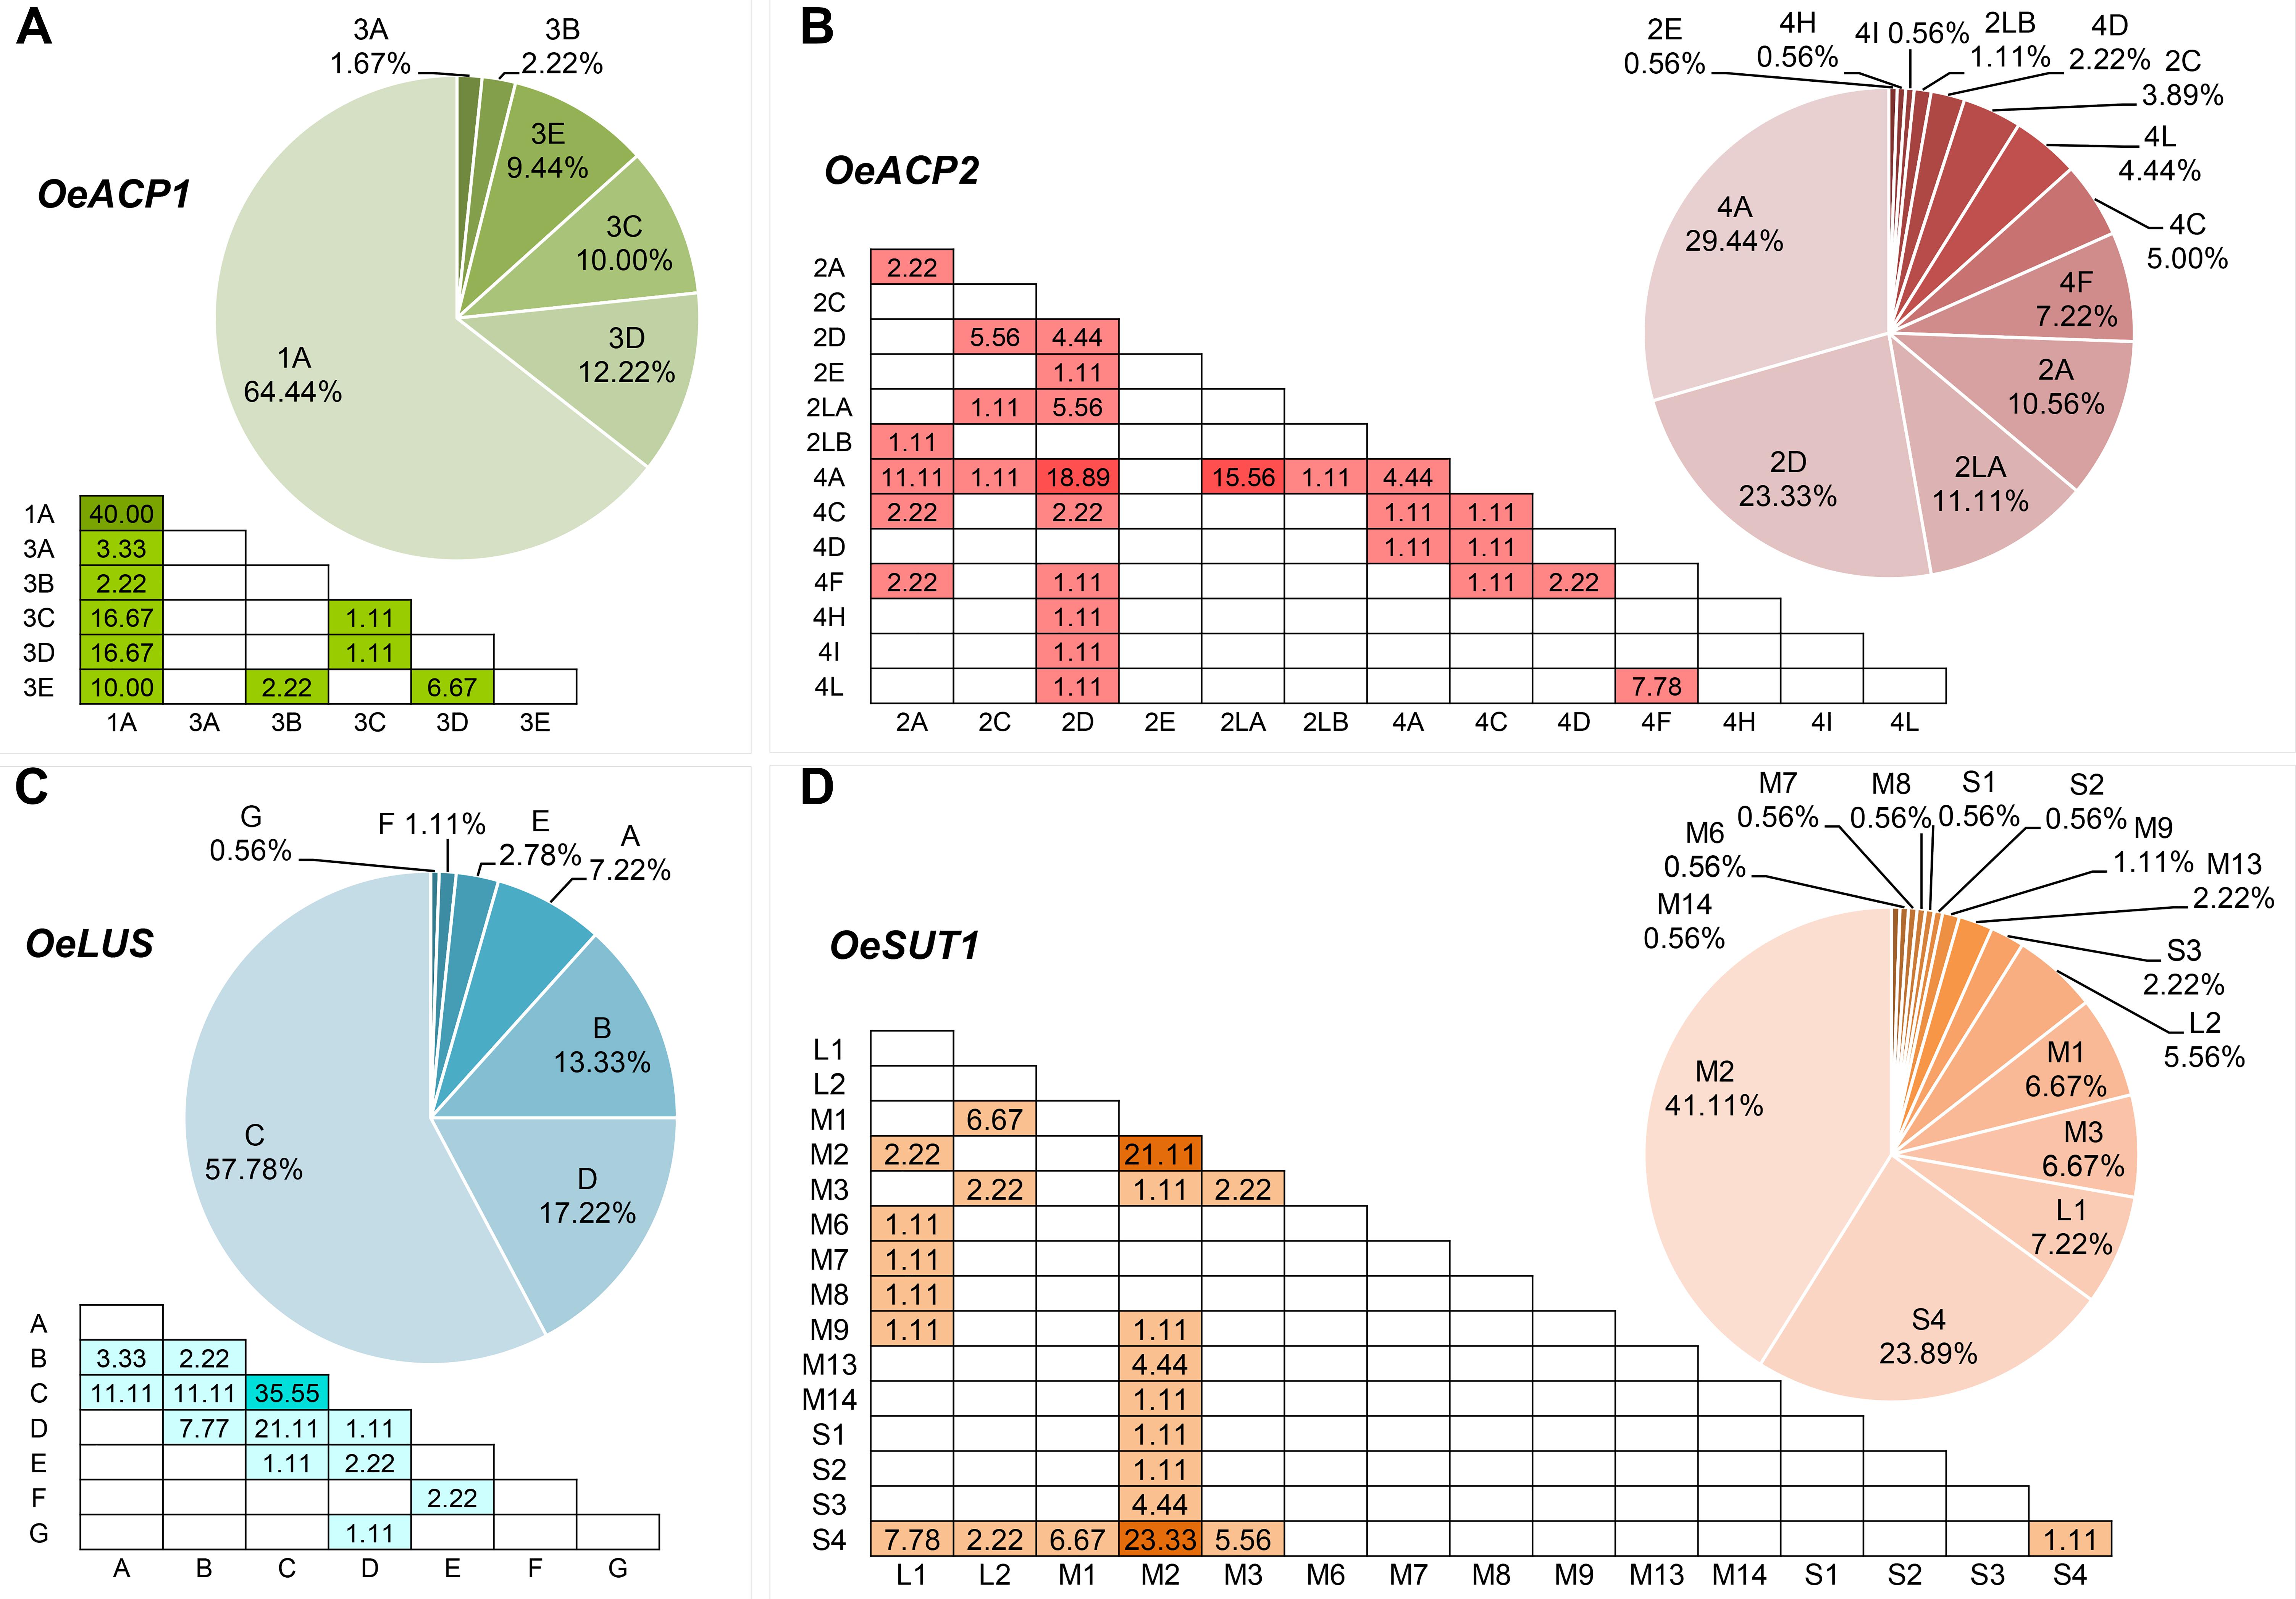
Figure 1. Haplotype (pie charts) and genotype (triangular matrices) frequencies at the four loci (A–D) in the 90 cultivars under study. Darker background colors in genotype matrices indicate the most frequent allele combinations.
OeACP2
This locus showed 13 alleles clustered into three groups. These latter were initially recognized based on distribution of indels and the structure of a highly polymorphic SSR region starting from nucleotide 688 (Supplementary Table S4). Six out of the seven indels were linked with many SNPs and microsatellites, and distinguished the alleles of group 4 (4A, 4C, 4D, 4F, 4H, 4I, 4L) from those forming the second group (2A, 2C, 2D, 2E). The third group included the two longest alleles, 2LA and 2LB, differing from each other by a CTT microsatellite motif (at 688 bp), repeated 18 and 19 times respectively. The seven polymorphisms found in exon 2 gave rise to five amino acid changes: two of them (valine/alanine and isoleucine/valine), determined by SNPs at position 257 and 337, distinguished the alleles 4C and 4F, respectively, and did not cause polarity change. Three out of the seven polymorphisms characterized the shortest alleles of group 2. The first, at position 262, produced aspartic acid (acidic with a carboxylic group in the side chain) instead of asparagine (polar and hydrophilic); the second, at position 292, produced arginine (basic with an amine group in the side chain) instead of glycine (polar and hydrophilic); and the third, at position 318, encoded phenylalanine in place of leucine. Some alleles were widely distributed within varieties, with frequencies exceeding 29% for 4A and 23% for 2D, whereas most of the other alleles were very poorly represented, being found in two (2LB) or just one cultivar (2E, 4H, and 4I). Also in OeACP2 alleles did not combine randomly. In fact, only 27 out of the possible 91 genotypes (29.7%) were found in our sample set. Out of these, the most frequent genotype was 2D-4A (18.9%), derived from the combination of the most frequent alleles (Figure 1B, Table 1, and Supplementary Table S4).
OeLUS
The 10 SNPs detected in the amplified fragment distinguished seven alleles, named from A to G. The two polymorphisms found in exon 8 did not cause any amino acid change. Allele C showed the highest frequency (approximately 58% of total alleles), and only 12 of the possible 28 genotypes were observed, the most common being C–C, shared by the 35% of cultivars (Figure 1C, Table 1, and Supplementary Table S4).
OeSUT1
Based on the length polymorphisms, OeSUT1 alleles were divided into three groups: long (L), medium (M), and small (S). Length differences between S and M alleles were due to a 19 bp indel, whereas L alleles contained a duplication of a 166 bp motif in respect to M alleles. SNPs in the exon sequences did not produce any amino acid change. The M group represented 60% of total alleles and, within this group, M2 showed the highest frequency. The S alleles represented 27% of the total, and the two L alleles only the remaining 13%. No random combinations of OeSUT1 alleles were observed, in fact, only 22 out of the possible 120 (18.3%) genotypes were identified. The most frequent genotypes were M2-S4 and M2-M2. Taken together, they represented more than 44% of the observed ones (Figure 1D, Table 1, and Supplementary Table S4).
The three neutrality tests applied to gene polymorphisms showed significant high and positive scores for OeACP1 and OeACP2 loci compared to those of the other two genes, in particular after the Tajima’s D test (4.11 for OeACP1 and 3.75 for OeACP2, 1.04 for OeLUS and 1.81 for OeSUT1; p < 0.001) (Supplementary Figure S1).
Linkage Disequilibrium, Intragenic Recombination, and Gene Phylogeny
The number of calculated haplotypes detected by the DnaSP program was much higher than that of the true ones identified by cloning and sequencing at all gene fragments, except for OeLUS (Table 2). LD analysis at each locus showed a different decay pattern between true and calculated haplotypes except for OeLUS. Decay of true haplotypes remained almost constant for the entire fragment length in ACP genes and increased in OeSUT1, meanwhile decay of true OeLUS and all calculated loci significantly decreased (Figure 2).
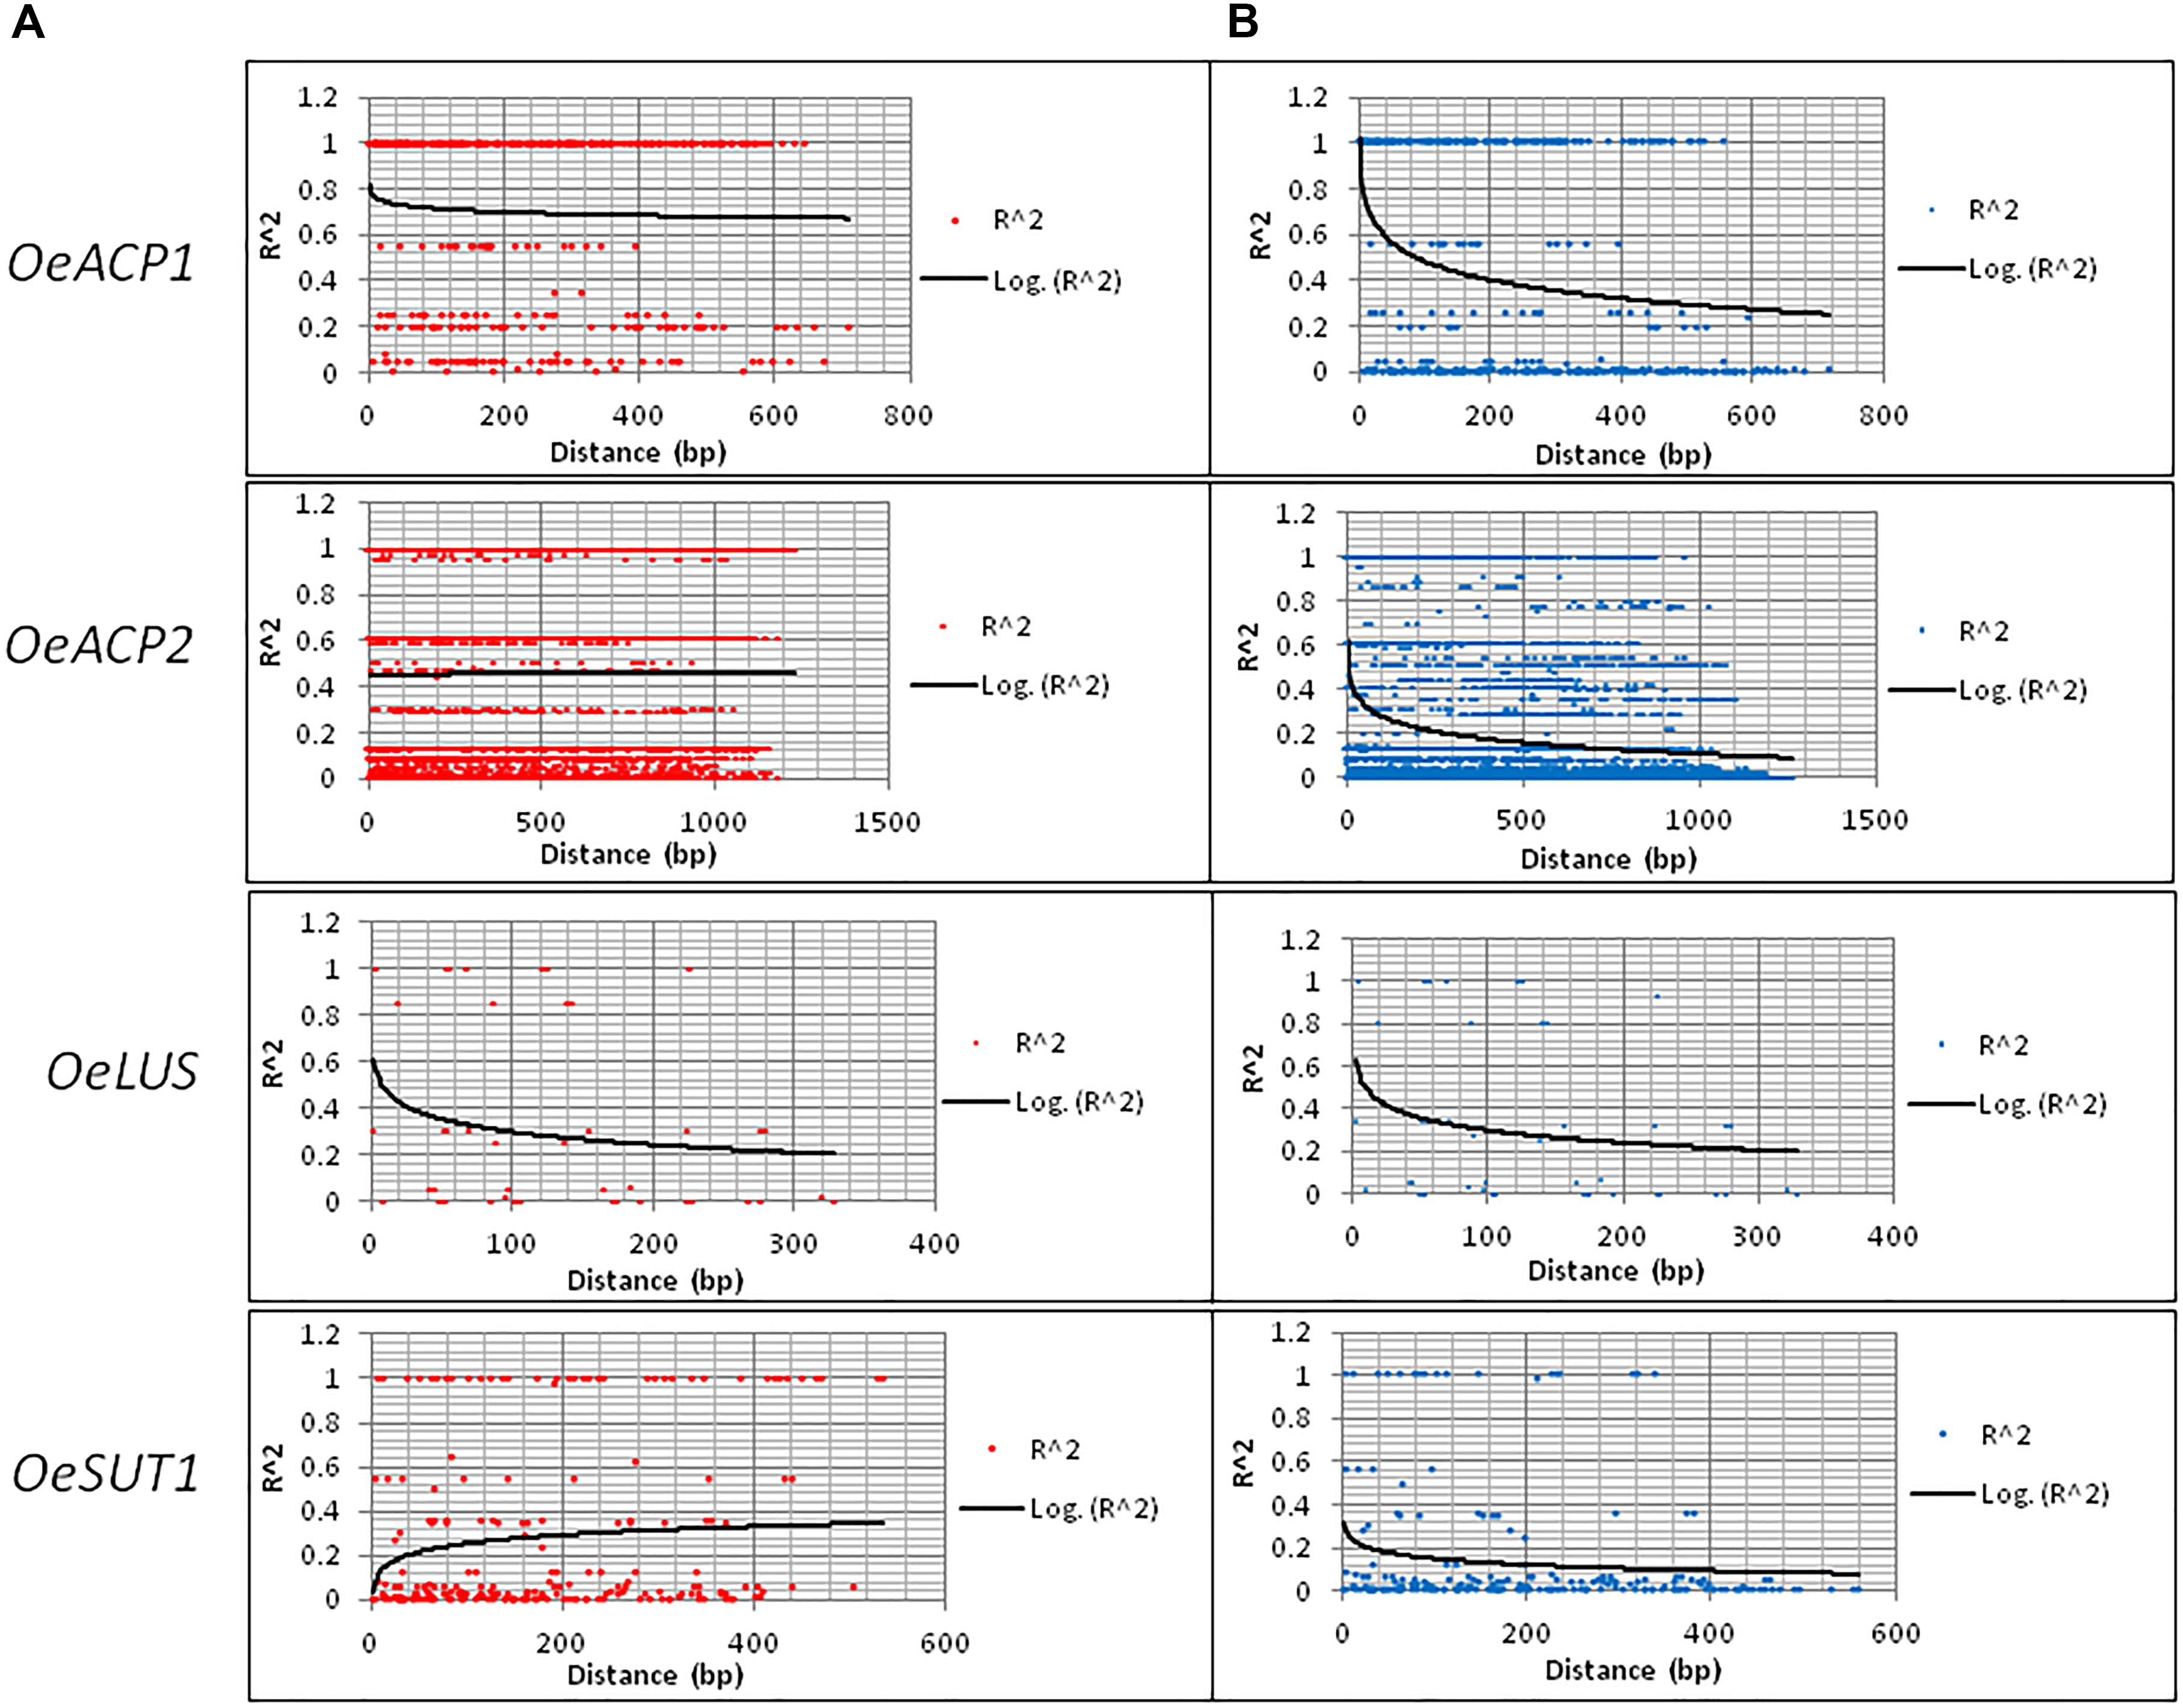
Figure 2. LD decay along the four loci based on real (A) and calculated (B) haplotypes. LD was measured by calculating r2 values and computing a non-linear regression line. Real haplotypes refer to those derived from cloning and direct sequencing, while the calculated ones are based on DnaSP analysis of genotypes.
The analyzed OeACP1 and OeLUS regions were not involved in any recombination event (RE), each representing a ‘haplotype block.’ In OeACP2, the IR for calculated haplotypes was 0.252, while the IR obtained with real haplotypes was 0.023, corresponding to a calculated minimum number of 19 recombination events versus the true five ones. The latter were located at 140–147, 147–151, 318–348, 348–470, and 851–1,167 bp. Interestingly, one of them included the last part of the second exon (from 318 to 337 bp). All the other OeACP2 portions represented haplotype blocks. In OeSUT1, the IR value was four times higher in calculated versus true haplotypes, and the only RE was located at 259–566 bp, in the intron region containing the 166 bp repeated motif (Supplementary Table S4).
A locus-by-locus phylogeny analysis was assessed, both my NJ analysis based on allele sequences for each gene and by Network results. The most parsimonious networks (based on SNP, indel and SSR polymorphisms), linking the sequences at each locus, are shown in Figure 3 and Supplementary Figure S2. Most alleles at each gene fragment were scattered into well-separated sub-branches. In OeACP1, allele 1A was derived from an unknown primordial form, even considering that the two subspecies are located between allele 1A and the alleles of group 3. The ancestral form of all alleles of group 3 seemed to be 3A allele. In OeACP2, a complex network was found: the cuspidata allele is located as the ancestral form of the entire group 4, whereas the cerasiformis allele appeared as the ancestral form of group 2, with the exception of the two longest alleles (2LA and 2LB), whose separation from the other alleles of group 2 was sustained by a bootstrap value of 100% (Supplementary Figures S1, S2). The OeLUS alleles were clearly divided into two clades, one including cuspidata and A and B alleles, the other including E allele, followed by C allele that gave rise to F, G, D alleles and, interestingly, cerasiformis allele was located in this clade. In OeSUT1, alleles also grouped into two branches, one including the four S alleles, the other the M and L alleles. The phylogeny of this branch was clearly defined, starting from M13, a sub-branch led to L2 and L1 alleles, whereas a second sub-branch led to all other M alleles, up to M2 and M14. The cuspidata allele was located between the short and long-medium alleles. It was not possible to amplify cerasiformis allele for OeSUT1.
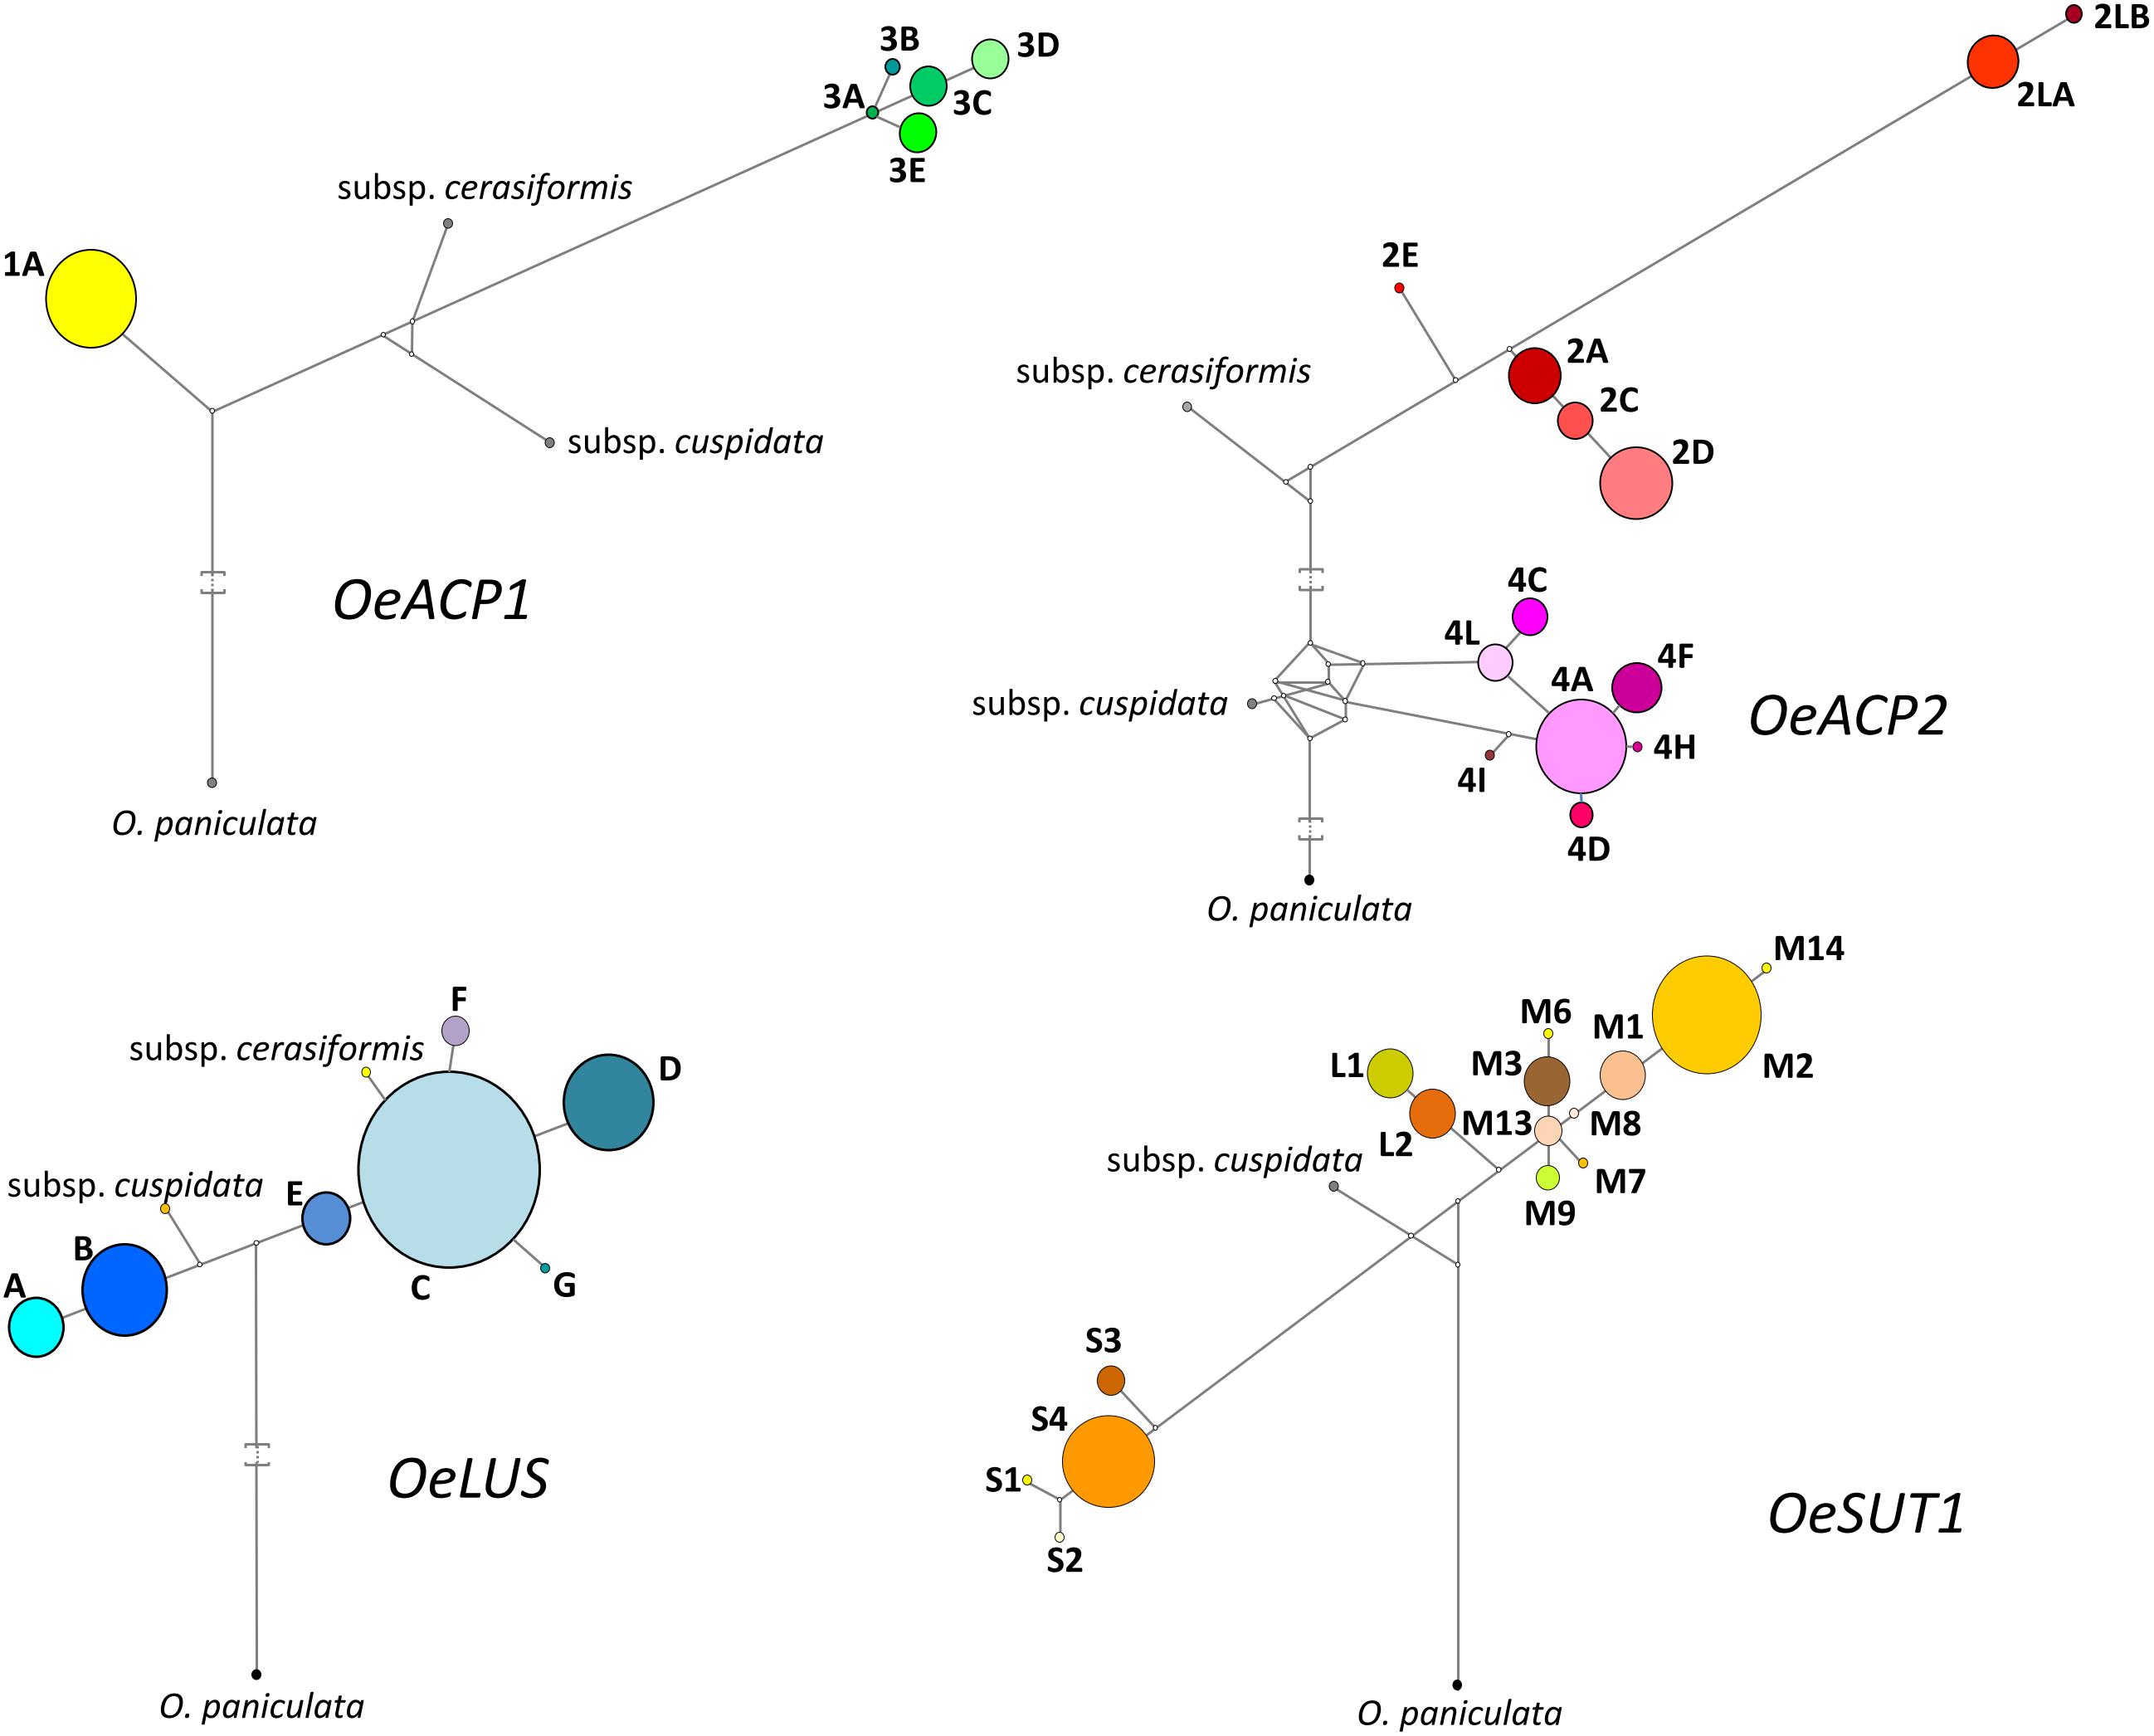
Figure 3. Most parsimonious networks obtained by Network 4.6.11 using SNPs and length polymorphisms for each allele at the four loci. Each haplotype is represented by a colored circle, whose size is related to the frequency within the 90 olive cultivars dataset. Branch length is proportional to the number of mutations. Median vectors (white nodes) correspond to possible extant unsampled or extinct ancestral sequences.
A survey of genotypes at the four loci in all the analyzed cultivars (Table 1), showed that the most widespread alleles of each gene (OeACP1-1A, OeACP2-4A, OeLUS-C, OeSUT1-M2) (Figure 1), were combined together in the 26% of the cultivars. Instead, the allele combinations including OeACP1-1A, OeACP2-4A, or OeLUS-C alleles were shown by 40% of the cultivars considered in this study. At a general extent, no clear relationship was found between the allele combination and geographical distribution.
Discrimination Power and Genotype/Phenotype Correlations
The polymorphisms identified in the analyzed gene regions were able to distinguish 92.2% of cultivars, as illustrated in the Neighbor Joining tree, harboring five main clusters (Figure 4). Within three of them, some cultivars, i.e., Borgiona-Passalunara-Amigdalolia and Picudo-Villalonga, were not discriminated by gene markers whereas resulted as distinct genotypes by means of standard SSRs. Instead, the Adramitini-Ayvalik group resulted identical by SSRs (Trujillo et al., 2014) and by the new set of markers. Thirteen varieties were distinguished by using just one polymorphism (SNP or indel) and only two were sufficient to distinguish 32 cultivars (Supplementary Table S6), demonstrating their potential as genotyping markers.
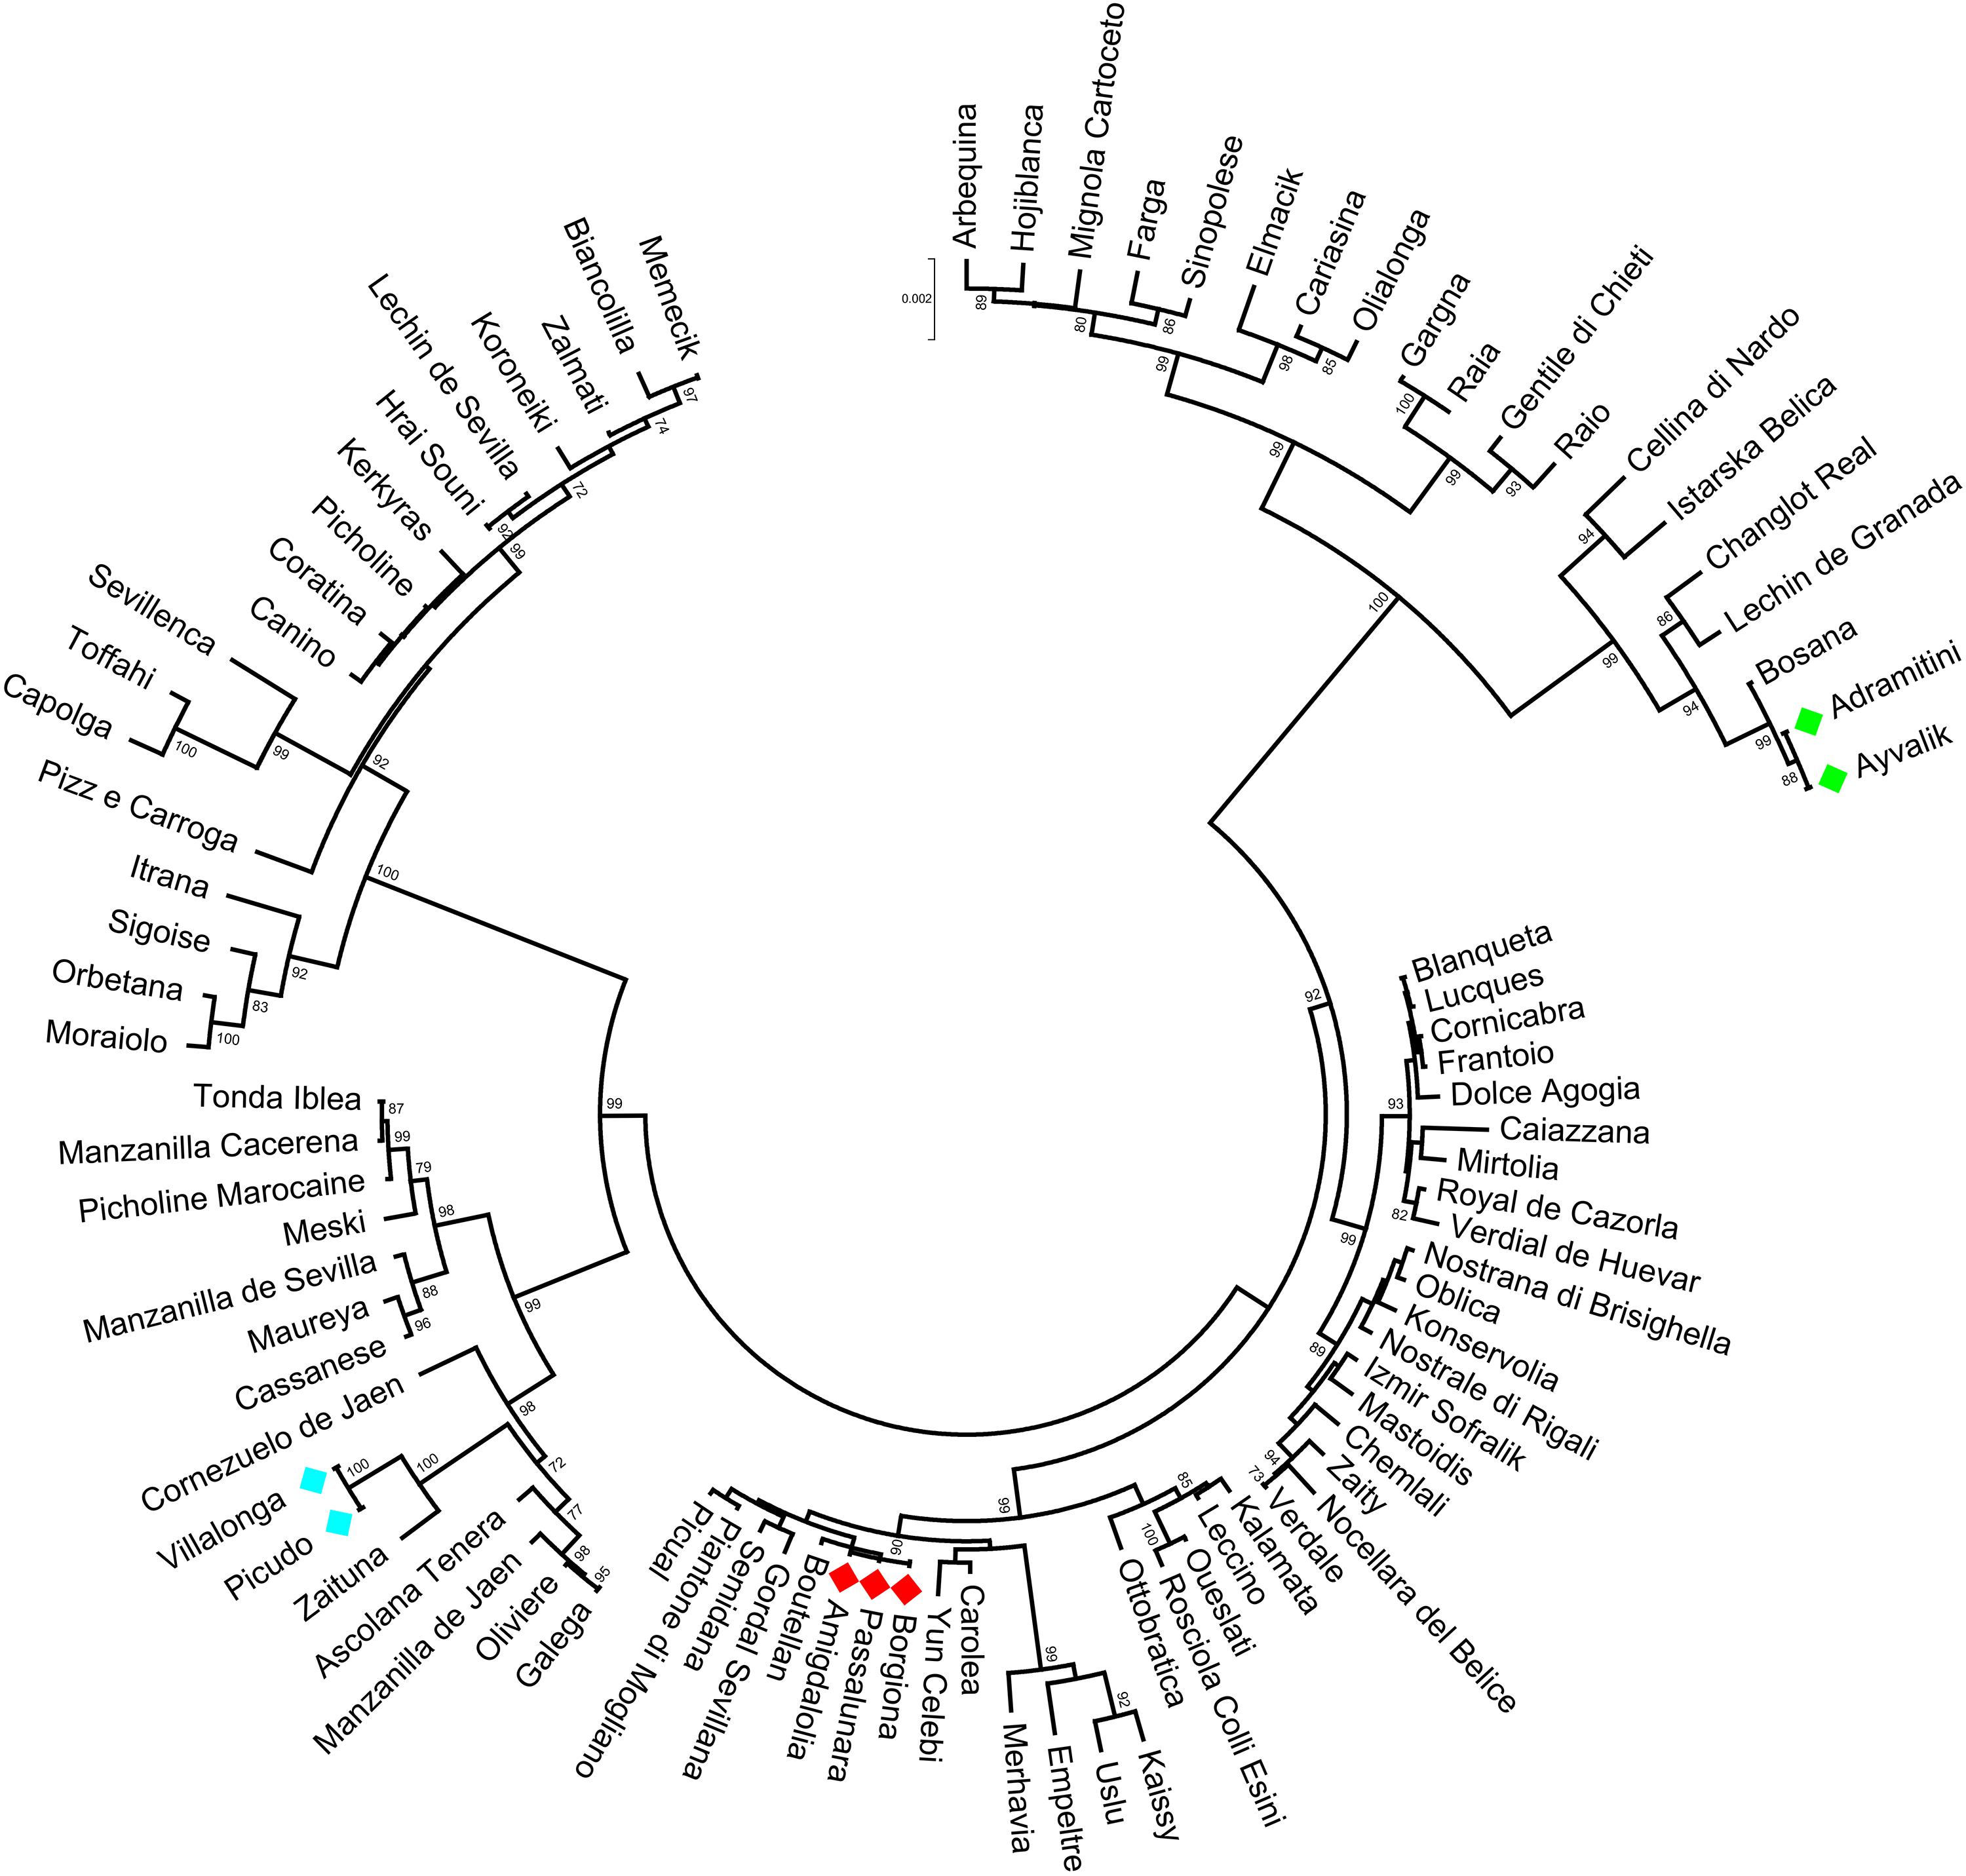
Figure 4. Circle dendrogram obtained by MEGA7 software with Neighbor Joining method showing the relationships among the cultivars analyzed based on total gene sequences. The bootstrap value is showed (cut-off > 70).
Taking into account the neutrality tests results, indicating that OeACP loci were target of artificial selection, the possible correlations between these loci and interesting phenotype traits were evaluated.
The graphical representation in Box and Whisker plots, performed by merging the OeACP1 and OeACP2 loci polymorphisms with the phenotype data of 56 varieties (Figure 5), showed two cases of positive relationships for OeACP1 SNP 407 (characterizing the genotype combinations with 3D allele) and for OeACP2 SNP 869 (characterizing the combinations with 4F allele) with fruit weight (Figure 5A), and three cases of SNPs at positions 147, 688, and 851 of OeACP2, related to palmitoleic acid (C16:1) percentage (Figure 5B).
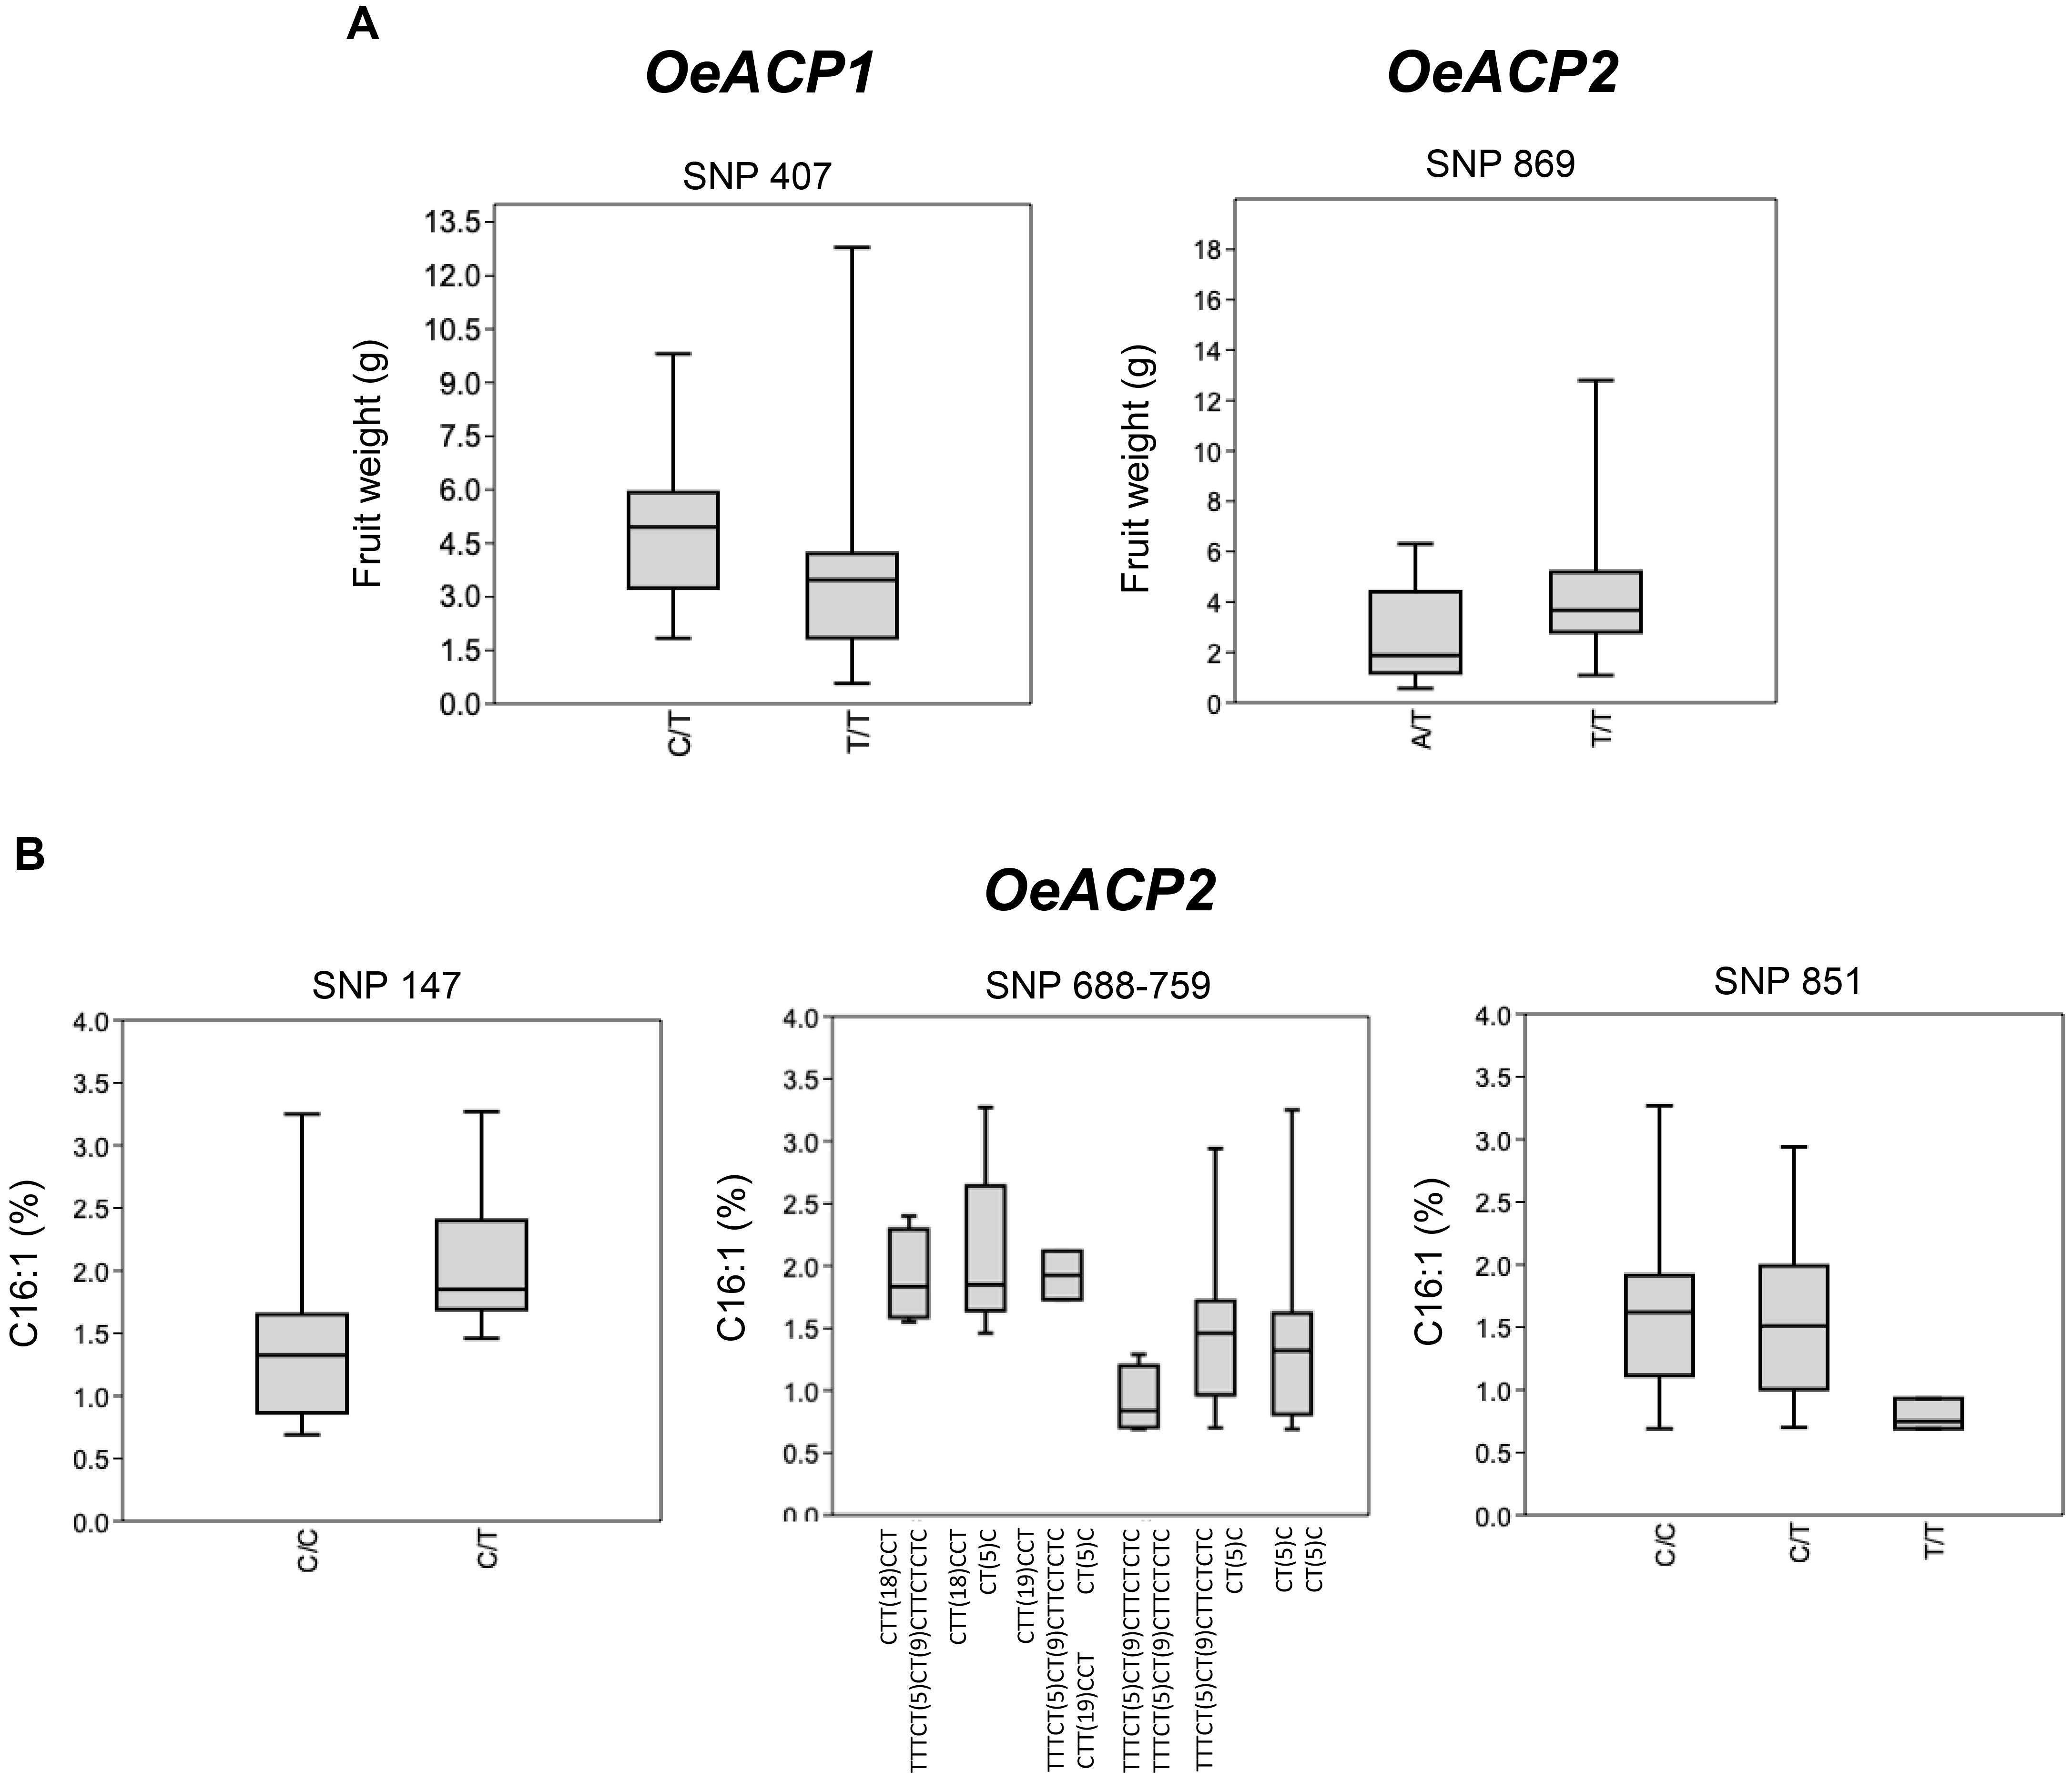
Figure 5. Box and Whisker plot graphs showing the distribution trend of best SNP candidates of OeACP1 and OeACP2 versus the studied phenotypic traits. (A) Fresh weight; (B) palmitoleic acid. Square boxes represent the trend for most samples. These plots display the five-number summary of a set of data: the minimum and maximum, the first quartile, the median and third quartile allowing a comprehensive data comparison. Mann–Whitney test results showing significant differences (p < 0.05) among phenotypic distribution disaggregated on the basis of the reported SNPs.
When the functional contribution of polymorphisms at each ACP locus was evaluated by TASSEL following GLM analysis, significant relationships were confirmed only for the fruit weight trait both for OeACP1 (p = 0.033) and OeACP2 (p = 0.047) (Supplementary Table S7). These two possible associations were also tested by MLM analysis considering also the kinship matrix. Even though the best linked polymorphisms remained the same, both p-values increased and went out from the significance (p = 0.622 and 0.162, respectively).
An additional Neighbor Joining tree (Supplementary Figure S3) was obtained by merging OeACP1 and OeACP2 sequences of 56 cultivars, in order to verify if the cultivars that grouped in the same genetic cluster showed also a relationship with the fruit fresh weight. Almost all cultivars carrying both or only one of the two alleles OeACP1-3D and OeACP2-4F are included in three clusters (from Carolea to Picual, from Galega to Tonda Iblea, from Itrana to Lechin de Sevilla) and showed a medium-high fruit weight (Supplementary Figure S3), with the exception of the cultivars Ottobratica and Galega.
Discussion
The analysis of polymorphisms at four olive gene fragments – OeACP1, OeACP2, OeLUS, and OeSUT1 – showed high levels of base substitutions, indels and simple sequence repeats. Their detection is particularly important considering the functional role of the analyzed genes, involved in primary metabolism pathways, such as FA synthesis (Tranbarger et al., 2011; Cultrera et al., 2014; De Marchis et al., 2016) and sugar transport (Conde et al., 2007), or, for what concerns lupeol synthase, in the production of nutraceutical compounds (Saleem, 2009). These results appear even more interesting in the light of the results of the neutrality tests, showing significant and positive variations for both OeACP1 and OeACP2 loci as a possible consequence of a recent bottleneck and balancing selection followed by a steady varieties cultivation (Maruyama and Fuerst, 1985). Despite this, the olive genome sequencing data of the Leccino and Farga cultivars (Muleo et al., 2012; Cruz et al., 2016) and the assembled genes of a wild olive (Unver et al., 2017), as well as the lack of saturated genetic maps, have not allowed to physically map these genes.
The frequency of total mutations (one every 19.5 bp) and single nucleotide polymorphisms (one every 21.9 bp) was high compared to that found in other plant species, in which SNP frequency was detected by the same sequencing method. The values detected in olive were higher than that observed not only in perennial woody species, such as Vernicia fordii (1/576 bp in the fad2 gene; Ren et al., 2013) or Vitis vinifera (1/51 bp for the entire DXS gene; Emanuelli et al., 2010), but also in annual herbaceous species, as fescue (1/21 bp for seven gene fragments; Xu et al., 2018), or wheat (1/86 bp in the TaSnRK2.7 gene; Zhang et al., 2011), that show a higher genetic turnover. In Eucalyptus camaldulensis, 1/16 bp was considered the highest SNP frequency of any woody plant species (Kulheim et al., 2009), but within the OeACP2 gene we found a frequency of 1/12.2 bp on average, considerably exceeding this primacy. High nucleotide diversity at nuclear gene level was already observed in olive cultivars (Sabetta et al., 2013). Interestingly, π diversity value detected within cultivated olive (0.015) resulted higher than that observed in wild olives (0.008; Besnard and El Bakkali, 2014). This difference could be due either to the analyzed genes and/or to plant material (cultivar versus wild type), on which different selection and/or domestication processes could have operated (Besnard et al., 2013, 2018; Diez et al., 2015).
The frequency of indels and microsatellites along the introns of the analyzed fragments of the four loci resulted quite low compared to total polymorphisms (6.6 and 4.1%, respectively). Due to the high SNP frequency and the low indel frequency, their ratio resulted higher than in other plant species: 12.4 against 6.4 in apple (Micheletti et al., 2011), 3.6 in rice (Shen et al., 2004) and 1.8 in common bean (Gaitán-Solís et al., 2008). However, direct comparisons between different sequencing strategies are not straightforward and should be considered with caution (Xu, 2006).
It is interesting to note the peculiarity of OeSUT1 gene sequences respect to other species. The first exon was interrupted by an intron, not recognized as a part of a transposable element (Carrier et al., 2012). Within the intron, a recombination region containing a 166 bp repeated motif, typical of the long alleles of this gene, and numerous nucleotide polymorphisms distinguishing M and S alleles were found. As shown in other out-crossing plant species, a high number of mutation points in regions containing indels, probably deriving from errors during meiosis (Hollister et al., 2010), could be useful to study gene evolution (Mu et al., 2011).
The direct sequencing approach applied in this study, although slow, expensive and labor intensive in comparison to next-generation sequencing, has guaranteed a high accuracy and a reliable estimate of the genetic variability (Ganal et al., 2009).
Despite the high level of variation, the analysis of LD along the four fragments revealed a strong degree of association among sites, even with an opposite trend, and shared between coding regions and introns. The allele-sequencing approach applied to the four gene fragments also allowed us to estimate IR for real haplotypes and to make a comparison with the calculated haplotypes. IR events in true haplotypes, four times lower than the calculated ones, occurred only in OeACP2 and OeSUT, as already evidenced by the comparison of the LD decay curves between real and calculated haplotypes. The portions of these genes not involved in recombination events, as well as the entire fragments of OeACP1 and OeLUS, represented ‘haplotypes blocks.’ As reported first in the human genome (Gabriel et al., 2002; Cardon and Abecasis, 2003), but also in plants such as maize (Rafalski and Morgante, 2004), rice (Yonemaru et al., 2012), or wheat (Hao et al., 2012), the haplotype blocks are regions with little evidence of recombination and, consequently, only few haplotypes can be observed, as in the case of the analyzed olive genes. A similar result was previously obtained in the same species, when only one recombined haplotype was observed by investigating the sequence variation at five nuclear single-copy genes in native and invasive olive accessions (Besnard and El Bakkali, 2014).
Furthermore, in OeACP2 and OeSUT1 the recombination sites were detected both in the intron and exon regions. This result contrasts with what observed in the DXS gene of grape, in which most of the haplotype blocks were located within introns (Emanuelli et al., 2010).
In our case, a low number of real haplotypes and consequent low haplotype combinations was detected, because recombination events, per se factors of differentiation (Nachman and Payseur, 2012; Renaut et al., 2013), occurred essentially within few alleles, lowering the probability to obtain a consistent number of new genotypes.
As already stated, the observed genotypes were very low, being just over a quarter of the potential ones (27.3%). Several hypotheses can be conceived to explain this evidence: (i) a different level of ancestrality may have affected the chance of combination; (ii) the complex varietal diversification process (Hamman-Khalifa et al., 2007; Haouane et al., 2011; Belaj et al., 2012; Besnard et al., 2013; Diez et al., 2015) could have recently shaped the occurrence of haplotypes therefore inducing some biases in gene combinations; (iii) the analyzed genotypes are cultivated varieties of a very long living species that has undergone an artificial selection along 1000s of years; it is likely that the selection made by growers and the adaptation to different environmental conditions, as well as the fitness of the different combinations, may have prevented certain allelic combinations to occur; (iv) inter-incompatibility among varieties (Saumitou-Laprade et al., 2017) might have favored certain allele combinations to the detriment of others, or some alleles might have been established over others because certain combinations resulted poorly competitive or lethal. While in natural populations, evolution is characterized by the clinal variation of allele frequencies, due to local adaptive processes (Maynard and Haigh, 2007; Chen et al., 2012), in non-natural populations such as cultivated olives, genes that control the phenotypic traits have been fixed through the artificial selection and vegetative propagation, thus reducing the possibility of recombination. Although the causative mutations under selection are unknown, their fixation could have led, in the proximity of the selected loci, to a decrease of genetic diversity through a hitchhiking effect (Palaisa et al., 2004; Cutter and Payseur, 2013).
The use of single-copy genes to reconstruct phylogenies of the olive complex, has been limited by the high allele diversity, coupled to numerous ancient admixture events, because very different topologies may be supported by different loci (Wendel and Doyle, 1998; Besnard and El Bakkali, 2014). In this research, phylogenetic analyses showed that, for three out of four analyzed genes, allele fragments were clustered into two or three groups together with the alleles of the analyzed subspecies. The lack of direct ancestral forms connecting the haplotypes of cultivated olives with those of O. paniculata species, was probably due to the existence of unsampled or extinct ancestral sequences. The high affinity between the allele clusters showed that the different allele forms derived from each other through single or multiple nucleotide mutations. Moreover, the relationships established in our material may be considered as an evidence of introgression of alleles in cultivated olives from other subspecies. Interesting is the case of OeACP1-1A allele, highly widespread among cultivars of different geographical origin, that appeared before all other alleles, including those carried by different subspecies, and for which a different introgression process could be hypothesized. In OeACP2, a close affinity with subsp. cuspidata can be deduced for alleles of group 4, whereas group 2 alleles derived from subsp. cerasiformis. A similar frame can be seen in OeLUS, in which the two subspecies are distinctly linked to different allele groups. It is interesting to highlight that cerasiformis subspecies is characteristic to the extreme western side of Mediterranean, while cuspidata subspecies spreads from north-east and south of Africa to the south of Asia, two completely different ways of diffusion.
As interpreted for the distribution of lupeol synthase alleles in wild Mediterranean olives (Besnard and El Bakkali, 2014), the recurrent admixtures among gene pools occurred during the varietal diversification process in olive, probably led to the present geographical dispersion of the alleles studied.
This also explains why in the set of cultivars analyzed, which included the main commercial ones, it was not possible to group the varieties according to their geographical origin. Despite this, some alleles or allelic associations have been reasonably regionalized, see the French cultivars and the case of OeACP2-2L, which is more present in the cultivars of the West-Central Mediterranean and characterizes a large number of Spanish cultivars. The same result was obtained by specific Neighbor-Joining analysis.
Due to the strong association, only 21% on total polymorphisms resulted informative, but these were able to discriminate a vast majority of the analyzed cultivars. Some polymorphisms (e.g., in OeACP2) were specific to single varieties (i.e., Arbequina, Rosciola Colli Esini, Zaity), thus representing powerful markers, exploitable not only for genotyping purposes but also for olive oil DNA testing, parentage analysis and association mapping studies.
This low recombination level, together with a very high and significant values of Tajima test, encouraged us to investigate the occurrence of any genotypic/phenotypic correlation. Box and Whisker plots showed a good correlation between fruit weight and two specific polymorphisms, the OeACP1 SNP at position 407 characterizing allele 3D, and OeACP2 SNP at position 869, characterizing allele 4F. The 3D allele was present in 26.8% of cultivars, six of them representing the most outstanding large-fruited table olive varieties (e.g., Gordal Sevillana, Kalamata, and Ascolana Tenera), and other six double-purpose (oil and table olives) varieties (e.g., Biancolilla, Hojiblanca, and Amigdalolia). Box plot graphs highlighted also three SNPs in OeACP2 sequences as significantly related to the percentage of palmitoleic acid. When each relationship was tested by TASSEL, only the correlation between fruit weight and both SNPs in 4F and 3D alleles remained within the significance range, when using GLM analysis. Box and Whisker plots, produced on the basis of the allele estimates output provided by TASSEL, underlined that when the estimate values were >0.5 the effect of allele’s genotypic class clearly emerged. In particular, homozygous genotypes were associated with lower phenotypic values.
The lack of strong marker/phenotype correlation may be due to numerous factors. Fruit weight and FAs content are quantitative traits presumably controlled by multiple loci and the effect of one over the others is still totally unknown. Acyl carrier protein is a cofactor and a structural protein that serves for the plastidial condensation of the acyl chains C16, but it represents a member of the FAs synthesis chain that involves different actors (Li et al., 2016). ACP genes are characterized, in the upstream and downstream sequences, by regulatory sequences that could play a major role in affecting the trait and, in an oil crop as olive, genes involved in oil accumulation may have undergone to a strong selective pressure, shaping the distribution, frequency and combination of the different alleles. Further functional genomic studies are needed to validate these SNPs as effective putative causal polymorphisms.
Conclusion
This research showed how an in-depth gene sequence analysis may help to clarify important issues related to allele variation and apportioning of variability in a perennial cultivated species.
The polymorphisms found could be applied for the discrimination and evaluation of the olive genetic resources, in studies on the evolution and domestication of the crop, or as a starting point for further functional genomic experiments.
Author Contributions
NC, LB, MC, RM, and VS conceived and designed the experiments. NC, VS, FA, RM, SM, and CR performed the experiments. RM, LL, NC, LB, and FA analyzed the data. LB and MC contributed reagents, materials, and analysis tools. LB, NC, RM, LL, SM, FA, and MC wrote the manuscript. All the authors read and approved the manuscript.
Funding
This research was supported by the Project “BeFOre – Bioresources for Oliviculture,” 2015–2019, H2020-MSCA-RISE- Marie Skłodowska-Curie Research and Innovation Staff Exchange (G.A. N. 645595).
Conflict of Interest Statement
The authors declare that the research was conducted in the absence of any commercial or financial relationships that could be construed as a potential conflict of interest.
Acknowledgments
The authors are grateful to Dr. Jo Dicks and Dr. Eric Westberg for manuscript revisions.
Supplementary Material
The Supplementary Material for this article can be found online at: https://www.frontiersin.org/articles/10.3389/fpls.2018.01932/full#supplementary-material
FIGURE S1 | Values of three neutrality tests (Tajima’s D, Fu and Li’s D∗, and Fu and Li’s F∗) performed on the four loci in the 90 cultivars studied. Tests’ significance is reported (∗∗p < 0.05; ∗∗∗p < 0.001).
FIGURE S2 | The Neighbor Joining dendrogram showing the relationship among the cultivars analyzed based on the polymorphisms of each allele for each gene. The bootstrap value is showed (cut-off > 60).
FIGURE S3 | Circle dendrogram obtained by MEGA7 software with Neighbor Joining method showing the relationships among the cultivars analyzed based on OeACP1 and OeACP2 sequences. The bootstrap value is showed (cut-off > 70).
TABLE S1 | Specific primers used to amplify all alleles at each locus in the analyzed 90 cultivars.
TABLE S2 | Fresh fruit weight and percentages of palmitic (C16:0), palmitoleic (C16:1), and oleic (C18:1) acid in the fruit for 56 olive cultivars.
TABLE S3 | Ranges for each class for fresh fruit weight and percentages of palmitic (C16:0), palmitoleic (C16:1), and oleic (C18:1) acid are reported.
TABLE S4 | Haplotypes obtained at the four gene fragments in the 90 cultivars, with SNPs, indels and SSRs detected. No color refers to unlinked polymorphisms, different colors refer to different groups of linkage. Purple boxes indicate the position of recombination sites. Amino acid changes are reported.
TABLE S5 | List of the haplotypes at each locus and corresponding accession numbers in GenBank.
TABLE S6 | Minimum number of polymorphisms able to discriminate the 90 cultivars analyzed.
TABLE S7 | Summary of general linear model (GLM) and mixed linear model (MLM) results. For each phenotype, p-value, type of polymorphism, polymorphism position, and genotype occurrence are reported.
Footnotes
- ^www.mbio.ncsu.edu/BioEdit/bioedit.html
- ^www.geneious.com
- ^http://denovo.cnag.cat/genomes/olive/
- ^http://www.oleagenome.org/
- ^https://blast.ncbi.nlm.nih.gov/
- ^http://olivegenome.org/
- ^www.oleadb.it
- ^www.dfam.org
References
Afoufa-Bastien, D., Medici, A., Jeauffre, J., Coutos-Thevenot, P., Lemoine, R., Atanassova, R., et al. (2010). The Vitis vinifera sugar transporter gene family: phylogenetic overview and macroarray expression profiling. BMC Plant Biol. 10:245. doi: 10.1186/1471-2229-10-245
Alagna, F., Geu-Flores, F., Kries, H., Panara, F., Baldoni, L., O’Connor, S. E., et al. (2015). Identification and characterization of the iridoid synthase involved in the biosynthesis of oleuropein in olive (Olea europaea) fruits. J. Biol. Chem. 291, 5542–5554. doi: 10.1074/jbc.M115.701276
Alagna, F., Mariotti, R., Panara, F., Caporali, S., Urbani, S., Veneziani, G., et al. (2012). Olive phenolic compounds: metabolic and transcriptional profiling during fruit development. BMC Plant Biol. 12:162. doi: 10.1186/1471-2229-12-162
Andrello, M., Henry, K., Devaux, P., Verdelet, D., Desprez, B., and Manel, S. (2017). Insights into the genetic relationships among plants of Beta section Beta using SNP markers. Theor. Appl. Genet. 130, 1857–1866. doi: 10.1007/s00122-017-2929-x
Arbeiter, A. B., Hladnik, M., Jakše, J., and Bandelj, D. (2017). Identification and validation of novel EST-SSR markers in olives. Sci. Agric. 74, 215–225. doi: 10.1590/1678-992x-2016-0111
Baldoni, L., Cultrera, N. G. M., Mariotti, R., Ricciolini, C., Arcioni, S., Vendramin, G. G., et al. (2009). A consensus list of microsatellite markers for olive genotyping. Mol. Breed. 24, 213–231. doi: 10.1007/s11032-009-9285-8
Baldoni, L., Tosti, N., Ricciolini, C., Belaj, A., Arcioni, S., Pannelli, G., et al. (2006). Genetic structure of wild and cultivated olives in the central Mediterranean basin. Ann. Bot. 98, 935–942. doi: 10.1093/aob/mc1178
Bandelt, H. J., Forster, P., and Rohl, A. (1999). Median-joining networks for inferring intraspecific phylogenies. Mol. Biol. Evol. 16, 37–48. doi: 10.1093/oxfordjournals.molbev.a026036
Barghini, E., Natali, L., Cossu, R. M., Giordani, T., Pindo, M., Cattonaro, F., et al. (2014). The peculiar landscape of repetitive sequence in the olive (Olea europaea L.) genome. Genome Biol. Evol. 6, 776–791. doi: 10.1093/gbe/evu058
Barranco, D., Cimato, A., Fiorino, P., Rallo, L., Touzani, A., Castañeda, C., et al. (2000). World Catalogue of Olive Varieties. Madrid: International Olive Oil Council, 360.
Bazakos, C., Khanfir, E., Aoun, M., Spano, T., Zein, Z. E., Chalak, L., et al. (2016). The potential of SNP-based PCR-RFLP capillary electrophoresis analysis to authenticate and detect admixtures of Mediterranean olive oils. Electrophoresis 37, 1881–1890. doi: 10.1002/elps.201500537
Belaj, A., de la Rosa, R., Lorite, I. J., Mariotti, R., Cultrera, N. G., Beuzón, C. R., et al. (2018). Usefulness of a new large set of high throughput EST-SNP markers as a tool for olive germplasm collection management. Front. Plant Sci. 9:1320. doi: 10.3389/fpls.2018.01320
Belaj, A., del Carmen Dominguez-García, M., Atienza, S. G., Urdiroz, N. M., de la Rosa, R., Satovic, Z., et al. (2012). Developing a core collection of olive (Olea europaea L.) based on molecular markers (DArTs, SSRs, SNPs,) and agronomic traits. Tree Genet. Genomes 8, 365–378. doi: 10.1007/s11295-011-0447-6
Ben-Ari, G., and Lavi, U. (2012). “Marker assisted selection in plant breeding” in Plant Biotechnology and Agriculture (Cambridge: Academic Press), 163–184.
Besnard, G., and El Bakkali, A. (2014). Sequence analysis of single-copy genes in two wild olive subspecies: nucleotide diversity and potential use for testing admixture. Genome 57, 145–153. doi: 10.1139/gen-2014-0001
Besnard, G., Khadari, B., Navascués, M., Fernandez-Mazuecos, M., El Bakkali, A., Arrigo, N., et al. (2013). The complex history of the olive tree: from Late Quaternary diversification of Mediterranean lineages to primary domestication in the northern Levant. Proc. Biol. Sci. 280:20122833. doi: 10.1098/rspb.2012.2833
Besnard, G., Rubio, de Casas, R., and Vargas, P. (2007). Plastid and nuclear DNA polymorphism reveals historical processes of isolation and reticulation in the olive tree complex (Olea europaea). J. Biogeogr. 34, 736–752. doi: 10.1111/j.1365-2699.2006.01653.x
Besnard, G., Terral, J. F., and Cornille, A. (2018). On the origins and domestication of the olive: a review and perspectives. Ann. Bot. 121, 385–403. doi: 10.1093/aob/mcx145
Biton, I., Doron-Faigenboim, A., Jamwal, M., Mani, Y., Eshed, R., Rosen, A., et al. (2015). Development of a large set of SNP markers for assessing phylogenetic relationships between the olive cultivars composing the Israeli olive germplasm collection. Mol. Breed. 35, 1–14. doi: 10.1007/s11032-015-0304-7
Bradbury, P. J., Zhang, Z., Kroon, D. E., Casstevens, T. M., Ramdoss, Y., and Buckler, E. S. (2007). TASSEL: software for association mapping of complex traits in diverse samples. Bioinformatics 23, 2633–2635. doi: 10.1093/bioinformatics/btm308
Breton, C., Terral, J. F., Pinatel, C., Médail, F., Bonhomme, F., and Bervillé, A. (2009). The origins of the domestication of the olive tree. C. R. Biol. 332, 1059–1064. doi: 10.1016/j.crvi.2009.08.001
Byers, D. M., and Gong, H. (2007). Acyl carrier protein: structure-function relationships in a conserved multifunctional protein family. Biochem. Cell Biol. 85, 649–662. doi: 10.1139/o07-109
Cardon, L. R., and Abecasis, G. A. R. (2003). Using haplotype blocks to map human complex trait loci. Trends Genet. 19, 135–140. doi: 10.1016/S0168-9525(03)00022-2
Carrier, G., Le Cunff, L., Dereeper, A., Legrand, D., Sabot, F., Bouchez, O., et al. (2012). Transposable elements are a major cause of somatic polymorphism in Vitis vinifera L. PLoS One 7:e32973. doi: 10.1371/journal.pone.0032973
Chen, J., Kallman, T., Ma, X., Gyllenstrand, N., Zaina, G., Morgante, M., et al. (2012). Disentangling the roles of history and local selection in shaping clinal variation of allele frequencies and gene expression in Norway Spruce (Picea abies). Genetics 191, 865–881. doi: 10.1534/genetics.112.140749
Conde, C., Agasse, A., Silva, P., Lemoine, R., Delrot, S., Tavares, R., et al. (2007). OeMST2 encodes a monosaccharide transporter expressed throughout olive fruit maturation. Plant Cell Physiol. 48, 1299–1308. doi: 10.1093/pcp/pcm096
Consolandi, C., Palmieri, L., Doveri, S., Maestri, E., Marmiroli, N., Reale, S., et al. (2007). Olive variety identification by ligation detection reaction in a universal array format. J. Biotechnol. 129, 565–574. doi: 10.1016/j.jbiotec.2007.01.025
Corander, J., Marttinen, P., Siren, J., and Tang, J. (2008). Enhanced Bayesian modelling in BAPS software for learning genetic structures of populations. BMC Bioinformatics 9:539. doi: 10.1186/1471-2105-9-539
Cruz, F., Julca, I., Gómez-Garrido, J., Loska, D., Marcet-Houben, M., Cano, E., et al. (2016). Genome sequence of the olive tree, Olea europaea. Gigascience 5:29. doi: 10.1186/s13742-016-0134-5
Cultrera, N. G. M., Alagna, F., Mariotti, R., De Marchis, F., Pompa, A., Bellucci, M., et al. (2014). Isolation and molecular characterization of three acyl carrier protein genes in olive (Olea europaea L.). Tree Genet. Genomes 10, 895–909. doi: 10.1007/s11295-014-0730-4
Cutter, A. D., and Payseur, B. A. (2013). Genomic signatures of selection at linked sites: unifying the disparity among species. Nat. Rev. Genet. 14, 262–274. doi: 10.1038/nrg3425
de la Rosa, R., Belaj, A., Muñoz-Mérida, A., Trelles, O., Ortíz-Martín, I., González-Plaza, J. J., et al. (2013a). Development of EST-derived SSR markers with long-core repeat in olive and their use for paternity testing. J. Am. Soc. Hortic. Sci. 138, 290–296.
de la Rosa, R., Talhaoui, N., Rouis, H., Velasco, L., and León, L. (2013b). Fruit characteristics and fatty acid composition in advanced olive breeding selections along the ripening period. Food Res. Int. 54, 1890–1896. doi: 10.1016/j.foodres.2013.08.039
De Marchis, F., Valeri, M. C., Pompa, A., Bouveret, E., Alagna, F., Grisan, S., et al. (2016). Overexpression of the olive acyl carrier protein gene (OeACP1) produces alterations in fatty acid composition of tobacco leaves. Transgenic Res. 25, 45–61. doi: 10.1007/s11248-015-9919-z
Decourteix, M., Alves, G., Brunel, N., Ameglio, T., Guillio, A., Lemoine, R., et al. (2006). JrSUT1, a putative xylem sucrose transporter, could mediate sucrose influx into xylem parenchyma cells and be up-regulated by freeze-thaw cycles over the autumn-winter period in walnut tree (Juglans regia L.). Plant Cell Environ. 29, 36–47. doi: 10.1111/j.1365-3040.2005.01398.x
Diez, C. M., Trujillo, I., Martinez-Udiroz, N., Barranco, D., Rallo, L., Marfil, P., et al. (2015). Olive domestication and diversification in the Mediterranean Basin. New Phytol. 206, 436–447. doi: 10.1111/nph.13181
Doebley, J. F., Gaut, B. S., and Smith, B. D. (2006). The molecular genetics of crop domestication. Cell 127, 1309–1321. doi: 10.1016/j.cell.2006.12.006
Dusotoit-Coucaud, A., Brunel, N., Franchel, J., Granet, F., Chrestin, H., and Sakr, S. (2009). Molecular characterisation of the sucrose transporter HbSUT1B in relation to rubber production in latex cells. J. Rubber Res. 12, 125–139.
Emanuelli, F., Battilana, J., Costantini, L., Le Cunff, L., Boursiquot, J. M., This, P., et al. (2010). A candidate gene association study on Muscat flavor in grapevine (Vitis vinifera L.). BMC Plant Biol. 10:241. doi: 10.1186/1471-2229-10-241
Fan, R. C., Peng, C. C., Xu, Y. H., Wang, X. F., Li, Y., Shang, Y., et al. (2009). Apple sucrose transporter SUT1 and sorbitol transporter SOT6 interact with cytochrome b5 to regulate their affinity for substrate sugars. Plant Physiol. 150, 1880–1901. doi: 10.1104/pp.109.141374
Fischer, I., Camus-Kulandaivelu, L., Allal, F., and Stephan, W. (2011). Adaptation to drought in two wild tomato species: the evolution of the Asr gene family. New Phytol. 190, 1032–1044. doi: 10.1111/j.1469-8137.2011.03648.x
Fisher, L. H., Han, J., Corke, F. M., Akinyemi, A., Didion, T., Nielsen, K. K., et al. (2016). Linking dynamic phenotyping with metabolite analysis to study natural variation in drought responses of Brachypodium distachyon. Front. Plant Sci. 7:1751. doi: 10.3389/fpls.2016.01751
Fu, Y. B. (2012). Population-based resequencing analysis of wild and cultivated barley revealed weak domestication signal of selection and bottleneck in the RRS2 scald resistance gene region. Genome 55, 93–104. doi: 10.1139/g11-082
Fu, Y. X., and Li, W. H. (1993). Statistical tests of neutrality of mutations. Genetics 133, 693–709.
Gabriel, S. B., Schaffner, S. F., Nguyen, H., Moore, J. M., Roy, J., Blumenstiel, B., et al. (2002). The structure of haplotype blocks in the human genome. Science 296, 2225–2229. doi: 10.1126/science.1069424
Gaitán-Solís, E., Choi, I. Y., Quigley, C., Cregan, P., and Tohme, J. (2008). Single nucleotide polymorphisms in common bean: their discovery and genotyping using a multiplex detection system. Plant Genome 1, 125–134. doi: 10.3835/plantgenome2008.04.0204
Ganal, M. W., Altmann, T., and Roder, M. S. (2009). SNP identification in crop plants. Curr. Opin. Plant Biol. 12, 211–217. doi: 10.1016/j.pbi.2008.12.009
Geisler, M., Venema, K., and Kühn, C. (2011). “Sucrose transporters and plant development,” in Transporters and Pumps in Plant Signalling, eds F. Baluska and J. Vivano (Berlin: Springer), 225–251.
Hakim, I. R., Kammoun, N. G., Makhloufi, E., and Rebai, A. (2009). Discovery and potential of SNP markers in characterization of Tunisian olive germplasm. Diversity 2, 17–27. doi: 10.3390/d2010017
Hamman-Khalifa, A. M., Navajas-Pérez, R., De la Herrán, R., Ruiz Rejón, M., Garrido-Ramos, M. A., Ruiz Rejón, C., et al. (2007). Establishing the genetic relationships between the wild and cultivated olives using a nuclear intron from nitrate reductase (nia-i3). Plant Syst. Evol. 269, 63–73. doi: 10.1007/s00606-007-0566-6
Hammer,Ø., Harper, D. A. T., and Ryan, P. D. (2001). PAST: paleontological statistics software package for education and data analysis. Palaeontol. Electron. 4, 1–9.
Hao, C., Wang, Y., Hou, J., Feuillet, C., Balfourier, F., and Zhang, X. (2012). Association mapping and haplotype analysis of a 3.1-Mb genomic region involved in Fusarium head blight resistance on wheat chromosome 3BS. PLoS One 7:e46444. doi: 10.1371/journal.pone.0046444
Haouane, H., El Bakkali, A., Moukhli, A., Tollon, C., Santoni, S., Oukabli, A., et al. (2011). Genetic structure and core collection of the World Olive Germplasm Bank of Marrakech: towards the optimised management and use of Mediterranean olive genetic resources. Genetica 139, 1083–1094. doi: 10.1007/s10709-011-9608-7
Harwood, J. L. (1996). Recent advances in the biosynthesis of plant fatty acids. Biochim. Biophys. Acta 1301, 7–56. doi: 10.1016/0005-2760(95)00242-1
Hollister, J. D., Ross-Ibarra, J., and Gaut, B. S. (2010). Indel-association mutation rate varies with mating system in flowering plants. Mol. Biol. Evol. 27, 409–416. doi: 10.1093/molbev/msp249
Hosseini-Mazinani, M., Mariotti, R., Torkzaban, B., Sheikh-Hassani, M., Ataei, S., Cultrera, N. G. M., et al. (2014). High genetic diversity detected in olives beyond the boundaries of the Mediterranean sea. PLoS One 9:e93146. doi: 10.1371/journal.pone.0093146
Huber, C. D., Degiorgio, M., Hellmann, I., and Nielsen, R. (2016). Detecting recent selective sweeps while controlling for mutation rate and background selection. Mol. Ecol. 25, 142–156. doi: 10.1111/mec.13351
Ipek, A., Yimaz, K., and Skc, P. (2016). SNP discovery by GBS in olive and the construction of a high-density genetic linkage map. Biochem. Genet. 54, 313–325. doi: 10.1007/s10528
Kalogianni, D. P., Bazakos, C., Boutsika, L. M., Targem, M. B., Christopoulos, T. K., Kalaitzis, P., et al. (2015). Olive oil DNA fingerprinting by multiplex SNP genotyping on fluorescent microspheres. J. Agric. Food Chem. 63, 3121–3128. doi: 10.1021/jf5054657
Kaniewski, D., Van Campo, E., Boiy, T., Terral, J. F., Khadari, B., and Besnard, G. (2012). Primary domestication and early uses of the emblematic olive tree: palaeobotanical, historical and molecular evidence from the Middle East. Biol. Rev. 87, 885–899. doi: 10.1111/j.1469-185X.2012.00229.x
Kaya, H. B., Cetin, O., Kaya, H., Sahin, M., Sefer, F., Kahraman, A., et al. (2013). SNP discovery by Illumina-based transcriptome sequencing of the olive and the genetic characterization of Turkish olive genotypes revealed by AFLP, SSR and SNP markers. PLoS One 8:e73674. doi: 10.1371/journal.pone.0073674
Kulheim, C., Yeoh, S. H., Maintz, J., Foley, W. J., and Moran, G. F. (2009). Comparative SNP diversity among four Eucalyptus species for genes from secondary metabolite biosynthetic pathways. BMC Genomics 10:452. doi: 10.1186/1471-2164-10-452
Kumar, S., Stecher, G., and Tamura, K. (2016). MEGA7: molecular evolutionary genetics analysis version 7.0 for bigger datasets. Mol. Biol. Evol. 33, 1870–1874. doi: 10.1093/molbev/msw054
Lamesch, P., Berardini, T. Z., Li, D., Swarbreck, D., Wilks, C., Sasidharan, R., et al. (2012). The Arabidopsis Information Resource (TAIR): improved gene annotation and new tools. Nucleic Acids Res. 40, D1202–D1210. doi: 10.1093/nar/gkr1090
Li, N., Xu, C., Li-Beisson, Y., and Philippar, K. (2016). Fatty acid and lipid transport in plant cells. Trends Plant Sci. 21, 145–158. doi: 10.1016/j.tplants.2015.10.011
Liao, X., Forni, F., McLaren, S. D., Plastow, G., and Stothard, P. (2013). Whole genome sequencing of Gir cattle for identifying polymorphisms and loci under selection. Genome 56, 592–598. doi: 10.1139/gen-2013-0082
Li-Beisson, Y., Shorrosh, B., Beisson, F., Andersson, M. X., Arondel, V., Bates, P. D., et al. (2010). “Acyl-lipid metabolism,” in The Arabidopsis Book II, ed. R. Smith (Rockville, MD: American Society of Plant Biologists), 1–65.
Librado, P., and Rozas, J. (2009). DnaSP v5: a software for comprehensive analysis of DNA polymorphism data. Bioinformatics 25, 1451–1452. doi: 10.1093/bioinformatics/btp187
Luo, Z., Iaffaldano, B. J., Zhuang, X., Fresnedo-Ramírez, J., and Cornish, K. (2017). Analysis of the first Taraxacum kok-saghyz transcriptome reveals potential rubber yield related SNPs. Sci. Rep. 7:9939. doi: 10.1038/s41598-017-09034-2
Marchese, A., Marra, F. P., Caruso, T., Mhelembe, K., Costa, F., Fretto, S., et al. (2016). The first high-density sequence characterized SNP-based linkage map of olive (Olea europaea L. subsp. europaea) developed using genotyping by sequencing. Aust. J. Crop Sci. 10, 857–863. doi: 10.21475/ajcs.2016.10.06.p7520
Mariotti, R., Cultrera, N. G. M., Mousavi, S., Baglivo, F., Rossi, M., Albertini, E., et al. (2016). Development, evaluation, and validation of new EST-SSR markers in olive (Olea europaea L.). Tree Genet. Genomes 12:120. doi: 10.1007/s11295-016-1077-9
Marsden, C. D., Ortega-Del Vecchyo, D., O’Brien, D. P., Taylor, J. F., Ramirez, O., Vilà, C., et al. (2016). Bottlenecks and selective sweeps during domestication have increased deleterious genetic variation in dogs. Proc. Natl. Acad. Sci. U.S.A. 113, 152–157. doi: 10.1073/pnas.1512501113
Maruyama, T., and Fuerst, P. A. (1985). Population bottlenecks and nonequilibrium models in population genetics. II. Number of alleles in a small population that was formed by a recent bottleneck. Genetics 111, 675–689.
Maynard, J., and Haigh, J. (2007). The hitch-hiking effect of a favorable gene. Genet. Res. 89, 391–403. doi: 10.1017/S0016672308009579
Micheletti, D., Troggio, M., Zharkikh, A., Costa, F., Malnoy, M., Velasco, R., et al. (2011). Genetic diversity of the genus Malus and implications for linkage mapping with SNPs. Tree Genet. Genomes 7, 857–868. doi: 10.1007/s11295-011-0380-8
Mourad, A. M., Sallam, A., Belamkar, V., Wegulo, S., Bowden, R., Jin, Y., et al. (2018). Genome-wide association study for identification and validation of novel SNP markers for Sr6 stem rust resistance gene in bread wheat. Front. Plant Sci. 9:380. doi: 10.3389/fpls.2018.00380
Mousavi, S., Mariotti, R., Bagnoli, F., Costantini, L., Cultrera, N. G. M., Arzani, K., et al. (2017). The eastern part of the Fertile Crescent concealed an unexpected route of olive (Olea europaea L.) differentiation. Ann. Bot. 119, 1305–1318. doi: 10.1093/aob/mcx027
Mu, X. J., Lu, Z. J., Kong, Y., Lam, H. Y., and Gerstein, M. B. (2011). Analysis of genomic variation in non-coding elements using population-scale sequencing data from the 1000 Genomes Project. Nucleic Acids Res. 39, 7058–7076. doi: 10.1093/nar/gkr342
Muleo, R., Morgante, M., Cattonaro, F., Scalabrin, S., Cavallini, A., Natali, L., et al. (2016). “Genome sequencing, transcriptomics, and proteomics,” in The Olive Tree Genome, eds E. Rugini, L. Baldoni, R. Muleo, and L. Sebastiani (Cham: Springer International Publishing), 141–161.
Muleo, R., Morgante, M., Velasco, R., Cavallini, A., Perrotta, G., and Baldoni, L. (2012). “Olive tree genomic,” in Olive Germplasm-the Olive Cultivation, Table Olive and Olive Oil Industry in Italy, ed. I. Muzzalupo (Rijeka: IntechOpen).
Nachman, M. W., and Payseur, B. A. (2012). Recombination rate variation and speciation: theoretical predictions and empirical results from rabbits and mice. Philos. Trans. R. Soc. Lond. B Biol. Sci. 367, 409–421. doi: 10.1098/rstb.2011.0249
Nimmakayala, P., Levi, A., Abburi, L., Abburi, V. L., Tomason, Y. R., Saminathan, T., et al. (2014). Single nucleotide polymorphisms generated by genotyping by sequencing to characterize genome-wide diversity, linkage disequilibrium, and selective sweeps in cultivated watermelon. BMC Genomics 15:767. doi: 10.1186/1471-2164-15-767
Palaisa, K., Morgante, M., Tingey, S., and Rafalski, A. (2004). Long-range patterns of diversity and linkage disequilibrium surrounding the maize Y1 gene are indicative of an asymmetric selective sweep. Proc. Natl. Acad. Sci. U.S.A. 101, 9885–9890. doi: 10.1073/pnas.0307839101
Rafalski, A., and Morgante, M. (2004). Corn and humans: recombination and linkage disequilibrium in two genomes of similar size. Trends Genet. 20, 103–111. doi: 10.1016/j.tig.2003.12.002
Reale, S., Doveri, S., Diaz, A., Angiolillo, A., Lucentini, L., Pilla, F., et al. (2006). SNP-based markers for discriminating olive (Olea europaea L.) cultivars. Genome 49, 1193–1205. doi: 10.1139/g06-068
Ren, J., Guo, R., Chen, L., Nevo, E., Zhang, Z., Sun, D., et al. (2013). Single nucleotide polymorphisms of fad2 gene from tung tree, Vernicia fordii, a potential biodiesel plant. Euphytica 194, 93–107. doi: 10.1007/s10681-013-0978-z
Renaut, S., Grassa, C. J., Yeaman, S., Moyers, B. T., Lai, Z., Kane, N. C., et al. (2013). Genomic islands of divergence are not affected by geography of speciation in sunflowers. Nat. Commun. 4:1827. doi: 10.1038/ncomms2833
Rossi, S., Calabretta, A., Tedeschi, T., Sforza, S., Arcioni, S., Baldoni, L., et al. (2012). Selective recognition of DNA from olive leaves and olive oil by PNA and modified-PNA microarrays. Artif. DNA PNA XNA 3, 63–72. doi: 10.4161/adna.20603
Sabetta, W., Blanco, A., Zelasco, S., Lombardo, L., Perri, E., Mangini, G., et al. (2013). Fad7 gene identification and fatty acids phenotypic variation in an olive collection by EcoTILLING and sequencing approaches. Plant Physiol. Biochem. 69, 1–8. doi: 10.1016/j.plaphy.2013.04.007
Saleem, M. (2009). Lupeol, a novel anti-inflammatory and anti-cancer dietary triterpene. Cancer Lett. 285, 109–115. doi: 10.1016/j.canlet.2009.04.033
Sarri, V., Baldoni, L., Porceddu, A., Cultrera, N. G., Contento, A., Frediani, M., et al. (2006). Microsatellite markers are powerful tools for discriminating among olive cultivars and assigning them to geographically defined populations. Genome 49, 1606–1615. doi: 10.1139/g06-126
Saumitou-Laprade, P., Vernet, P., Vekemans, X., Billiard, S., Gallina, S., Essalouh, L., et al. (2017). Elucidation of the genetic architecture of self-incompatibility in olive: evolutionary consequences and perspectives for orchard management. Evol. Appl. 10, 867–880. doi: 10.1111/eva.12457
Sawai, S., Shindo, T., Sato, S., Kaneko, T., Tabata, S., Ayabe, S., et al. (2006). Functional and structural analysis of genes encoding oxidosqualene cyclases of Lotus japonicus. Plant Sci. 170, 247–257. doi: 10.1016/j.plantsci.2005.08.027
Sharma, N., and Kaur, R. (2014). Mapmaker/EXP Version 3.0 b: though used since time immemorial still difficult for beginners to start with map construction for the genetic studies. J. Transl. Proteomics Res. 1, 17–27. doi: 10.15379/2410-3802.2014.01.4
Shen, Y. J., Jiang, H., Jin, J. P., Zhang, Z. B., Xi, B., He, Y. Y., et al. (2004). Development of genome-wide DNA polymorphism database for map-based cloning of rice genes. Plant Physiol. 135, 1198–1205. doi: 10.1104/pp.103.038463
Shibuya, M., Zhang, H., Endo, K., Shishikura, K., Kushiro, T., and Ebizuka, Y. (1999). Two branches of the lupeol synthase gene in the molecular evolution of plant oxidosqualene cyclases. Eur. J. Biochem. 266, 302–307. doi: 10.1046/j.1432-1327.1999.00875.x
Stephens, M., and Donnelly, P. (2003). A comparison of Bayesian methods for haplotype reconstruction from population genotype data. Am. J. Hum. Genet. 73, 1162–1169. doi: 10.1086/379378
Suh, M. C., Schultz, D. J., and Ohlrogge, J. B. (1999). Isoforms of acyl carrier protein involved in seed-specific fatty acid synthesis. Plant J. 17, 679–688. doi: 10.1046/j.1365-313X.1999.00418.x
Swanson-Wagner, R. A., Eichten, S. R., Kumari, S., Tiffin, P., Stein, J. C., Ware, D., et al. (2010). Pervasive gene content variation and copy number variation in maize and its undomesticated progenitor. Genome Res. 20, 1689–1699. doi: 10.1101/gr.109165.110
Tajima, F. (1989). Statistical method for testing the neutral mutation hypothesis by DNA polymorphism. Genetics 123, 585–595.
Tranbarger, T. J., Dussert, S., Joet, T., Argout, X., Summo, M., Champion, A., et al. (2011). Regulatory mechanisms underlying oil palm fruit mesocarp maturation, ripening, and functional specialization in lipid and carotenoid metabolism. Plant Physiol. 156, 564–584. doi: 10.1104/pp.111.175141
Trujillo, I., Ojeda, M. A., Urdiroz, N. M., Potter, D., Barranco, D., Rallo, L., et al. (2014). Identification of the Worldwide Olive Germplasm Bank of Córdoba (Spain) using SSR and morphological markers. Tree Genet. Genomes 10, 141–155. doi: 10.1007/s11295-013-0671-3
Uncu, A. T., Frary, A., and Doganlar, S. (2015). Cultivar origin and admixture detection in Turkish olive oils by SNP-based CAPS assays. J. Agric. Food Chem. 63, 2284–2295. doi: 10.1021/acs.jafc.5b00090
Unver, T., Wu, Z., Sterck, L., Turktas, M., Lohaus, R., Li, Z., et al. (2017). Genome of wild olive and the evolution of oil biosynthesis. Proc. Natl. Acad. Sci. U.S.A. 114, E9413–E9422. doi: 10.1073/pnas.1708621114
Wendel, J. F., and Doyle, J. J. (1998). Phylogenetic incongruence: window into genome history and molecular evolution. Mol. Syst. Plants 2, 265–296. doi: 10.1007/978-1-4615-5419-6_10
Wright, S. I., Bi, I. V., Schroeder, S. G., Yamasaki, M., Doebley, J. F., McMullen, M. D., et al. (2005). The effects of artificial selection on the maize. Science 308, 1310–1314. doi: 10.1126/science.1107891
Xu, Y., Wang, J., Bonos, S. A., Meyer, W. A., and Huang, B. (2018). Candidate genes and molecular markers correlated to physiological traits for heat tolerance in fine fescue cultivars. Int. J. Mol. Sci. 19:E116. doi: 10.3390/ijms19010116
Yonemaru, J., Yamamoto, T., Ebana, K., Yamamoto, E., Nagasaki, H., Shibaya, T., et al. (2012). Genome-wide haplotype changes produced by artificial selection during modern rice breeding in Japan. PLoS One 7:e32982. doi: 10.1371/journal.pone.0032982
Zhang, H., Mao, X., Wu, X., Wang, C., and Jing, R. (2011). An abiotic stress response gene TaSnRK2.7-B in wheat accessions: genetic diversity analysis and gene mapping based on SNPs. Gene 478, 28–34. doi: 10.1016/j.gene.2011.01.011
Zhou, W., Ji, X., Obata, S., Pais, A., Dong, Y., Peet, R., et al. (2018). Resolving relationships and phylogeographic history of the Nyssa sylvatica complex using data from RAD-seq and species distribution modeling. Mol. Phylogen. Evol. 126, 1–16. doi: 10.1016/j.ympev.2018.04.001
Keywords: sequencing, ACP, LUS, SUT, SNP, genotyping
Citation: Cultrera NGM, Sarri V, Lucentini L, Ceccarelli M, Alagna F, Mariotti R, Mousavi S, Ruiz CG and Baldoni L (2019) High Levels of Variation Within Gene Sequences of Olea europaea L. Front. Plant Sci. 9:1932. doi: 10.3389/fpls.2018.01932
Received: 20 September 2018; Accepted: 12 December 2018;
Published: 08 January 2019.
Edited by:
Sergio Lanteri, Università degli Studi di Torino, ItalyReviewed by:
Panagiotis Kalaitzis, Mediterranean Agronomic Institute of Chania, GreeceElena Bitocchi, Università Politecnica delle Marche, Italy
Copyright © 2019 Cultrera, Sarri, Lucentini, Ceccarelli, Alagna, Mariotti, Mousavi, Ruiz and Baldoni. This is an open-access article distributed under the terms of the Creative Commons Attribution License (CC BY). The use, distribution or reproduction in other forums is permitted, provided the original author(s) and the copyright owner(s) are credited and that the original publication in this journal is cited, in accordance with accepted academic practice. No use, distribution or reproduction is permitted which does not comply with these terms.
*Correspondence: Roberto Mariotti, cm9iZXJ0by5tYXJpb3R0aUBpYmJyLmNuci5pdA==