 Chunming Gao
 Yunfei Deng
 Jun Wang
- 1College of Biological and Environmental Engineering, Binzhou University, Binzhou, China
- 2Shandong Provincial Key Laboratory of Eco-Environmental Science for the Yellow River Delta, Binzhou University, Binzhou, China
- 3Shandong Provincial Engineering and Technology Research Center for Wild Plant Resources Development and Application of Yellow River Delta, College of Biological and Environmental Engineering, Binzhou University, Binzhou, China
- 4Key Laboratory of Plant Resources Conservation and Sustainable Utilization, South China Botanical Garden, Chinese Academy of Sciences, Guangzhou, China
- 5Southeast Asia Biodiversity Research Institute, Chinese Academy of Sciences, Yezin, Myanmar
Among the four species of Echinacanthus (Acanthaceae), one distributed in the West Himalayan region and three restricted to the Sino-Vietnamese karst region. Because of its ecological significance, molecular markers are necessary for proper assessment of its genetic diversity and phylogenetic relationships. Herein, the complete chloroplast genomes of four Echinacanthus species were determined for the first time. The results indicated that all the chloroplast genomes were mapped as a circular structure and each genomes included 113 unique genes, of which 80 were protein-coding, 29 were tRNAs, and 4 were rRNAs. However, the four cp genomes ranged from 151,333 to 152,672 bp in length. Comparison of the four cp genomes showed that the divergence level was greater between geographic groups. We also analyzed IR expansion or contraction in the four cp genomes and the fifth type of the large single copy/inverted repeat region in Lamiales was suggested. Furthermore, based on the analyses of comparison and nucleotide variability, six most divergent sequences (rrn16, ycf1, ndhA, rps16-trnQ-UUG, trnS-GCU-trnG-UCC, and psaA-ycf3) were identified. A total of 37–45 simple sequence repeats were discovered in the four species and 22 SSRs were identified as candidate effective molecular markers for detecting interspecies polymorphisms. These SSRs and hotspot regions could be used as potential molecular markers for future study. Phylogenetic analysis based on Bayesian and parsimony methods did not support the monophyly of Echinacanthus. The phylogenetic relationships among the four species were clearly resolved and the results supported the recognition of the Sino-Vietnamese Echinacanthus species as a new genus. Based on the protein sequence evolution analysis, 12 genes (rpl14, rpl16, rps4, rps15, rps18, rps19, psbK, psbN, ndhC, ndhJ, rpoB, and infA) were detected under positive selection in branch of Sino-Vietnamese Echinacanthus species. These genes will lead to understanding the adaptation of Echinacanthus species to karst environment. The study will help to resolve the phylogenetic relationship and understand the adaptive evolution of Echinacanthus. It will also provide genomic resources and potential markers suitable for future species identification and speciation studies of the genus.
Introduction
Echinacanthus Nees is a small genus in the tribe Ruellieae of the family Acanthaceae typified by E. attenuatus Nees (Nees Von Esenbeck, 1832; Anderson, 1867; Bentham, 1876; Bremekamp, 1965; Scotland and Vollesen, 2000; Deng et al., 2010; Hu et al., 2011; Tripp et al., 2013). The genus is characterized by anthers with spurred thecae and axillary or terminal inflorescence of thyrse type. Since its establishment, 16 species have been described within the genus, some of which had been later assigned to other genera (Nees Von Esenbeck, 1847; Anderson, 1867; Clarke, 1885; Kuntze, 1891; Lindau, 1895; Backer and Bakhuizen van den Brink, 1965; Wood, 1994). Lo and Fang (1985) described three new species from China, E. flaviflorus H. S. Lo and D. Fang, E. longipes H. S. Lo and D. Fang, and E. longzhouensis H. S. Lo. Later, Wood (1994) merged E. flaviflorus with E. lofouensis (H. Léveillé) J. R. I. Wood. At present, four species, E. attenuatus, E. longipes, E. longzhouensis and E. lofouensis, are recognized in the genus (Deng et al., 2010; Hu et al., 2011; Tripp et al., 2013). Initially, Echinacanthus was placed in the tribe Ruellieae (Nees Von Esenbeck, 1832) and adopted by Anderson (1867) and other researchers (Bentham, 1876; Bremekamp, 1965; Scotland and Vollesen, 2000; Hu et al., 2011; Tripp et al., 2013). However, the status of Echinacanthus within Ruellieae has been controversial. Bentham (1876) placed it in the subtribe Ruellieae Lindau (1895)considered it a member of the subtribe Strobilanthinae, whereas Bremekamp (1965) transferred Echinacanthus to the subtribe Petalidiinae. A recent phylogenetic study indicated that E. attenuatus belonged to the subtribe Petalidiinae, and the other three Echinacanthus species continued to be questioned (Tripp et al., 2013). Hence, the phylogeny of Echinacanthus in Ruellieae is not resolved. Furthermore, the phylogenetic relationships among the four species of Echinacanthus based on molecular markers have been incomplete because they did not include all the species of Echinacanthus (Gao, 2010; Tripp et al., 2013). Therefore, previous studies did not appear to fully resolve the phylogenetic relationship of Echinacanthus.
In addition, the four recognized species of Echinacanthus have special geographical distribution. E. attenuatus is restricted to the West Himalayas in Bhutan, India, and Nepal, while the remaining species are endemic to the Sino-Vietnamese karst region in southern China and northern Vietnam (Wood, 1994; Deng et al., 2010; Hu et al., 2011). Furthermore, the three Sino-Vietnamese species are typical for karst, and they are narrow endemics with almost non-overlapping areas. For example, E. longipes is widely distributed in southeastern Yunnan, southwestern Guangxi, and northern Vietnam, whereas, E. lofouensis is scattered in the border area between Guangxi and Guizhou provinces. In contrast, E. longzhouensis has a very narrow distribution as it only found in Longzhou in Guangxi province and Yangchun in Guangdong province. Despite it provides an important model for understanding the role of the Himalayas and limestone karst in speciation events and endemism, evolutionary history and speciation of Echinacanthus remain unclear. Hence, developing molecular markers and examining divergence regions will enable studies on speciation of Echinacanthus and adaptive evolution in the Sino-Vietnamese karst region.
Chloroplast is an important organelle that can transform the light energy into chemical energy in green plants (Ris and Plaut, 1961; Daniell et al., 2016). It has independent genome (chloroplast DNA, cpDNA) that is characterized by small molecular weight, multiple copies, and simple structure (Olmstead and Palmer, 1994; Wicke et al., 2011). With the development of high-throughput sequencing technologies, cpDNA has been widely utilized for reconstructing phylogenetic relationships, DNA barcoding, and development of molecular markers (Graham and Olmstead, 2000; Dong et al., 2014; Lemieux et al., 2016; Raman et al., 2016;Li Y.G. et al., 2017; Ng et al., 2017; Song et al., 2017; Zhang et al., 2017). Until now, the complete chloroplast genomes have been reported for more than 1,000 species, excluding Echinacanthus1. Although Acanthaceae is a large family consisting of 220–250 genera and 2,500–4,300 species, the complete chloroplast genomes have been sequenced for only three species (Andrographis paniculata (Burm.f.) Nees, NC_022451; Ruellia breedlovei T. F. Daniel, KP300014; Strobilanthes cusia (Nees) O. Kuntze, MG874806).
In the present study, we sequenced, characterized, and compared the complete chloroplast genomes of the four Echinacanthus species. This is the first comprehensive cp genomes of Echinacanthus species. Our main objectives were to: (1) deeply understanding the interspecific variation within the Echinacanthus cp genomes, (2) resolve phylogenetic relationships among the four species in Echinacanthus using the cp genome sequences, (3) examine simple sequence repeats (SSRs) and hotspot regions as candidate sequences for species identification and future speciation studies in Echinacanthus, and (4) identify genes underlying positive selection as potentially genes for adaptive evolution in karst region.
Materials and Methods
Plant Materials and DNA Extraction
Plant samples were collected in their native habitats and the voucher specimens were deposited in the South China Botanical Garden, Chinese Academy of Sciences (IBSC), and Royal Botanic Garden Edinburgh (E) (Table 1). Total genomic DNA was extracted from 100 mg silica gel-dried leaves following the method of CTAB (Doyle and Doyle, 1990).
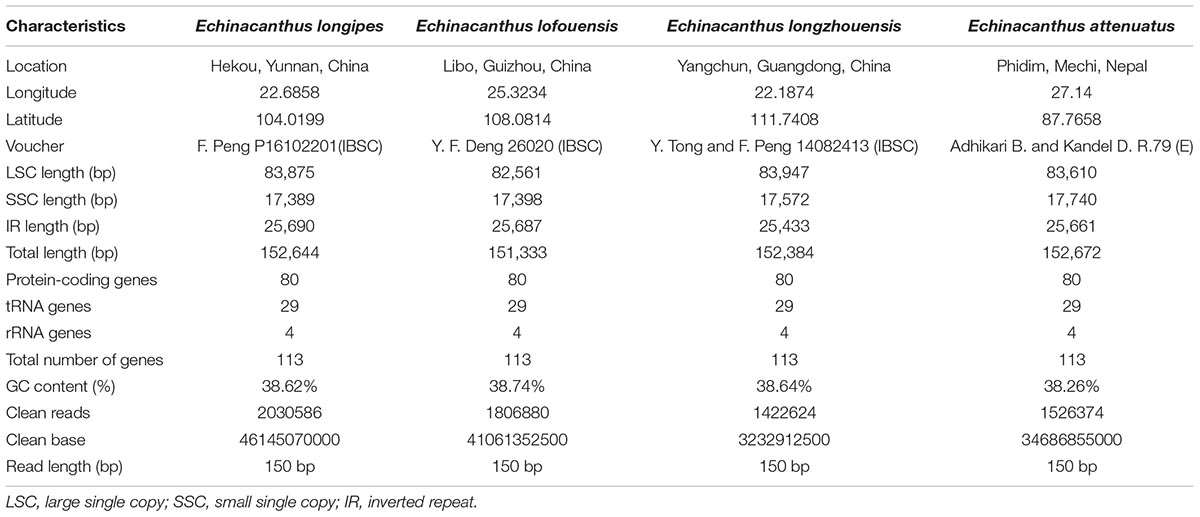
Table 1. The basic characteristics of the chloroplast genomes of four Echinacanthus species.
Genome Sequencing, Assembling, and Annotation
The chloroplast genome was amplified in overlapping fragments according to the methods described by Yang et al. (2014) at Germplasm Bank of Wild Species, Kunming Institute of Botany, Chinese Academy of Sciences. DNA samples were sheared into fragments of about 500 bp and used to construct libraries following the manufacturer’s instructions (Illumina, San Diego, CA, United States). Paired-end sequencing was conducted on Illumina HiSeq X-Ten platform. Raw reads were quality trimmed and the clean data were assembled after removing adapters using CLC Genomic Workbench v10 (CLC Bio., Aarhus, Denmark). Moreover, the raw sequencing data had been deposited in SRA (PRJNA504924). And then, the contigs were checked using BLAST searches2 against the available complete chloroplast sequence of A. paniculata (NC_022451). Relative position and direction of each contigs were manually adjusted according to the reference genome. Finally, the complete chloroplast genome was acquired in Geneious v.8.1 (Kearse et al., 2012). Annotation of the chloroplast genome was conducted using OGDRAW (Lohse et al., 2013). The genome map of the species was illustrated with the help of CPGAVAS (Liu et al., 2012), and the annotated chloroplast genome sequences were submitted to NCBI under accession numbers: MF490441, MH045155, MH045156, and MH045157.
Repeat Sequence Analysis
We identified simple sequence repeats of Echinacanthus with MISA (Thiel et al., 2003) by setting the minimum number of repeats to 10, 5, 4, 3, 3, and 3 for mono-, di-, tri-, tetra-, penta-, and hexanucleotides, respectively.
Genome Comparison and Analysis
The complete chloroplast genomes of the four species were compared using the program mVISTA (Frazer et al., 2004). DnaSP v.5.0 (Librado and Rozas, 2009) was employed to analyze nucleotide variability among the four species of Echinacanthus. We also compared the borders of large single copy (LSC), small singles copy (SSC), and inverted repeat (IR) regions in the genomes of the four species.
Phylogenomic Analysis
Three chloroplast genomes of Acanthaceae (A. paniculata, NC_022451; R. breedlovei, KP300014; S. cusia, MG874806) and four outgroups in Lamiales (Erythranthe lutea (L.) G. L. Nesom, NC_030212; Scrophularia dentata Royle ex Benth., KT428154; Tanaecium tetragonolobum (Jacq.) L. G. Lohmann, KR534325; Sesamum indicum L., NC_016433) were downloaded from GenBank. The chloroplast genomes of these species and Echinacanthus species were aligned with MAFFT v.7 (auto strategy) (Katoh and Standley, 2013). The data matrix was subjected to Bayesian analysis using MrBayes v.3.2 (Ronquist et al., 2012). Before Bayesian analysis, TVM+I+G model was selected using program modeltest 3.7 under the Akaike Information Criterion (AIC) (Posada and Crandall, 1998). All parameters were set according to the chosen model as follow: statefreqpr = fixed (0.3112, 0.1886, 0.1829, 0.3173) revmat = fixed (0.9096, 1.7823, 0.4160, 1.0306, 1.7823, 1.000), shapepr = fixed (0.8693), apinvar = fixed (0.3286). The analysis, implementing Markov chain Monte Carlo (MCMC) algorithm, started from random trees. It was sampled every 100 generation and ran for 1,000,000 generations with four incremental heated chains. The first 1,000 trees corresponding to the “burn-in” period were discarded, and the remaining trees were used to construct the majority-rule consensus tree. Posterior probabilities (PP) > 0.95 were considered significant support for a clade. Maximum parsimony analysis was run in Paup∗ v.4.0b10 (Swofford, 2003). All characters were equally weighted and unordered. Heuristic search was performed with 1,000 replicates of random addition sequence, tree bisection-reconnection (TBR) branch swapping, retaining up to 10 most parsimonious trees at each replicate, and random addition of sequences with 100 replicates. Branches of zero length were collapsed and all multiple parsimonious trees were saved. Strict consensus trees were constructed from the most parsimonious trees. Bootstrap analyses were used to evaluate the support for individual clades (Felsenstein, 1985) with 1,000 replicates. Branches receiving bootstrap values (BS) > 70% were considered well supported (Hillis and Bull, 1993).
Positive Selection Analysis of Protein Sequence
In order to detect the protein-coding genes under selection in Acanthaceae, the sequences for each gene were aligned separately and the maximum likelihood phylogenetic tree based on complete chloroplast was reconstructed using Paup∗ v.4.0b10 (Swofford, 2003). The synonymous (dS), non-synonymous (dN) nucleotide substitution rates and the dN/dS ratio (ω) were calculated using the codeml in Paml4.7 (Yang, 2007) with branch test model (Nielsen and Yang, 1998). Before analyses, the clade of Sino-Vietnamese species were set as foreground clade, and the others were set as background clade. The options of the two analyses were set to seqtype = 1, NSites = 0, model = 0 or model = 2. The likelihood ratio test (LRT) was used to estimate the quality of each model (Yang and Nielsen, 2002).
Results
Features of the Chloroplast Genome
After removing low-quality reads and adapter sequences, 1,422,624–1,806,880 clean reads (150 bp average read length) were obtained for the four species. Through de novo assembly, contigs mapped to the closest species reference (A. paniculata) were then used for reconstructing the Echinacanthus cpDNA. The complete chloroplast genomes of the four species of Echinacanthus ranged from 151,333 bp (E. lofouensis) to 152,672 bp (E. attenuatus) with 38.26–38.74% GC content (Table 1). They had a typical circular structure with four junction regions: a separate LSC region of 82,561–83,947 bp, a SSC region of 17,398–17,740 bp, and a pair of IRs (IRa, IRb) each 25,433–25,690 bp (Table 1 and Figure 1). A total of 113 unique genes, comprising 80 protein-coding genes, 29 tRNA genes, and 4 rRNA genes, were detected in each Echinacanthus cpDNA (Table 2). The gene number, order, and name were very similar among the four Echinacanthus species (Figure 1). The seven protein-coding genes, seven tRNA genes, and four rRNA genes distributed in the two IR regions were present in two copies (Table 2). Of the 113 distinct genes, 18 genes contained one intron (15 genes) or two introns (ycf3, clpP, rps12) in the four chloroplast genomes. The rps12 gene in Echinacanthus was recognized as trans-spliced gene, with the first exon located in the LSC region and the other two exons distributed in the IR regions. We also detected eight genes with partially overlapping sequences: trnK-UUU/matK, atpE/atpB, psbD/psbZ, and rps3/rpl22. Owing to the presence of internal stop codons, the genes ycf1 and ycf15 were identified as pseudogenes in E. longipes and E. attenuatus, respectively, while, ycf2 and rps19 were recognized as pseudogenes in E. lofouensis. In E. longzhouensis, rps19 located in the IRb/LSC junction region was identified as pseudogene because of incomplete gene duplication.
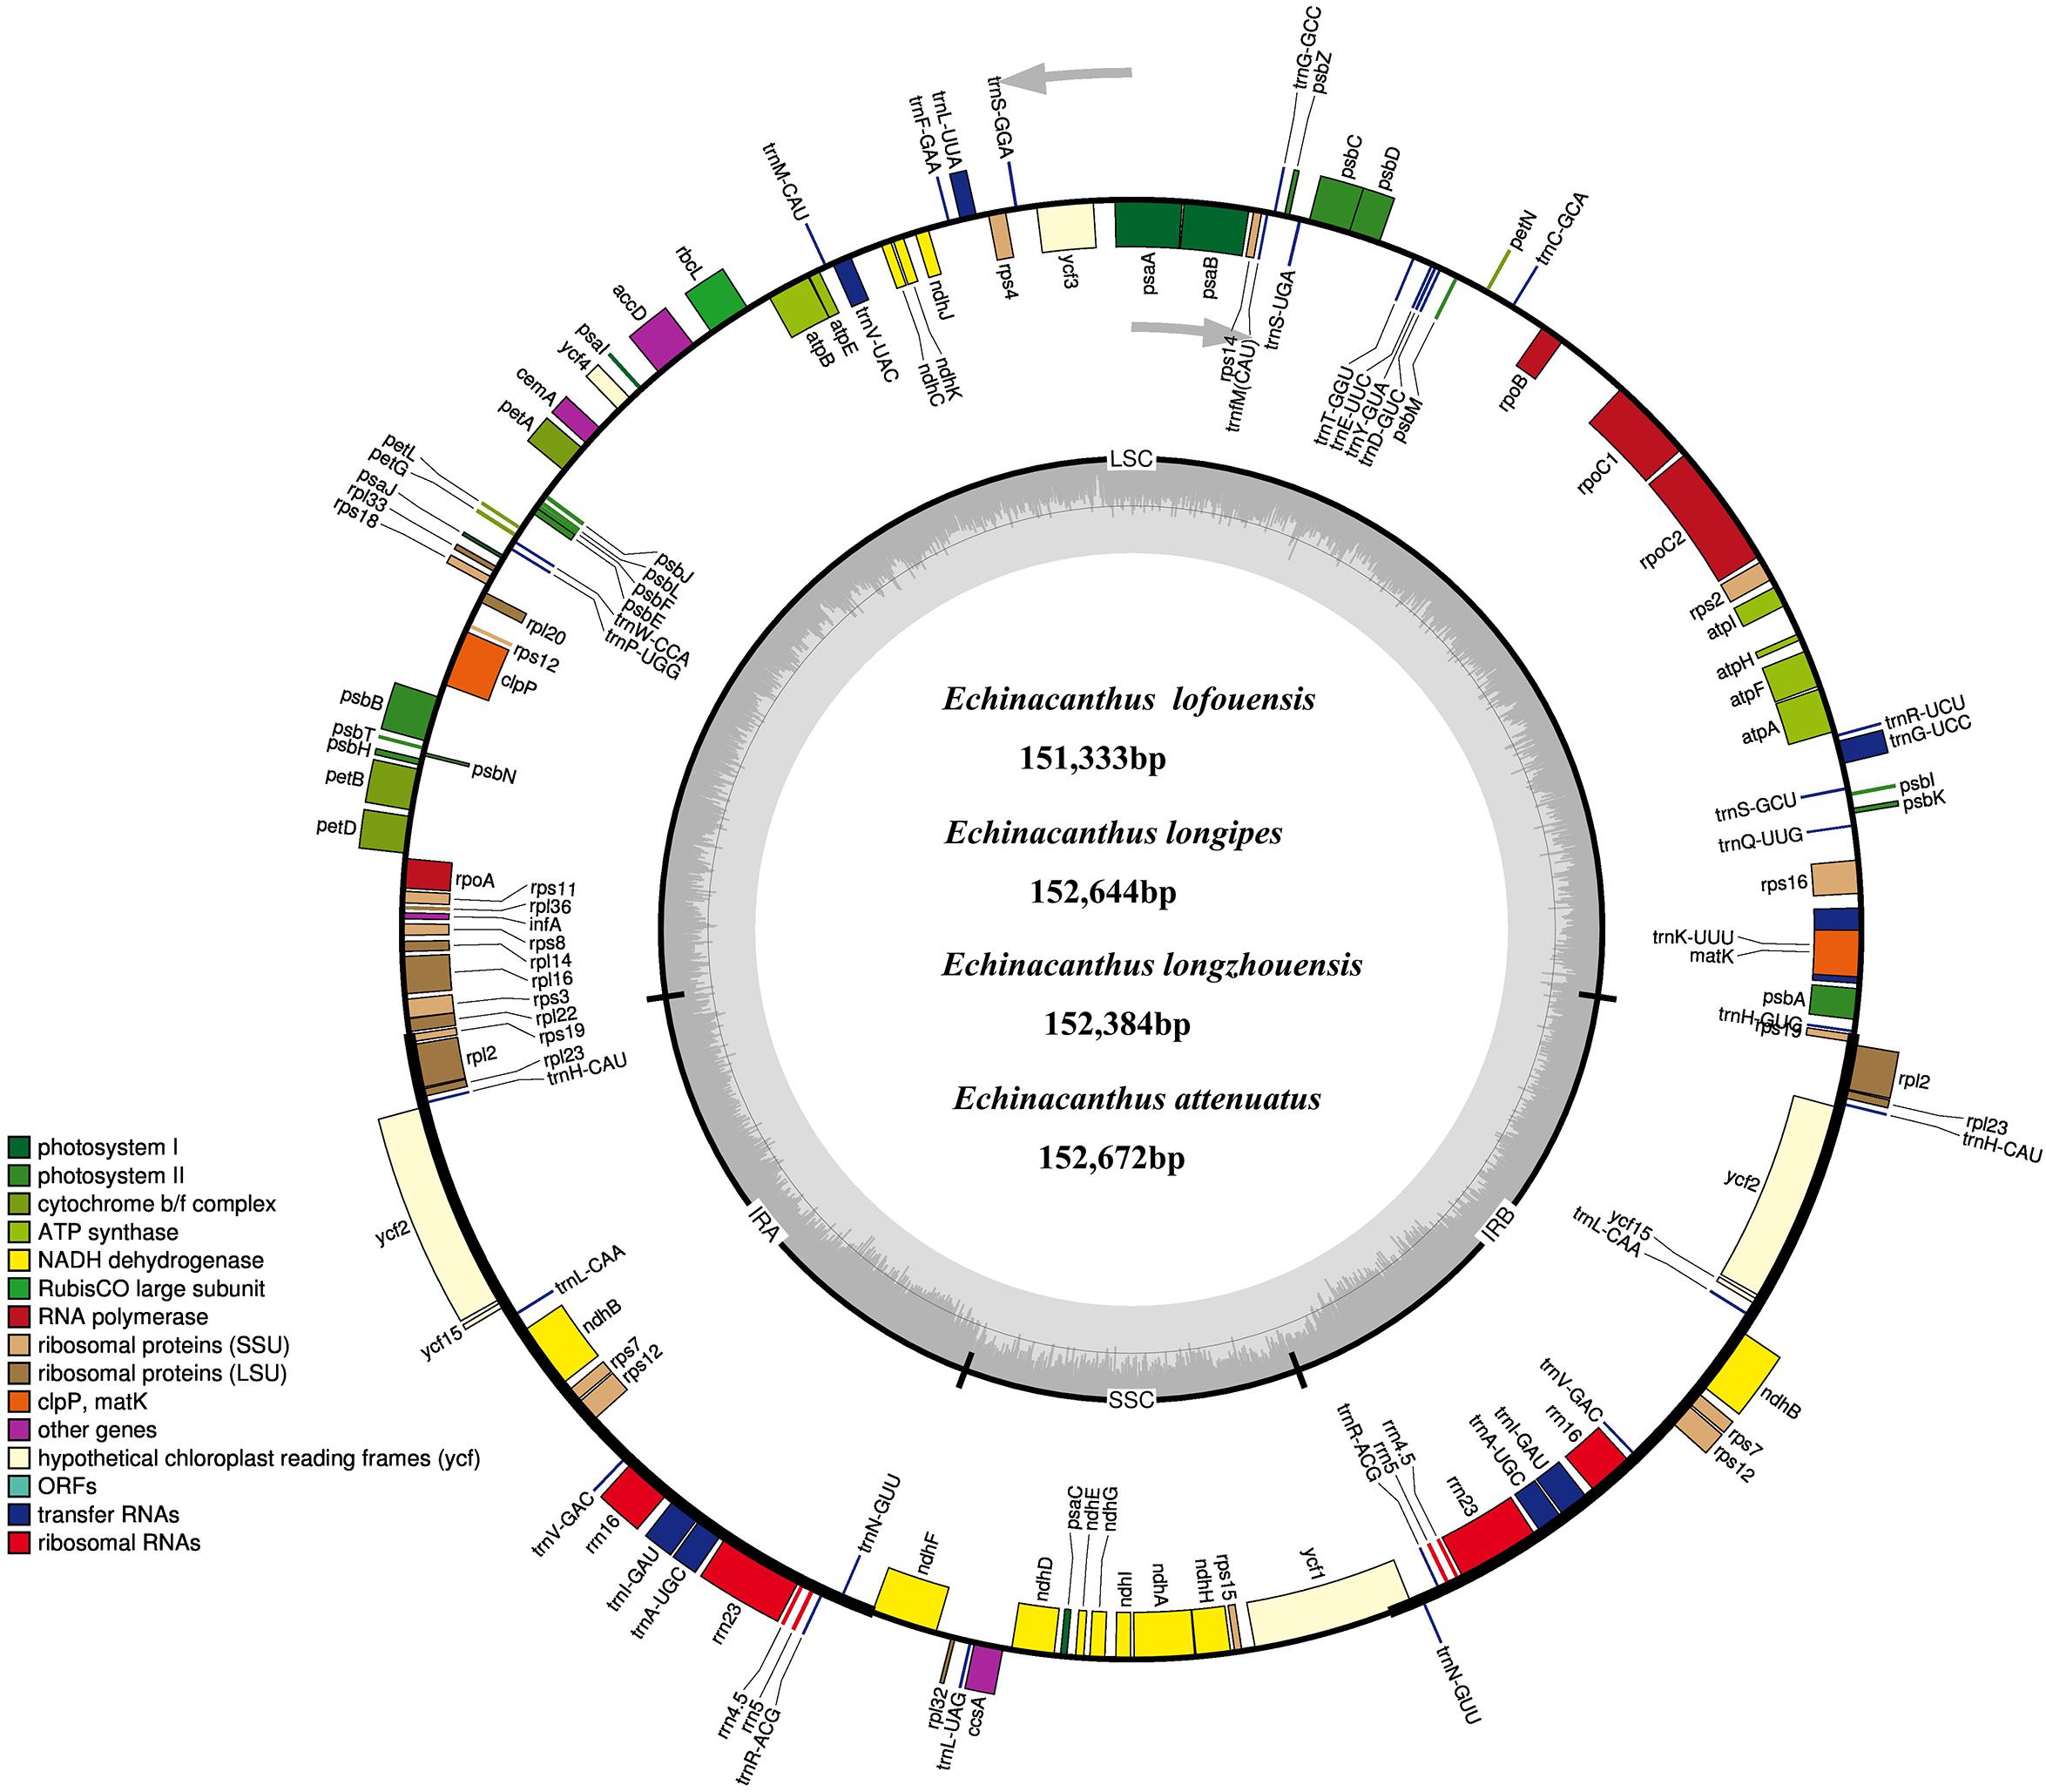
Figure 1. The chloroplast genome map of four Echinacanthus species. Genes lying outside the circle are transcribed in the counter clockwise direction, while those inside are transcribed in clockwise direction. The colored bars indicted different functional group. The darker gray area in the inner circle denoted GC content while the lighter gray corresponds to the AT content of the genome. LSC, large single copy; SSC, small single copy; IR, inverted repeat.
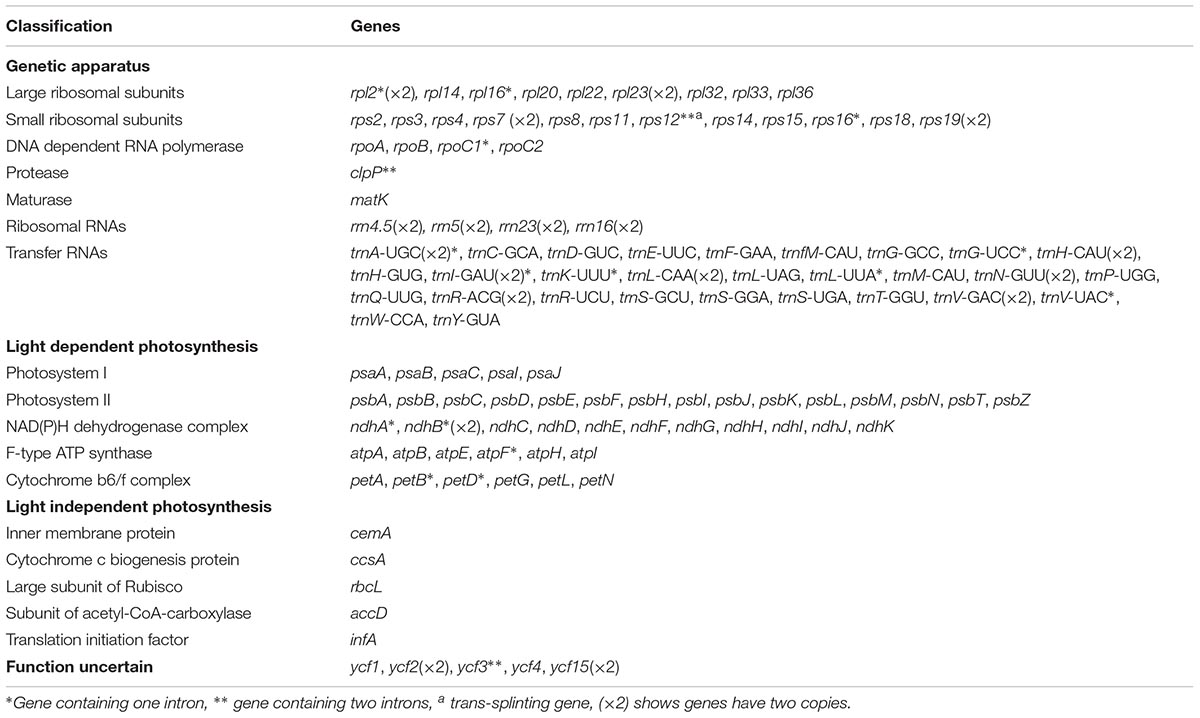
Table 2. Gene contents in four Echinacanthus species chloroplast genome.
Simple Sequence Repeats Analysis
A total of 37–45 SSR loci were discovered in the four chloroplast genomes. Mono-, di-, tri-, and tertranucleotide SSRs were all detected in the four species (Figure 2). Additionally, pentanucleotide and hexanucleotide SSRs were found in E. lofouensis and E. longipes, respectively. In the four species, more than half of the SSRs were mononucleotide repetitions (51.16%, 56.76%, 52.63%, and 66.67% in E. longipes, E. lofouensis, E. longzhouensis, and E. attenuatus, respectively). Meanwhile, of the detected SSR regions, 86 SSRs were identified in intergenic spaces, while 51 SSRs were located in the coding DNA sequence and 26 SSRs in the coding sequence introns (Supplementary Table S1). Interestingly, all dinucleotide SSRs belonged to AT type and the majority of mononucleotide, trinucleotide, tetranucleotide, pentanucleotide, and hexanucleotide SSRs were especially rich in A or T (Supplementary Table S1).
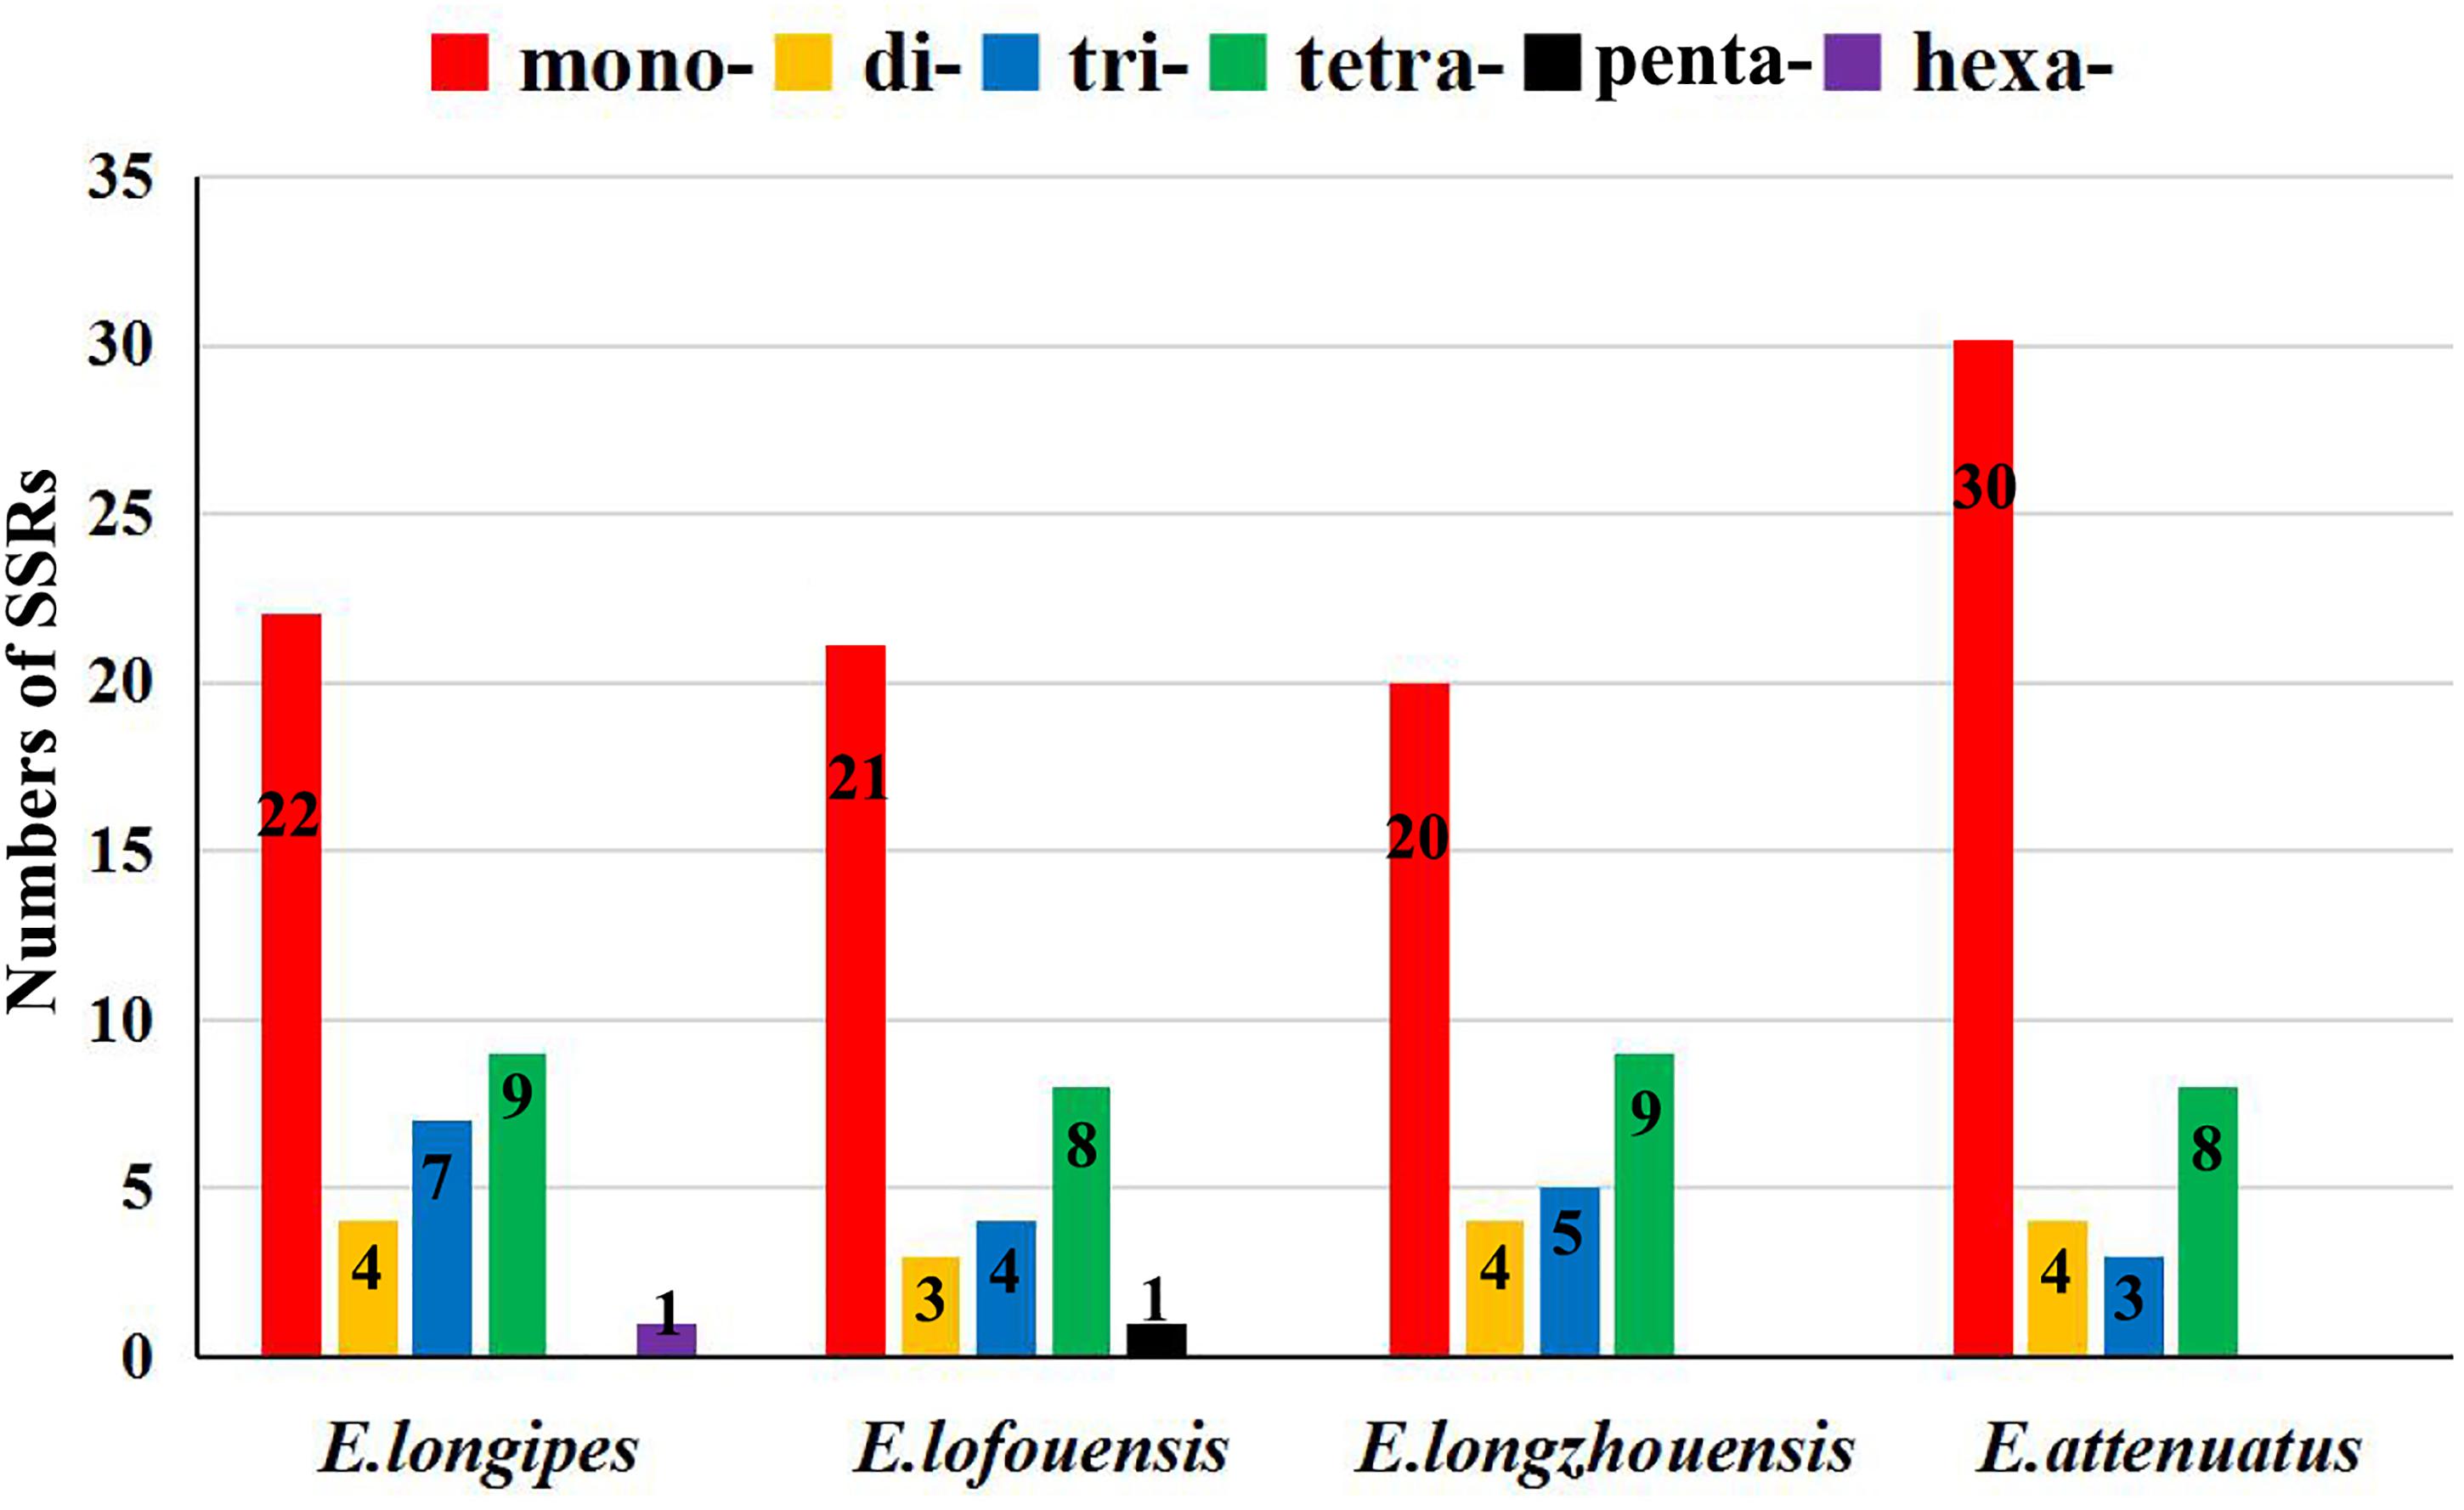
Figure 2. The numbers of the simple sequence repeats (SSRs) in the chloroplast genomes of four Echinacanthus species. mono-, mononucleotides; di-, dinucleotides; tri-, trinucleotides; tetra-, tetranucleotides; penta-, pentanucleotides; hexa-, hexanucleotides.
Comparative Genomic Analysis
We used program mVISTA to analyze the overall sequences of the four species using the annotated E. lofouensis sequence as a reference (Figure 3). A genome alignment revealed an overall high sequence similarity among the four species. In addition, LSC and SSC regions were more divergent compared with IR regions. The regions with highest level of divergence were rrn16, ndhF, ndhA, ycf1, psbA-trnH, accD-psaI, rps16-trnQ-UUG, trnS-GCU-trnG-UCC, rpoB-trnC-GCA, psaA-ycf3, trnS-GGA-rps4, ndhF-rpl32, and rps15-ycf1. Furthermore, the comparative genomic analyses showed lower sequence divergence between Sino-Vietnamese Echinacanthus species. The highest level of divergence across them was detected in rrn16, ndhA, ycf1, rps16-trnQ-UUG, and psaA-ycf3.
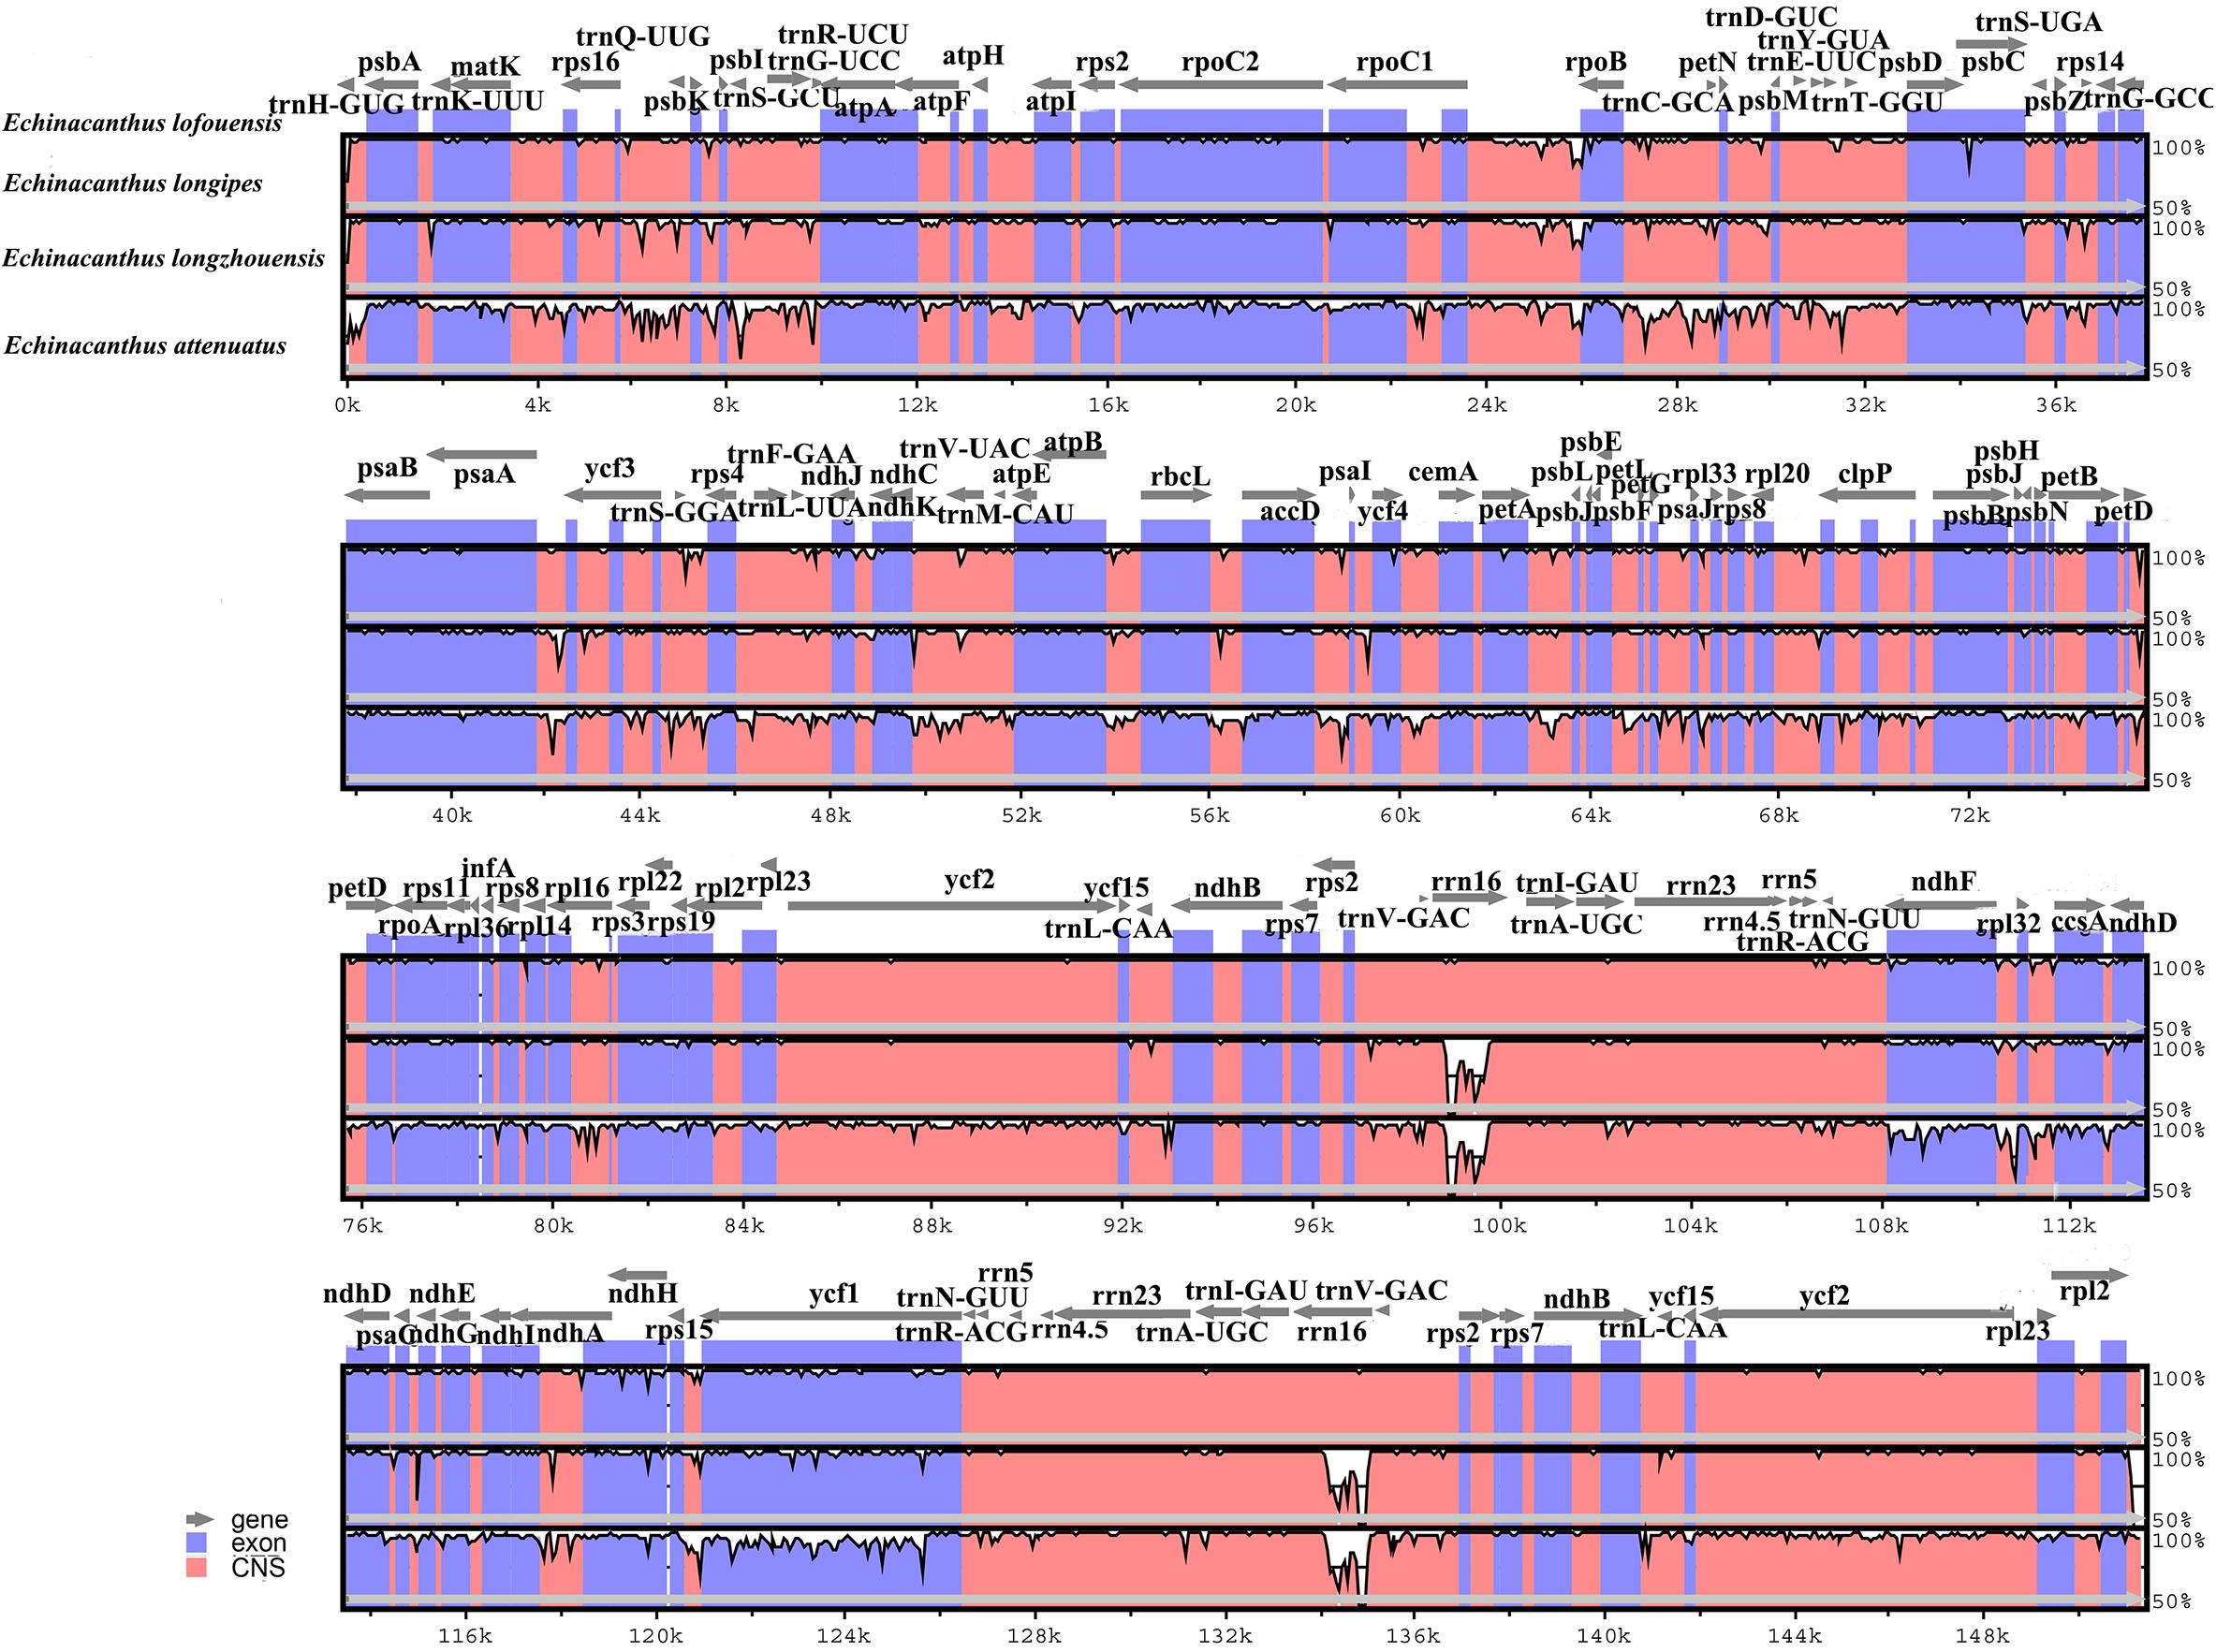
Figure 3. Comparison of four Echinacanthus chloroplast genomes using mVISTA program, taking the annotation of E. lofouensis as a reference. The top line shows the genes in order. A cut-off of 70% identity was used for the plots and the Y-scale represents the percent identity between 50 and 100%. Genome regions are color-coded as exon and conserved non-coding sequences (CNS).
For the further understanding the sequence divergence among these four Echinacanthus species, the coding regions and intergenic regions were extracted to calculate nucleotide variability (Pi) (Supplementary Table S2 and Figure 4). The Pi value ranged from 0 to 0.10479. The coding regions were also more conserved compared to the intergenic spacer. Meanwhile, the LSC and SSC regions were much more divergent than the IR region. However, the highest nucleotide diversity (Pi = 0.10479, rrn16) was present in the IR region. A total of 22 regions, trnS-GGA, rrn16, ycf1, trnH-psbA, trnK-UUU-rps16, rps16-trnQ-UUG, psbK-psbI, trnS-GCU-trnG-UCC, rps2-rpoC2, trnC-GCA-petN, trnD-GUC-trnY-GUA, ycf3-trnS-GGA, trnS-GGA-rps4, petG-trnW-CCA, rps8-rpl14, ndhF-rpl32, rpl32-trnL, trnL-UAG-ccsA, ccsA-ndhD, ndhC-ndhE, ndhE-ndhG, and rps15-ycf1 were recognized as hotspot regions with nucleotide diversity > 0.04. Of those, 13 regions were located in the LSC, one in the IR, and eight in the SSC region (Supplementary Table S2).
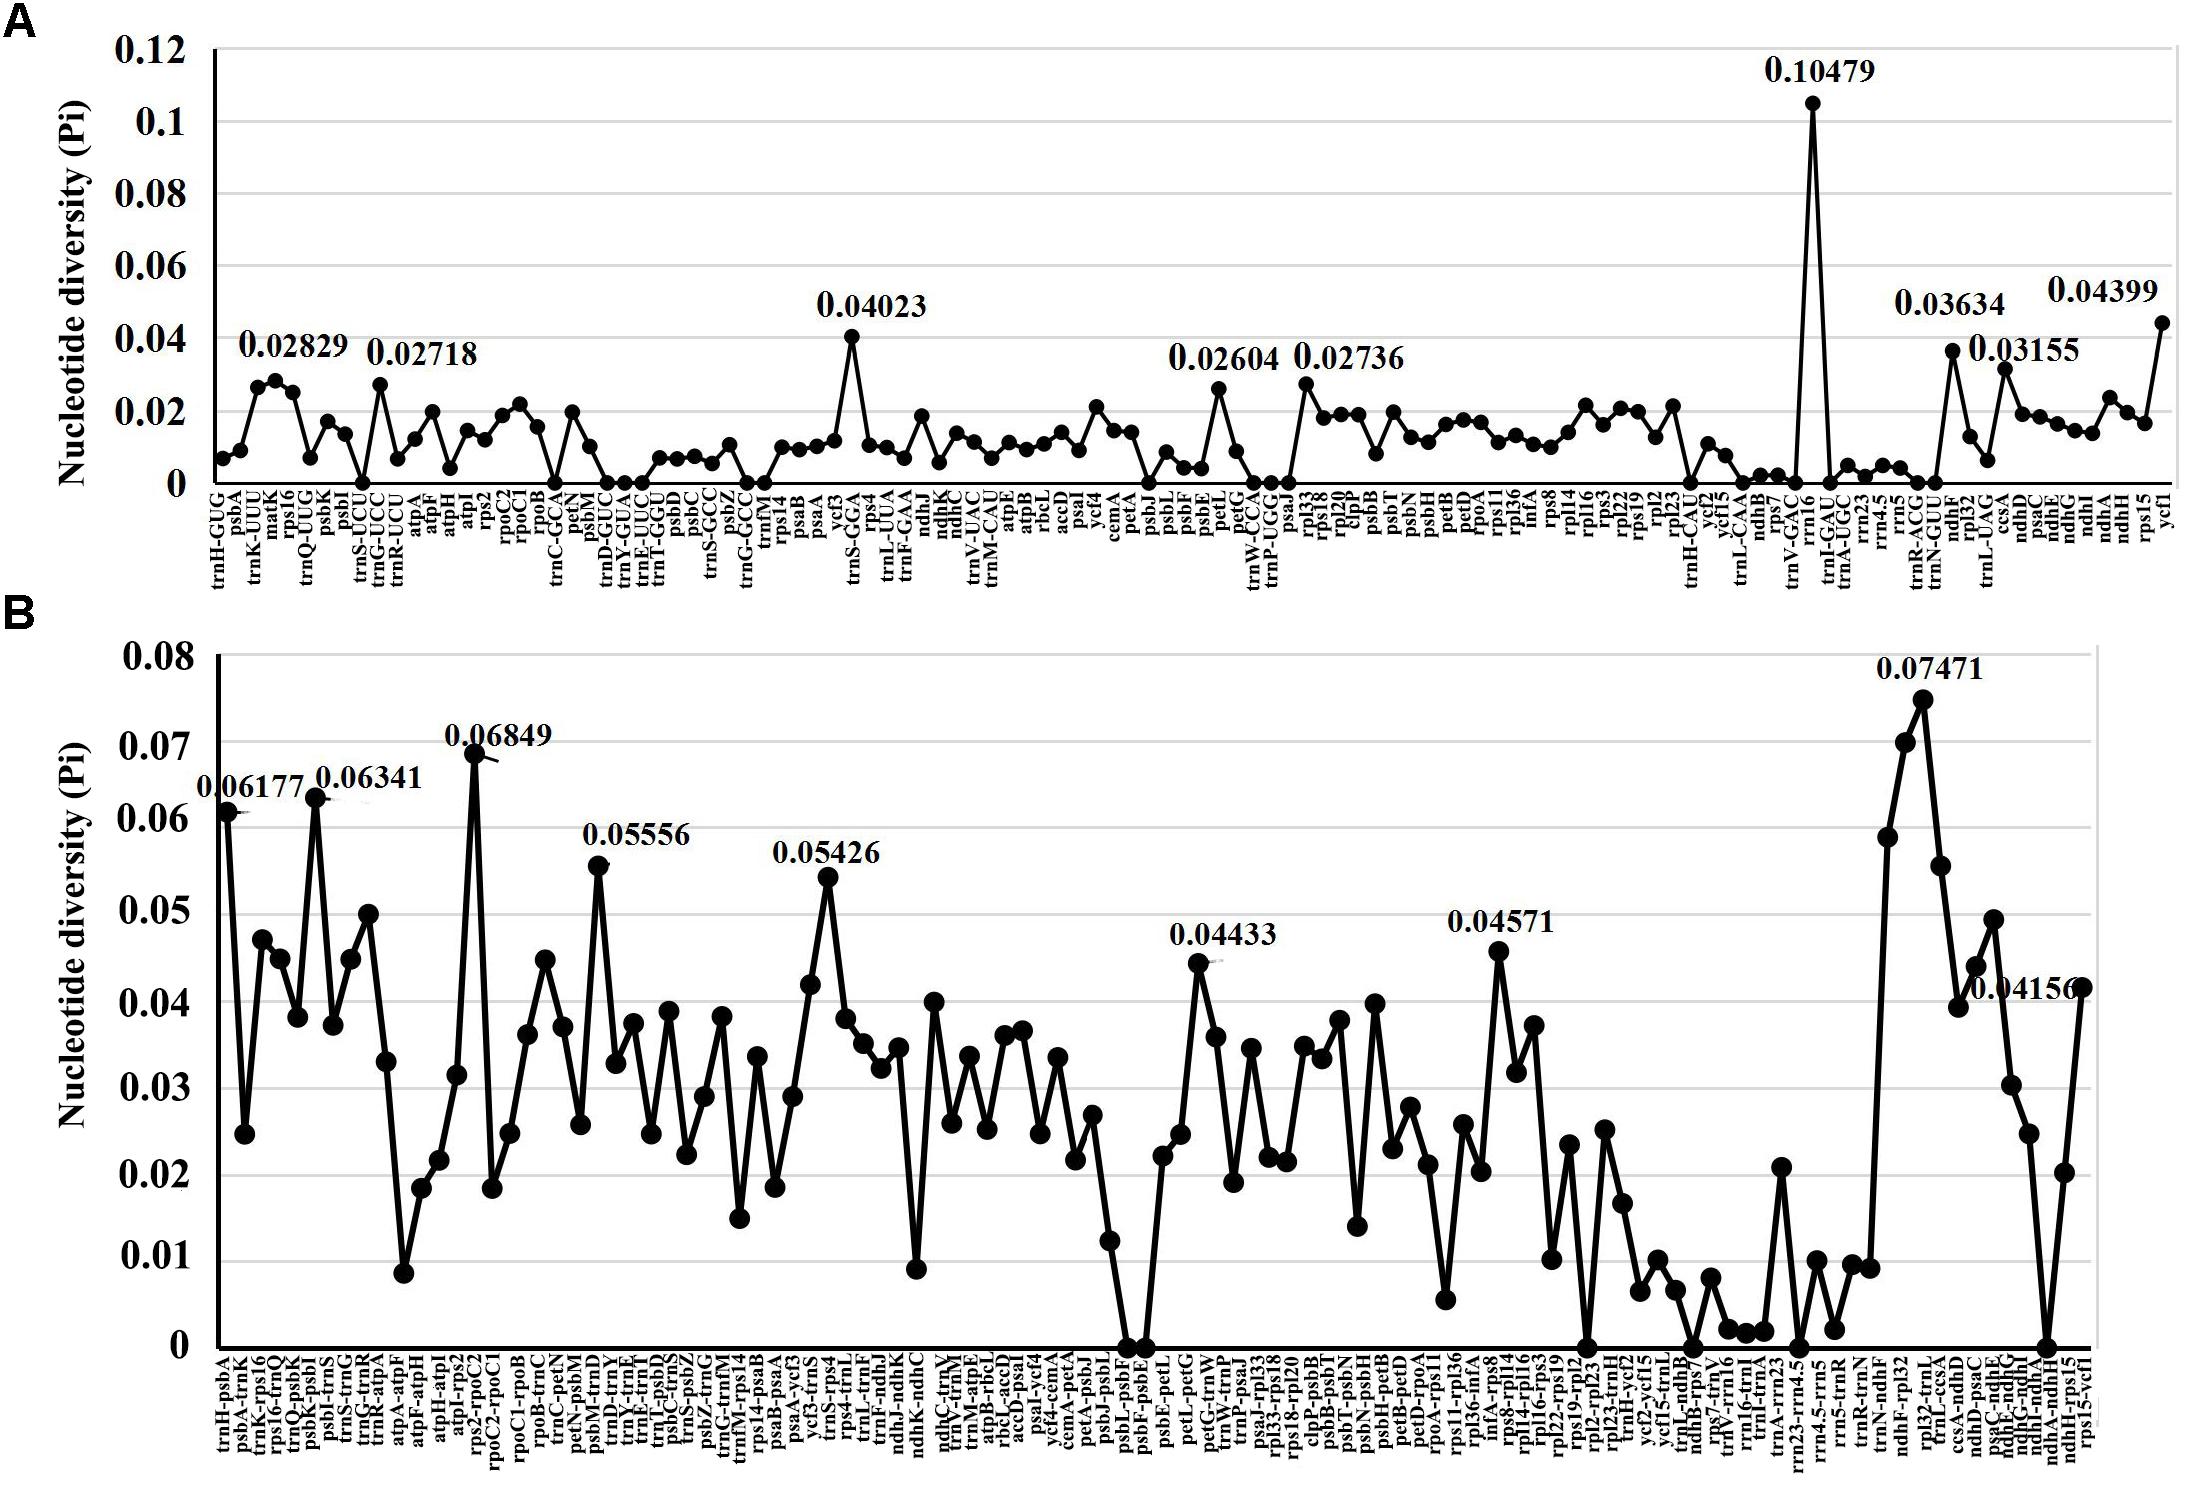
Figure 4. Comparative analysis of the nucleotide diversity (Pi) values among four Echinacanthus chloroplast genomes. (A) Coding regions. (B) Non-coding regions. X-axis: name of the regions; Y-axis: nucleotide diversity (Pi).
The expansion and contraction of the border regions were analyzed for the four Echinacanthus species (Figure 5). The genes rpl22, rps19, ndhF, ycf1, and trnH were present at the junction of the LSC/IRa, IRa/SSC, SSC/IRb, and IRb/LSC borders. The LSC/IRa junction regions were relatively stable in E. lofouensis, E. longipes, and E. attenuatus. There were 33–45 bp between rpl22 and the LSC/IRa border, meanwhile, the rps19 generated a distance of 15 bp to another LSC/IRa junction. In contrast, there were 96 bp protrusion of rps19 gene into IRa region in E. longzhouensis. Moreover, the IRa/SSC borders were well conserved among the four cp genomes, of which the IRb region expanded into the gene ndhF with 54–72 bp. The ycf1 gene crossed the SSC/IRb junction extending 796–799 bp to IRb regions. In addition, the distance between trnH-GUG and IRb/LSC border for all the four species varied from 41 to 95 bp. On the other hand, although the rps19 gene was located in the IRb/LSC border, the exception was E. longzhouensis, in which the ψrps19 gene was incomplete duplicated.
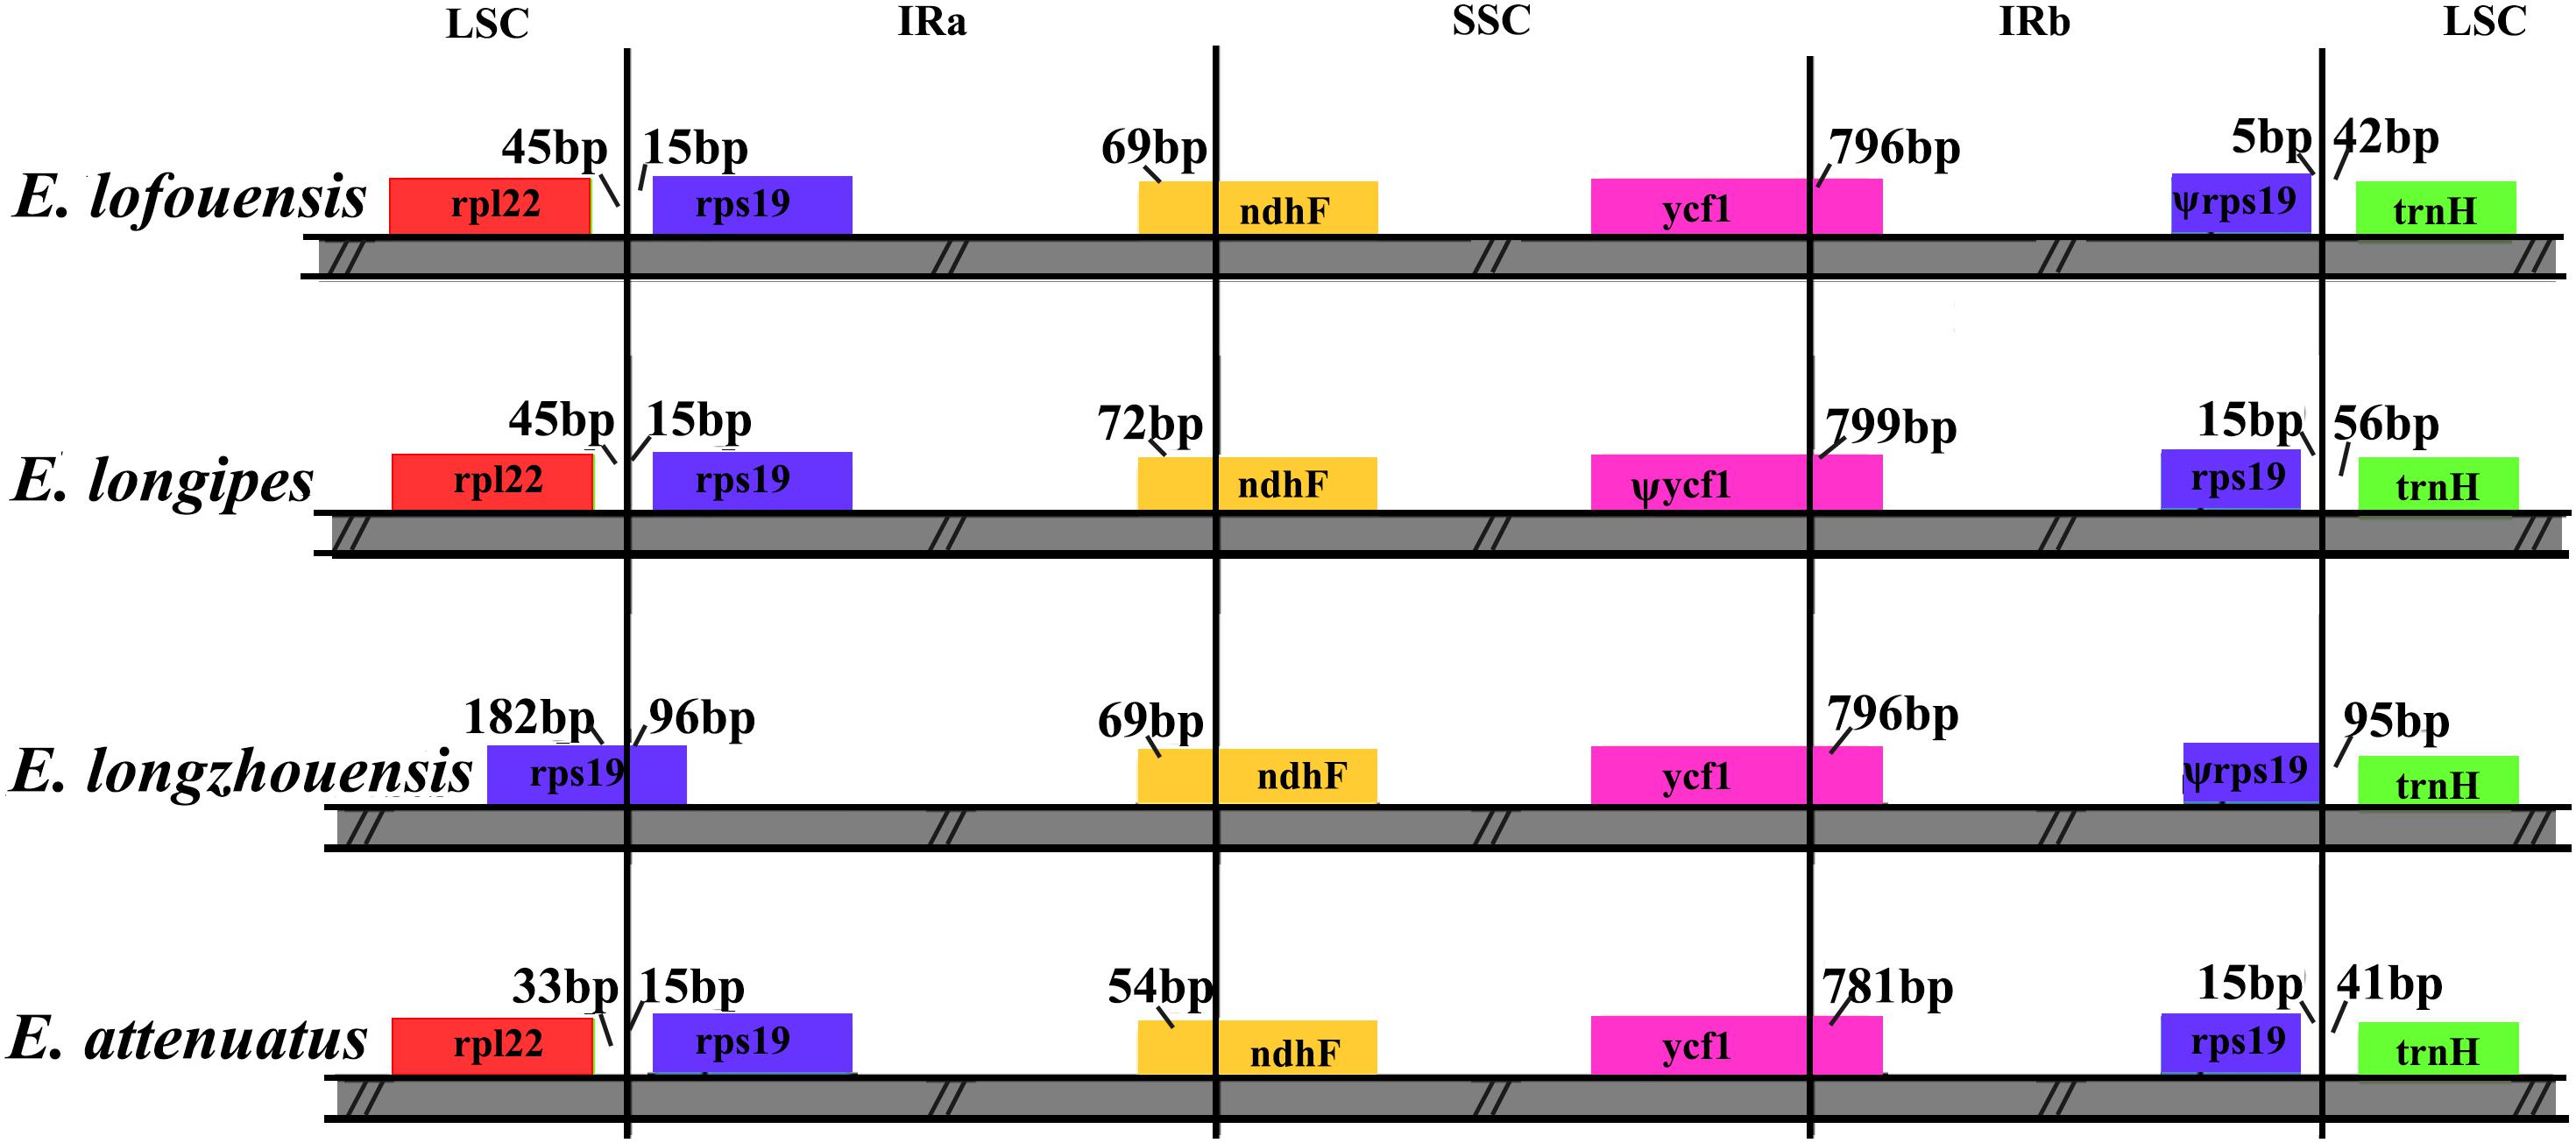
Figure 5. Comparison of the LSC, IR, and SSC junction regions among four Echinacanthus chloroplast genomes. Genes are denoted by colored boxes. Ψ shows the pseudogene. The numbers above the gene features indicates the distance between the end of the gene and the borders sites. The slashes indicate the location of the distance. This figure is not to scale.
Phylogenetic Analysis
In order to resolve the phylogenetic relationships of Echinacanthus, the complete chloroplast genomes of seven species in Acanthaceae and four outgroups were used to build the phylogenetic trees. In our analysis, the tree topologies of the datasets based on the parsimony and Bayesian analyses were highly congruent (Figure 6). All the sampled species of Acanthaceae were clustered into one clade with 100% bootstrap value or the Bayesian posterior probability. Moreover, three major clades were identified in Acanthaceae and the analyses obtained high support for all of the three nodes. At the same time, Echinacanthus species were segregated into two clades. E. lofouensis, E. longipes, and E. longzhouensis were in a well-supported clade (PP = 1.00, BS = 100), with E. longzhouensis being the earliest diverging lineage. E. attenuatus and S. cusia formed a clade, which was identified as a sister to R. breedlovei with high support value (PP = 1.00, BS = 100).
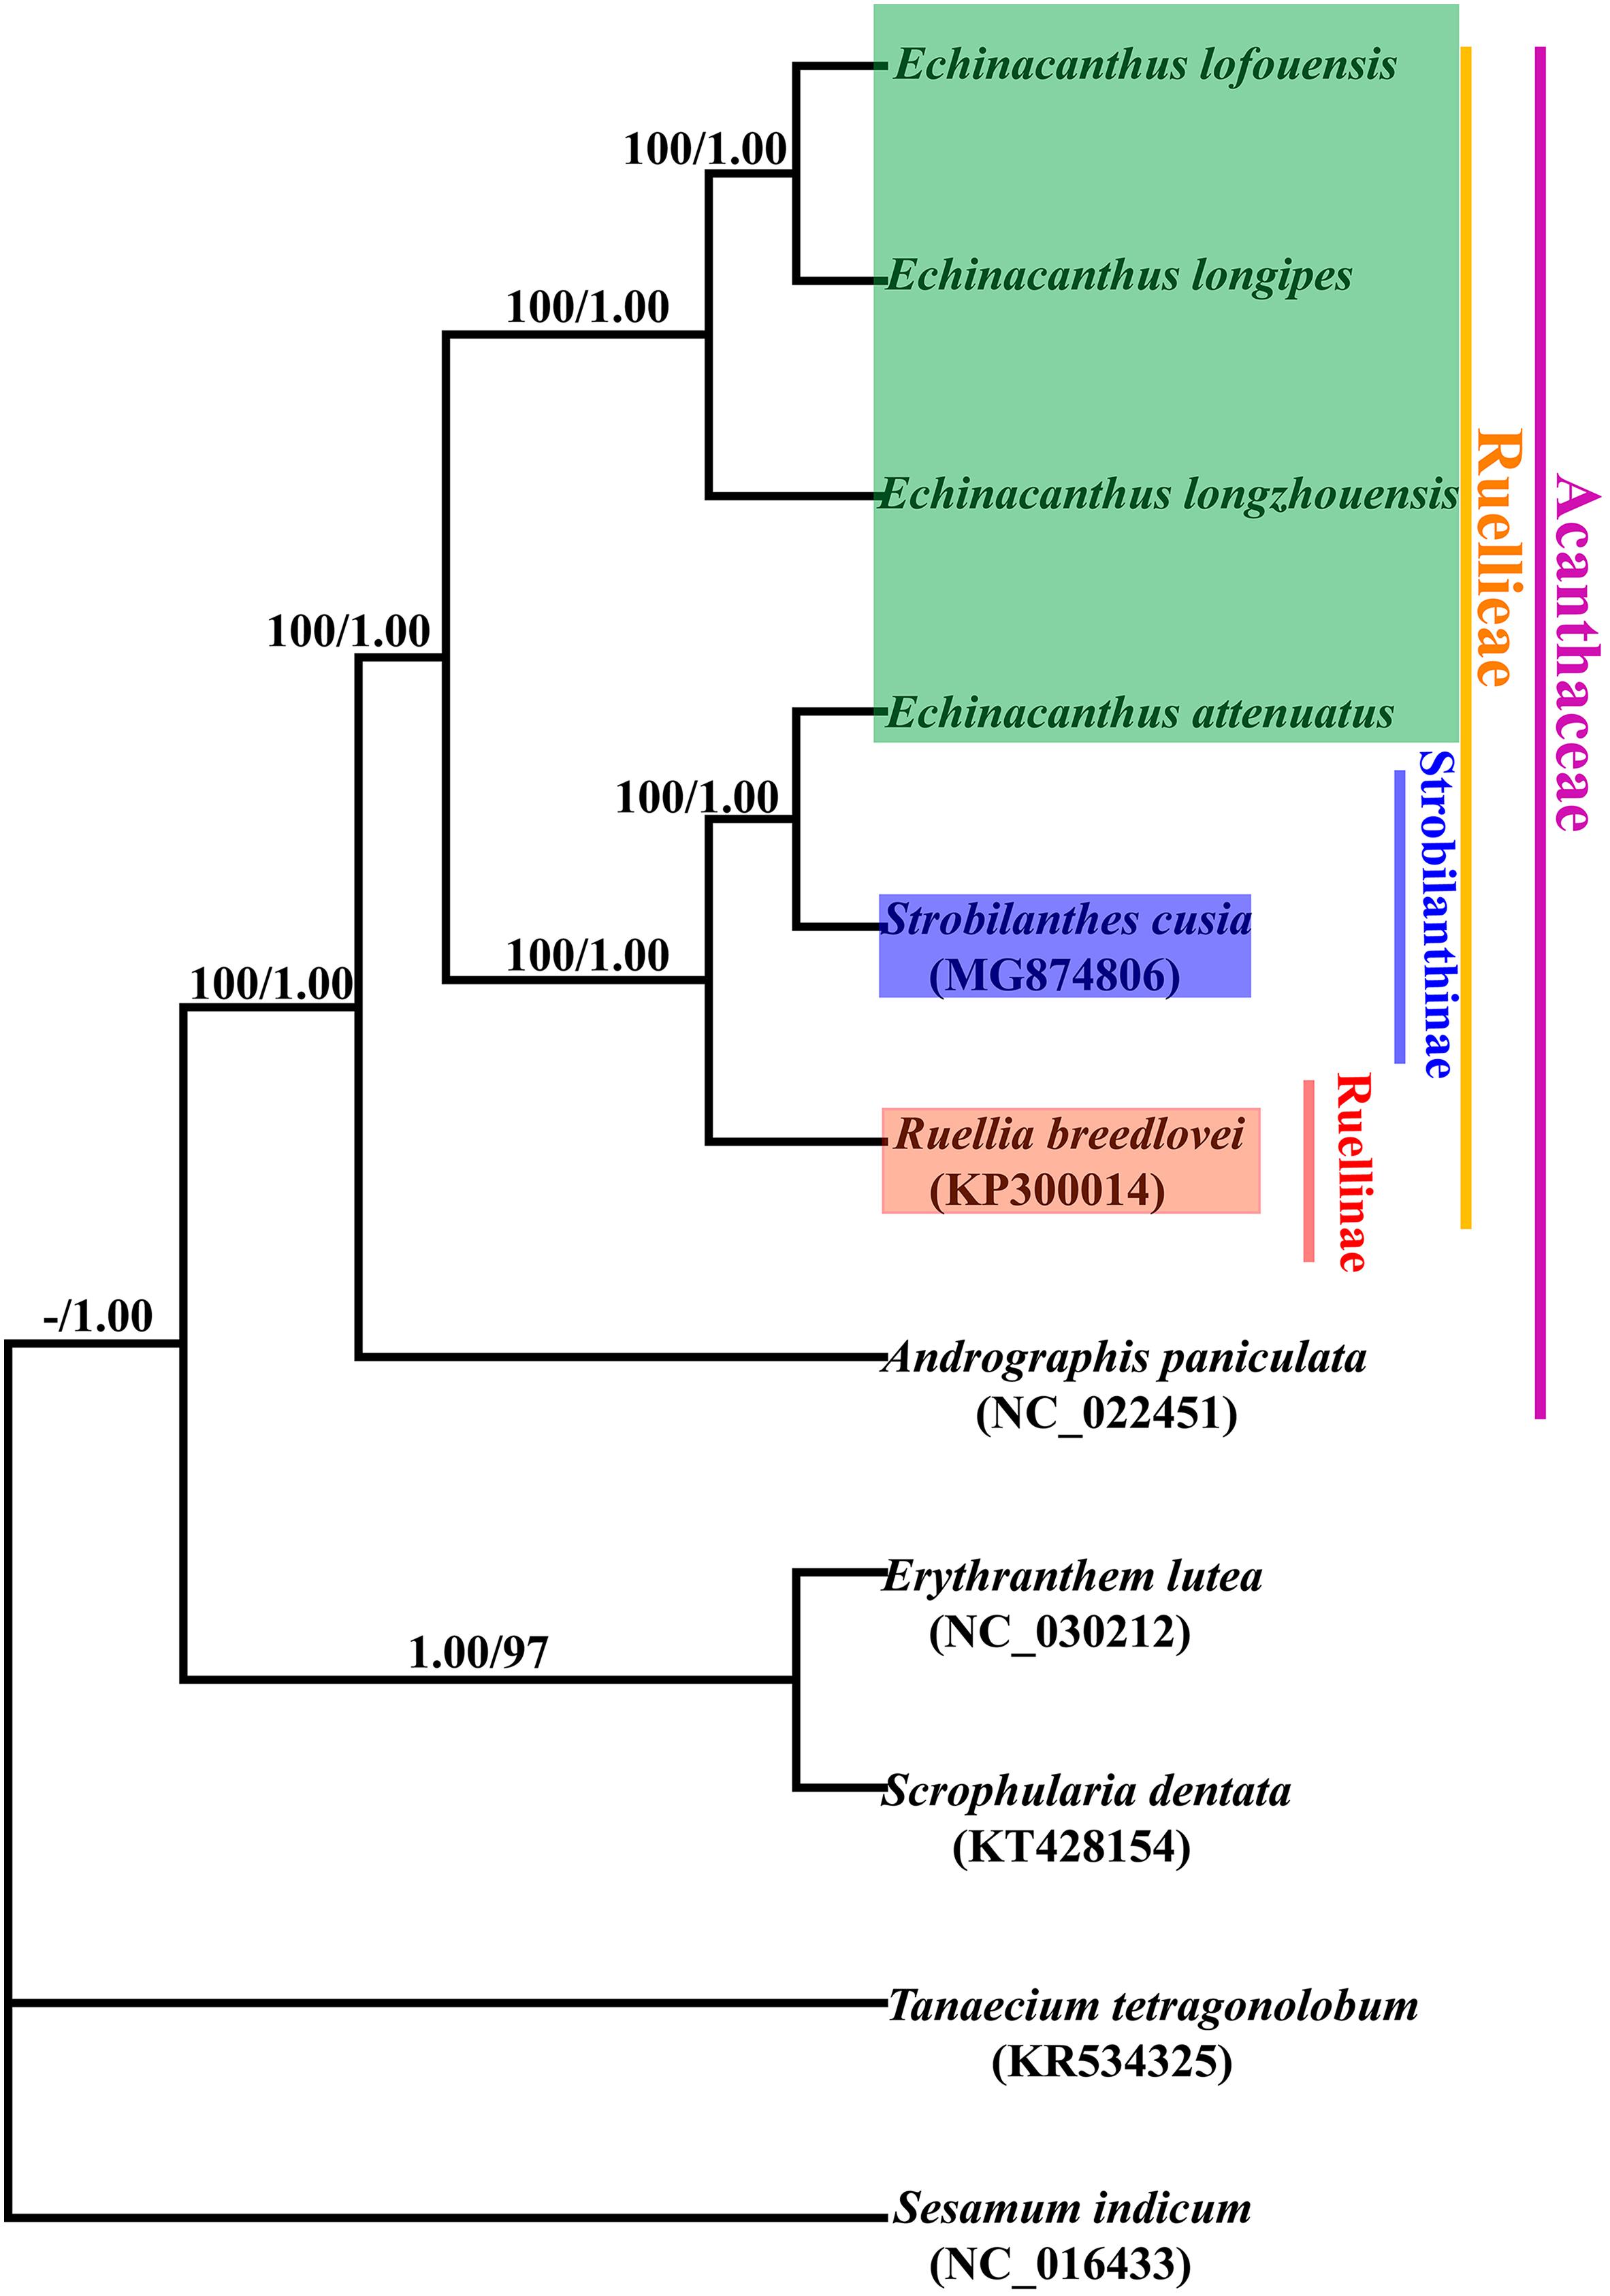
Figure 6. Phylogenetic tree conducted using Bayesian Inference (BI) and most parsimonious (MP) methods based on whole complete genomes from different species. The numbers above branches represent posterior probability (PP)/bootstrap percentage (BP).
Positive Selection Analysis of Protein Sequence
In order to assess the selective pressure on Sino-Vietnamese karst species of Echinacanthus in Acanthaceae, the branch model was used to examine the genes under positive selection. In the present study, the null hypothesis was that all the branches had the same ω and the alternative hypotheses was that the foreground clade had different ω. Then, based on the LRT, P-value > 0.05 denoted the alternative hypothesis and P-value < 0.05 represented the null hypothesis. Moreover, the ratio of dN/dS > 1 indicated that the genes were under positive selection. dN/dS < 1 was suggested that the genes were under negative selection. dN/dS = 1 indicated neutral selection. Thus, we found that 12 genes including ndhC, ndhJ, psbK, psbN, rpl14, rpl16, rps4, rps15, rps18, rps19, infA, and rpoB were under positive selection in the branch of Sino-Vietnamese karst species (Supplementary Table S3).
Discussion
Chloroplast Sequence Variation
The analysis of the chloroplast genomes of the four Echinacanthus species presented herein revealed a typical quadripartite structure, with a pair of IR regions, a single LSC region, and a single SSC region. The size of the genome ranged from 151,333 (E. lofouensis) to 152,672 bp (E. attenuatus), which was longer than the genomes of A. paniculata (Ding et al., 2016), R. breedlovei, and S. cusia (Chen et al., 2018). In addition, the four species shared similar GC content (about 38%). In particular, rps12 in Echinacanthus was recognized as the trans-spliced gene, which was in line with observations in other species (Hildebrand et al., 1988; Liu et al., 2016; Gichira et al., 2017; Chen et al., 2018). The overall gene contents and arrangement were similar among the four Echinacanthus species. Nevertheless, comparative genome analysis with mVISTA revealed the DNA sequences divergence among related species. The comparison showed that the cp genomes among E. longipes, E. longzhouensis, and E. lofouensis were highly conserved. Interestingly, we observed that E. attenuatus had greater difference with the other three species. Our results had confirmed the differentiation of the geographic distribution.
Another remarkable variation among the four Echinacanthus species was the location of the boundaries between the four chloroplast regions. Location of the boundaries, especially of the contraction and expansion of the regions, sheds light on the evolution of taxa (Nazareno et al., 2015; Menezes et al., 2018). As a typical chloroplast genome structure, the IR/LSC boundaries in E. longzhouensis expand into rps19. This expansion may be an ancestral symplesiomorphy in Liliaceae (Li P. et al., 2017). In the present phylogenetic study, although E. longzhouensis was not the basal species of Echinacanthus, it was basal in the Sino-Vietnamese Echinacanthus clade. Thus, the result may provide new insight into the evolution of Echinacanthus species from the Sino-Vietnamese karst region. Furthermore, LSC/IR regions of the chloroplast genome in Lamiales were divided into four different types (Chen et al., 2018). Only type II, which included an rps19 pseudogene, was found in the chloroplast genome of Echinacanthus. As the duplicated complement of rps19 was included in the IR regions, the fifth type of the LSC/IR region was suggested in Lamiales.
Phylogenetic Analysis
The genus Echinacanthus was placed in the tribe Ruellieae of Acanthaceae (Nees Von Esenbeck, 1847; Bentham, 1876; Bremekamp, 1965; Scotland and Vollesen, 2000; Hu et al., 2011; Tripp et al., 2013). Previous molecular research identified seven subtribes within Ruellieae: Erantheminae, Ruellinae, Trichantherinae, Hygrophilinae, Mimulopsinae, Petalidiinae, and Strobilanthinae (Tripp et al., 2013). Echinacanthus was initially placed in the subtribe Ruellinae, but its status had long been controversial (Bentham, 1876; Lindau, 1895; Hu et al., 2011) and another treatment placed it within taxa with uncertain position (Tripp et al., 2013). The present phylogenetic analyses based on seven Acanthaceae taxa confirmed the monophyly of the family as previously reported (Chen et al., 2018). Furthermore, all of the six Ruellieae taxa formed a monophyletic group. However, our phylogenetic analyses did not resolve Echinacanthus monophyletic within Ruellieae. Instead, Echinacanthus was divided into two groups. Thus, the two groups were named the West Himalayan group and the Sino-Vietnamese group. In this study, the West Himalayan group, which was previously placed in Petalidiinae based on morphology (Tripp et al., 2013), was closely related to Strobilanthes of Strobilanthinae. In contrast, the Sino-Vietnamese species formed a highly supported distantly related group. Our previous molecular studies allied the Sino-Vietnamese Echinacanthus plants with Eranthemum, Pararuellia, and Leptosiphonium. They were placed within Erantheminae with a high support value (Gao, 2010). Also, the two geographical groups are clearly differentiated by the type of inflorescence, i.e., the West Himalayan species has thyrsus, while the Sino-Vietnamese plants have a cyme. Hence, the Sino-Vietnamese Echinacanthus should be recognized as a new genus. But, the positions of the two group of Echinacanthus in Ruellieae still remain somewhat uncertain and the future taxonomic analyses should incorporate additional chloroplast genomes of the Acanthaceae. But beyond that, the relationships within Echinacanthus species were fairly well resolved in this study, especially the Sino-Vietnamese Echinacanthus species. In fact, the three Sino-Vietnamese species were similar to one another in morphology. E. lofouensis and E. longzhouensis were shrubs, but, E. longipes was the perennial herbs. Furthermore, E. longzhouensis and E. longipes shared the same traits with purple corolla and two aristate appendages at the base of each thecous. The current phylogenetic tree showed the deep-level relationships of Sino-Vietnamese Echinacanthus species. It was revealed that E. longipes had a closer phylogenetic relationship to E. lofouensis than to E. longzhouensis. The current phylogenetic analysis raise the possibility that cp genomes may be useful for studying phylogeny and speciation of Echinacanthus in the future.
Molecular Markers and Hotspot Regions Identification
Simple sequence repeats are shortly repeated DNA sequence motifs consisting of repeat units of 1–6 bp in length. As genetic markers, they are widely dispersed in genomes. The advantages of SSRs include high polymorphism, high abundance, codominance, selective neutrality and the possibility of antomated detection and scoring. They had been extensively used in population genetics and molecular evolution studies (George et al., 2015; Govindaraj et al., 2015). In the present study, the results were the same as most other species, for example, the majority of SSRs were mononucleotide repeats, located in intergenic spacer regions, and contributed to AT richness (Morton et al., 1997; Xu et al., 2017). SSRs are effective molecular markers for interspecific polymorphisms. According to the criteria of SSRs, i.e., presence of the same repeat units, being located in the homologous regions, and having different number of the repeat units, 22 SSRs were identified as polymorphic SSRs between Echinacanthus species (Table 3). In addition, our alignment and nucleotide diversity revealed high level of similarity across the four species. Similar to most other species, the IR regions were more conserved than the LSC and SSC regions, whereas the coding regions were less divergent than the non-coding regions (Shivakumar et al., 2017; Zeng et al., 2017). The divergence level between the two geographic groups was consistent with the phylogenetic relationships of the genus. According to the analyses of sequence divergence conducted with mVISTA and nucleotide variability inferred by DnaSP, the top six most divergent regions between Echinacanthus species were rrn16, ycf1, ndhA, rps16-trnQ-UUG, trnS-GCU-trnG-UCC, and psaA-ycf3. Above all, SSRs and the hotspot regions can be used as candidate DNA barcodes in phylogenetic, plant identification and speciation studies in Echinacanthus.
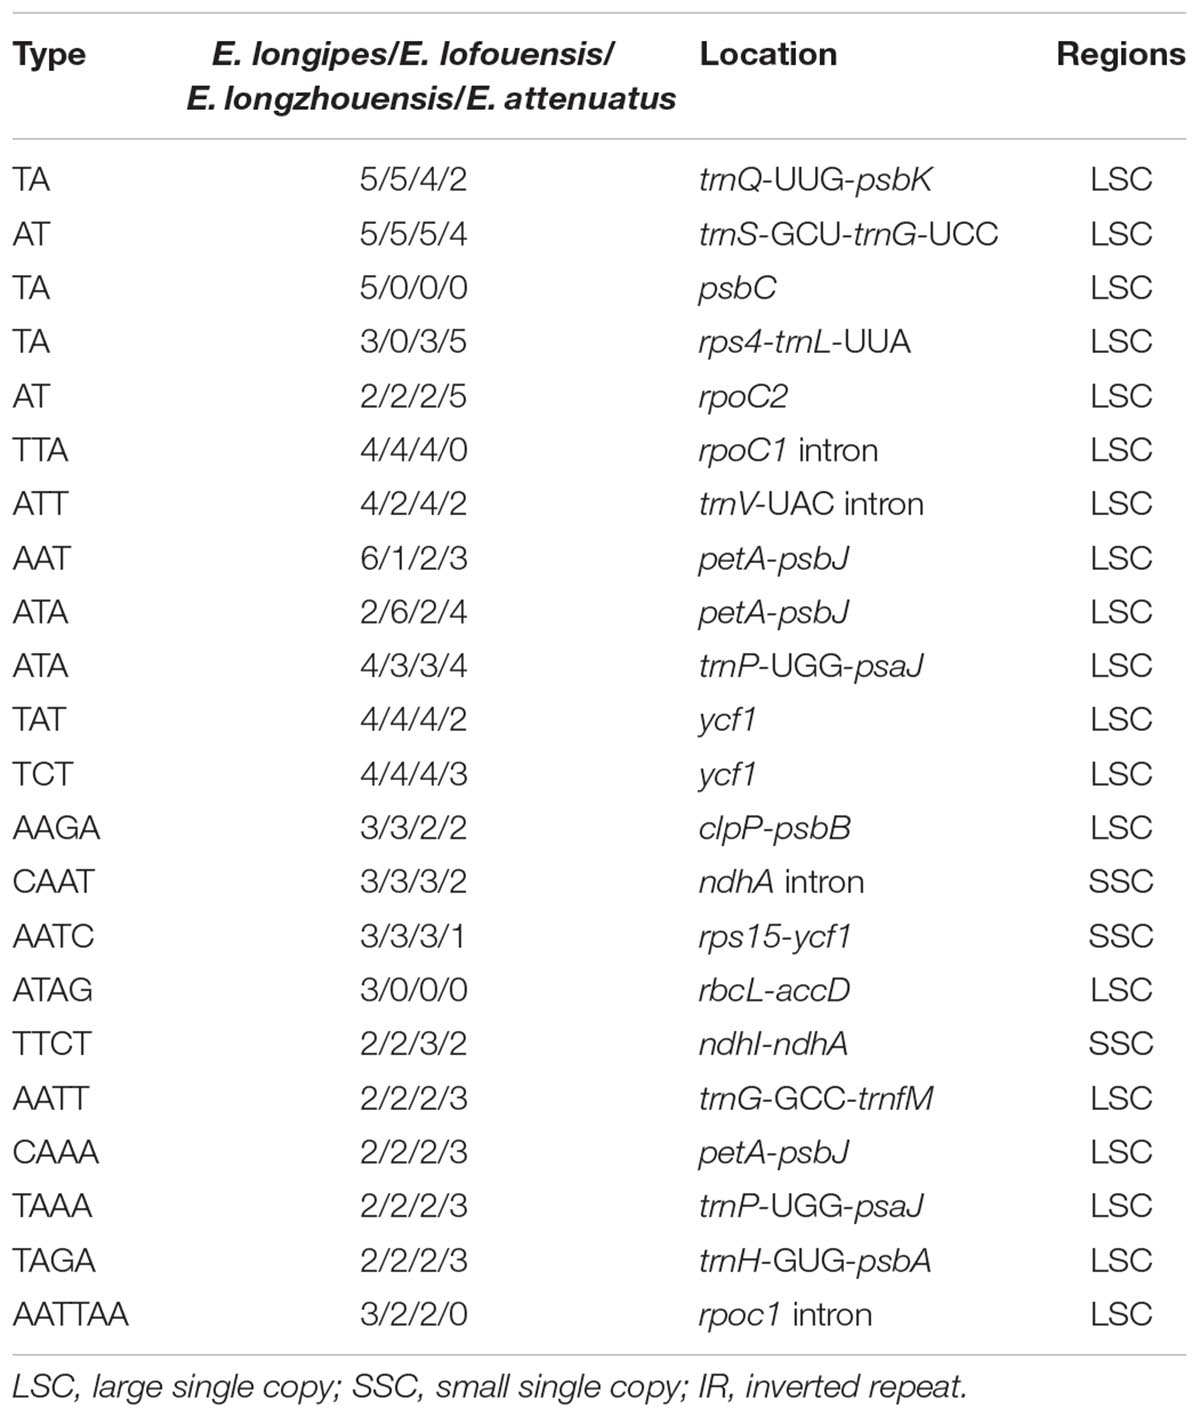
Table 3. The polymorphic simple sequence repeats in Echinacanthus.
Adaptive Evolution Analysis
Acanthaceae is a tropical and subtropical family with high species, geographic, and ecological diversity (Borg et al., 2008; Daniel et al., 2008; Hu et al., 2011; Deng et al., 2010; Tripp and Siti, 2012; Tripp et al., 2017). To resolve the evolutionary history of its species, it is necessary to analyze the genetic diversity and adaptive evolution in Acanthaceae. The non-synonymous/synonymous rate ratio (ω = dN/dS) is very useful for measuring selective pressure at the protein level. The genes with positive selection played key roles in the adaptation to diverse environment (Fan et al., 2018; Wu et al., 2018). Echinacanthus contains two geographical groups with E. longzhouensis, E. lofouensis and E. longipes distributed in karst landform. Karsts are specific landforms which developed on soluble rocks such as limestone, marble and gypsum since Cambrian to the Quaternary ages (Ford and Williams, 2007). In this study, we examined the selective pressure of 80 protein genes in different branches of Acanthaceae to test adaptive genes of karst landform. As a result, 12 genes with dN/dS > 1 in branch of Sino-Vietnamese species were detected. Interestingly, of these 12 genes, six genes (rpl14, rpl16, rps4, rps15, rps18, rps19) have functions in chloroplast ribosome (Tiller and Bock, 2014). In addition, psbK and psbN, which have important role in photosystem, were detected under positive pressure in karst environment. Two NAD(P)H dehydrogenase complex genes were found under positive selection. Moreover, rpoB and infA were crucial for genetic information transmission, which affect transcription of DNA into RNA and translation of RNA to protein. They were also under adaptive selection in karst plant. These genes under positive selection may play an important role in the adaptation of Echinacanthus species to Sino-Vietnamese karst environment.
Author Contributions
YD designed the experiments and contributed to the sampling. CG performed the experiments, analyzed the data, and wrote the manuscript. JW analyzed the data. All authors read and approved the final manuscript.
Funding
This work was supported by the National Natural Science Foundation of China (Grant Nos. 31400184, 31470302, and 31670191) and Southeast Asia Biodiversity Research Institute, Chinese Academy of Sciences (Y4ZK111B01).
Conflict of Interest Statement
The authors declare that the research was conducted in the absence of any commercial or financial relationships that could be construed as a potential conflict of interest.
Acknowledgments
We thank the Germplasm Bank of Wild Species, Kunming Institute of Botany, Chinese Academy of Sciences for providing technical support.
Supplementary Material
The Supplementary Material for this article can be found online at: https://www.frontiersin.org/articles/10.3389/fpls.2018.01989/full#supplementary-material
Footnotes
References
Anderson, T. (1867). An enumeration of the Indian species of Acanthaceae. J. Linn. Soc. Bot. 9, 425–454. doi: 10.1111/j.1095-8339.1867.tb01308.x
Bentham, G. (1876). “Acanthaceae,” in Genera Plantarum2, eds G. Bentham and J. D. Hooker (London: Reeve and Co Press), 1066–1122.
Borg, A. G., McDade, L. A., and Schönenberger, J. (2008). Molecular phylogenetics and morphological evolution of Thunbergioideae (Acanthaceae). Taxon 57, 1–12. doi: 10.3732/ajb.1100354
Bremekamp, C. E. B. (1965). Delimination and subdivision of the Acanthaceae. Bull. Bot. Sur. India 7, 21–30.
Chen, H. M., Shao, J. J., Zhang, H., Jiang, M., Huang, L. F., Zhang, Z., et al. (2018). Sequencing and analysis of Strobilanthes cusia (Nees) Kuntze chloroplast genome revealed the rare simultaneous contraction and expansion of the inverted repeat region in Angiosperm. Front. Plant Sci. 9:324. doi: 10.3389/fpls.2018.00324
Clarke, C. B. (1885). “Acanthaceae,” in Flora of British India, Vol. 4, ed. J. D. Hooker (London: L. Reeve), 387–558.
Daniel, T. F., McDade, L. A., Manktelow, M., and Kiel, C. A. (2008). The “Tetramerium lineage” (Acanthaceae: Acanthoideae: Justicieae): delimitation and intra-lineage relationships based on cp and nrITS sequence data. Syst. Bot. 33, 416–436. doi: 10.1600/036364408784571581
Daniell, H., Lin, C. S., Yu, M., and Chang, W. J. (2016). Chloroplast genomes: diversity, evolution, and applications in genetic engineering. Genome Biol. 17:134. doi: 10.1186/s13059-016-1004-2
Deng, Y. F., Hai, D. V., and Xuyen, D. T. (2010). Echinacanthus Nees (Acanthaceae), a newly recorded genus from Vietnam. J. Trop. Subtrop. Bot. 18, 40–42.
Ding, P., Shao, Y. H., Li, Q., Gao, J. L., Zhang, R. J., Lai, X. P., et al. (2016). The chloroplast genome sequence of the medicinal plant Andrographis paniculata. Mitochondr. DNA 27, 2347–2348. doi: 10.3109/19401736.2015.1025258
Dong, W. P., Liu, H., Xu, C., Zuo, Y. J., Chen, Z. J., and Zhou, S. L. (2014). A chloroplast genomic strategy for designing taxon spcific DNA mini-barcodes: a case study on ginsengs. BMC Genet. 15:138. doi: 10.1186/s12863-014-0138-z
Doyle, J. J., and Doyle, J. L. (1990). A rapid total DNA preparation procedure for fresh plant tissue. Focus 12, 13–15.
Fan, W. B., Wu, Y., Yang, J., Shahzad, K., and Li, Z. H. (2018). Comparative chloroplast genomics of Dipsacales species: insights into sequence variation, adaptive evolution, and phylogenetic relationships. Front. Plant Sci. 9:689. doi: 10.3389/fpls.2018.00689
Felsenstein, J. (1985). Confidence limits on phylogenies: an approach using the bootstrap. Evolution 39, 783–791. doi: 10.1111/j.1558-5646.1985.tb00420.x
Ford, D., and Williams, P. (2007). Karst Hydrogeology and Geomorphology. Chichester: John Wiley & Sons. doi: 10.1002/9781118684986
Frazer, K. A., Pachter, L., Poliakov, A., Rubin, E. M., and Dubchak, I. (2004). VISTA: computational tools for comparative genomics. Nucleic Acids Res. 32(Suppl. 2), W273–W279. doi: 10.1093/nar/gkh458
Gao, C. M. (2010). Phylogenetic Relationships Among Acanthaceae From China. Doctoral Dissertation, Chinese Academy of Sciences, Beijing.
George, B., Bhatt, B. S., Awasthi, M., George, B., and Singh, A. K. (2015). Comparative analysis of microsatellites in chloroplast genomes of lower and higher plants. Curr. Genet. 61, 665–677. doi: 10.1007/s00294-015-0495-9
Gichira, A. W., Li, Z. Z., Saina, J. K., Long, Z. C., Hu, G. W., Gituru, R. W., et al. (2017). The complete chloroplast genome sequence of an endemic monotypic genus Hagenia (Rosaceae): structural comparative analysis, gene content and microsatellite detection. PeerJ 5:e2846. doi: 10.7717/peerj.2846
Govindaraj, M., Vetriventhan, M., and Srinivasan, M. (2015). Importance of the genetic diversity assenssment in crop plants and its recent advances: an overview of its analytical perspectives. Genet. Res. Int. 2015:431487. doi: 10.1155/2015/431487
Graham, S. W., and Olmstead, R. G. (2000). Utility of 17 plastid genes for inferring the phylogeny of the basal angiosperms. Am. J. Bot. 87, 1712–1730. doi: 10.2307/2656749
Hildebrand, M., Hallick, R. B., Passavant, C. W., and Bourque, D. P. (1988). Trans-splicing in chloroplasts: the rps12 loci of Nicotiana tabacum. Proc. Natl. Acad. Sci. U.S.A. 85, 372–376. doi: 10.1073/pnas.85.2.372
Hillis, D. M., and Bull, J. J. (1993). An empirical test of bootstrapping as a method for assessing confidence in phylogenetic analysis. Syst. Biol. 42, 182–192. doi: 10.1093/sysbio/42.2.182
Hu, C. C., Deng, Y. F., and Wood, J. R. I. (2011). “Echinacanthus nees,” in Flora of China 19, eds Z. Y. Wu, P. H. Raven, and D. Y. Hong (St. Louis, MO: Sciences & Missouri Botanical Garden Press), 380–430.
Katoh, K., and Standley, D. M. (2013). MAFFT multiple sequence alignment software version 7: improvements in performance and usability. Mol. Biol. Evol. 30, 772–780. doi: 10.1093/molbev/mst010
Kearse, M., Moir, R., Wilson, A., Stones-Havas, S., Cheung, M., Sturrock, S., et al. (2012). Geneious basic: an integrated extendable desktop software platform for the organization and analysis of sequence data. Bioinformatics 28, 1647–1649. doi: 10.1093/bioinformatics/bts199
Lemieux, C., Otis, C., and Turmel, M. (2016). Comparative chloroplast genome analyses of streptophyte green algae uncover major structural alteration in the klebsormidiophyceae. Coleochaetophyceae and Zygnematophyceae. Front. Plant Sci. 7:697. doi: 10.3389/fpls.2016.00697
Li, P., Lu, R. S., Xu, W. Q., Ohi-Toma, T., Cai, M. Q., Qiu, Y. X., et al. (2017). Comparative genomics and phylogenomics of East Asian Tulips (Amana, Liliaeae). Front. Plant Sci. 8:451. doi: 10.3389/fpls.2017.00451
Li, Y. G., Xu, W. Q., Zou, W. T., Jiang, D. Y., and Liu, X. H. (2017). Complete chloroplast genome sequences of two endangered Phoebe (Lauraceae) species. Bot. Stud. 58, 37–46. doi: 10.1186/s40529-017-0192-8
Librado, P., and Rozas, J. (2009). DnaSP v5: a software for comprehensive analysis of DNA polymorphism data. Bioinformatics 25, 1451–1452. doi: 10.1093/bioinformatics/btp187
Lindau, G. (1895). “Acanthaceae,” in Die Naturlichen Pflanzenfamilien, eds A. Engler and K. Prantl (Leipzig: W. Engelmann), 274–354.
Liu, C., Shi, L. C., Zhu, Y. J., Chen, H. M., Zhang, J. H., Lin, X. H., et al. (2012). CpGAVAS, an integrated web server for the annotation, visualization, analysis, and GenBank submission of completely sequenced chloroplast genome sequences. BMC Genomics 13:715. doi: 10.1186/1471-2164-13-715
Liu, T. J., Zhang, C. Y., Yan, H. F., Zhang, L., Ge, X. J., and Hao, G. (2016). Complete plastid genome sequence of Primula sinensis (Primulaceae): struture comparison, sequence variation and evidence for accD tranfer to nucleus. PeerJ 4:e2101. doi: 10.7717/peerj.2101
Lo, H. S., and Fang, D. (1985). Echinacanthus-an acanthaceous genus new to the Chinese flora. Acta Bot. Yunnan. 7, 1–3.
Lohse, M., Drechsel, O., Kahlau, S., and Bock, R. (2013). Organellar genome DRAW-a suite of tools for generating physical maps of plastid and mitochondrial genomes and visualizing expression data sets. Nucleic Acids Res. 41, W575–W581. doi: 10.1093/nar/gkt289
Menezes, A. P. A., Resende-Moreira, L. C., Buzatti, R. S. O., Nazareno, A. G., Carlsen, M., Lobo, F. P., et al. (2018). Chloroplast genomes of Byrsonima species (Malpighiaceae): comparative analysis and screening of high divergence sequences. Sci. Rep. 8:2210. doi: 10.1038/s41598-20189-4
Morton, B. R., Oberholzer, V. M., and Clegg, M. T. (1997). The influence of specific neighboring bases on substitution bias in noncoding regions of the plant chloroplast genome. J. Mol. Evol. 45, 227–231. doi: 10.1007/PL00006224
Nazareno, A. G., Carlsen, M., and Lohmann, L. G. (2015). Complete chloroplast genome of Tanaecium tetragonolobum: the first Bignoniaceae plastome. PLoS One 10:e0129930. doi: 10.1371/journal.pone.0129930
Nees Von Esenbeck, C. G. (1832). “Acanthaceae,” in Plantae Asiaticae Rariores, Vol. 3, ed. N. Wallich (London: Treutteland Würtz), 70–117.
Nees Von Esenbeck, C. G. (1847). “Acanthaceae,” in Prodromus Systematis Naturalis Regni Vegetabilis, Vol. 2, ed. A. D. Candolle (Parisii: Sumptibus Sociorum Treuttel et Würtz), 46–519.
Ng, P. K., Lin, S. M., Lim, P. E., Liu, L. C., Chen, C. M., and Pai, T. W. (2017). Complete chloroplast genome of Gracilaria firma (Gracilariaceae, Rhodophyta) with discussion on the use of chloroplast phylogenomics in the subclass Rhodymeniophycidae. BMC Genomics 18:40. doi: 10.1186/s12864-016-3453-0
Nielsen, R., and Yang, Z. (1998). Likelihood models for detecting positively selected amino acid sites and applications to the HIV-1 envelope gene. Genetics 148, 929–936.
Olmstead, R. G., and Palmer, J. D. (1994). Chloroplst DNA systematic: a review of methods and data analysis. Am. J. Bot. 81, 1205–1224. doi: 10.1002/j.1537-2197.1994.tb15615.x
Posada, D., and Crandall, K. A. (1998). Modeltest: testing the model of DNA substitution. Bioinformatics 14, 817–818. doi: 10.1093/bioinformatics/14.9.817
Raman, G., Choi, S. K., and Park, S. J. (2016). Phlogenetic relationships of the fern Cyrtomium falcatum (Dryopteridaceae) Dokdo Island based on the chloroplast genome sequencing. Genes 7, 115–133. doi: 10.3390/genes7120115
Ris, H., and Plaut, W. (1961). Ultrastructure of DNA containing areas in the chloroplast of chlamydomonas. J. Cell Biol. 13, 383–391. doi: 10.1083/jcb.13.3.383
Ronquist, F., Teslenko, M., van der Mark, P., Ayres, D. L., and Darling, A. (2012). MrBayes 3.2: efficient Bayesian phylogenetic inference and model choice across a large model space. Syst. Biol. 61, 539–542. doi: 10.1093/sysbio/sys019
Scotland, R. W., and Vollesen, K. (2000). Classification of Acanthaceae. Kew Bull. 55, 513–589. doi: 10.2307/4118776
Shivakumar, V. S., Appelhans, M. S., Johnson, G., Carlsen, M., and Zimmer, E. (2017). Analysis of whole chloroplast genomes from the genera of the Clauseneae, the curry tribe (Rutaceae, Citrus family). Mol. Phylogenet. Evol. 117, 135–140. doi: 10.1016/j.ympev.2016.12.015
Song, Y., Chen, Y., Lv, J. Z., Xu, J., Zhu, S. F., Li, M. F., et al. (2017). Development of chloroplast genomic resources for Oryza species discrimination. Front. Plant Sci. 8:1854. doi: 10.3389/fpls.2017.01854
Swofford, D. L. (2003). PAUP. Phylogenetic Analysis Using Parsimony (∗and Other Methods). Version 4. Sunderland: Sinauer Associates Press.
Thiel, T., Michalek, W., Varshney, R. K., and Graner, A. (2003). Exploiting EST databases for the development and characterization of gene-derived SSR-markers in barley (Hordeum vulgare L.). Theor. Appl. Genet. 232, 206–214. doi: 10.1007/s00122-002-1031-0
Tiller, N., and Bock, R. (2014). The translational apparatus of plastids and its role in plant development. Mol. Plant 7, 1105–1120. doi: 10.1093/mp/ssu022
Tripp, E. A., Daniel, T. F., Fatimah, S., and McDade, L. A. (2013). Phylogenetic relationships within Ruellieae (Acanthaceae) and a revised classification. Int. J. Plant Sci. 174, 97–137. doi: 10.1086/668248
Tripp, E. A., and Siti, F. (2012). Comparative anatomy, morphology and molecular phylogenetics of the African genus Satanocrater (Acanthaceae). Am. J. Bot. 99, 967–982. doi: 10.3732/ajb.1100354
Tripp, E. A., Tsai, Y. E., Zhuang, Y. B., and Dexter, K. G. (2017). RADseq dataset with 90% missing data fully resolves recent radiation of Petalidium (Acanthaceae) in the ultra-arid deserts of Namibia. Ecol. Evol. 7, 7920–7936. doi: 10.1002/ece3.3274
Wicke, S., Schneeweiss, G. M., Depamphilis, C. W., Kai, F. M., and Quandt, D. (2011). The evolution of the plastid chromosome in land plants: gene content, gene order, gene function. Plant Mol. Biol. 76, 273–297. doi: 10.1007/s11103-011-9762-4
Wood, J. R. I. (1994). Notes relating to the Flora of Bhutan XXIX: acanthaceae, with special reference to Strobilanthes. Edinburgh J. Bot. 51, 175–274. doi: 10.1017/S0960428600000871
Wu, Y., Liu, F., Yang, D. G., Li, W., Zhou, X. J., Pei, X. Y., et al. (2018). Comparative chloroplast genomics of Gossypium species: insights into repeat sequence variations and phylogeny. Front. Plant Sci. 9:376. doi: 10.3389/fpls.2018.00376
Xu, C., Dong, W. P., Li, W. Q., Xie, X. M., Jin, X. H., Shi, J. P., et al. (2017). Comparative analysis pf six Lagerstromia complete chloroplast genomes. Front. Plant Sci. 8:15. doi: 10.3389/fpls.2017.00015
Yang, J. B., Li, D. Z., and Li, H. T. (2014). Highly effective sequencing whole chloroplast genome of angiosperms by nine novel universal primer pairs. Mol. Ecol. Resour. 14, 1024–1031. doi: 10.1111/1755-0998.12251
Yang, Z. H. (2007). PAML 4: phylogenetic analysis by maximum likelihood, molecular biology and evolution. Mol. Biol. Evol. 24, 1586–1591. doi: 10.1093/molbev/msm088
Yang, Z. H., and Nielsen, R. (2002). Codon-substitution models for detecting molecular adaptation at individual sites along specific lineages. Mol. Biol. Evol. 19, 908–917. doi: 10.1093/oxfordjournals.molbev.a004148
Zeng, S. Y., Zhou, T., Han, K., Yang, Y. C., Zhao, J. H., and Liu, Z. L. (2017). The complete chloroplast genome sequences of six Rehmannia species. Genes 8:103. doi: 10.3390/genes8030103
Keywords: Echinacanthus, chloroplast genome, sequence divergence, phylogeny, molecular marker, adaptive evolution
Citation: Gao C, Deng Y and Wang J (2019) The Complete Chloroplast Genomes of Echinacanthus Species (Acanthaceae): Phylogenetic Relationships, Adaptive Evolution, and Screening of Molecular Markers. Front. Plant Sci. 9:1989. doi: 10.3389/fpls.2018.01989
Received: 01 July 2018; Accepted: 20 December 2018;
Published: 10 January 2019.
Edited by:
Fulvio Cruciani, Sapienza University of Rome, ItalyReviewed by:
Marcelo R. S. Briones, Federal University of São Paulo, BrazilGaurav Sablok, Finnish Museum of Natural History, Finland
Piotr Androsiuk, University of Warmia and Mazury in Olsztyn, Poland
Copyright © 2019 Gao, Deng and Wang. This is an open-access article distributed under the terms of the Creative Commons Attribution License (CC BY). The use, distribution or reproduction in other forums is permitted, provided the original author(s) and the copyright owner(s) are credited and that the original publication in this journal is cited, in accordance with accepted academic practice. No use, distribution or reproduction is permitted which does not comply with these terms.
*Correspondence: Yunfei Deng, eWZkZW5nQHNjYmcuYWMuY24=