 Jacob S. Stai1†
 Akshay Yadav2†
 Carole Sinou3
 Anne Bruneau3
 Jeff J. Doyle4
 David Fernández-Baca5
 Steven B. Cannon6*
- 1Interdepartmental Genetics and Genomics Graduate Program, Iowa State University, Ames, IA, United States
- 2Bioinformatics and Computational Biology Graduate Program, Iowa State University, Ames, IA, United States
- 3Institut de Recherche en Biologie Végétale, Département de Sciences Biologiques, Université de Montréal, Montreal, QC, Canada
- 4School of Integrative Plant Science, Plant Breeding & Genetics and Plant Biology Sections, Cornell University, Ithaca, NY, United States
- 5Department of Computer Science, Iowa State University, Ames, IA, United States
- 6Corn Insects and Crop Genetics Research Unit, US Department of Agriculture–Agricultural Research Service, Ames, IA, United States
Based on evolutionary, phylogenomic, and synteny analyses of genome sequences for more than a dozen diverse legume species as well as analysis of chromosome counts across the legume family, we conclude that the genus Cercis provides a plausible model for an early evolutionary form of the legume genome. The small Cercis genus is in the earliest-diverging clade in the earliest-diverging legume subfamily (Cercidoideae). The Cercis genome is physically small, and has accumulated mutations at an unusually slow rate compared to other legumes. Chromosome counts across 477 legume genera, combined with phylogenetic reconstructions and histories of whole-genome duplications, suggest that the legume progenitor had 7 chromosomes – as does Cercis. We propose a model in which a legume progenitor, with 7 chromosomes, diversified into species that would become the Cercidoideae and the remaining legume subfamilies; then speciation in the Cercidoideae gave rise to the progenitor of the Cercis genus. There is evidence for a genome duplication in the remaining Cercidoideae, which is likely due to allotetraploidy involving hybridization between a Cercis progenitor and a second diploid species that existed at the time of the polyploidy event. Outside the Cercidoideae, a set of probably independent whole-genome duplications gave rise to the five other legume subfamilies, at least four of which have predominant counts of 12–14 chromosomes among their early-diverging taxa. An earlier study concluded that independent duplications occurred in the Caesalpinioideae, Detarioideae, and Papilionoideae. We conclude that Cercis may be unique among legumes in lacking evidence of polyploidy, a process that has shaped the genomes of all other legumes thus far investigated.
Introduction
The legume family, Leguminosae, with approximately 20,000 species, is the third most diverse plant family, after Orchidaceae and Asteraceae (Legume Phylogeny Working Group et al., 2017). The family underwent a rapid radiation shortly after its origin ∼59–64 million years ago (Mya) (Lavin et al., 2005; Bruneau et al., 2008), giving rise to six lineages that have recently been recognized as subfamilies by the international legume systematics community (Legume Phylogeny Working Group et al., 2017). Among those subfamilies, four of them (Papilionoideae, Caesalpinioideae, Detarioideae, Cercidoideae) contain the vast majority of genera and species, while Dialioideae contains 17 genera and 84 species, and Duparquetioideae contains a single genus and species. The four larger subfamilies have been shown (Cannon et al., 2015) to each have been affected by early whole-genome duplications (WGDs): at the base of the Papilionoideae and near the origins of the Cercidoideae, Detarioideae, and Caesalpinioideae – though the precise timing of the WGD(s) in the latter three lineages remains uncertain due to low sampling.
In particular, the WGD status and timing within the Cercidoideae has been uncertain: did a WGD predate the earliest divergences in the family, or did it occur later? Cannon et al. (2015) reported a WGD signal for Bauhinia tomentosa, based on comparisons of divergence times of duplicated genes and orthologs based on synonymous substitution distributions (Ks peaks for duplication and speciation) from transcriptome sequence – but no WGD peak was evident for Cercis canadensis. This result was inconclusive, however: lack of a WGD peak could have been due to sequence loss or non-recovery for that genus. The genus Cercis is sister to the remainder of the Cercidoideae genera (Lewis et al., 2005; Sinou et al., 2009; Wang et al., 2018); we therefore address the question of whether Cercis was affected by an early WGD or whether the WGD occurred later in the evolution of the subfamily.
The legumes fall within the Fabidae (rosid 1) clade (Angiosperm Phylogeny Group et al., 2016), and thus were affected by the gamma triplication event that occurred around the time of the origin of the core eudicots, approximately 120 Mya (Jiao et al., 2012). Species such as Phaseolus (bean; papilionoid) or Desmanthus (bundleflower; caesalpinioid) show evidence of old but independent duplications within the legume family (Cannon et al., 2015). Finding one or more early-diverging legume species without WGD would be of interest because such species could provide important clues to both the structure of the ancestral legume genome and the evolution of species and genomes across this large family.
In the present study, we investigate a new set of genome sequences from the Cercidoideae, Caesalpinioideae, and Papilionoideae, as well as extensive chromosome count data from across the legumes. We also describe results from targeted sequencing of selected genes within the Cercidoideae, to clarify the timing and nature of WGDs affecting the legumes. We present evidence supporting lack of a WGD in the genus Cercis, and hypothesize an allotetraploidy event affecting the remainder of the Cercidoideae subfamily.
Materials and Methods
Gene Family Construction, Ks Analysis, and Phylogeny Calculation
Gene families include proteomes (complete sets of translated coding sequences – one representative transcript per gene) from fifteen legume species, and five non-legume species – which were used for phylogenetic rooting and evolutionary context. Species and sources are indicated in Table 1. We used a custom gene family construction method in order to best capture some challenging features of the phylogeny. Gene family features to account for include early WGDs affecting species in the family – but we wished to avoid an older genome triplication, occurring early in angiosperm evolution. Therefore, we used a combination of homology filtering based on per-species synonymous site changes, comparison with outgroup species, Markov clustering, and progressive refinements of family hidden Markov models (HMMs). The gene families are available at https://legumeinfo.org/data/public/Gene_families/legume.genefa m.fam1.M65K/ and associated methods and scripts are available at https://github.com/LegumeFederation/legfed_gene_families although the resources at those locations are focused on papilionoid species rather than on the non-papilionoid species examined in this paper. The same gene families above were used in the analysis in this paper, but with several papilionoid species removed and five other species added (via HMM-search and HMM alignment of the other species to the gene-family HMMs), as shown in Table 1. Resources for these gene families are available in Supplementary Materials: Supplementary Data Sheet S1 (full alignments), Supplementary Data Sheet S2 (trimmed alignments), Supplementary Data Sheet S3 (maximum likelihood trees), and Supplementary Data Sheet S4 (maximum likelihood trees, with same-species terminal pairs reduced to a single representative).
Table 1. Genome and annotation sources and versions.
Gene families were generated as follows. All-by-all comparisons of protein sequences for all species were calculated using BLAST (Camacho et al., 2009). Matches were filtered to the top two matches per query, with at least 50% query coverage and 60% identity. For the resulting gene pairs, in-frame nucleotide alignments of coding sequences were calculated, which were used, in turn, to calculate synonymous (Ks) counts per gene pair, using the PAML package (Yang, 2007), with the Nei and Gojobori (1986) method for estimating the numbers of synonymous nucleotide substitutions. The calculation process was driven using the synonymous_calc.py wrapper script (Tang and Chapman, 2018), which additionally uses the packages biopython (Cock et al., 2009), ClustalW2 (Larkin et al., 2007), and PAL2NAL (Suyama et al., 2006). For each species pair, histograms of Ks frequencies were used as the basis for choosing per-species Ks cutoffs for that species pair in the legumes. For most species pairs, the selected peak corresponded with the papilionoid duplication (Ks average of 0.6, varying between 0.45 and 0.8; Supplementary Table S1). For comparisons between papilionoid species and the four non-papilionoid legume species (Mimosa pudica, Chamaecrista fasciculata, B. tomentosa, and C. canadensis), the selected peak corresponded to the speciation divergence between the pair of species. To accommodate variation in Ks values, the cutoff for each species pair was generally set at 1.5 times the modal Ks value (Ks peak). The set of gene pairs was filtered to remove all pairs with Ks values greater than the per-species-pair Ks cutoff. The resulting set of filtered pairs was used for Markov clustering, implemented in the mcl program (Enright et al., 2002), with inflation parameter 1.2, and relative score values (transformed from Ks values) indicated with the -abc flag. Sequence alignments were then generated for all gene families using MUSCLE (Edgar, 2004). Hidden Markov models (HMMs) were calculated from the alignments using the hmmer package (Mistry et al., 2013), and sequences in each family were realigned to the family that those sequences were assigned to, in order to determine HMM bitscores and calculate a median alignment score for each family. Families were then evaluated for outliers: sequences scoring less than 40% of the median HMM bitscore for the family were removed. The HMMs were then recalculated for each family (without the low-scoring outliers), and were used as targets for HMM search of all sequences in the proteome sets – including those omitted during the initial Ks filtering. Again, sequences scoring less than 40% of the median HMM bitscore for the family were removed. These HMM alignments were then used for calculating phylogenetic trees, after trimming non-aligning characters (characters outside the HMM match states). Phylogenies were calculated using RAxML (Stamatakis et al., 2008), with model PROTGAMMAAUTO, and rooted using the closest available outgroup species.
Calculation of Ks Values and Modal Ks Peaks
Synonymous-site differences (Ks) were calculated by two methods: first, based on gene-pairs derived from the top two matches of genes between or within species, based on blastp sequence searches; and second, based on gene-pairs derived from genomic synteny comparisons and coding-sequence coordinates, provided to the CoGe SynMap service at https://genomevolution.org/coge/ (Haug-Baltzell et al., 2017). In the former case (calculated on top blastp matches), Ks values were calculated using PAML, driven by synonymous_calc.py, by Haibao Tang, available at https://github.com/tanghaibao/bio-pipeline. From the PAML output, the Nei-Gojobori Ks value was used (Nei and Gojobori, 1986). For both approaches (BLAST-based and synteny gene-pair-based), Ks histograms were calculated after filtering for Ks values between 0 and 2. The Ks values and plots are available in Supplementary Table S1.
Inference of Consensus Branch Lengths From Ks Peaks
To infer branch lengths for an idealized gene tree from these Ks peak values (Figure 1D), modal Ks peak values were read from Ks histograms, with values representing WGD events for a species compared with itself (e.g., in Phaseolus with respect to the papilionoid WGD) or orthologous gene separations between species (e.g., between Phaseolus and Cercis). The modal Ks values were then used to algebraically calculate branch lengths along a gene tree with known species topology and hypothesized duplication history, for the selected species. In these calculations, each branch segment is a variable to be solved, given the observed distances between each terminal (e.g., 0.55 for the phylogenetic path between Phaseolus and Cercis). Because the internal branch lengths are not uniquely determinable from the observed Ks path-lengths, several branch lengths were set at 0.01 (based on very short branch lengths observed in both gene trees and species trees): branches subtending the Chamaecrista WGD, the papilionoid/caesalpinioid clade, and the Cercis–Bauhinia 2 clade. Then, a PHYLIP-format (Felsenstein, 1980) gene tree was manually generated for the represented species, using branch length values from the algebraic calculations.
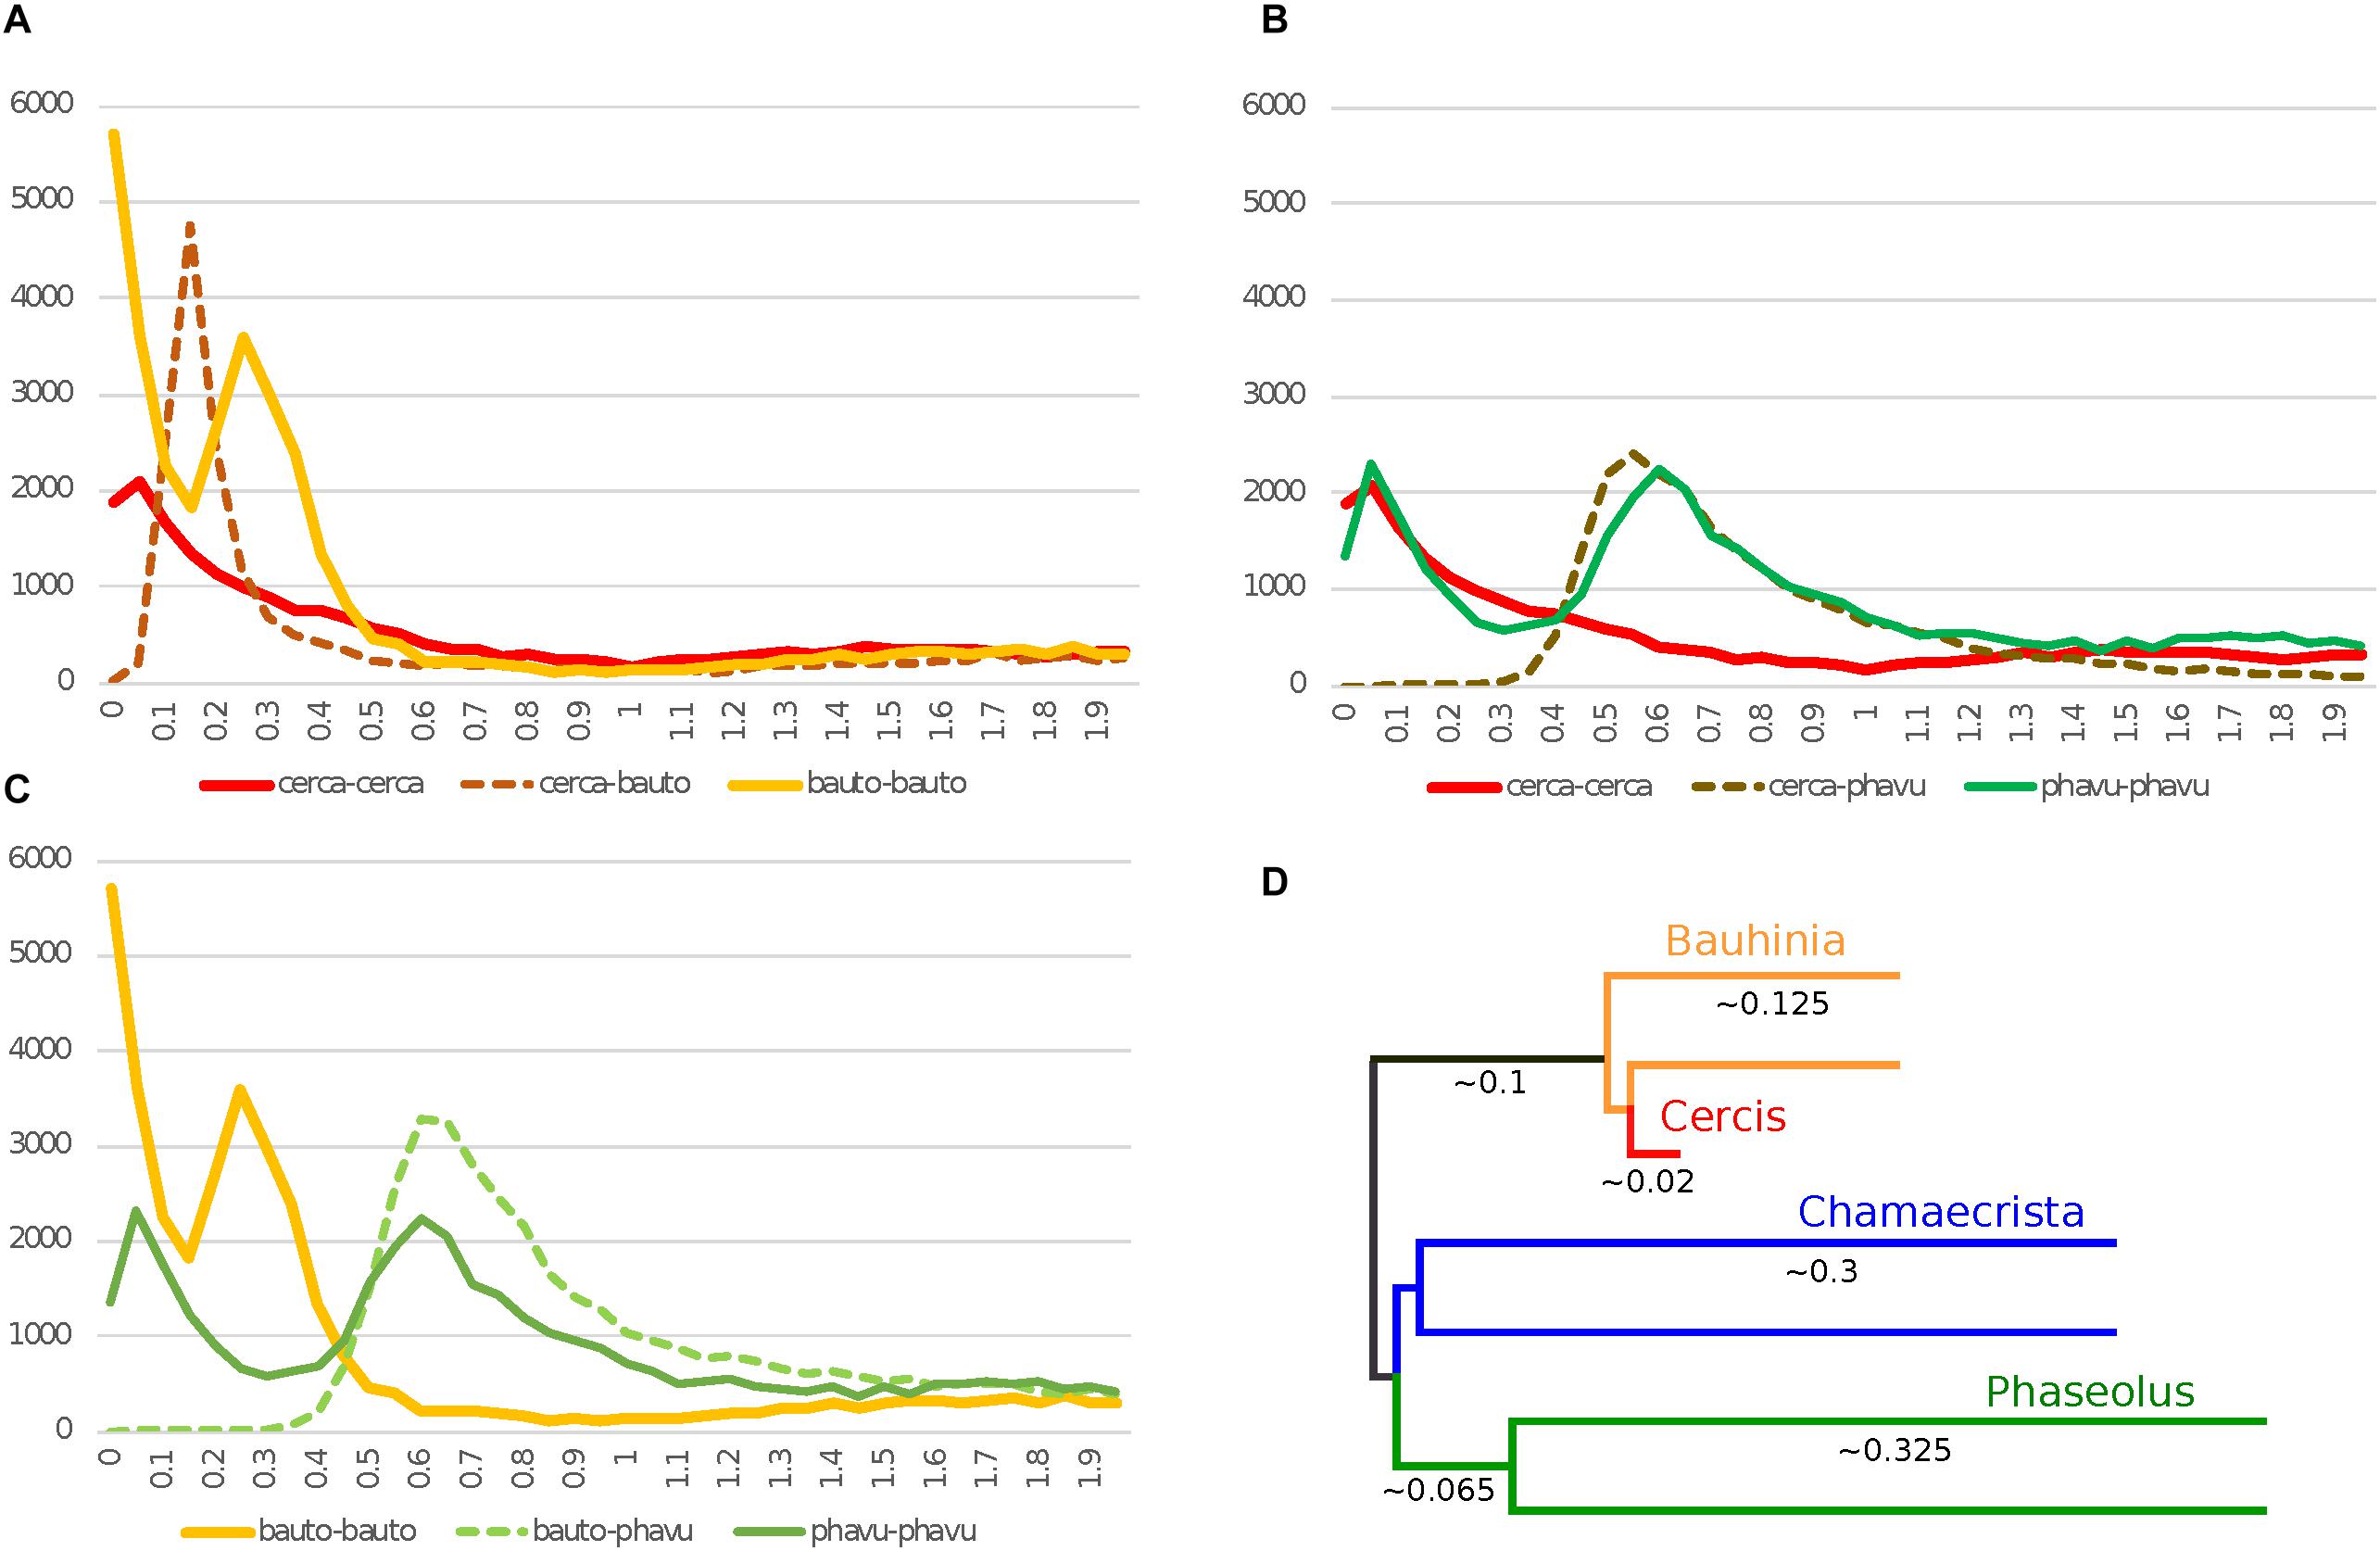
Figure 1. Histograms of Ks values for top gene-pair comparisons for Cercis canadensis (“cerca”), Bauhinia tomentosa (“bauto”), and Phaseolus vulgaris (“phavu”). In Ks plots (A–C), solid lines are for self-comparisons (e.g., for Cercis gene-pairs), and dotted lines are for between-species comparisons (e.g., between Cercis and Bauhinia). The schematic tree in panel D is an idealized distance tree in which each OTU represents an “average” gene: either a single copy in Cercis, or each of two homoeologs created by unique WGD events in the remaining taxa. Branch lengths are calculated from pairwise modal Ks values in panels A–C.
Methods for Mining for Tree Topologies
To test the order of phylogenetic events, gene trees were evaluated for 14,709 legume gene family trees that contain Cercis and/or Bauhinia sequences. Python scripts1 that use the functions from the ETE Toolkit (Huerta-Cepas et al., 2010, 2016) were used to read and analyze the legume gene family trees using the species overlap method (Huerta-Cepas et al., 2007). The species overlap method labels an internal node in a given rooted tree as D (duplication event) or S (speciation event) based on whether there are common species between both partitions corresponding to the two subsequent children nodes. Species-overlap tests were run for trees in which same-species terminal pairs were collapsed (when both branch lengths were less than 0.01), to control for local private gene duplications (Supplementary Data Sheet S4).
Results
Ks Peaks From Self-Comparisons of Coding Sequence
Within- and between-species comparisons of rates of synonymous-site changes per synonymous site were evaluated by Cannon et al. (2015) for 20 diverse legume species – including representatives from each of the four largest legume subfamilies. These showed Ks peaks of around 0.3–0.6 in all species except Cercis, where only a much older peak of ∼1.5 was seen. Because that work was based on transcriptome sequence for most species, there was some question whether the absence of the peak in Cercis might be due to poor sequence quality or sequence non-recovery (although the transcriptome assembly statistics were generally in the same range as for the other species). Recent availability of genome sequences for C. canadensis, C. fasciculata, M. pudica, and Nissolia schottii, from Griesmann et al. (2018), provides an opportunity to test Ks and other results with greater rigor. Chamaecrista and Mimosa fall within the Caesalpinioideae subfamily, and Nissolia is in the Papilionoideae subfamily, within the dalbergioid clade, along with peanut (Arachis). For Ks analysis in this study, we focus particularly on Cercis, Bauhinia (as representatives of the Cercidoideae), Chamaecrista (as a representative from the Caesalpinioideae), and Phaseolus (as a representative of the Papilionoideae), to investigate evidence for the presence and timing of possible WGDs in these lineages. We include Phaseolus to provide an example of a species with high-quality genome sequence and a well-studied, early WGD.
Ks results from genes predicted in the C. canadensis (“cerca”) and C. fasciculata (“chafa”) genome assemblies are shown in Figure 1, along with genes from Phaseolus vulgaris (“phavu”) and from B. tomentosa (“bauto”; transcriptome-derived). The Ks values were determined both for top BLAST-based gene-pairs between species and within species (e.g., top pairs within Cercis). Underlying data for the histograms is available in Supplementary Table S1.
There is a clear Ks peak for Cercis–Bauhinia at 0.15 and a peak for Bauhinia compared with itself at 0.25 (Figures 1A,C). Although there are some duplications near 0 in Cercis compared with itself, there is no older Cercis–Cercis peak as the prominent peak seen in Bauhinia–Bauhinia at 0.25. The duplications near 0 in the Cercis–Cercis plot are likely due to local gene duplications (as also seen, for example, in the Phaseolus–Phaseolus self-comparison in Figures 1A vs 1B), as this signature of recent duplications is absent in the synteny-derived Ks plots in Figure 2.
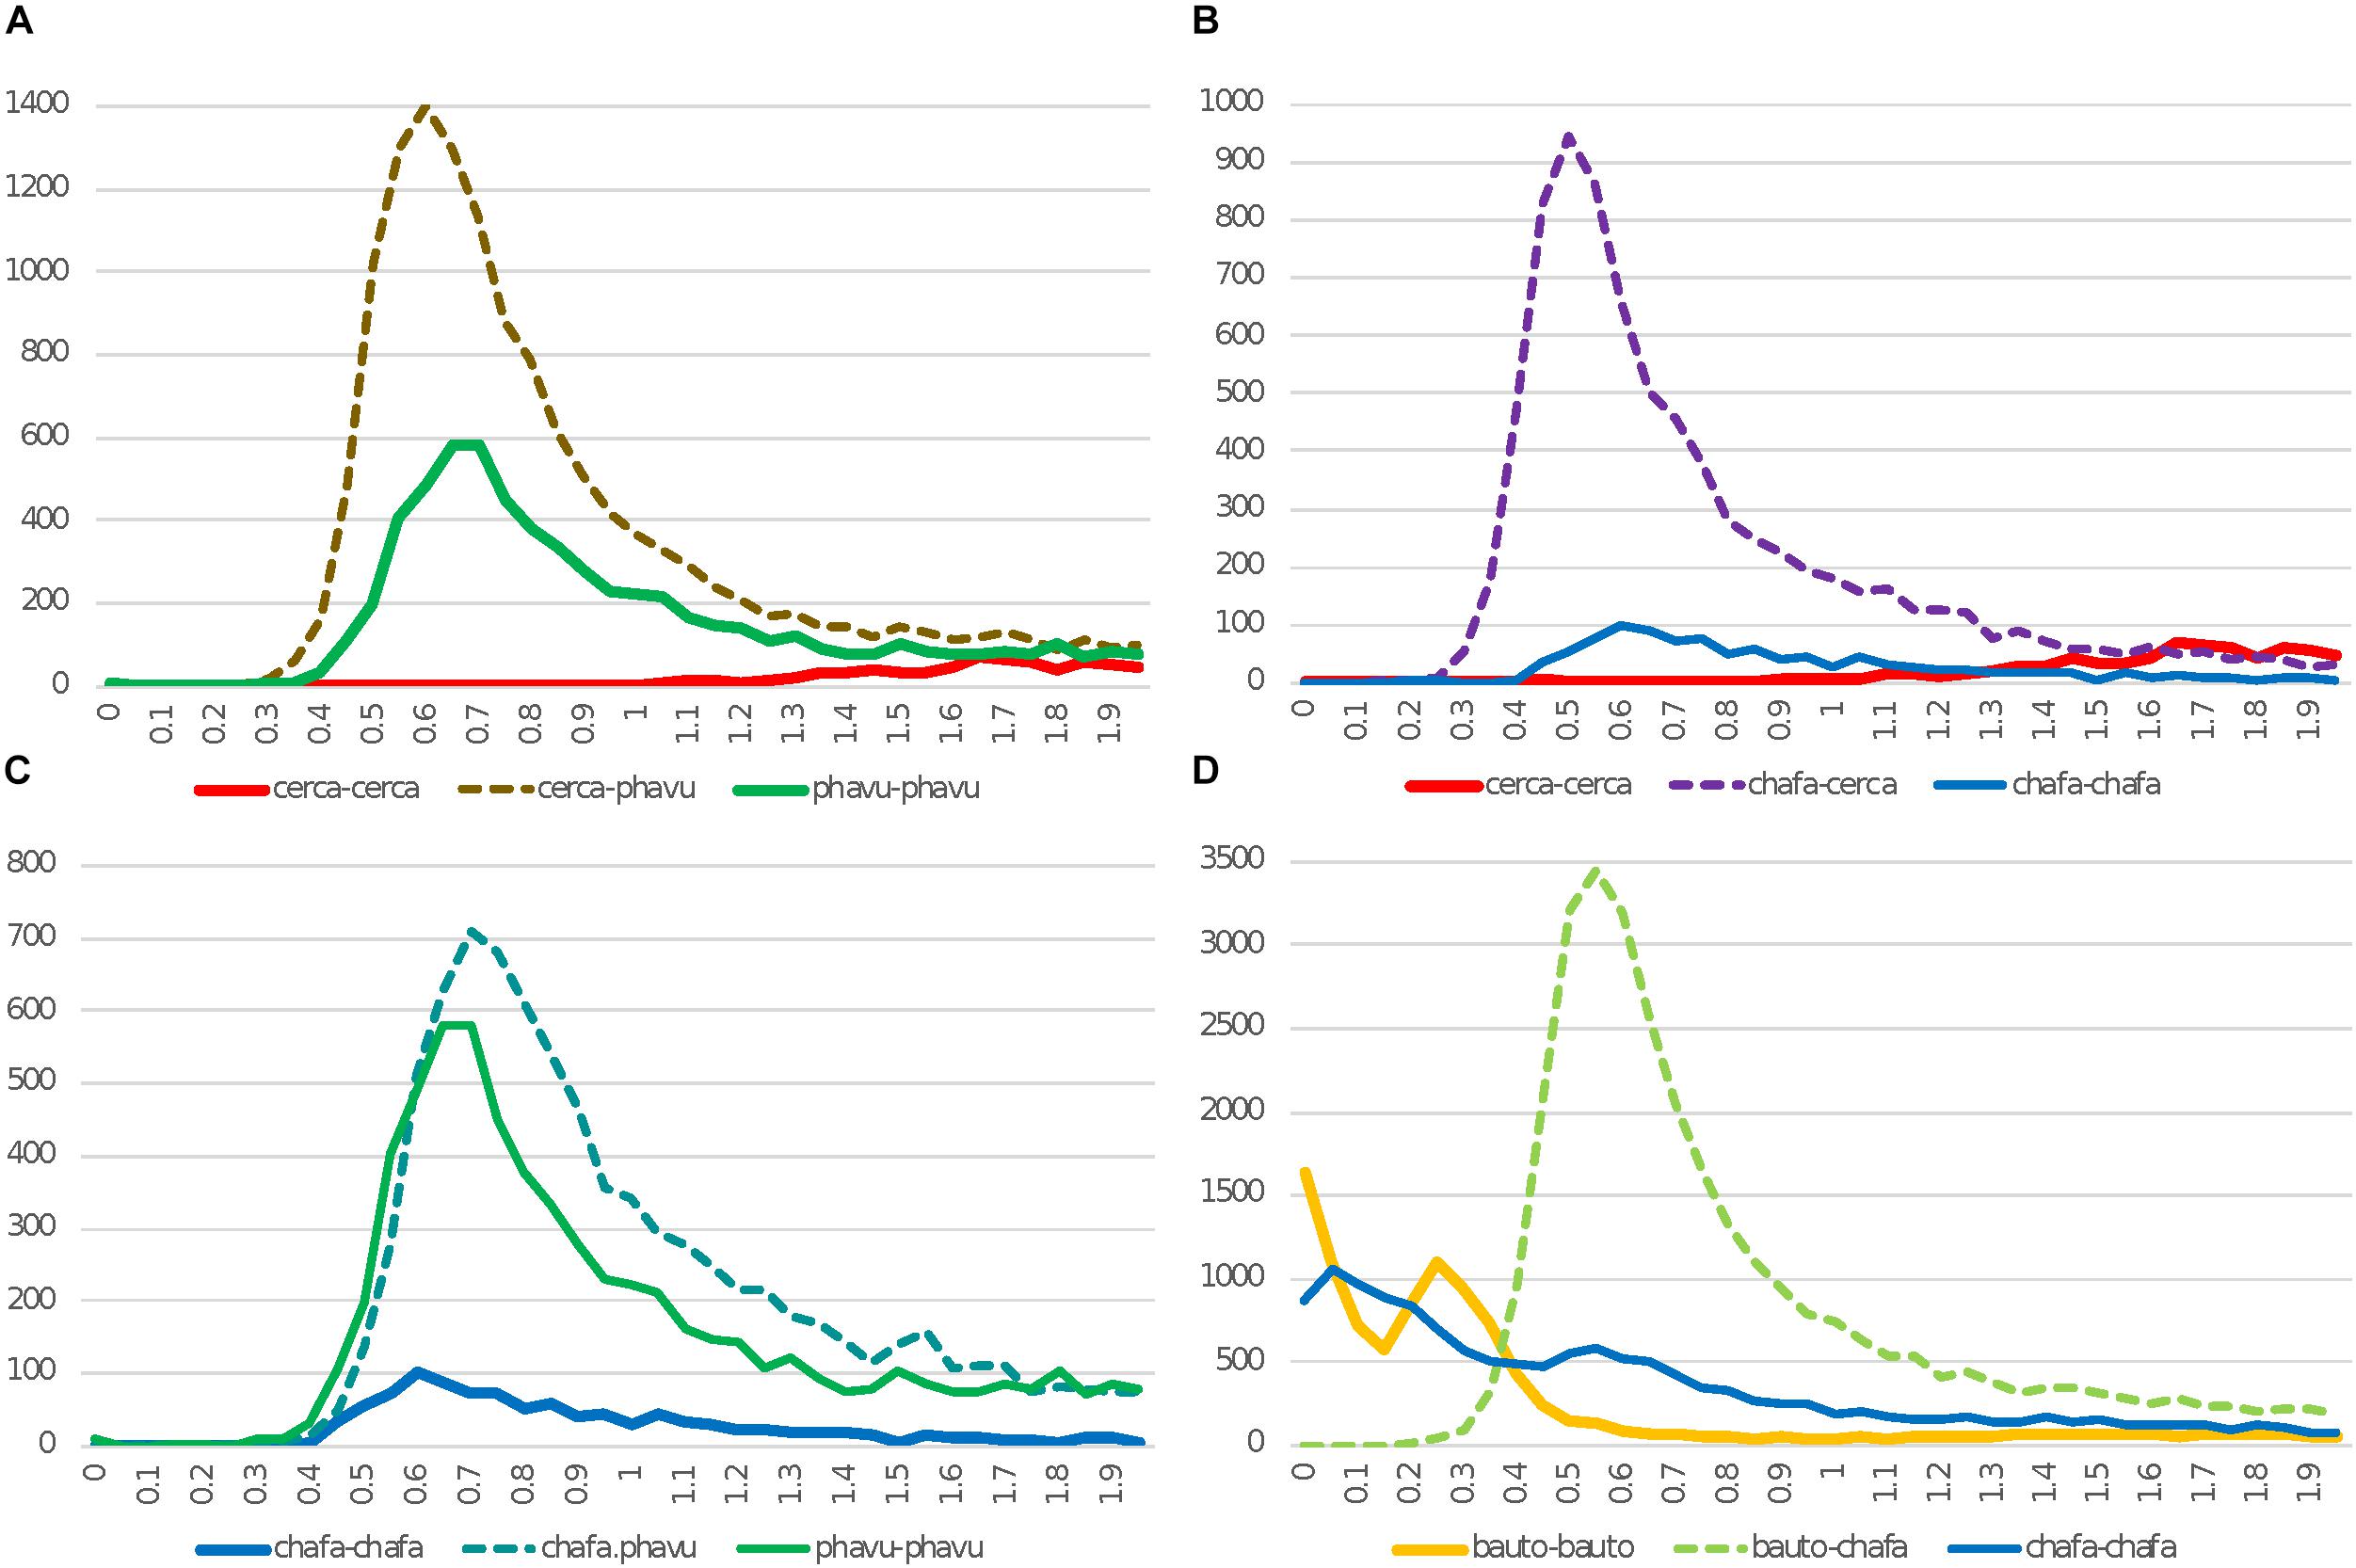
Figure 2. Histograms of Ks values for synteny-based comparisons for C. canadensis (“cerca”), Chamaecrista fasciculata (“chafa”), P. vulgaris (“phavu”), and B. tomentosa (“bauto”). In Ks plots, solid lines are for self-comparisons (e.g., for Cercis gene-pairs), and dotted lines are for between-species comparisons (e.g., between Cercis and Phaseolus). This Figure differs from Figure 1 both in species selection and in method for selecting gene pairs: in Figure 1, Ks values are calculated for all top gene pairs, and in panels A–C, Ks values are calculated for gene-pairs from synteny features identified from genomic comparisons (panel D is an exception: the Ks values are calculated from all top gene pairs, because only transcriptomic sequence is available for Bauhinia). The effect of using synteny-based gene pairs for calculating Ks is apparent in the Chamaecrista self-comparison plots (chafa–chafa; blue) in panel B or C (syntenic-based) vs. panel D (gene-pair based): in the gene-pair based figures in D, the WGD peak is still evident at ∼0.55–0.6, but the signal from more recent gene pairs are also apparent – presumably, as a result of independent, local gene duplications within Chamaecrista.
We find the expected strong WGD peak within Phaseolus and also for Phaseolus–Cercis (at 0.6 and 0.55), respectively, but again, no older peak within Cercis compared with itself (Figure 1B). The fact that the Phaseolus–Phaseolus modal Ks peak is greater than the Phaseolus–Cercis peak suggests a much greater rate of mutation accumulation in Phaseolus and its progenitors in Papilionoideae than in Cercis and its progenitors in Cercidoideae (Cui et al., 2006; Schmutz et al., 2014).
In Figure 1C, there is a speciation peak for Phaseolus–Bauhinia that is similar to Phaseolus–Cercis with the exception that the Phaseolus–Bauhinia peak appears slightly “older” than for Phaseolus–Cercis (0.6 vs. 0.55), suggesting more rapid rate of mutation accumulation in Bauhinia than in Cercis.
Figure 1D shows an inferred consensus gene tree, with branch lengths calculated (with approximation) from Ks plots in Figures 1, 2 (as described in Methods).
In Figures 2A–C, Ks values are derived from gene-pairs within synteny blocks derived from genome comparisons. A major effect of this strategy is to exclude local gene duplications – and to reduce other paralogous matches that can show up as recent duplications – for example, in matches among many members of a recently expanded gene family. This reduction in recent- and locally derived paralogs is evident in Ks counts near zero for “young” (small) Ks values. The sloping Ks histogram seen in Figure 1 for Cercis–Cercis is entirely absent in Figure 2. The modal Ks “peak” for Cercis, if there is any, is in the range of 1.5–2 – contrasting with the Cercis–Phaseolus, Cercis–Chamaecrista, and Chamaecrista–Phaseolus peaks of 0.6, 0.5, and 0.7, respectively – indicating that any Cercis WGD peak in this data would well predate the legume origin.
Also noteworthy in Figure 2 is the low modal Ks peak for Chamaecrista–Chamaecrista (amplitude of 101, compared with 581 for Phaseolus–Phaseolus). This difference in numbers of paralogous duplicated genes could be due to higher rates of gene loss from Chamaecrista following WGD early in the Caesalpinioideae. The strong Ks peaks in the orthologous Chamaecrista – Cercis comparison and the Phaseolus – Cercis comparison suggest that there is nothing systematically wrong with the Chamaecrista gene models. Rather, it appears that Chamaecrista is more fully “diploidized,” with a higher proportion of duplicated genes having reduced to single copies, providing a sufficient basis for discovering correspondences with other species, but erasing much of the WGD signature in a Chamaecrista self-comparison. Similar diploidization and interspersed gene losses have been reported in Medicago truncatula (Young et al., 2011).
Genomic Synteny Analysis
Given the draft genomic sequence assembly for Cercis, it is possible to make synteny comparisons with other legume genome assemblies, as well as assemblies of near outgroups to the legumes. In a synteny comparison of two genomes, a WGD present in one of the genomes and absent in the other should be apparent in a genomic dotplot through the following pattern: starting from a given genomic region in the non-duplicated genome and tracing through the dotplot, one should find matches to two regions in the genome with the WGD; and starting from a given genomic region in the duplicated genome and tracing through the dotplot in the other axis, one should find matches to a single region in the genome that lacks the WGD. This can be described in terms of “synteny depth:” the depth of the duplicated genome should be twice that of the non-duplicate genome.
Because the Cercis assembly is still highly fragmented (N50 of 421 kb), synteny depth is difficult to assess visually, but it can be measured computationally. The quota-alignment package (Tang et al., 2011) identifies synteny blocks between two genomes, attempting to match a specified pair of synteny depths or “quotas.” For example, if genome B has a WGD that A lacks, then the quota for B relative to A would be 2:1. If the quota is mis-specified as 1:1, then a poor coverage score will result for the duplicated genome, because many potential blocks in genome B will be missed. We also note that in the quota-alignment package, in a genome self-comparison, the trivial self-match is suppressed, so the expected quota for a genome with a single WGD, compared with itself, would be 1:1 rather than 2:2.
We used the quota-alignment package to test a range of quotas for all comparisons among Cercis, Phaseolus, and Prunus. We also provide the corresponding plots and textual results in Supplementary Data Sheets S8, S9. There is no evidence for a duplication in Prunus since the angiosperm whole-genome triplication (WGT) (Jiao et al., 2012; The International Peach Genome Initiative et al., 2013), and there is a known WGD in Phaseolus at around 50 Mya (Schmutz et al., 2014; Cannon et al., 2015), so these should serve as useful comparisons relative to Cercis. For Prunus–Phaseolus, a quota of 1:1 gives Phaseolus coverage of only 63.8% (Table 2) vs. 96% for Prunus, indicating that less than two-thirds of the Phaseolus genome has synteny coverage for the identified gene pairs. A quota of 1:2 for Prunus–Phaseolus is much better, at 97.4 and 96.8% coverage, respectively. For Prunus–Cercis, a quota of 1:1 gives acceptable coverage of 93.4 and 95.2%, respectively; a quota of 1:2 improves the coverage by only about 2% (Table 2). For Phaseolus–Cercis, the best quota is 2:1, with coverages of 93.3 and 94.7%, respectively. For the self-comparisons for each species, there is notable improvement going from 1:1 to 2:2 (Table 2). This is likely due to the ancient angiosperm triploidization (Jiao et al., 2012), which generated three genome copies; the expected number of synteny blocks from any region would then be two (ignoring the trivial self-match).
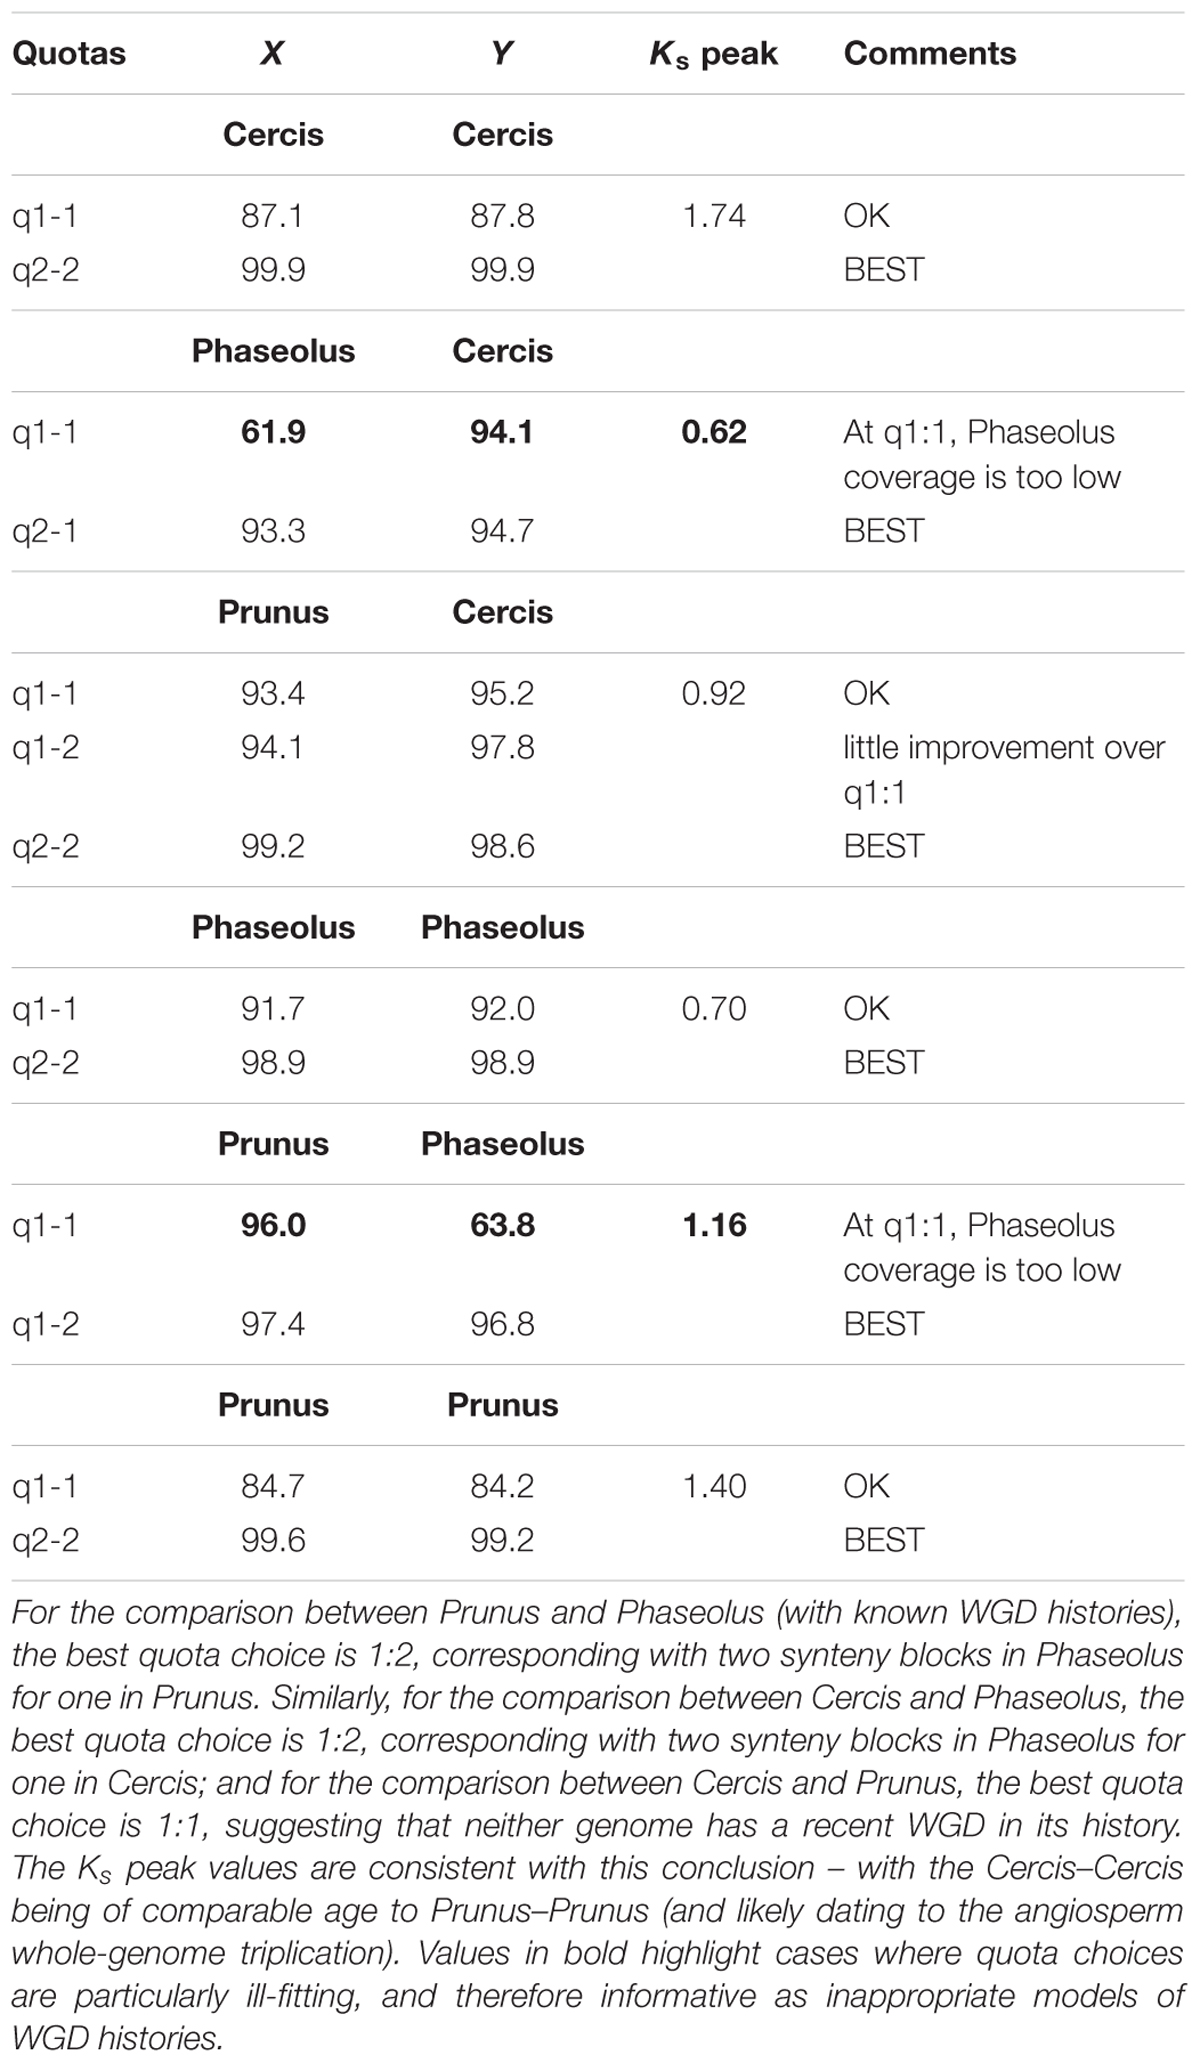
Table 2. Synteny coverage for comparisons between the genomes of Cercis canadensis, Phaseolus vulgaris, and Prunus persica, at selected synteny “quotas” (expected coverage depths).
The Ks peak values derived from gene pairs in the synteny analysis (Table 2) are consistent with the synteny depth results – with the Cercis–Cercis peak being of comparable age to Prunus–Prunus (1.74 and 1.4, respectively), and likely both dating to the angiosperm WGT. In contrast, the peak for Phaseolus–Phaseolus is 0.7, consistent with the papilionoid WGD.
Taken together, the synteny and Ks results from Table 2 indicate that Cercis has the same overall WGD depth as Prunus and half that of Phaseolus, in comparisons among these genomes. In other words, the synteny and Ks evidence supports lack of a WGD in Cercis.
Phylogenomic Analyses
To determine duplication events in a phylogenetic context, we constructed gene trees for all legume genes, for fifteen diverse legume species: Glycine max, P. vulgaris, Vigna unguiculata, Lupinus angularis, Arachis ipaensis, N. schottii, Cicer arietinum, M. truncatula, Lotus japonicus, C. fasciculata, M. pudica, B. tomentosa, and C. canadensis. The first nine of these are from the Papilionoideae (representing the millettioid, genistoid, dalbergioid, and IRLC clades). We also included five non-legume outgroups – using one sequence from each, for each family, in order to provide a rooting for the legume sequences: Arabidopsis thaliana, Prunus persica, Cucumis sativus, Solanum lycopersicum, and Vitis vinifera. For convenience, analyses and figures that use sequences from these species use the following abbreviation form to indicate genus and species: the first three letters of the genus and the first two letters of the species epithet, e.g., “glyma” for G. max. Gene families were calculated to span the depth of the legume most-recent common ancestor – i.e., avoiding fragmented gene families that split sequences that have a common proto-legume ancestor, and avoiding over-clustered families that include legume sequences that diverged prior to the legume origin. Our method produced 18,543 such families, but for the present analysis, we analyzed the 14,709 families that contain one or more sequences from Cercis and/or Bauhinia. The set of 14,709 were used for subsequent phylogenomic analyses (Supplementary Data Sheets S1–S4).
Informal Observations About Patterns in Trees
Gene family trees containing Cercis and Bauhinia sequences were used to investigate the occurrence of WGD in the most recent common ancestor (MRCA) of the Cercis and Bauhinia lineages. Although the phylogenomic analysis was likely complicated by uncertainties in phylogenetic reconstructions and by sequence losses or non-recovery, there are clear patterns in the results. We repeatedly see topologies congruent with those in two gene families shown in Figure 3 (families 31DXWY and 2SH9KY; names from this set of legume gene families were assigned random “license plate” names of six alphanumeric characters). These gene families each show two Bauhinia sequences and one Cercis sequence in one clade. Both gene families show duplicated sequences for Mimosa and Chamaecrista (Caesalpinioideae; although in 3A, these do not resolve to a single clade, which may indicate that the duplication occurred very early in the Caesalpinioideae) in the Papilionoideae, there are paired sequences from most species, highlighting the pre-papilionoid WGD (Cannon et al., 2015). In the Cercidoideae clade, there is a curious feature: the duplication that affects Bauhinia predates the Bauhinia–Cercis speciation, and produces the expected two homoeologs in Bauhinia, but there is only a single Cercis sequence. The full collection of gene trees is available in Supplementary Data Sheet S3.
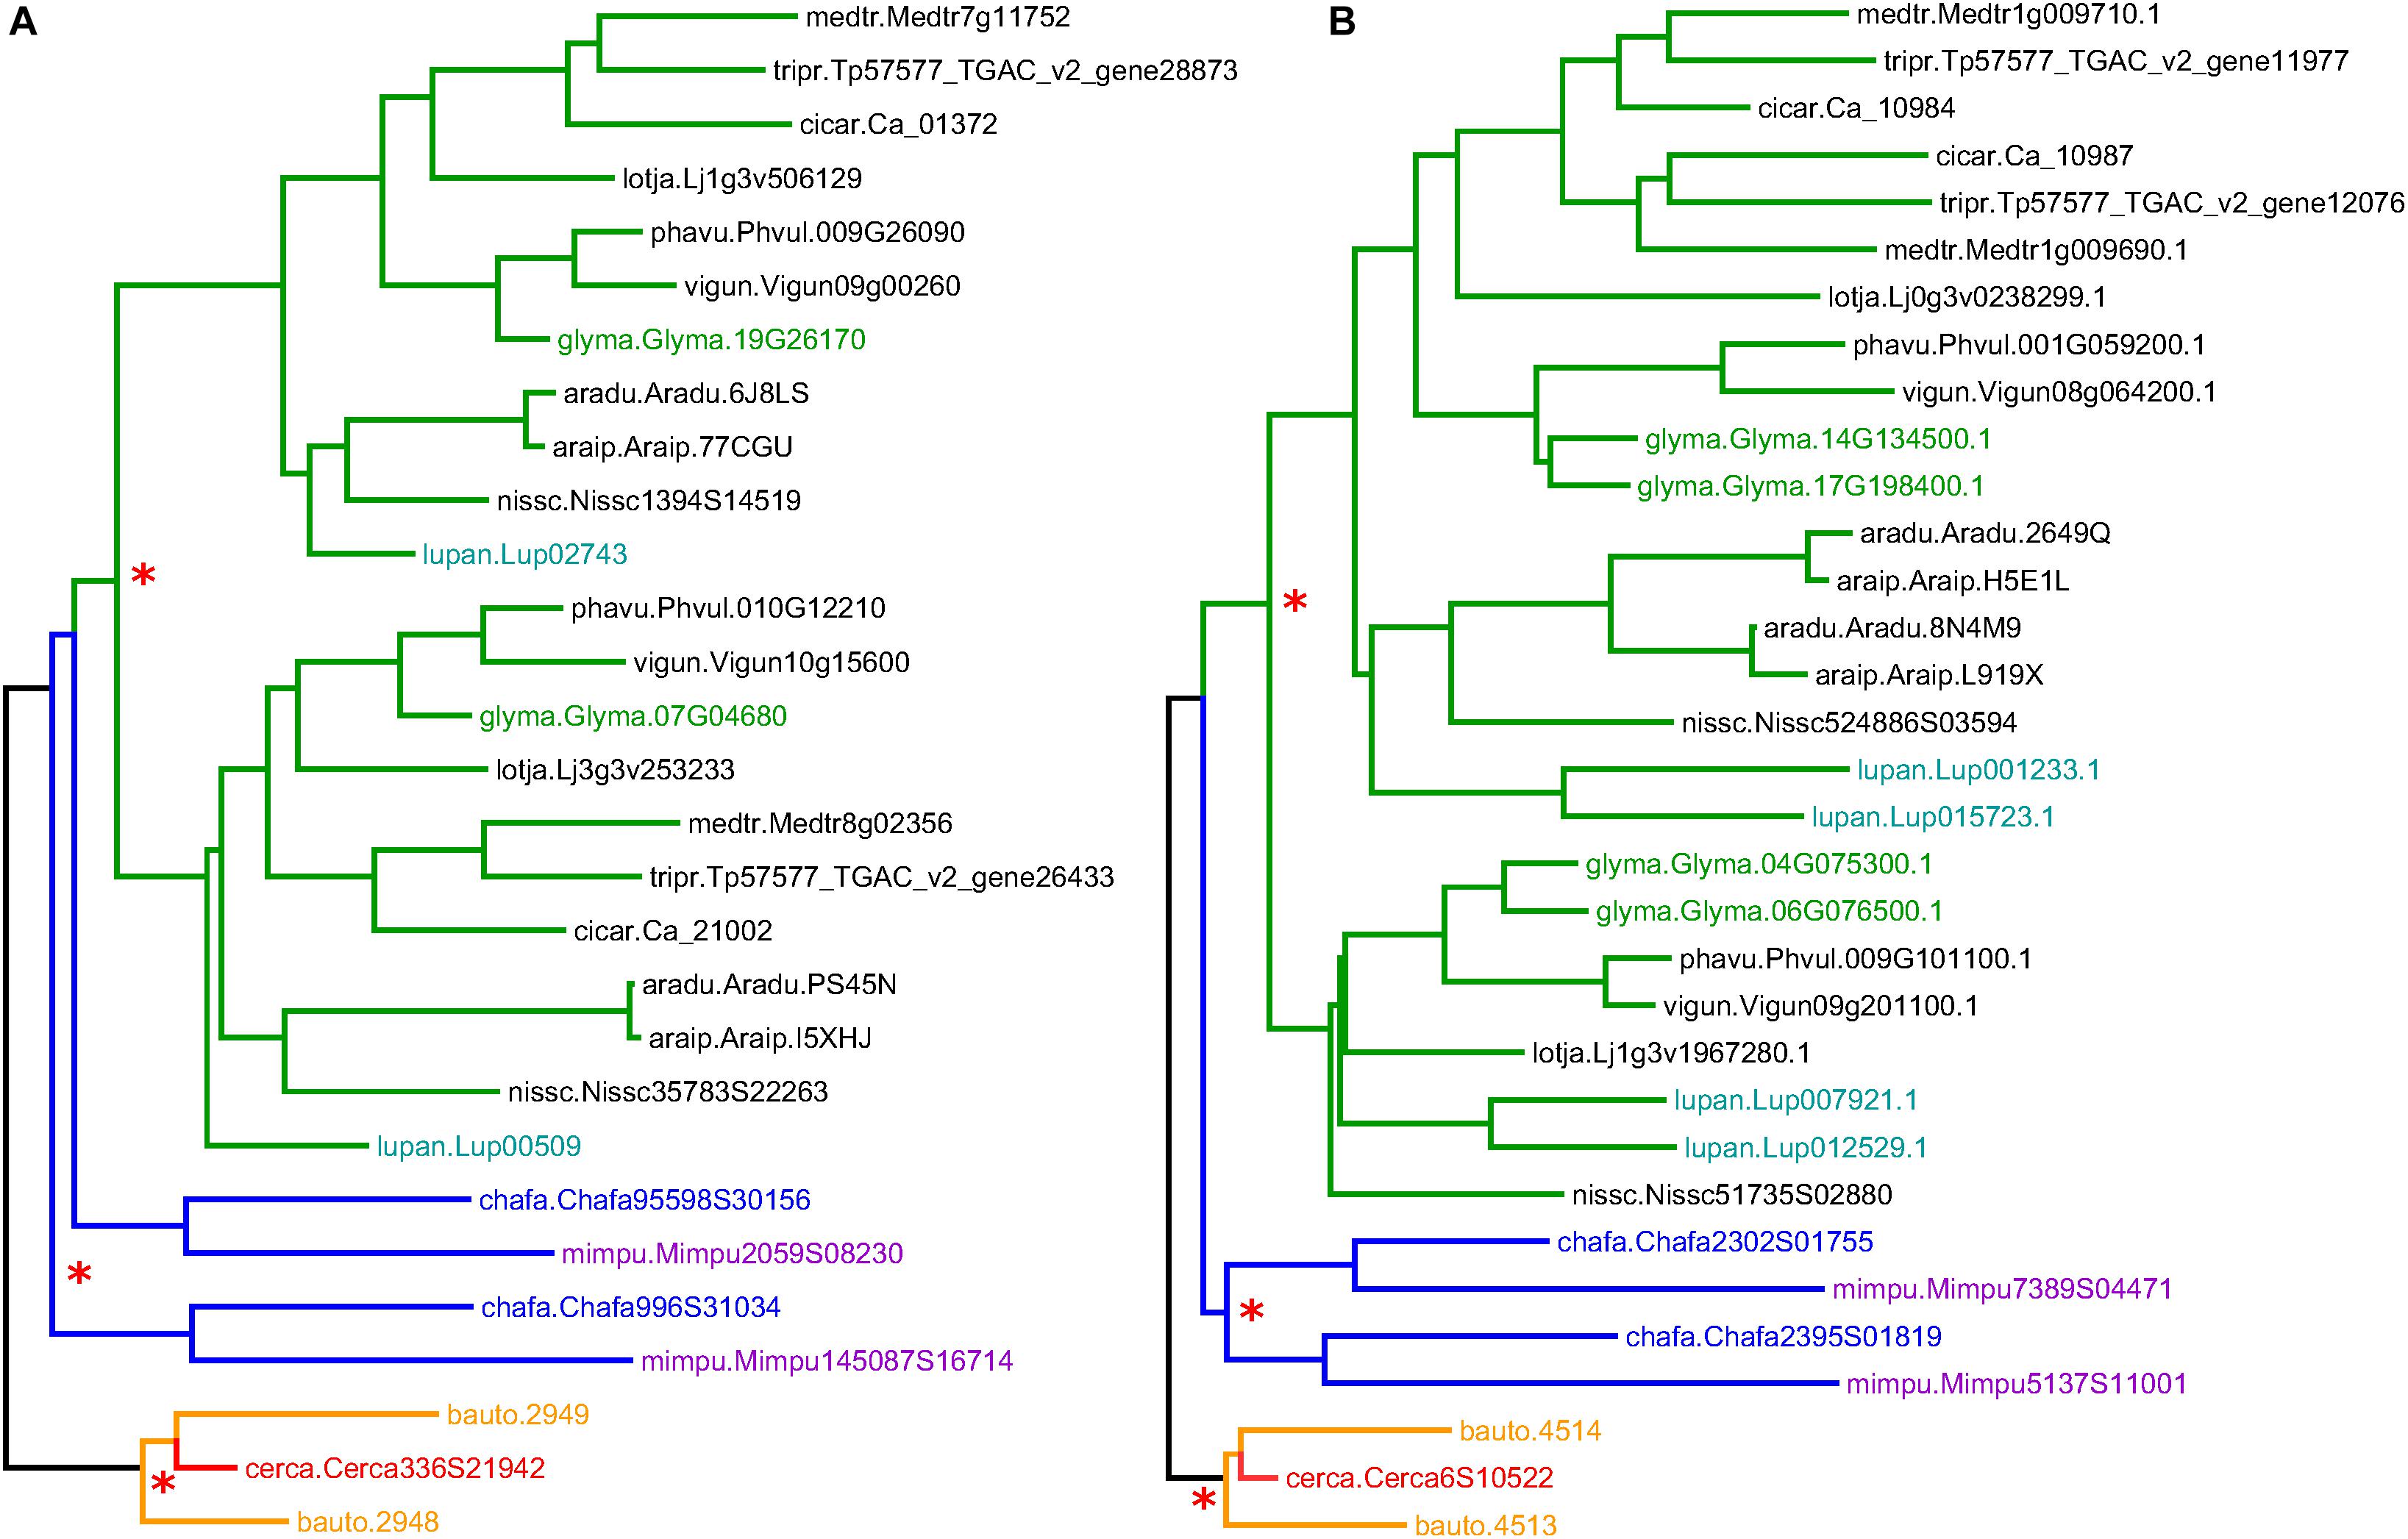
Figure 3. Sample gene trees (for gene families 31DXWY and 2SH9KY; A and B, respectively), showing clades corresponding to the Cercidoideae (orange and red), Caesalpinioideae (blue and violet), and Papilionoideae (green). Species abbreviations are composed of the first three letters from the genus and the first two letters of the species. Full name correspondences are indicated in the text. Non-legume outgroup sequences are in gray. Red asterisks mark common ancestors of homoeologous sequence pairs. Additional, more recent WGDs within the Papilionoideae are highlighted with colors of the sequence IDs: green for Glycine max and turquoise for Lupinus angustifolius.
Summaries of Sequence Counts for All Gene Families (Legume Phylogeny Working Group et al., 2017)
To investigate WGDs in the legumes, we analyzed gene counts across all legume gene families. A summary overview of the phylogenomic analysis is shown in Table 3, which gives counts of gene families (and trees) having the indicated sequence count for each species (Only selected species are shown in Table 3; the counts for all species and all families are given in Supplementary Table S2). These are given for two variants of the trees: first (A) for the full, unmodified trees, and second (B) for trees in which similar (Ks < 0.2) terminal sequence pairs for a species have been reduced to a single representative, in order to reduce the effect of private, genus-specific WGDs. For example, in Table 3A, the first column (glyma / G. max) shows the largest number of trees (6531) having two sequences, and the second largest number of trees (3995) having four or more sequences. A count of four for G. max would be expected in a gene family in which no gene loss occurred following the two WGDs in the Glycine lineage within the period of legume evolution (Schmutz et al., 2010). In Table 3B, in which terminal same-species pairs have been reduced to a single representative, the largest number of trees (7951) has one sequence, and the second largest number of trees (4217) has two sequences.
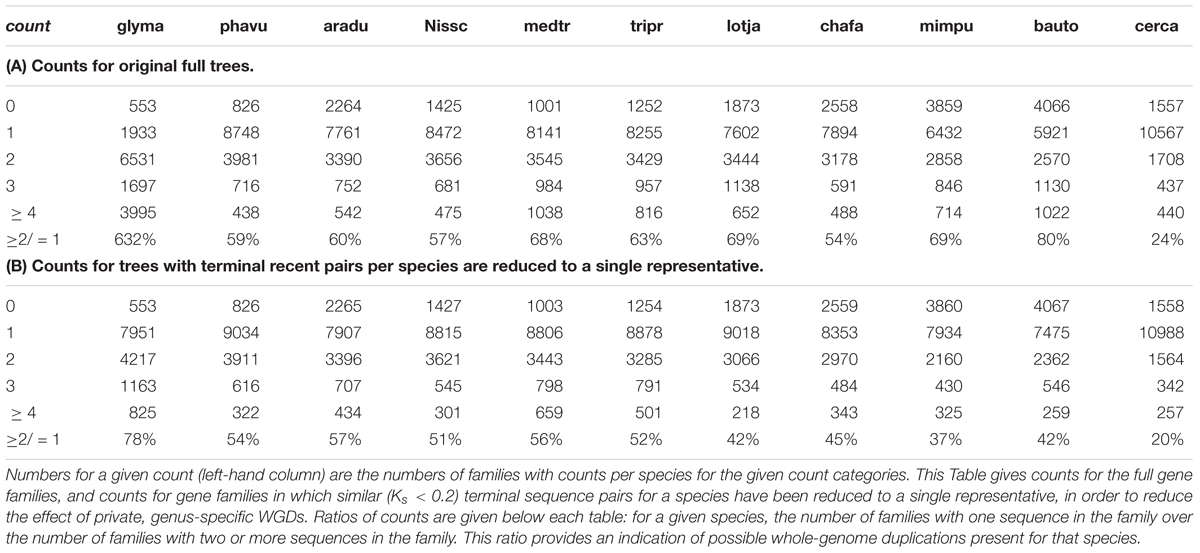
Table 3. Counts of gene families with the indicated numbers of genes per family.
We propose that an indicator of potential older WGDs for a species is obtained by dividing the number of gene family counts for which a species is represented at least twice in the family by the number of family counts for which a species is represented only once. These ratios are given at the bottom of Tables 3A,B. For species with a WGD within the period of legume evolution, a relatively larger number of families should have two or more sequences. The most dramatic ratio is for Glycine (632%; i.e., 6.3 × the naïve expectation) – which has two WGDs in its legume history (pre-papilionoid and a much more recent Glycine-specific duplication). For the unreduced trees (1A), all other species have ratios greater than 50% except for Cercis, with 24%. For the reduced trees (with collapsed terminal same-species clades), the ratios are somewhat lower for all species: 42–78% for all species except Cercis, with 20%. We interpret these results as evidence for WGD in all of the represented legume species except Cercis.
Mining for Tree Topologies Within the Cercidoideae
To infer the relative timing of gene duplications relative to speciations, we mined legume gene phylogenies for topological patterns expected to be produced by these events. Monophyletic groups were detected from a set of 14,709 families containing at least one sequence each from Cercis and Bauhinia (Figure 4 and Table 4). The MRCA node for each clade containing Cercis and Bauhinia was labeled either as D (for a duplication event) or S (for a speciation event), based on whether there are common species between both partitions corresponding to the two subsequent children nodes. For example, considering clades with two sequences from each of Bauhinia and Cercis, [(B,C),(B,C)] would be labeled D while [(B,B),(C,C)] would be labeled S (Figure 4) The species overlap method has been previously used to study evolutionary relationships of human proteins with their respective homologs in other eukaryotes (Huerta-Cepas et al., 2007). We considered three types of monophyletic groups varying by number of Cercis and Bauhinia sequences: clades containing ≥ 2 Cercis and ≥ 2 Bauhinia sequences, clades containing exactly 1 Cercis and ≥ 2 Bauhinia sequences, and finally clades containing exactly 1 Bauhinia and ≥ 2 Cercis sequences. The proportions of clades out of the total number of clades, for all the three types, that were labeled as D at the MRCA node were also calculated. Species-overlap tests were run on trees in which very recently derived same-species terminal pairs were collapsed (when both branch lengths were less than 0.01), to control for local private gene duplications.
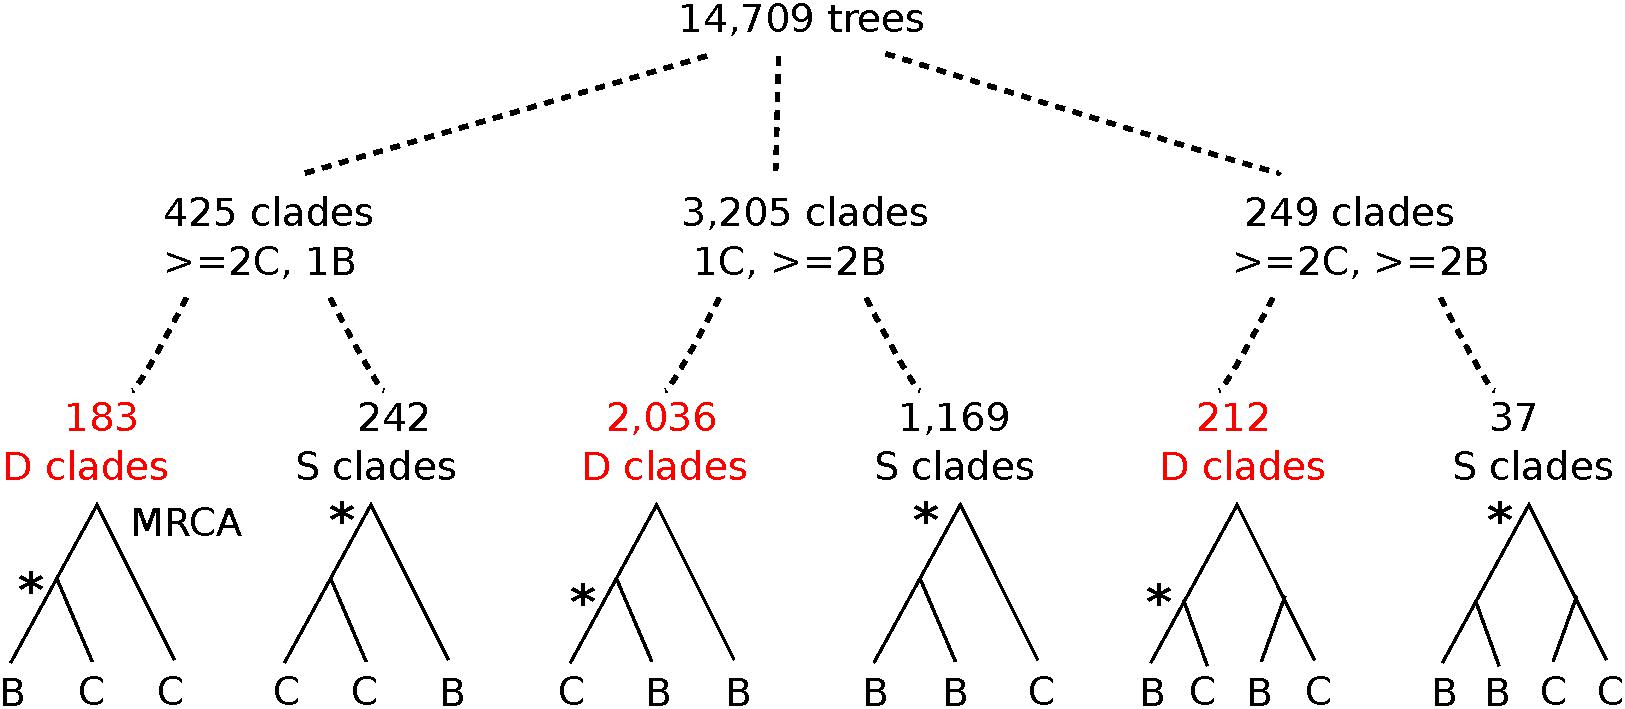
Figure 4. Graphical depiction of tree-mining results for topologies in the Cercidoideae. From 14,709 family trees with Cercis and Bauhinia sequences, clades with ≥2 Cercis and one Bauhinia sequence were 7.5 times more common than clades with 1 Cercis and ≥2 Bauhinia sequences (425 vs. 3205 clades, respectively). Of the latter (more frequent) clade configuration, cases with [(C,B),B] are 1.74 times more common than cases with [(B,B),C] (2036 vs. 1169 clades, respectively). In the first of these patterns, [(C,B),B], the MRCA node of the clade is labeled as a Duplication by the “species overlap” algorithm (see section “Materials and Methods” for description) – meaning that a the MRCA is inferred as due to a gene duplication event rather than a speciation-derived orthology event. Asterisks mark nodes where orthologous genes derive from speciation. Also see Table 4 for counts and percentages.
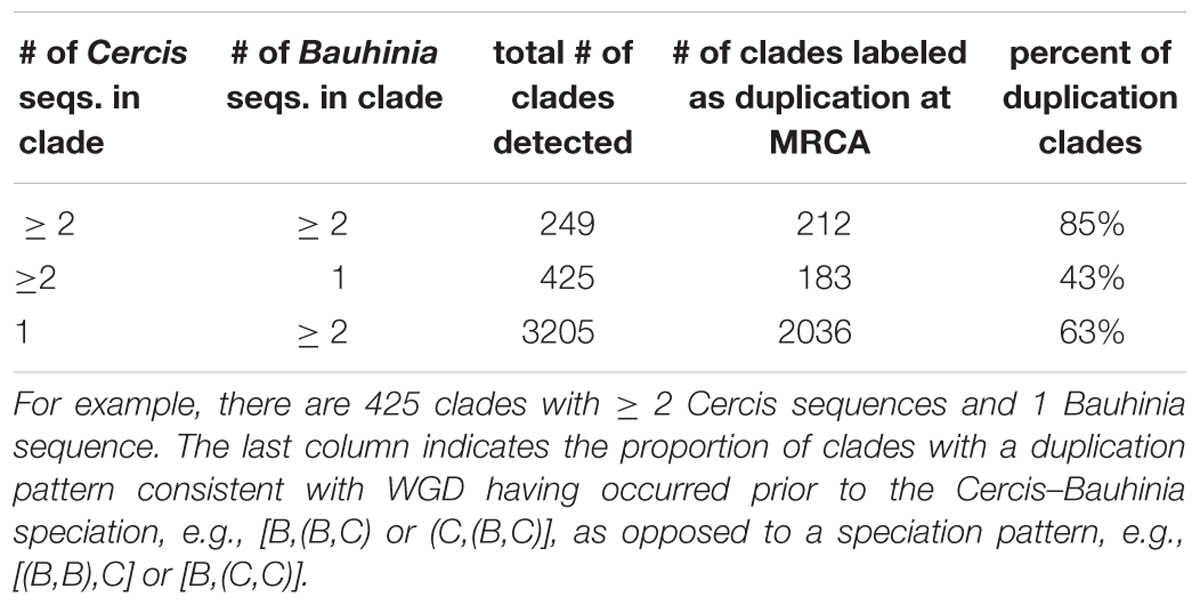
Table 4. The types of monophyletic groups containing different numbers of Cercis and Bauhinia sequences.
There are approximately tenfold more trees with one Cercis and two or more Bauhinia sequences than with one Bauhinia and two or more Cercis sequences (Table 4; 425/3205 and 183/2036). We interpret this result (preponderance of the 1 Cercis, ≥ 2 Bauhinia pattern) as evidence for WGD in Bauhinia but not Cercis. Further, of the clades with two or more Bauhinia sequences and one Cercis sequence, most (63%) of these have Cercis nested within the clade: 2036 of the total clade count look like [(B,C),B] rather than [(B,B),C] – the former likely resulting from a duplication of Bauhinia prior to speciation, and the latter resulting from speciation followed by duplication of Bauhinia. This result might seem nonsensical (duplication predating the Cercis–Bauhinia speciation, yet not affecting Cercis), but it would be consistent with allopolyploidy – with a Cercis progenitor having contributed one of the subgenomes in the allopolyploidy event that gave rise to Bauhinia and all other species in the rest of the Cercidoideae clade (elaborated further in the section “Discussion”).
Gene Duplication Patterns Across Diverse Species in the Cercidoideae
To determine gene duplication patterns for species in the Cercidoideae, we take advantage of the well-conserved CYCLOIDEA-like TCP genes, which have been used both for phylogenetic inference and for studies of evolutionary development in the legumes (Citerne et al., 2003, 2006). Using two sets of degenerate PCR primers that preferentially amplify two classes of CYCLOIDEA-like TCP genes in the legumes (Citerne et al., 2003), Sinou and Bruneau (pers. comm.) amplified CYCLOIDEA-like genes from 114 species in Cercidoideae. These span all twelve genera in this subfamily. A phylogeny from a subset of these sequences is shown in Figure 5 – with sequences from each genus included but omitting some species from well-represented genera (see Supplementary Data Sheet S5 for the phylip-format phylogeny and SD08 for the sequence data and accessions).
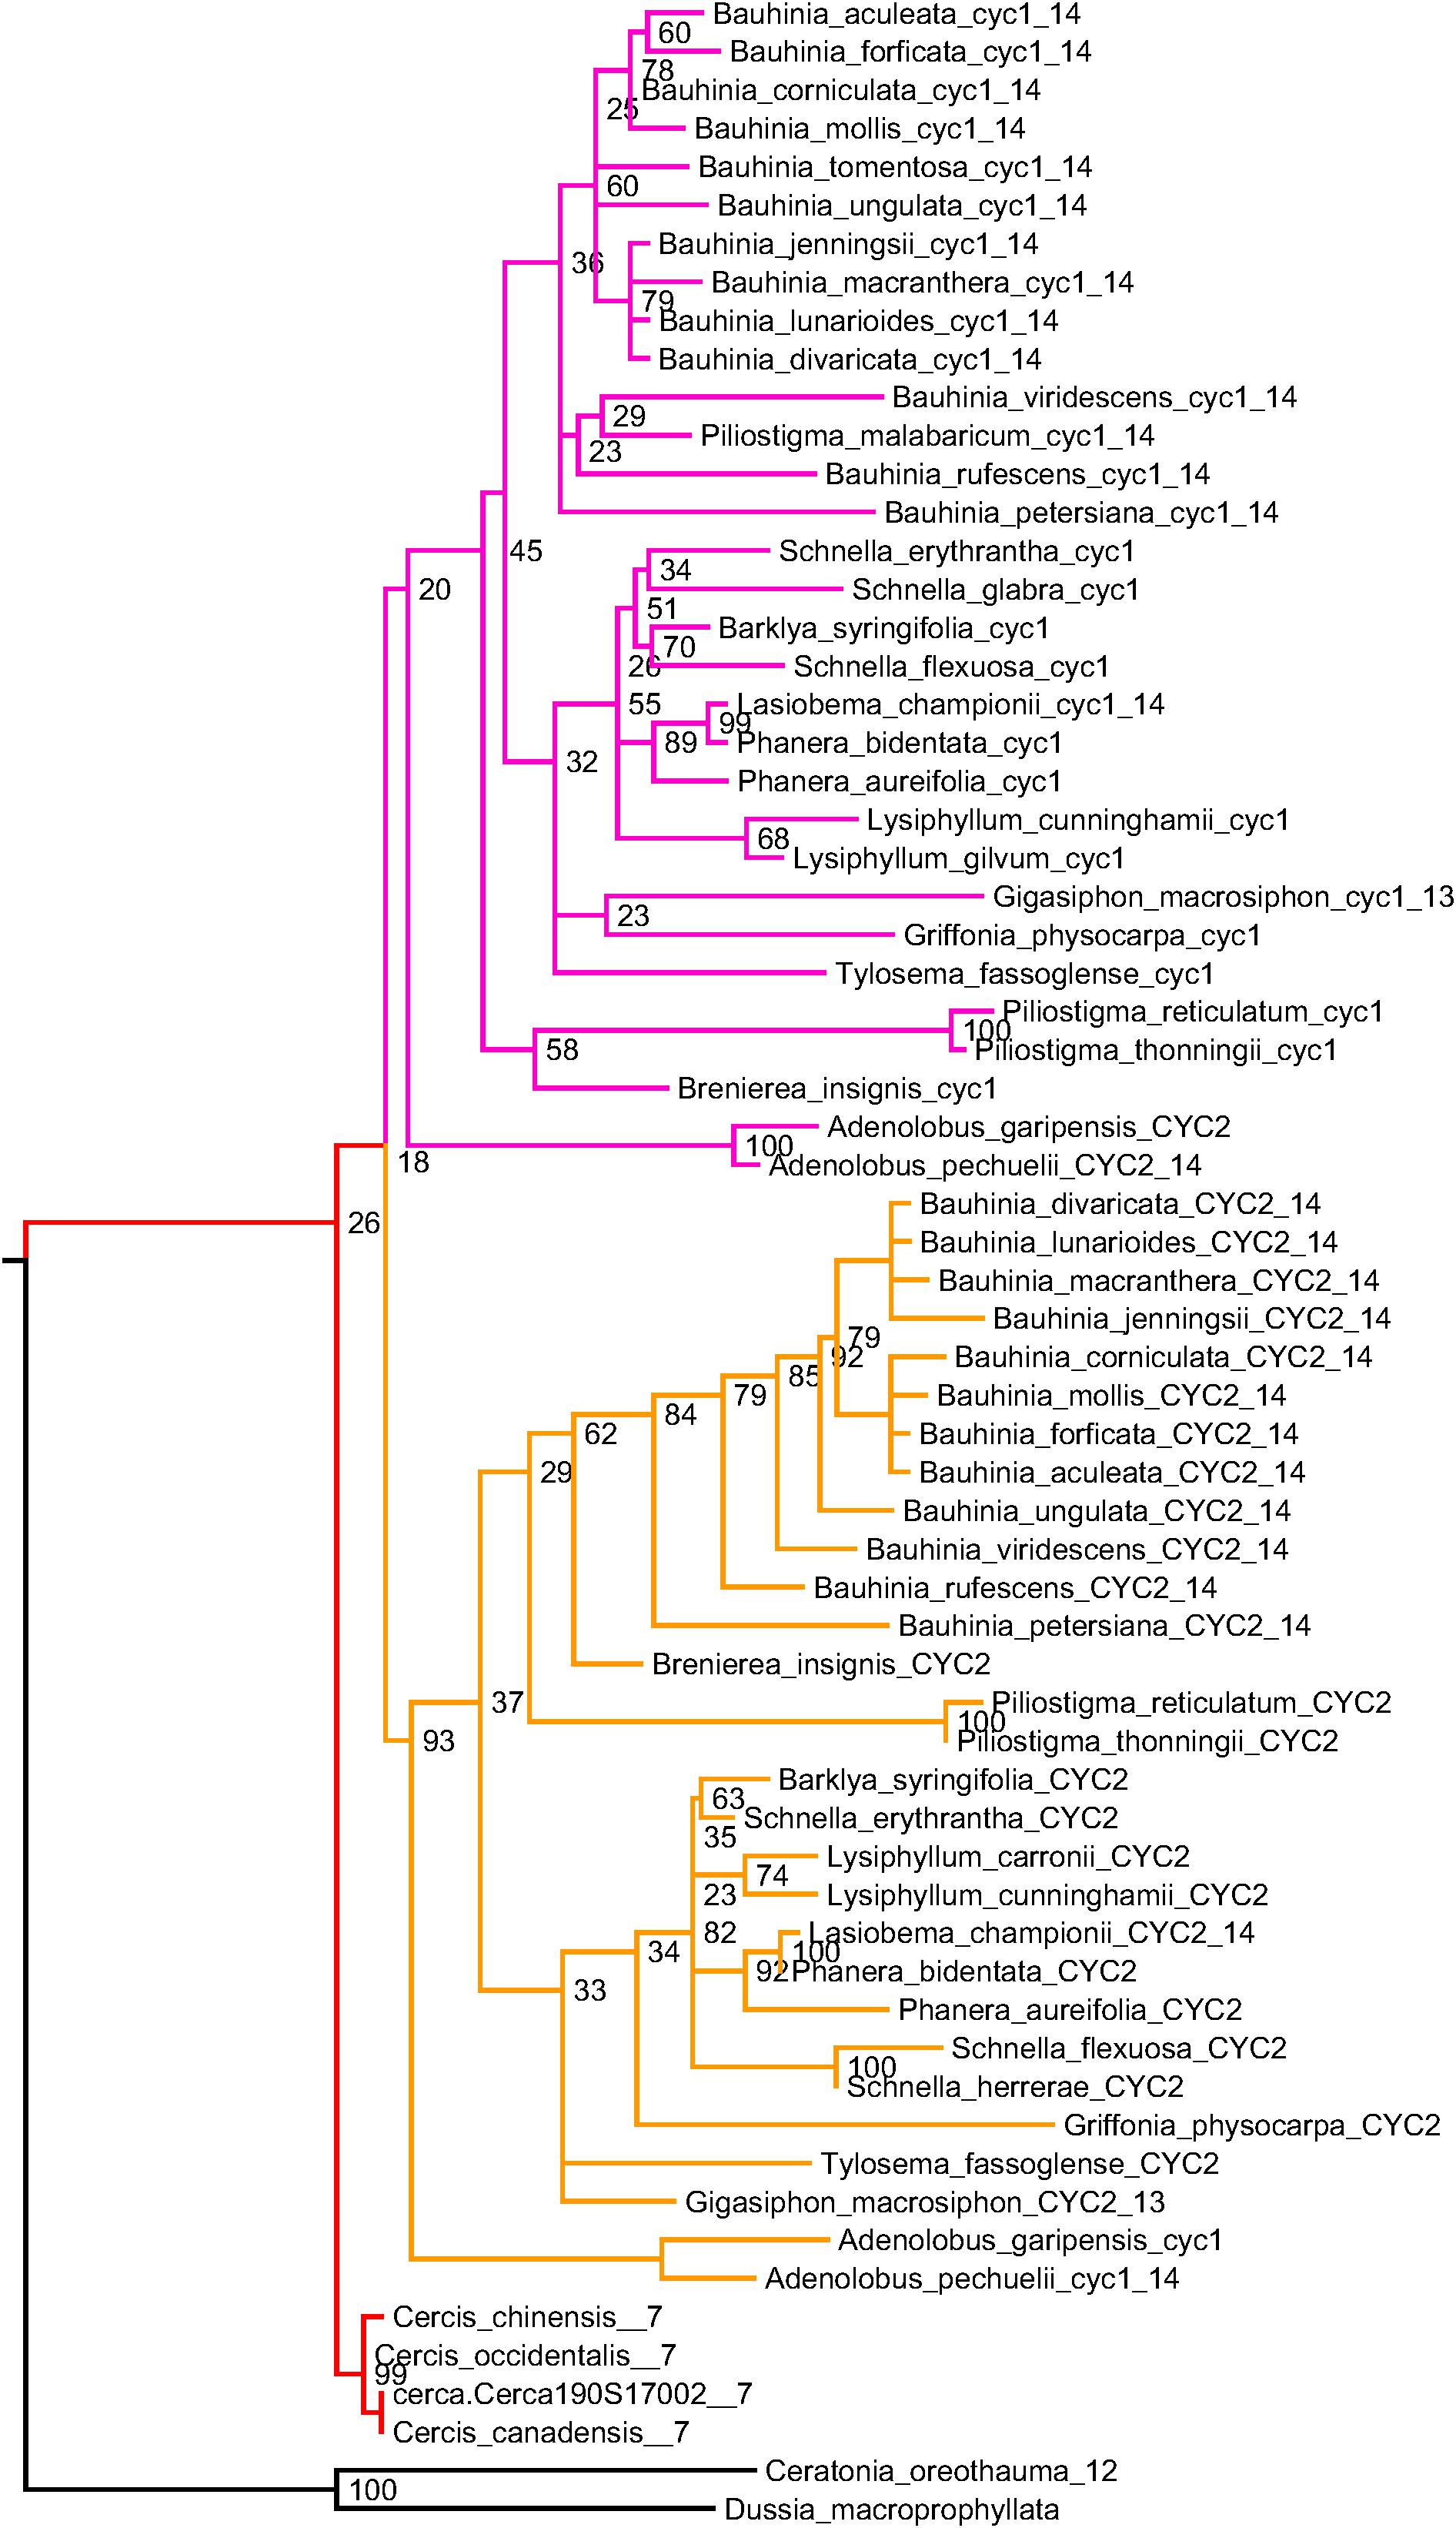
Figure 5. CYCLOIDEA gene tree, for species in subfamily Cercidoideae. For all species but Cercis (red), there are two gene copies: in the clades labeled “CYC1” (pink) and “CYC2” (orange). Where chromosome counts are available, the haploid count is indicated at the end of the sequence identifier. These values are 7 for the three included Cercis species, and 14 for all other species for which counts have been determined within the Cercidoideae, save Gigasiphon macrosiphon, which has 13. For C. canadensis, one sequence has been amplified using PCR and one sequence (Cerca190S17002) comes from the genomic assembly. One of several possible rootings is shown (with bootstrap support values indicated), based on comparison with CYCLOIDEA orthologs from Ceratonia oreothauma (carob relative, from the Caesalpinioideae) and Dussia macroprophyllata (an early-diverging species from the Papilionoideae).
A feature readily apparent in the phylogeny is its division into three clades: one with sequences marked “CYC1” (salmon), one with sequences marked “CYC2” (orange), and one unlabeled (red) (Figure 5). Most species have two representatives in the phylogeny: one in the CYC1 clade and one in the CYC2 clade – except in Cercis (three species), for which only one sequence was amplified (or recovered from the genome assembly, in the case of C. canadensis). Although the favored topology places Cercis sequences sister to sequences from other Cercidoideae, bootstrap support for this relationship is weak. Alternative resolutions thus are not ruled out, including placement of the Cercis clade sister to either CYC1 or CYC2. This would be consistent with the pattern observed in the trees in Figure 3, i.e., [(C,B1),B2] – and would be consistent with a model of allopolyploidy (see section “Discussion”).
Chromosome Counts Across the Legume Phylogeny
Phylogenetic and chromosome count data can be combined in order to explore chromosomal evolution across the legumes. We combined the extensive matK-based phylogeny from the LPWG (Legume Phylogeny Working Group et al., 2017), with count data from the Chromosome Counts Database (CCDB version 1.45) (Rice et al., 2015). The CCDB contains 27,947 count reports for legume species, spanning 477 genera. For many genera, there are numerous reports; for example, Acacia has 472 reported counts across 152 species. We determined the modal gametic chromosomal count value, “n,” for each genus (for example, in Acacia, the modal count is n = 13, of the 152 species with counts, 71% have n = 13). See Supplementary Table S4 for count details. We then displayed these modal counts on the species phylogeny, using one species as the representative for each genus in the phylogeny.
In Figures 6, 7, a partially collapsed phylogeny has been annotated and summarized for ease of presentation. Count details for each species and genus are given in Supplementary Table S4; an image of the full tree with count data is in Supplementary Data Sheet S6; and the PHYLIP-format tree file is in Supplementary Data Sheet S7. Some particularly well-represented clades have been collapsed; for example, the mimosid clade contains 47 species with chromosomal counts; these have been collapsed in Figure 7, and the overall modal count for that clade is presented as an annotation (the mode for the chromosomal count is n = 14 for the mimosoid clade within the Caesalpinioideae). See Table 5 for counts in each clade.
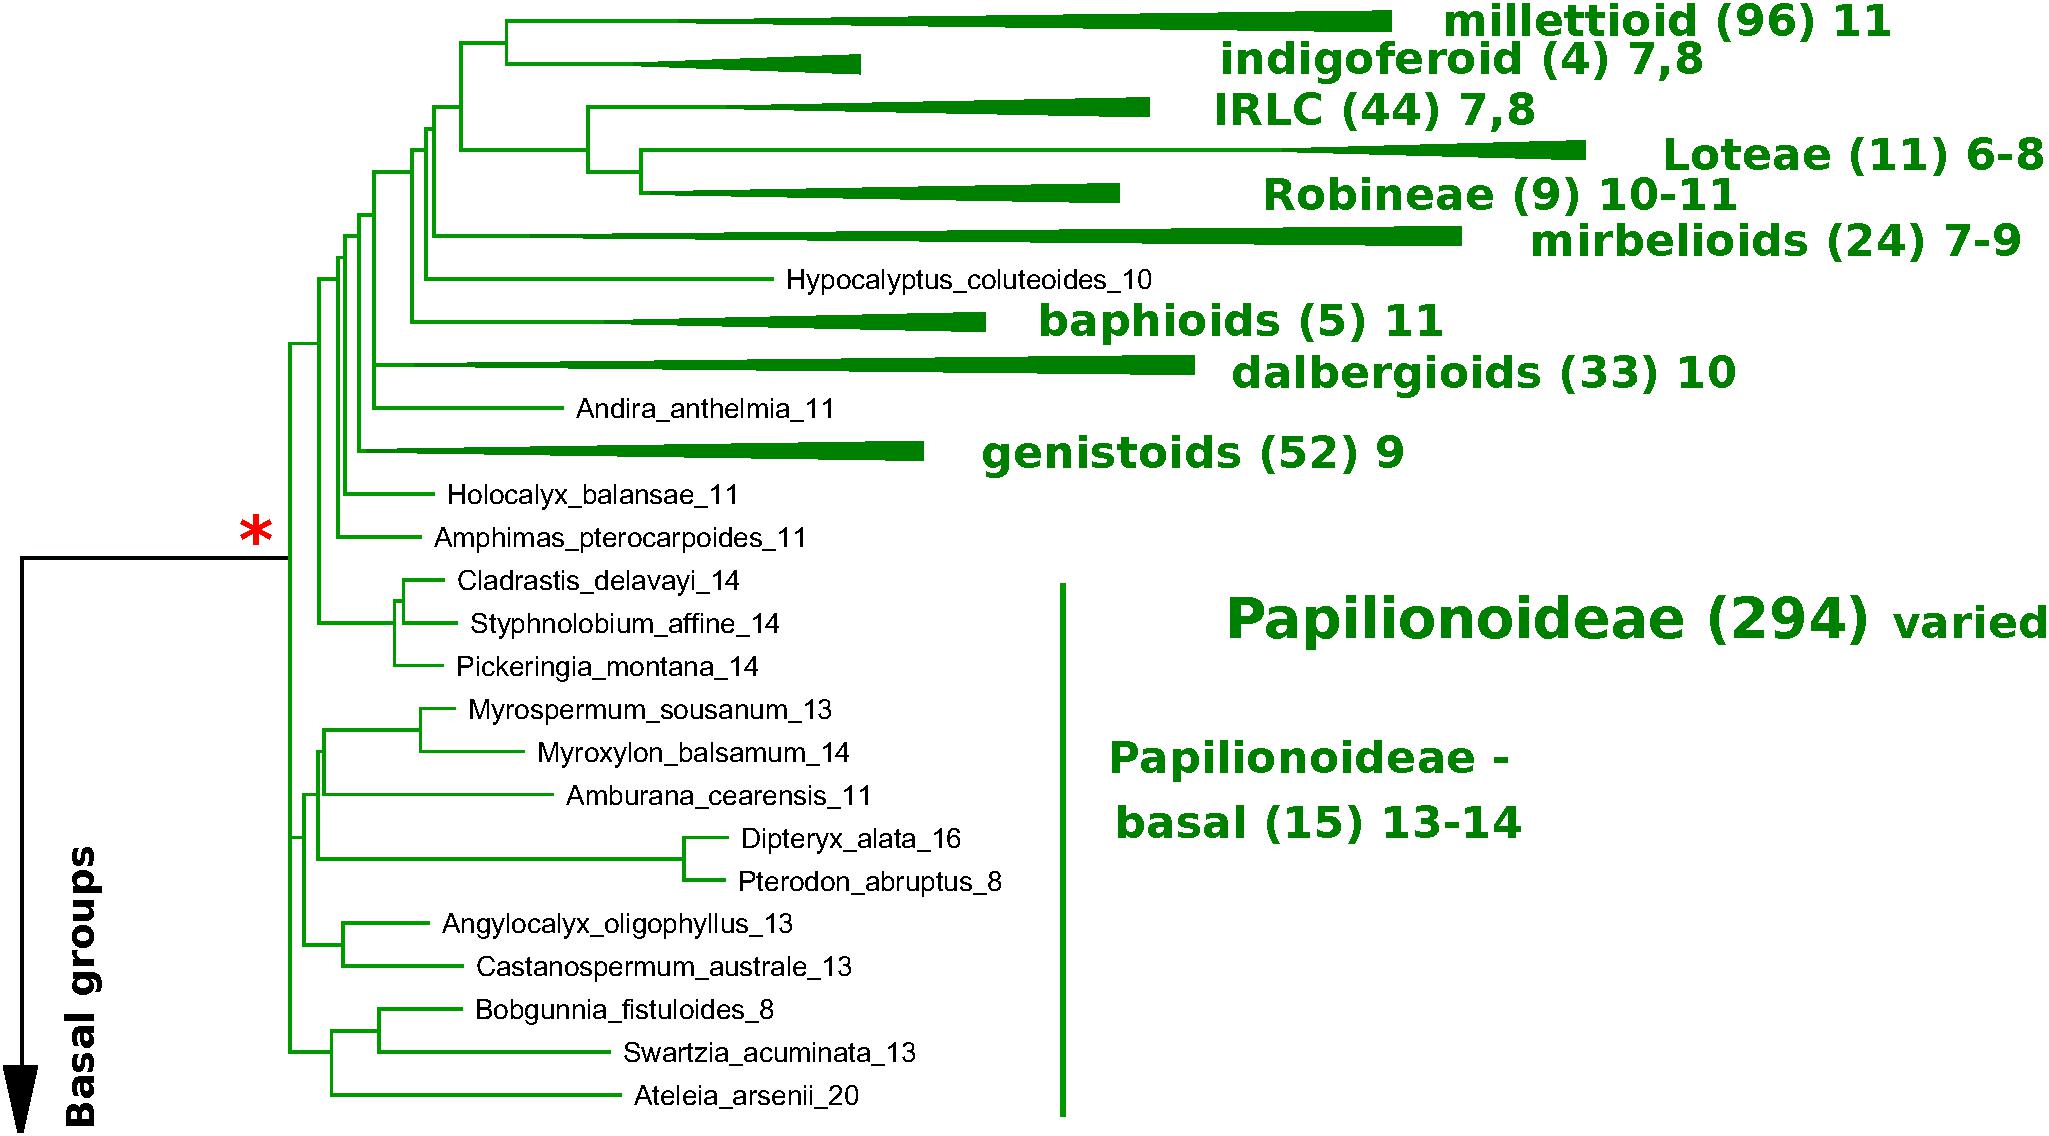
Figure 6. Papilionoid portion of the matK-based species phylogeny for representative species in the legumes, with chromosome count data (Figures 6, 7). matK-based species phylogeny for representative species in the legumes (derived from Legume Phylogeny Working Group et al., 2017), with chromosome count data. Only species for which chromosome counts are available are shown, with the exception of the Cercidoideae (Figure 7), where additional species are shown for context in that subfamily. Chromosomal counts are given as the mode for the indicated genus, where there are differences in the genus. Some particularly well-represented clades have been collapsed and are represented by a colored triangle. The number of genera with counts is given in parentheses – for example, 96 genera are represented in the triangle representing the millettioid clade (top of Figure 6), and 47 genera are represented in the triangle representing the Mimosoid clade (top of Figure 7). Red asterisks indicate polyploidy events – either known (e.g., Papilionoideae) or hypothesized (e.g., Dialioideae).
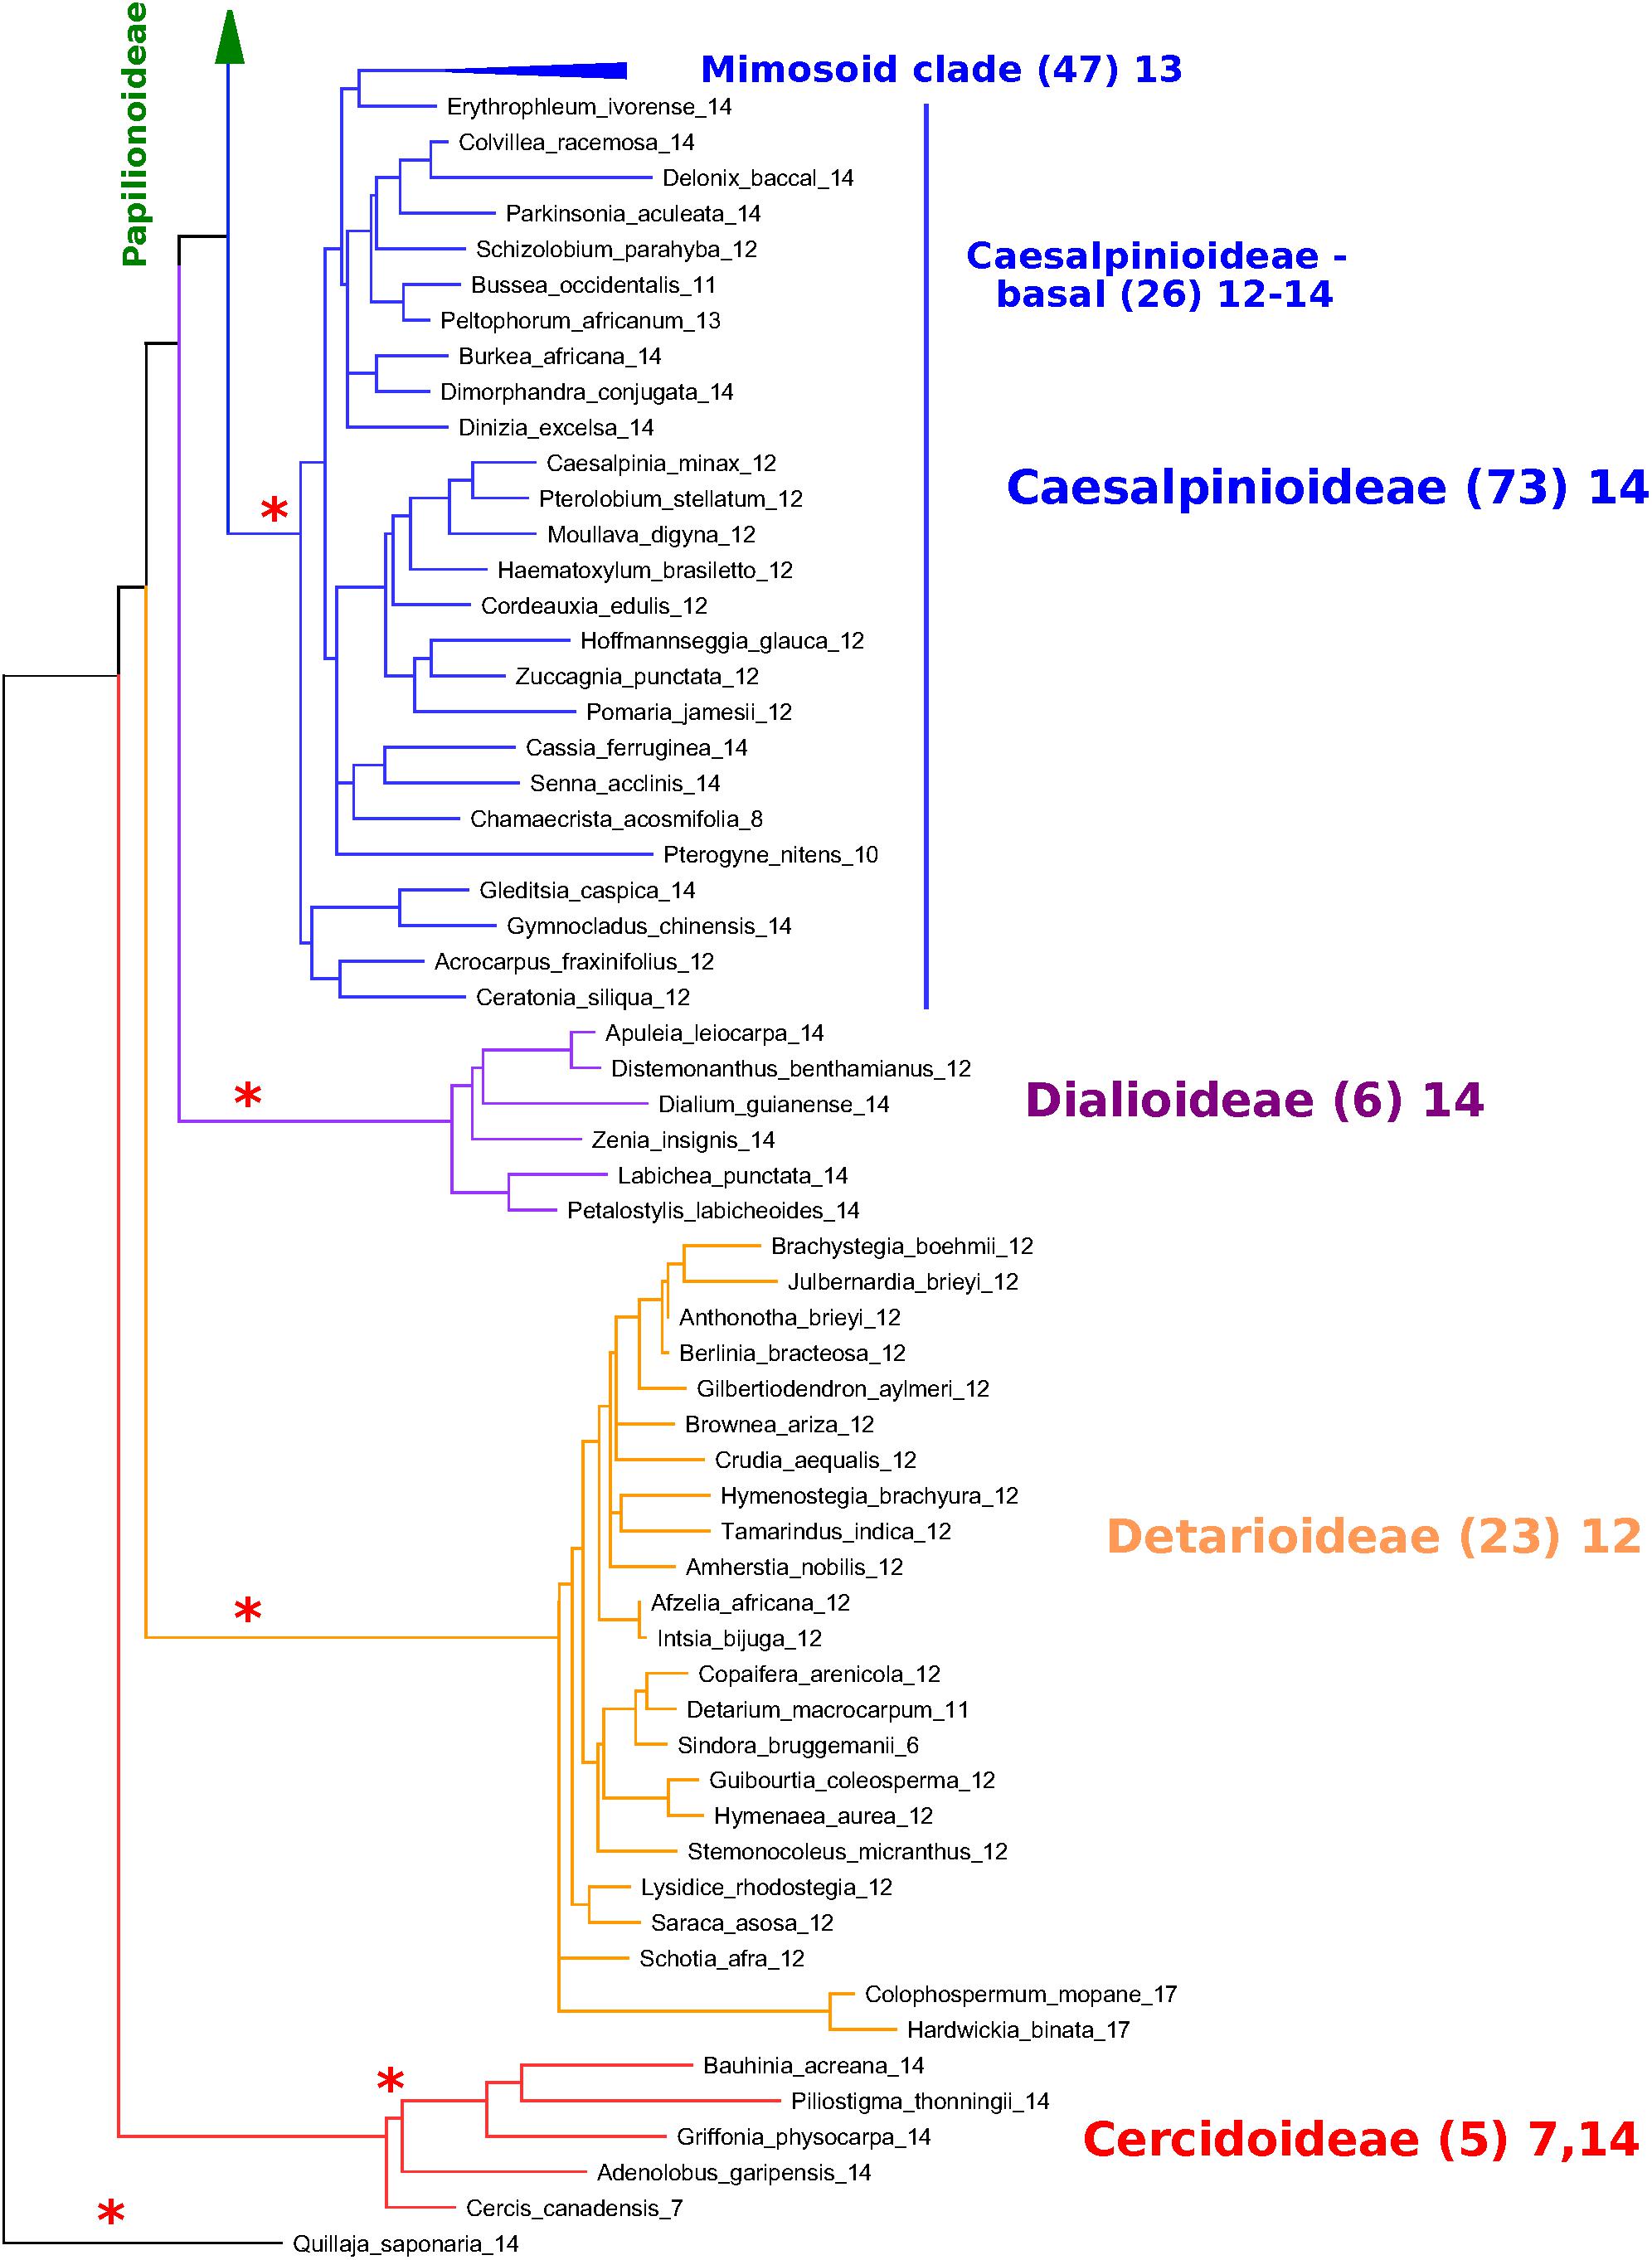
Figure 7. Non-papilionoid portion of the matK-based species phylogeny for representative species in the legumes, with chromosome count data. Figure 7 extends Figure 6; see description under Figure 6. The relative placements of the subfamilies are uncertain, with the Cercidoideae and Detarioideae, best considered as a polytomy, given current phylogenetic resolutions (Legume Phylogeny Working Group et al., 2017). ∗Indicate polyploidy event – either known (e.g., Papilionoideae) or hypothesized (e.g., Dialioideae).
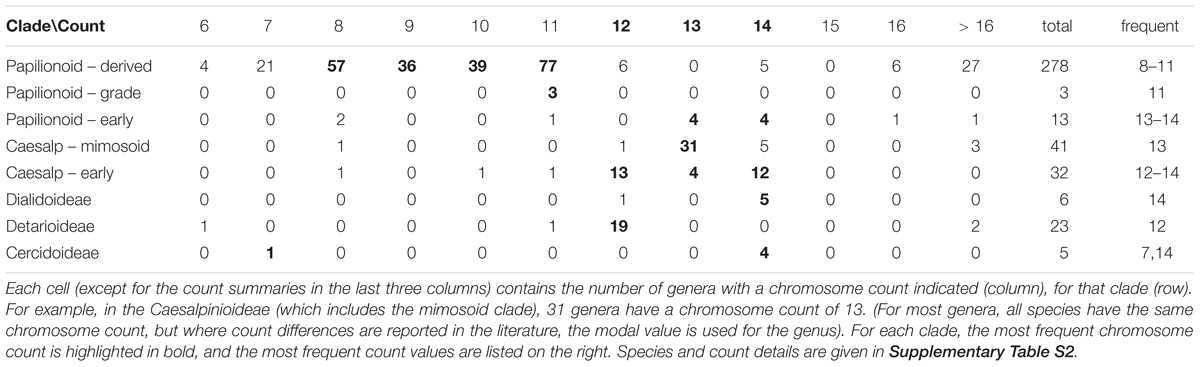
Table 5. Counts of genera with indicated haploid (gametic) chromosome numbers, by subfamily or clade.
At the subfamily level, the modal chromosome counts are generally unambiguous, with the exception of the Papilionoideae, with a more complex pattern of chromosome counts. The Papilionoideae, being an unusually large subfamily (containing ∼13,800 species in that subfamily and more than 70% of legume species; Cardoso et al., 2012), has been treated in a separate analysis (Ren et al., 2019). However, we note here that the groups sister to the large crown clades of papilionoid species, e.g., Swartzia, Myroxylon, and Cladrastis, have 13 and 14 as the most frequent counts (Figure 6 and Table 5). The clades of the crown group generally have lower counts: 11 for Amphimas, Holocalyx, Andira dispersed along the grade with the genistoid, dalbergioid, and baphioid clades. Among the remaining papilionoid clades (containing the majority of species in the subfamily), chromosome counts are varied, but are generally in the range of 7–11 chromosomes.
The Caesalpinioideae has generally clear count patterns: 14 for the large mimosoid clade and 12–14 for the remaining, early-diverging taxa (Table 5). Across 73 genera with counts in the Caesalpinioideae, 66 have modes at n = 12, 13, or 14 (14, 35, 17, respectively – combining “early” and “mimosoid” in Table 5). There are some intriguing exceptions, however; for example, Calliandra and Chamaecrista and have n = 7–8, despite being nested in clades with n = 13 or 14 – apparently indicating chromosomal fusions or reductions of some sort; and other genera such as Neptunia and Leucaena, have n = 28 and 52, respectively, suggesting ploidy increases from n = 14 and 13.
For the Dialioideae, five of six genera with count data have n = 14. For the Detarioideae, 19 of 23 genera with count data have n = 12. For the Cercidoideae, four genera (Bauhinia, Piliostigma, Griffonia, and Adenolobus) with count data have n = 14, and only Cercis has n = 7. The nearest outgroup species to the legumes may also be informative. Quillaja saponaria (Quillajaceae) which shows evidence of a WGD (via transcriptome Ks data; Cannon et al., 2015), has n = 14. Another near outgroup, Suriana maritima (Surianaceae), has n = 9; its WGD status is not known directly, though it lacks duplication in any of its CYC-like genes (Zhao et al., 2019).
Genome Sizes in the Cercidoideae
Roberts and Werner (2016) report an average of 2C = 0.751 pg for 30 accessions across 9 Cercis species. Using the conversion ratio of 1 pg = 978 Mb (Dolezel et al., 2003), this gives a Cercis genome size estimate of 1C = 0.78 pg ∗ (978 Mb / 1 pg) / 2 = 367 Mbp. This compares with reported 1C genome sizes for several Bauhinia species: 573 Mbp for B. purpurea; 613 Mbp for B. tomentosa, and 620 Mbp for Lysiphyllum hookeri (formerly B. hookeri) (Bennett and Leitch, 2005). These values are ∼1.5 to ∼1.6 times larger than Cercis – which is consistent with the Bauhinia genomes having doubled relative to Cercis (followed by moderate increase in Cercis and/or decrease in Bauhinia – or a situation of an allopolyploid Bauhinia being derived from two genomes of different sizes – one contributed by a Cercis progenitor and one presumably now extinct). A size of 381 Mbp for Cercis is also small relative to other reported legume genomes; for example, the estimated sizes of L. japonicus, M. truncatula, P. vulgaris, and C. arietinum, respectively, are 472–597 Mbp, 465–562 Mbp, 587–637, 738–929 (Arumuganathan and Earle, 1991; Sato et al., 2008; Bennett and Leitch, 2011; Varshney et al., 2013; Tang et al., 2014). Indeed, in comparison with genome size reports for 722 legume species and 84 genera from the Kew C-value database (Bennett and Leitch, 2012), the Cercis estimate of n = 367 Mbp would be smaller than all but one other legume genome (Lablab niger also has an estimated size of 367 Mbp). For all reported legume genera (taking median value per genus where values are available for multiple species in a genus), the average haploid genome size is 1,424 Mbp and the median is 1,157 Mbp (Supplementary Table S5).
Discussion
This study examines evidence regarding ploidy in the legume family, particularly focusing on subfamily Cercidoideae. What motivates this focus is the hypothesis that Cercis, sister to the remainder of the Cercidoideae, has no history of polyploidy – which may be in contrast to all other legume species. This would make Cercis valuable as a genomic model for the legumes, and would also help to clarify histories of chromosome evolution throughout the rest of the large and diverse legume family. Specifically, if Cercis did not undergo a WGD relative to the common ancestor of legumes, and if the ancestors of other lineages in the Cercidoideae, Dialioideae, Detarioideae, Caesalpinioideae, and Papilionoideae did, then the legume clade as a whole is not fundamentally polyploid relative to its sister taxa. Combined with evidence that the papilionoid WGD affects all papilionoid species but does not extend to species in the caesalpinioid or detarioid subfamilies (Cannon et al., 2015), the necessary inference is that there must have been multiple, independent events: at a minimum, one in the Cercidoideae and another in the Papilionoideae – and our findings here are also consistent with our previous conclusion of independent polyploidy events early in the Caesalpinioideae and Detarioideae (Cannon et al., 2015). We have no information about ploidy in the monogeneric Duparquetioideae; and it is not known directly whether species in the Dialioideae experienced a WGD, though chromosome counts of 12–14 in Dialioideae are consistent with the hypothesis that they too are polyploid.
The cumulative evidence that Cercis lacks a legume-era WGD is substantial. Recapping:
• In Ks plots (Figures 1, 2), there is no peak indicating WGD in Cercis – particularly, in plots derived from synteny comparisons. In contrast, such peaks are clearly evident in diverse legume lineages including Phaseolus, Bauhinia, and Chamaecrista. While there is no such peak in the Cercis self-comparison, there are clear peaks in comparisons of Cercis to each of the other species examined, indicating that the lack of Ks peak is not due to something essentially wrong with gene-calls in Cercis (the gene calls have homologs with the comparison legume species, and those homologs can be aligned in-frame with those homologs, giving reasonable Ks results).
• In genomic synteny comparisons between Cercis, Phaseolus, and Prunus (the latter two with known duplication histories), the duplication status of Cercis looks like that of Prunus rather than Phaseolus – i.e., lacking a WGD in the timeframe of the fabidae.
• In phylogenomic analyses of 14,709 gene-family trees (Table 3), sequence counts aggregated across all trees show a pattern consistent with at least one WGD in each species examined except Cercis. Examining the proportion of gene families with two or more sequences for a species to families with only one sequence, all species examined have a ratio ranging from 54 to 80% (and 632% for G. max, which had an additional recent WGD), in contrast to 24% for Cercis. For comparison, this ratio is 69% in the set of 177 conserved collinear genes in the triplicated B. oleracea genome segments identified by Town et al. (2006).
• Mining the gene families for phylogenetic topologies within the Cercidoideae (Table 4), the overwhelming majority of clades have a pattern of two Bauhinia sequences to one Cercis sequence (roughly tenfold more frequently than the other options combined).
• Diverse species within the Cercidoideae all show a pattern of duplicated CYCLOIDEA-family genes, with the exception of Cercis, which has only one CYCLOIDEA gene – whether assayed through amplification with degenerate primers for CYCLOIDEA, or through gene prediction in the Cercis genomic sequence (Figure 5). All phylogenetic analyses (whether based on plastid or nuclear sequences) resolve Cercis as sister to the remainder to Cercidoideae, in line with a WGD after the split with Cercis (although rooting in Figure 5 is uncertain, so Cercis could group with one or the other of the CYCLOIDEA gene forms in the gene family).
• A survey of chromosome count data for 477 legume genera, examined in a phylogenetic context (Figure 7, Table 5, Supplementary Table S4, and Supplementary Data Sheets S6, S7), shows a pattern consistent with WGDs affecting all subfamilies and most genera – with the exception of Cercis itself. Models in which most legumes are polyploid have been proposed in earlier studies (Goldblatt, 1981; Doyle, 2012), on the basis of chromosome numbers. In the Cercidoideae, the most frequent chromosome count is n = 14 for most species, but 7 in Cercis; in the Detarioideae, the modal chromosome count is 12; in the Dialioideae, the modal count is 14; in the Caesalpinioideae, the modal count is 14; and in the Papilionoideae, the modal count for early-diverging genera (e.g., Swartzia, Angylocalyx, Cladrastis), the most common counts are 13 and 14. Crown-group clades have highly variable counts (generally in the range of 7–11 chromosomes), so we hypothesize a doubling from 7 to 14 leading to the papilionoid origin, then a reduction from 14 to lower numbers for crown-group clades (dalbergioids, baphioids, mirbelioids, Robineae, Loteae, IRLC, indigoferoid, and millettioid).
• Genome sizes in the Cercidoideae are consistent with WGD in Bauhinia and not Cercis. The Cercis genome is approximately 367 Mbp, while values for Bauhinia species range from 573 to 620 Mbp. A Cercis genome size of 367 Mbp is tied for smallest in the legume family, and is less than a third the median reported genome size of 1,157 Mbp, across 84 legume genera. We note this result with a caveat, however, that genome sizes can be highly variable, even within a single genus – affected by mechanisms such as bursts of transposon expansions – e.g., variations in Nicotiana (Leitch et al., 2008) or in Aeschynomene (Brottier et al., 2018).
Further analyses of evolutionary changes due to the differing WGD status between Cercis and other legumes will be of interest – both at the fine scale (e.g., determining the fate of duplicated genes in various lineages, relative to Cercis) and at larger structural scales (e.g., determining structural changes in chromosomes following several independent WGD events) These comparisons would benefit from improved assemblies and annotations, spanning a broader range of legume clades. For example, we expect both Chamaecrista (as a nodulator in the Mimosoideae) and Cercis (as an early-diverging non-nodulator) to be useful in better understanding the origin and evolution of nodulation symbioses – as investigated in several recent papers (Battenberg et al., 2018; Griesmann et al., 2018; van Velzen et al., 2018).
An initially puzzling result from our analysis was the fact that the Ks peak for the Bauhinia self-comparison (Bauhinia–Bauhinia) appears significantly “older” than the Bauhinia–Cercis speciation peak, at 0.25 and 0.15, respectively (Figure 1A). Similarly, most gene tree topologies (63%) that have two or more Bauhinia sequences and one Cercis sequence (Table 4, row 3) have a configuration of (B,(B,C)), indicating duplication prior to speciation – in contrast to what might be expected given a simple model of Cercis–Bauhinia speciation followed by WGD in Bauhinia. In the latter case, the expected pattern would be [(B,B),C] – which is observed in the minority of cases (37%). We note that an apparent speciation pattern may be due either to a WGD or to local, private duplications. Private duplications are common in plant genomes. For example, in M. truncatula, more than a third of paralogs are derived from local duplications (Young et al., 2011). However, local duplications tend to be evident in Ks plots as a recent peak, with maximum near zero – as is seen, for example, in the Phaseolus–Phaseolus comparison in Figure 1. This is the typical pattern described by Lynch and Conery (2000) for eukaryotes generally. The results of our phylogenetic pattern-mining tests are consistent with what we observe (albeit anecdotally) in visual inspection of many trees, exemplified by Figure 3, in which there is a duplication of the Bauhinia paralogs in both trees, apparently followed by orthologous split between one of the Bauhinia sequences and the Cercis sequence.
A model that could accommodate the Ks and tree-topology results is one of allopolyploidy, in which a progenitor of Cercis speciated to give another (perhaps now-extinct) diploid species (Figure 8A). These species diverged for some time, and then the two species contributed their genomes to a new allopolyploid species that was the progenitor of the remaining Cercidoideae. Following allopolyploidy, the two lineages (diploid Cercis and polyploid Bauhinia) would then have proceeded to diverge and diversify – Cercis more slowly and the remaining species in Cercidoideae more rapidly. The current gene family view would then be as observed in e.g., Figure 3, or in the model in Figure 8B.
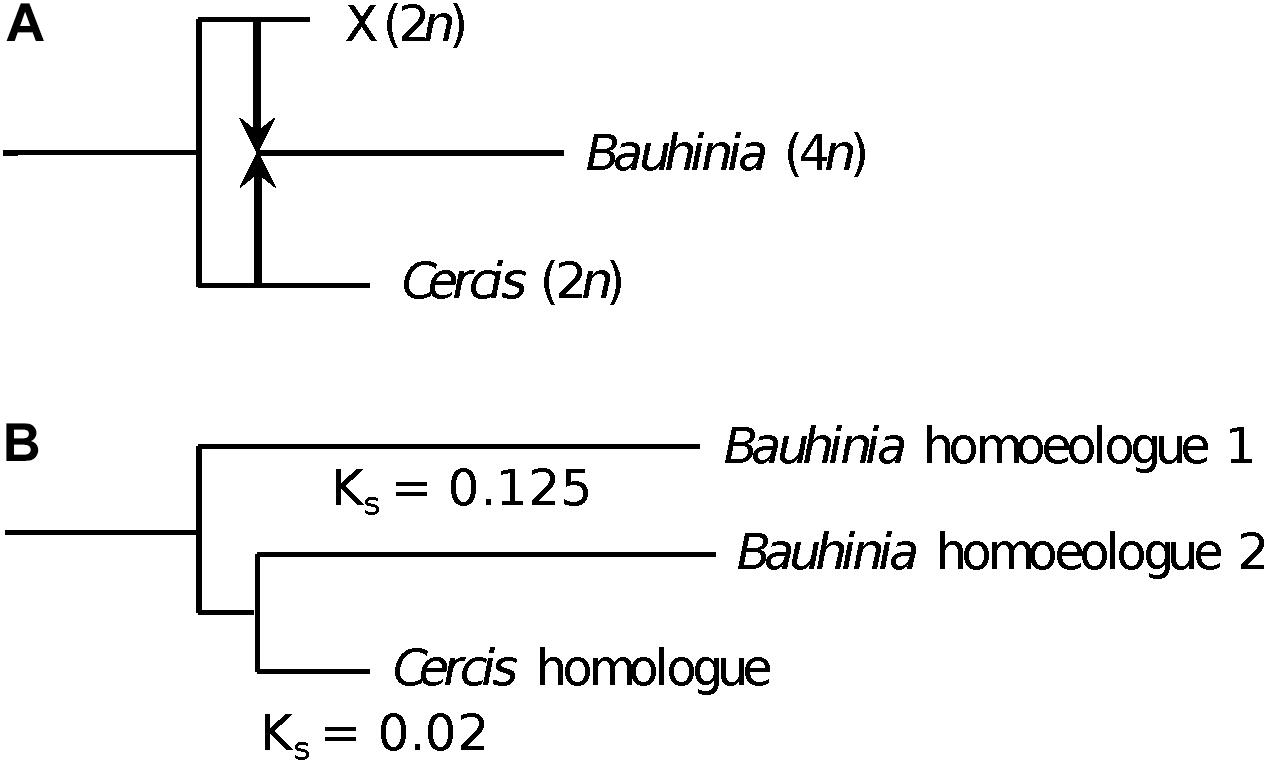
Figure 8. Allopolyploid origin of Bauhinia. (A) Species history, showing divergence between two diploid (2n) species: (1) the ancestor of Cercis and (2) a second species that became extinct (“X”). At some point after the species divergence, the two diploid species hybridized (arrows), followed by genome doubling to produce the allopolyploid (4n) ancestor of Bauhinia (and other Cercidoideae). (B) Representative gene tree sampled from Bauhinia and Cercis, showing the relationships of the single homologous gene in Cercis to the two homoeologs in allopolyploid Bauhinia. The Bauhinia homoeolog 2, contributed by the Cercis ancestor, is sister to the Cercis gene. The Cercis gene has a Ks of ∼0.145 compared with the Bauhinia homeolog 2; and each Bauhinia homoeolog has a Ks of 0.25 with respect to the other Bauhinia homoeolog. The relationship between the species history and the gene tree is complicated by the hypothesized slower substitution rate in Cercis.
Precedent for a significant period of species divergence prior to allopolyploidy is seen, for example, in Arachis: the allopolyploid A. hypogaea was formed, within about the last 10 thousand years, from the merger of A. duranensis and A. ipaensis, which diverged an estimated 2.16 Mya (Bertioli et al., 2016). Another similar example is in cotton, where the allotetraploid Gossypium hirsutum L. is a merger of genomes from progenitor species similar to the extant diploid species G. ramondii Ulbrich and G. herbaceum L. (Wendel, 1989; Flagel et al., 2012; Paterson et al., 2012) In this case, the diploid species diverged c. 5–10 Mya and merged to form G. hirsutum c. 1–2 Mya (Wendel, 1989; Fang et al., 2017).
The genus Cercis contains 10 species and all phylogenetic analyses to date have supported the genus as monophyletic. This is a well-defined group of north temperate trees (North America, Eurasia and eastern Asia). All species for which counts are available are diploid2. There appears to be relatively low genetic diversity within the genus based on plastid and nuclear ribosomal ITS sequences (Davis et al., 2002; Coskun and Parks, 2009). C. chingii (n = 14) is resolved as sister to the other species in the genus in the studies by Davis et al. (2002), and differs from the other species by its coriaceous, unwinged, dehiscent fruit. The other species are morphologically quite similar. It’s not clear if one of the present day Cercis species could better represent an ancestral parental genome resulting in the whole genome duplication.
Cercis genes do appear to have evolved remarkably slowly (at least in the sense of accumulating point mutations that affect Ks and branch lengths). A tree calculated by algebraically solving evolutionary “distance paths” along a gene tree (Figures 1, 2, lower right), using Ks-based branch lengths, shows a Cercis evolutionary rate less than a quarter that of Bauhinia, and roughly a tenth that of Phaseolus since the papilionoid WGD. The slow Cercis rate is also evident in many gene family trees, such as the two shown in Figure 3. The matK gene tree also shows remarkably short branches for Cercis. It is conceivable that the slower evolutionary rate seen in Cercis than other legumes might be partly due to the lack of WGD-derived “extra” genes in Cercis –perhaps presenting extra evolutionary constraints than for duplicated genes. The outcrossing, long-lived tree form might also constrain evolutionary rates (injecting older gametes into new progeny) – although of course these conditions are shared with many species.
Conclusion
The evidence from diverse sources indicates that Cercis may be unique among legume lineages in lacking any evidence for a WGD; that its last duplication event was probably the eudicot “gamma” triplication event; that the genomes of other Cercidoideae and all other legume subfamilies are likely to have been shaped by independent WGD events; that the most likely model for WGD and speciation timing in the Cercidoideae is allopolyploidy – with a Cercis progenitor contributing one subgenome to the allopolyploid Bauhinia progenitor; and lastly, that Cercis has evolved at a strikingly low rate since its divergence from other Cercidoideae. Taken together, these findings suggest that Cercis may serve as a useful genomic model for the legumes, likely representing the duplication status of the progenitor of all legumes.
Author Contributions
SC, JD, and DF-B conceptualized the research. JS, AY, SC, and DF-B planned and constructed gene families. JS and AY conducted phylogenomic tests. AB and CS generated and assembled CYCLOIDEA sequences for species phylogenetic analyses. SC, JS, and AY drafted the manuscript. All authors reviewed and contributed to the manuscript.
Funding
This research was funded by the NSF project “Federated Plant Database Initiative for the Legumes” (#1444806), and the USDA Agricultural Research Service project 5030-21000-062-00D. The USDA is an equal opportunity provider and employer.
Conflict of Interest Statement
The authors declare that the research was conducted in the absence of any commercial or financial relationships that could be construed as a potential conflict of interest.
Acknowledgments
We thank many legume systematists from the Legume Phylogenetic Working Group for assembling a large collection of matK sequences that were essential for placing our analysis in the context of the legume phylogenetic history; Nathan Weeks for providing infrastructure for computational biology work; and Jean-Michel Ane and Matthew Crook for providing access to genome assemblies and annotations for Cercis, Chamaecrista, Mimosa, and Nissolia.
Supplementary Material
The Supplementary Material for this article can be found online at: https://www.frontiersin.org/articles/10.3389/fpls.2019.00345/full#supplementary-material
TABLE S1 | Histograms of Ks values for selected species pairs, calculated using top BLAST matches and calculated using gene pairs from genomic synteny features.
TABLE S2 | Counts of species in legume gene families.
TABLE S3 | Sequence IDs and accessions for CYCLOIDEA-like genes from species in the Cercidoideae.
TABLE S4 | Sequences for legume matK genes, and chromosome counts for legume species, with modal chromosome counts per genus.
TABLE S5 | Legume genome size estimates.
DATA SHEET S1 | legume.genefam.esm.RDQM.SD01_65_hmmalign Full alignments of all legume gene families that contain Cercis and/or Bauhinia.
DATA SHEET S2 | legume.genefam.esm.RDQM.SD02_65_hmmalign_trim2 Alignments of all legume gene families that contain Cercis and/or Bauhinia, trimmed to HMM “match states,” prior to calculation of phylogenetic trees.
DATA SHEET S3 | SD03_70_trees_combined Phylogenetic trees, calculated using RAxML, and rooted by the nearest non-legume outgroup species.
DATA SHEET S4 | SD04_71_trees_reduced_trees Phylogenetic trees as in SD03 but with same-species terminal branches reduced to a single sequence representative, for terminals with branch lengths < 0.2.
DATA SHEET S5 | SD05_tree_legcyc_and_outgrps7boot_color.nh.txt Phylogenetic tree, calculated using RAxML, for CYCLOIDEA-like genes from species in the Cercidoideae.
DATA SHEET S6 | Phylogenetic tree image for all legume genera with chromosome counts, with modal chromosome counts per genus, colored by subfamily.
DATA SHEET S7 | SD11_LPWG_chrom_counts_by_genus3.tree.txt Phylogenetic tree file, in phylip format, corresponding with the image in SD10.
DATA SHEET S8 | Synteny plots between Cercis canadensis, Phaseolus vulgaris, and Prunus persica.
DATA SHEET S9 | SD09_quota_tables Results from quota-alignment pipeline for comparisons between C. canadensis, Phaseolus vulgaris, and Prunus persica.
Footnotes
References
Angiosperm Phylogeny Group, Byng, J. W., Chase, M. W., Christenhusz, M. J. M., Fay, M. F., Judd, W. S., et al. (2016). An update of the angiosperm phylogeny group classification for the orders and families of flowering plants: APG IV. Bot. J. Linn. Soc. 181, 1–20. doi: 10.1111/boj.12385
Arumuganathan, K., and Earle, E. D. (1991). Nuclear DNA content of some important plant species. Plant Mol. Biol. Rep. 9, 208–218. doi: 10.1007/BF02672069
Battenberg, K., Potter, D., Tabuloc, C. A., Chiu, J. C., and Berry, A. M. (2018). Comparative Transcriptomic analysis of two actinorhizal plants and the legume medicagotruncatula supports the homology of root nodule symbioses and is congruent with a two-step process of evolution in the nitrogen-fixing clade of angiosperms. Front. Plant Sci. 9:1256. doi: 10.3389/fpls.2018.01256
Bennett, M. D., and Leitch, I. J. (2005). Nuclear DNA amounts in angiosperms: progress, problems and prospects. Ann. Bot. 95, 45–90. doi: 10.1093/aob/mci003
Bennett, M. D., and Leitch, I. J. (2011). Nuclear DNA amounts in angiosperms: targets, trends and tomorrow. Ann. Bot. 107, 467–590. doi: 10.1093/aob/mcq258
Bennett, M. D., and Leitch, I. J. (2012). ). Plant C-Values Database (Release 6.0, Dec. 2012). Available: http://data.kew.org/cvalues/ [accessed April 10, 2014].
Berardini, T. Z., Reiser, L., Li, D., Mezheritsky, Y., Muller, R., Strait, E., et al. (2015). The arabidopsis information resource: making and mining the ‘Gold Standard’ annotated reference plant genome. Genesis 53, 474–485. doi: 10.1002/dvg.22877
Bertioli, D. J., Cannon, S. B., Froenicke, L., Huang, G., Farmer, A. D., Cannon, E. K. S., et al. (2016). The genome sequences of arachis duranensis and arachis ipaensis, the diploid ancestors of cultivated peanut. Nat. Genet. 48, 438–446. doi: 10.1038/ng.3517
Brottier, L., Chaintreuil, C., Simion, P., Scornavacca, C., Rivallan, R., Mournet, P., et al. (2018). A phylogenetic framework of the legume genus aeschynomene for comparative genetic analysis of the Nod-dependent and Nod-independent symbioses. BMC Plant Biol. 18:333. doi: 10.1186/s12870-018-1567-z
Bruneau, A., Mercure, M., Lewis, G. P., and Herendeen, P. S. (2008). Phylogenetic patterns and diversification in the caesalpinioid legumes this paper is one of a selection of papers published in the special issue on systematics research. Botany 86, 697–718. doi: 10.1139/B08-058
Camacho, C., Coulouris, G., Avagyan, V., Ma, N., Papadopoulos, J., Bealer, K., et al. (2009). BLAST+: architecture and applications. BMC Bioinformatics 10:421. doi: 10.1186/1471-2105-10-421
Cannon, S. B., McKain, M. R., Harkess, A., Nelson, M. N., Dash, S., Deyholos, M. K., et al. (2015). Multiple polyploidy events in the early radiation of nodulating and nonnodulating legumes. Mol. Biol. Evol. 32, 193–210. doi: 10.1093/molbev/msu296
Cardoso, D., de Queiroz, L. P., Pennington, R. T., de Lima, H. C., Fonty,É, Wojciechowski, M. F., et al. (2012). Revisiting the phylogeny of papilionoid legumes: new insights from comprehensively sampled early-branching lineages. Am. J. Bot. 99, 1991–2013. doi: 10.3732/ajb.1200380
Citerne, H. L., Luo, D., Pennington, R. T., Coen, E., and Cronk, Q. C. B. (2003). A phylogenomic investigation of CYCLOIDEA-Like TCP genes in the leguminosae. Plant Physiol. 131, 1042–1053. doi: 10.1104/pp.102.016311
Citerne, H. L., Pennington, R. T., and Cronk, Q. C. B. (2006). An apparent reversal in floral symmetry in the legume Cadia is a homeotic transformation. Proc. Natl. Acad. Sci. U.S.A. 103, 12017–12020. doi: 10.1073/pnas.0600986103
Cock, P. J. A., Antao, T., Chang, J. T., Chapman, B. A., Cox, C. J., Dalke, A., et al. (2009). Biopython: freely available python tools for computational molecular biology and bioinformatics. Bioinformatics 25, 1422–1423. doi: 10.1093/bioinformatics/btp163
Coskun, F., and Parks, C. R. (2009). A molecular phylogenetic study of red buds (Cercis L., fabaceae) based on its nrDNA sequences. Pak. J. Bot. 41, 1577–1586.
Cui, L., Wall, P. K., Leebens-Mack, J. H., Lindsay, B. G., Soltis, D. E., Doyle, J. J., et al. (2006). Widespread genome duplications throughout the history of flowering plants. Genome Res. 16, 738–749. doi: 10.1101/gr.4825606
Davis, C. C., Fritsch, P. W., Li, J., and Donoghue, M. J. (2002). Phylogeny and biogeography of Cercis (Fabaceae): evidence from nuclear ribosomal ITS and chloroplast ndhF sequences. Syst. Bot. 27, 289–302.
Dolezel, J., Bartoš, J., Voglmayr, H., and Greilhuber, J. (2003). Nuclear DNA content and genome size of trout and human. Cytometry 51A, 127–128. doi: 10.1002/cyto.a.10013
Doyle, J. J. (2012). “Polyploidy in Legumes,” in Polyploidy and Genome Evolution, eds P. S. Soltis and D. E. Soltis (Heidelberg: Springer), 147–180. doi: 10.1007/978-3-642-31442-1-9
Edgar, R. C. (2004). MUSCLE: multiple sequence alignment with high accuracy and high throughput. Nucleic Acids Res. 32, 1792–1797. doi: 10.1093/nar/gkh340
Enright, A. J., Van Dongen, S., and Ouzounis, C. A. (2002). An efficient algorithm for large-scale detection of protein families. Nucleic Acids Res. 30, 1575–1584. doi: 10.1093/nar/30.7.1575
Fang, L., Wang, Q., Hu, Y., Jia, Y., Chen, J., Liu, B., et al. (2017). Genomic analyses in cotton identify signatures of selection and loci associated with fiber quality and yield traits. Nat. Genet. 49, 1089–1098. doi: 10.1038/ng.3887
Felsenstein, J. (1980). PHYLIP. Available at: http://evolution.genetics.washington.edu/phylip.html
Flagel, L. E., Wendel, J. F., and Udall, J. A. (2012). Duplicate gene evolution, homoeologous recombination, and transcriptome characterization in allopolyploid cotton. BMC Genomics 13:302. doi: 10.1186/1471-2164-13-302
Goldblatt, P. (1981). Chromosome numbers in legumes II. Ann. Mo. Bot. Gard. 68, 551–557. doi: 10.2307/2398889
Griesmann, M., Chang, Y., Liu, X., Song, Y., Haberer, G., Crook, M. B., et al. (2018). Phylogenomics reveals multiple losses of nitrogen-fixing root nodule symbiosis. Science 361:eaat1743. doi: 10.1126/science.aat1743
Haug-Baltzell, A., Stephens, S. A., Davey, S., Scheidegger, C. E., and Lyons, E. (2017). SynMap2 and SynMap3D: web-based whole-genome synteny browsers. Bioinformatics 33, 2197–2198. doi: 10.1093/bioinformatics/btx144
Huerta-Cepas, J., Dopazo, H., Dopazo, J., and Gabaldón, T. (2007). The human phylome. Genome Biol. 8:R109. doi: 10.1186/gb-2007-8-6-r109
Huerta-Cepas, J., Dopazo, J., and Gabaldón, T. (2010). ETE: a python environment for tree exploration. BMC Bioinformatics 11:24. doi: 10.1186/1471-2105-11-24
Huerta-Cepas, J., Serra, F., and Bork, P. (2016). ETE 3: reconstruction, analysis, and visualization of phylogenomic data. Mol. Biol. Evol. 33, 1635–1638. doi: 10.1093/molbev/msw046
International Peach Genome Initiative[IPGI] (2013). The high-quality draft genome of peach (Prunus persica) identifies unique patterns of genetic diversity, domestication and genome evolution. Nat. Genet. 45, 487–494. doi: 10.1038/ng.2586
Jaillon, O., Aury, J.-M., Noel, B., Policriti, A., Clepet, C., Casagrande, A., et al. (2007). The grapevine genome sequence suggests ancestral hexaploidization in major angiosperm phyla. Nature 449, 463–467. doi: 10.1038/nature06148
Jiao, Y., Leebens-Mack, J., Ayyampalayam, S., Bowers, J. E., McKain, M. R., McNeal, J., et al. (2012). A genome triplication associated with early diversification of the core eudicots. Genome Biol. 13:R3. doi: 10.1186/gb-2012-13-1-r3
Kang, Y. J., Kim, S. K., Kim, M. Y., Lestari, P., Kim, K. H., Ha, B.-K., et al. (2014). Genome sequence of mungbean and insights into evolution within Vigna species. Nat. Commun. 5:5443. doi: 10.1038/ncomms6443
Larkin, M. A., Blackshields, G., Brown, N. P., Chenna, R., McGettigan, P. A., McWilliam, H., et al. (2007). Clustal W and Clustal X version 2.0. Bioinformatics 23, 2947–2948. doi: 10.1093/bioinformatics/btm404
Lavin, M., Herendeen, P. S., and Wojciechowski, M. F. (2005). Evolutionary rates analysis of leguminosae implicates a rapid diversification of lineages during the tertiary. Syst. Biol. 54, 575–594. doi: 10.1080/10635150590947131
Legume Phylogeny Working Group, Azani, N., Babineau, M., Bailey, C. D., Banks, H., Barbosa, A., et al. (2017). A new subfamily classification of the leguminosae based on a taxonomically comprehensive phylogeny – the legume phylogeny working group (LPWG). Taxon 66, 44–77. doi: 10.12705/661.3
Leitch, I. J., Hanson, L., Lim, K. Y., Kovarik, A., Chase, M. W., Clarkson, J. J., et al. (2008). The ups and downs of genome size evolution in polyploid species of Nicotiana (Solanaceae). Ann. Bot. 101, 805–814. doi: 10.1093/aob/mcm326
Lewis, G. P., Schrire, B., Mackinder, B., and Lock, M. (eds.) (2005). Legumes of the World, 1st Edn. Richmond: The Royal Botanic Gardens, Kew.
Lynch, M., and Conery, J. S. (2000). The evolutionary fate and consequences of duplicate genes. Science 290, 1151–1155. doi: 10.1126/science.290.5494.1151
Mistry, J., Finn, R. D., Eddy, S. R., Bateman, A., and Punta, M. (2013). Challenges in homology search: HMMER3 and convergent evolution of coiled-coil regions. Nucleic Acids Res. 41, e121–e121. doi: 10.1093/nar/gkt263
Nei, M., and Gojobori, T. (1986). Simple methods for estimating the numbers of synonymous and nonsynonymous nucleotide substitutions. Mol. Biol. Evol. 3, 418–426. doi: 10.1093/oxfordjournals.molbev.a040410
Paterson, A. H., Wendel, J. F., Gundlach, H., Guo, H., Jenkins, J., Jin, D., et al. (2012). Repeated polyploidization of gossypium genomes and the evolution of spinnable cotton fibres. Nature 492, 423–427. doi: 10.1038/nature11798
Phytozome 12 (2018). Cucumis Sativus v1.0 (Cucumber). Available at: https://phytozome.jgi.doe.gov/pz/portal.html#!info?alias=Org_Csativus [accessed December 14, 2018].
Ren, L., Huang, W., and Cannon, S. B. (2019). Reconstruction of ancestral genome reveals chromosome evolution history for selected legume species. New Phytol. (in press). doi: 10.1111/nph.15770
Rice, A., Glick, L., Abadi, S., Einhorn, M., Kopelman, N. M., Salman-Minkov, A., et al. (2015). The chromosome counts database (CCDB) – a community resource of plant chromosome numbers. New Phytol. 206, 19–26. doi: 10.1111/nph.13191
Roberts, D. J., and Werner, D. J. (2016). Genome size and ploidy levels of cercis (Redbud) species, cultivars, and botanical varieties. HortScience 51, 330–333. doi: 10.21273/HORTSCI.51.4.330
Sato, S., Nakamura, Y., Kaneko, T., Asamizu, E., Kato, T., Nakao, M., et al. (2008). Genome structure of the legume, lotus japonicus. DNA Res. 15, 227–239. doi: 10.1093/dnares/dsn008
Schmutz, J., Cannon, S. B., Schlueter, J., Ma, J., Mitros, T., Nelson, W., et al. (2010). Genome sequence of the palaeopolyploid soybean. Nature 463, 178–183. doi: 10.1038/nature08670
Schmutz, J., McClean, P. E., Mamidi, S., Wu, G. A., Cannon, S. B., Grimwood, J., et al. (2014). A reference genome for common bean and genome-wide analysis of dual domestications. Nat. Genet. 46, 707–713. doi: 10.1038/ng.3008
Sinou, C., Forest, F., Lewis, G. P., and Bruneau, A. (2009). The genus Bauhinia s.l. (Leguminosae): a phylogeny based on the plastid trn L– trn F region. Botany 87, 947–960. doi: 10.1139/B09-065
Stamatakis, A., Hoover, P., and Rougemont, J. (2008). A rapid bootstrap algorithm for the RAxML web servers. Syst. Biol. 57, 758–771. doi: 10.1080/10635150802429642
Suyama, M., Torrents, D., and Bork, P. (2006). PAL2NAL: robust conversion of protein sequence alignments into the corresponding codon alignments. Nucleic Acids Res. 34, W609–W612. doi: 10.1093/nar/gkl315
Tang, H., and Chapman, B. A. (2018). My Collection of Light Bioinformatics Analysis Pipelines for Specific Tasks: Tanghaibao/bio-pipeline. Available at: https://github.com/tanghaibao/bio-pipeline [accessed November 15, 2018].
Tang, H., Krishnakumar, V., Bidwell, S., Rosen, B., Chan, A., Zhou, S., et al. (2014). An improved genome release (version Mt4.0) for the model legume Medicago truncatula. BMC Genomics 15:312. doi: 10.1186/1471-2164-15-312
Tang, H., Lyons, E., Pedersen, B., Schnable, J. C., Paterson, A. H., and Freeling, M. (2011). Screening synteny blocks in pairwise genome comparisons through integer programming. BMC Bioinformatics 12:102. doi: 10.1186/1471-2105-12-102
The International Peach Genome Initiative, Verde, I., Abbott, A. G., Scalabrin, S., Jung, S., Shu, S., et al. (2013). The high-quality draft genome of peach (Prunus persica) identifies unique patterns of genetic diversity, domestication and genome evolution. Nat. Genet. 45, 487–494. doi: 10.1038/ng.2586
The Tomato Genome Consortium (2012). The tomato genome sequence provides insights into fleshy fruit evolution. Nature 485, 635–641. doi: 10.1038/nature11119
Town, C. D., Cheung, F., Maiti, R., Crabtree, J., Haas, B. J., Wortman, J. R., et al. (2006). Comparative Genomics of brassica oleracea and arabidopsis thaliana reveal gene loss, fragmentation, and dispersal after polyploidy. Plant Cell 18, 1348–1359. doi: 10.1105/tpc.106.041665
van Velzen, R., Holmer, R., Bu, F., Rutten, L., Zeijl, A., van Liu, W., et al. (2018). Comparative genomics of the nonlegume parasponia reveals insights into evolution of nitrogen-fixing rhizobium symbioses. Proc. Natl. Acad. Sci. U.S.A. 115, E4700–E4709. doi: 10.1073/pnas.1721395115
Varshney, R. K., Chen, W., Li, Y., Bharti, A. K., Saxena, R. K., Schlueter, J. A., et al. (2012). Draft genome sequence of pigeonpea (Cajanus cajan), an orphan legume crop of resource-poor farmers. Nat. Biotechnol. 30, 83–89. doi: 10.1038/nbt.2022
Varshney, R. K., Song, C., Saxena, R. K., Azam, S., Yu, S., Sharpe, A. G., et al. (2013). Draft genome sequence of chickpea (Cicer arietinum) provides a resource for trait improvement. Nat. Biotechnol. 31, 240–246. doi: 10.1038/nbt.2491
Wang, Y.-H., Wicke, S., Wang, H., Jin, J.-J., Chen, S.-Y., Zhang, S.-D., et al. (2018). Plastid genome evolution in the early-diverging legume subfamily cercidoideae (Fabaceae). Front. Plant Sci. 9:138. doi: 10.3389/fpls.2018.00138
Wendel, J. F. (1989). New world tetraploid cottons contain old world cytoplasm. Proc. Natl. Acad. Sci. U.S.A. 86, 4132–4136. doi: 10.1073/pnas.86.11.4132
Yang, Z. (2007). PAML 4: phylogenetic analysis by maximum likelihood. Mol. Biol. Evol. 24, 1586–1591. doi: 10.1093/molbev/msm088
Young, N. D., Debellé, F., Oldroyd, G. E. D., Geurts, R., Cannon, S. B., Udvardi, M. K., et al. (2011). The medicago genome provides insight into the evolution of rhizobial symbioses. Nature 480, 520–524. doi: 10.1038/nature10625
Keywords: Cercis, polyploidy, legume family, chromosome evolution, whole-genome duplication, ancestral genome
Citation: Stai JS, Yadav A, Sinou C, Bruneau A, Doyle JJ, Fernández-Baca D and Cannon SB (2019) Cercis: A Non-polyploid Genomic Relic Within the Generally Polyploid Legume Family. Front. Plant Sci. 10:345. doi: 10.3389/fpls.2019.00345
Received: 21 December 2018; Accepted: 05 March 2019;
Published: 11 April 2019.
Edited by:
Marcial Escudero, Universidad de Sevilla, SpainReviewed by:
Martin A. Lysak, Masaryk University, CzechiaJean-Francois Arrighi, Institut de Recherche pour le Développement (IRD), France
Andre Chanderbali, University of Florida, United States
Copyright © 2019 Stai, Yadav, Sinou, Bruneau, Doyle, Fernández-Baca and Cannon. This is an open-access article distributed under the terms of the Creative Commons Attribution License (CC BY). The use, distribution or reproduction in other forums is permitted, provided the original author(s) and the copyright owner(s) are credited and that the original publication in this journal is cited, in accordance with accepted academic practice. No use, distribution or reproduction is permitted which does not comply with these terms.
*Correspondence: Steven B. Cannon, c3RldmVuLmNhbm5vbkBhcnMudXNkYS5nb3Y=
†These authors have contributed equally to this work