 Yingying Yang1,2Shiwu Gao1,2Yong Jiang3Zhaoli Lin1,2Jun Luo1,2
 Mingjie Li2Jinlong Guo1,2Yachun Su1,2
 Liping Xu1,2*
 Youxiong Que1,2*
- 1Key Laboratory of Sugarcane Biology and Genetic Breeding, Ministry of Agriculture, Fujian Agriculture and Forestry University, Fuzhou, China
- 2College of Crop Science, Fujian Agriculture and Forestry University, Fuzhou, China
- 3College of Computer and Information Sciences, Fujian Agriculture and Forestry University, Fuzhou, China
Nitrogen (N) is very important for sugarcane yield improvement, but the excessive application of N fertilizer brings about N pollution and a cost increase. Through distinguishing the difference of nitrogen use efficiency (NUE), we can reasonably apply N fertilizer according to the NUE characteristics of sugarcane varieties, and thus reduce N loss and maintain high yield. The present study showed the pot experiment results of identifying NUE types of nine main sugarcane varieties in the main sugarcane producing areas of China under controlled conditions, and identified the key physiological and agronomic indictors which can help to determine the NUE types of sugarcane. The test clones were exposed to varying levels of N fertilizer and 15 parameters that are likely to impact NUE were measured. The key results are (1) Sugarcane variety ROC22 has the high plant dry weight (PDW) and NUE among nine varieties under different N rates, it can take advantages under low N supply (225 kg/hm2 urea), and less N fertilizer can be applied properly in production. (2) Varieties of GT32 was good performing genotype for PDW and NUE under low N supply (225 kg/hm2 urea), GT42 was more suitable for moderate N environment (450 kg/hm2 urea), while YT94-128 was at middle N and high N supply (450–675 kg/hm2 urea). (3) Late stage of shoot elongation is suitable for differentiating sugarcane clones for NUE. (4) Leaf glutamine synthetase activity is the most reliable predictor of NUE in sugarcane. The result of pot experiment is sufficient to differentiate clonal variation for NUE in sugarcane as it reflects field experimental results. This study can set up a basis for identification the NUE types of sugarcane varieties and the development of reasonable N fertilizer application.
Introduction
Sugarcane is the most important sugar crop, accounting for approximately 80% of sugar production in the world (Islam et al., 2018; Sharma and Chandra, 2018) and more than 90% of that in China (Li et al., 2016). Nitrogen (N) is a key restrictive factor for continuous sugarcane output. A proper amount of N-fertilizer can remarkably increase tillering and thus results in an early population with high yield, which can increase output (Gopalasundaram et al., 2012). Insufficient or ill-timed supply of N-fertilizer applied to sugarcane would result in poor growth, such as narrow leaves, thin stems, and short internodes (Bell et al., 2014), while excessive application of synthetic N-fertilizer leads to a cost increase, acidic soil, eutrophic water and non-point pollution (Ju et al., 2009; Chen et al., 2014) and finally decreases the sugar content (Muchow et al., 1996), especially at the sugar accumulation stage. This phenomenon is quite common in the two sugarcane producing countries, China and India, due to the continuous planting of sugarcane for many years, which resulted in a low output-input ratio, i.e., only 0.1 for China and 0.3 for India based on the International Fertilizer Industry Association Assessment of fertilizer use by sugar crops at the global level 2007/2008 (Robinson et al., 2011). In China, to help planters to obtain higher production, approximately 500–700 kg/hm2 of N fertilizer per single crop season has been applied, which is 2–3 times as much as that in Brazil and Australia (Yang et al., 2014; Li et al., 2015). N fertilizer recovery in sugarcane ranges from 20 to 40% (Meyer et al., 2007; Kingston et al., 2008; Franco et al., 2010), which is relatively low, and most of N is lost from soil (Chapman et al., 1994). The nitrogen use efficiency (NUE, crop production/fertilizer N supplied) of sugarcane genotypes varied greatly, and high NUE varieties are an important issue for sugarcane industry. One avenue helps to alleviate the excessive use of N is to determine the NUE of crops based on the various absorption and utilization characteristics of N-fertilizer and then the appropriate amount of N-fertilizer was applied (Hirel et al., 2001; Snyman et al., 2015). Therefore, the identification of NUE types of crops for rational N fertilizer application and how to identify a variety with high NUE under low N conditions are of great significance for reducing N pollution.
It is well-known that the N demand depended on the size of the crop and NUE (Ladha et al., 2005). The NUE level of the crop variety determinates the degree of N uptake and utilization. Matching N supply according to crop N demand is an important way to ensure crop yield and reduces the amount of N fertilizer applied (Bell et al., 2014). Many scholars had conducted researches on the NUE characteristics of crop varieties, and the varieties with higher NUE under different N condition were screened out. Cohan et al. (2018) assessed the potato cultivars effect on NUE components to provide farmers better advice on N fertilizer application rate in France. Cong et al. (2017) investigated the effects of different N fertilizer application on N use rate, grain yield and quality in different rice varieties, and found that OM052 was a variety with high N agronomic efficiency and yield. There were also similar reports in sugarcane. According to the kinetic indicators of N-uptake by different genotypes of sugarcane plantlets under different N-content solutions, high or low NUE sugarcane varieties were selected (Hajari et al., 2014). Robinson et al. demonstrated in their study that Q165A was good performing genotypes for biomass and iNUE (biomass produced per unit tissure N) at high N and low N solutions (Robinson et al., 2007). Both reports focused on sugarcane plantlet cultured in water. In order to get closer to production practice, we found out the varieties with higher NUE and plant dry weight (PDW) under low N conditions from main varieties planted in large areas at present China, and a certain/rational amount of N fertilizer was applied to achieve the purpose of maintaining crop yield and reducing N pollution.
There are large differences in NUE among various crops and varieties of the same crop, and the differences are closely related to the ability of N assimilation in plants (Ju et al., 2015; Wang et al., 2015; Chen et al., 2016). Normally, two forms of N, i.e., nitrate-N and ammonium-N, can be absorbed and assimilated by plants. After uptake, nitrate-N is catalyzed and transformed by nitrate reductase (NR) and nitrite reductase (NIR) to ammonium salt and then to amino acids. There are two main pathways for ammonium-N to be transformed into amino acids, one of which involves glutamate dehydrogenase (GDH), and the other involves glutamine synthetase (GS) and glutamate synthase (GOGAT) to produce glutamate (Lam et al., 1996). Several key catalytic enzymes of N assimilation are of great importance in the N use of plants. The differences in the key catalytic enzymes among various crops or varieties of the same crop affect N assimilation (Jawad et al., 2017). Key enzyme activities associated with N assimilation are important physiological indicators which have been used to explore NUE in many studies (Oliveira et al., 2013; Jawad et al., 2017). QTLs for NR, GS activity, grain N content and grain yield were co-localizations of field screening maize population in N assimilation enzymes activities, plant nitrate concentration and agronomic indictors, and locus on chromosome 5 was found to be a good candidate gene for explaining yield variations (Hirel et al., 2001). This illustrated that the reaction catalyzed by GS represented key element controlling NUE in maize. In barley, the increasing level of GS, GOGAT, and GDH activity in a plant with high NUE was higher than that with a low NUE (Jawad et al., 2017). Oliveira et al. (2013) found that GS activity of maize plantlets was a better indicator than NR activity for NUE. The activities of GS1 and GS2 could be a potential marker to predict and select NUE in wheat varieties (Zhang Z.Y. et al., 2017). Foulkes et al. (2009) suggested that leaf GS, leaf photosynthetic rate and stem N storage contributed to the variation in NUE among wheat varieties. GS activity could be an effective indictor for screening rice varieties with higher NUE (Rajesh et al., 2017). In addition, a strong relationship was obtained between leaf GS activity and total N content, but GDH activity had no significant correlation with the total N content in maize (Hirel et al., 2005).
In sugarcane, regarding the relationship between key enzyme activities of N metabolism and NUE, except for Robinson et al. (2007), who investigated the relationship between GS activity and NUE in sugarcane plantlets under water culture and found no correlation between GS activity in the leaf/root and NUE, a little of attention has been paid to the key enzyme activity of N assimilation to evaluate the NUE of sugarcane. Li selected sugarcane varieties plantlets with under low N treatment in sand culture, which suggested that above-ground biomass and the photosynthetic rate could be used as screening indicators for low-N tolerance at the early stage of sugarcane growth (Li, 2011).
In the present study, using pot and field experiments, we focused on the main sugarcane varieties with different NUEs in the present China, and investigated their physiological indicators and agronomic traits of aboveground and belowground at different synthetic N-fertilizer application rates. The objectives of this work were to (1) Distinguish the NUE and PDW difference of nine widely planted sugarcane cultivars under different dosage of N-fertilizer in China. (2) According to the NUE and PDW characteristics of varieties, suggestions on rational N fertilizer application rate were provided. (3) Determine the suitable growth stage for the investigation of parameters to predict NUE in sugarcane. (4) Evaluate indicators for predicting NUE of sugarcane.
Materials and Methods
Materials
The representative sugarcane varieties ROC16 (Yang et al., 2006), ROC22, GT32, FN41, GT42, YT94-128, LC05-136, NCo376 (Hajari et al., 2014) and Badila, with different NUEs, were selected. All of these varieties were provided by the Key Laboratory of Sugarcane Biology and Genetic Breeding, Ministry of Agriculture, Fujian Agriculture and Forestry University.
Pot Experiment
The outdoor pot experiment was conducted from March 2016 to January 2017 at Fujian Agriculture and Forestry University, Fuzhou, China. The pots, which were 0.40 m in both diameter and depth, with eight 1.0-cm-diameter holes at the base, were filled with 10 kg of soil. The soils foundation fertility was assayed according to the method of Zhao et al. (2013). The pH was 5.0, the organic matter content was 7.09 g/kg, alkali-hydrolyzable N was 0.04 g/kg, effective phosphorus was 0.02 g/kg, rapidly available potassium was 0.10 g/kg, total N was 0.38 g/kg, total phosphorus was 0.28 g/kg and total potassium was 20.1 g/kg.
The experimental design was a double-factor completely randomized design. Factor A was sugarcane varieties (ROC16, ROC22, GT32, FN41, GT42, YT94-128, LC05-136, NCo376, and Badila). Factor B was N treatments (Zhao et al., 2014; Li et al., 2015): N1 was 225 kg/hm2 urea, N2 was 450 kg/hm2 urea, N3 was 675 kg/hm2 urea, and no N fertilizer (0 kg/hm2 urea) was established to calculate NUE of N1, N2 and N3 treatments, with urea as the N source. The experiment consisted of 36 treatments and 12 pots per treatment. Others fertilizers (besides N fertilizer) were applied similarly to each pot. Fertilizer: urea (total N ≥ 46.4%, China), calcium magnesium phosphate fertilizer (P2O5 ≥ 12.0%, China) at 925 kg/ha, potassium chloride (K2O ≥ 62.0%, Russia) at 335 kg/ha. According to the field plantlet number (90,000 plantlets/ha) and fertilizer requirement, the dose of urea of the four N treatments was 0.00 g for N0, 2.50 g for N1, 5.00 g for N2 and 7.50 g for N3 in each pot. A total of 30% of the N fertilizer was applied as basal fertilizer, and the remaining 70% was applied as a topdressing in late July 2016. The dose of calcium-magnesia phosphate fertilizer and potassium fertilizer was 10.28 and 3.72 g per pot, applied as basal fertilizer.
The relatively consistent sugarcane plantlets at three-leaf stage were transplanted manually on 20 April 2016, and one plantlet was planted in each pot. All planting pots were poured the same amount of water, and were well-watered during the experiment. The daily cultivation management of each pot was the same.
When we sampled the roots, we first filled the whole cultivation pot with water and soaked for 6 h, then carefully removed the whole plant along with the roots, and finally put it in a large tub and rinsed carefully until the root system was washed out. Three biological repeats were used for measurements at each indictor, and each plant is as a biological repeat.
Field Trial Design
The field experiment was carried out from March 2017 to January 2018 in the experimental field of Fujian Agriculture and Forestry University, Fuzhou, China. The experimental design was a split plot and consisted of 36 treatments. The main plot was divided into four N treatments: N1 was 225 kg/hm2 urea, N2 was 450 kg/hm2 urea, N3 was 675 kg/hm2 urea, and no N fertilizer (0 kg/hm2 urea) was established to calculate NUE, with urea (total N ≥ 46.4%, China) as the N source. The subplots corresponded to nine sugarcane varieties, namely, ROC16, ROC22, GT32, FN41, GT42, YT94-128, LC05-136, NCo376, and Badila. Each treatment had four 8 m-long rows with a row spacing of 1.3 m, with three replications. The field plantlet number was 90,000 per hectare. Determination of soil basic fertility used the method of Zhao et al. (2013), the soil pH was 5.6, the organic matter content was 14.2 g/kg, alkali-hydrolyzable N was 0.06 g/kg, effective phosphorus was 0.04 g/kg, rapidly available potassium was 0.06 g/kg, total N was 0.80 g/kg, total phosphorus was 0.69 g/kg and total potassium was 24.8 g/kg. The fertilizer application amount and application method of N, calcium-magnesia phosphate and potassium were the same as in the pot experiment. Sugarcane was planted manually on 7 March 2017, and the cultivation management was similar to the field production of sugarcane.
Measurements
The plant height (H), stalk diameter (D), plant fresh weight and physiological indexes were measured in early July (the early elongation stage, Stage 1) and early October (the late elongation stage, Stage 2) of 2016 in pot experiment, and physiological indicators include the activities of GS, GDH and GOGAT, soluble protein content (SPC), net photosynthetic rate (Pn), leaf chlorophyll relative content (single-photon avalanche, SPAD), Chlorophyll fluorescence.
The activity of GS, SPAD values and Plant fresh weight were measured at Stage 2 of 2017 in field trial. N contents were measured in Stage 1, Stage 2 and early January of second year (the technical maturation stage, Stage 3) in pot experiment, and Stage 3 in field trial.
The middle part of the first fully expanded leaf was taken as the measuring site for photosynthesis, fluorescence parameters, SPAD values, activities of GS, GDH, GOGAT, SPC and expression analysis of GS family genes by qRT-PCR. After measuring the photosynthesis and fluorescence parameters of leaf, the middle part of leaf was taken immediately, washed thoroughly with distilled water, and divided into two parts. One part of leaf measured the key enzymes activities in N metabolism. The other part of leaf was frozen immediately in liquid nitrogen for expression analysis of GS family genes by qRT-PCR.
Photosynthesis Indices
Net photosynthetic rate (Pn) was measured using an LI-6400XT portable photosynthesis system (Li-COR, Lincoln, NE, United States) between 8:00 and 11:00 a.m. under cloudless sky. When measuring leaf Pn, blue light of 1,500 μmol m-2 s-1 was provided. Relative humidity was adjusted to 70%. The leaf chamber CO2 concentration was set to 400 ± 5 μl L-1, and the leaf temperature was set to 29 ± 2°C.
SPAD Values
According to a previous experimental method (Dinh et al., 2017), SPAD values was estimated with a SPAD-502 Plus (Konica Minolta Sensing, Inc., Osaka, Japan). After photosynthesis measurements, SPAD values were recorded at the same position.
Chlorophyll Fluorescence
According to the experimental method of Shu et al. (2016), chlorophyll fluorescence was measured using an IMAGING-PAM fluorometer (Walz, Effeltrich, Germany) on individual leaves, previously used to measure SPAD values, following a dark adaptation period of 20 min. The Fv/Fm of chlorophyll fluorescence (the maximum quantum yield of PSII, which represents the ratio between variable and maximum fluorescences, Fv/Fm) was calculated using the fluorometer’s software. The measured location of Chlorophyll fluorescence was the same as that of photosynthesis indices and SPAD values.
Key Enzymes Activities of N Assimilation
The middle part of the first fully expanded leaf and fibrous root of each sampled plant was cut to determine key enzymes activities of N assimilation in the pot and field experiments. According to the method of Wang et al. (2014), GS activity was measured. One unit of GS activity (U) was defined as a 0.01 change in A540 per minute per ml reaction system. GOGAT and GDH activities were measured according to the experimental method of Groat and Vance (1981). One unit of GOGAT was expressed as the amount of enzyme that catalyzed the oxidation of 1 nmol NADH per min. GDH activity was determined by recording the reduction of NAD (deaminating GDH activity, NAD-GDH) or the oxidation of NADH (aminating GDH activity, NADH-GDH). One unit of GDH was calculated in units of nmol of NADH oxidized/NAD reduced per minute. SPC of the leaf and root was measured following the experimental method of Laukkanen and Sarjala (1997).
Expression Analysis of Five GS Family Genes in Sugarcane by qRT-PCR
Total RNA of each sample was extracted with TRIzol reagent (Invitrogen, Shanghai, China), and RNA quality was examined using a NanoDrop (Thermo Fisher Scientific, Inc.) and an Agilent 2100. Bioanalyzer (Agilent Technologies, Santa Clara, CA, United States). According to the research of Nogueira et al. (2005), GS1.a, GS1.b, GS1.c, GS2, and GSI were selected and their expressions were analyzed by qRT-PCR using SYBR Green staining. Quantitative specific primer of GS1.a, GS1.b, and GS1.c were reference to Nogueira et al. (2005), and primers of GS2 and GSI were designed using NCBI primer designing tool1. The sequences of primers are shown in Supplementary Table S1. The glyceraldehyde-3-phosphate dehydrogenase gene (GAPDH, GenBank Accession No. CA254672) was used as the internal reference gene for qRT-PCR (Ling et al., 2014). Three biological replicates were performed for each treatment. 2-ΔΔCt was used for the calculation of qRT-PCR data (Livak and Schmittgen, 2001).
Determination of N Content
Four individual parts of the plant, leaf, leaf sheaths, stem and root, were sampled and rinsed with pure water. All plant samples were dried in an oven for 3 h at 105°C and then for another 72 h at 80°C. PDW was calculated as the sum of the leaves, leaf sheaths, stem and root dry weight. The samples were finely ground with a mill (Shanghai Jingxin, Co., Ltd., China) and were sieved through a 0.25-mm mesh. According to the ratio of the dry weight of each individual part to PDW, 0.5-g samples were collected and then digested with H2SO4-H2O2 at 260–270°C for total N measurement. According to the Kjeldahl method reported by Cao et al. (2017), plant N content (PNC) was determined by a Kjeltec 8200 type automatic azotometer (Foss, Denmark). Plant N accumulation (PNA) was calculated as:
Plant N accumulation (PNA, g/plant) = PNC × PDW (Zhang C. et al., 2017)
NUE (gDWg-1N) = [shoot DW (g) of fertilized treatment-shoot DW (g) of 0 N treatment] ÷ amount (g) of N applied (Zhao et al., 2014)
Decline ratio of NUE (DRNUE) was calculated as:
DRNUE = (NUE of N2 treatment – NUE of fertilized treatment) ÷NUE of N2 treatment.
Statistical Analysis
All statistics, including analysis of variance (ANOVA), significant differences, principal component analysis (PCA), correlation analysis and cluster analysis, were performed using the SPSS 19.0 system (SPSS, Inc., United States). The treatment means were separated using Duncan’s significant difference test, with P < 0.05 as the significance level.
Results
Effects on the Activity of Key Enzymes Involved in N Metabolism
The Early Elongation Stage (Stage 1)
It is indicated in Figure 1, the activities of GS, GOGAT, GDH, and SPC in leaves of the same sugarcane variety at different N application rates were significantly higher than those of roots at Stage 1 (P < 0.05). There were also obvious differences in the activities of different enzymes in response to N application. Compared with N2, N1 had the greatest effect on the GOGAT activity of roots and had minimal effect on the GS enzyme activity of roots, while leaves were more sensitive to low N condition than roots (Table 1).
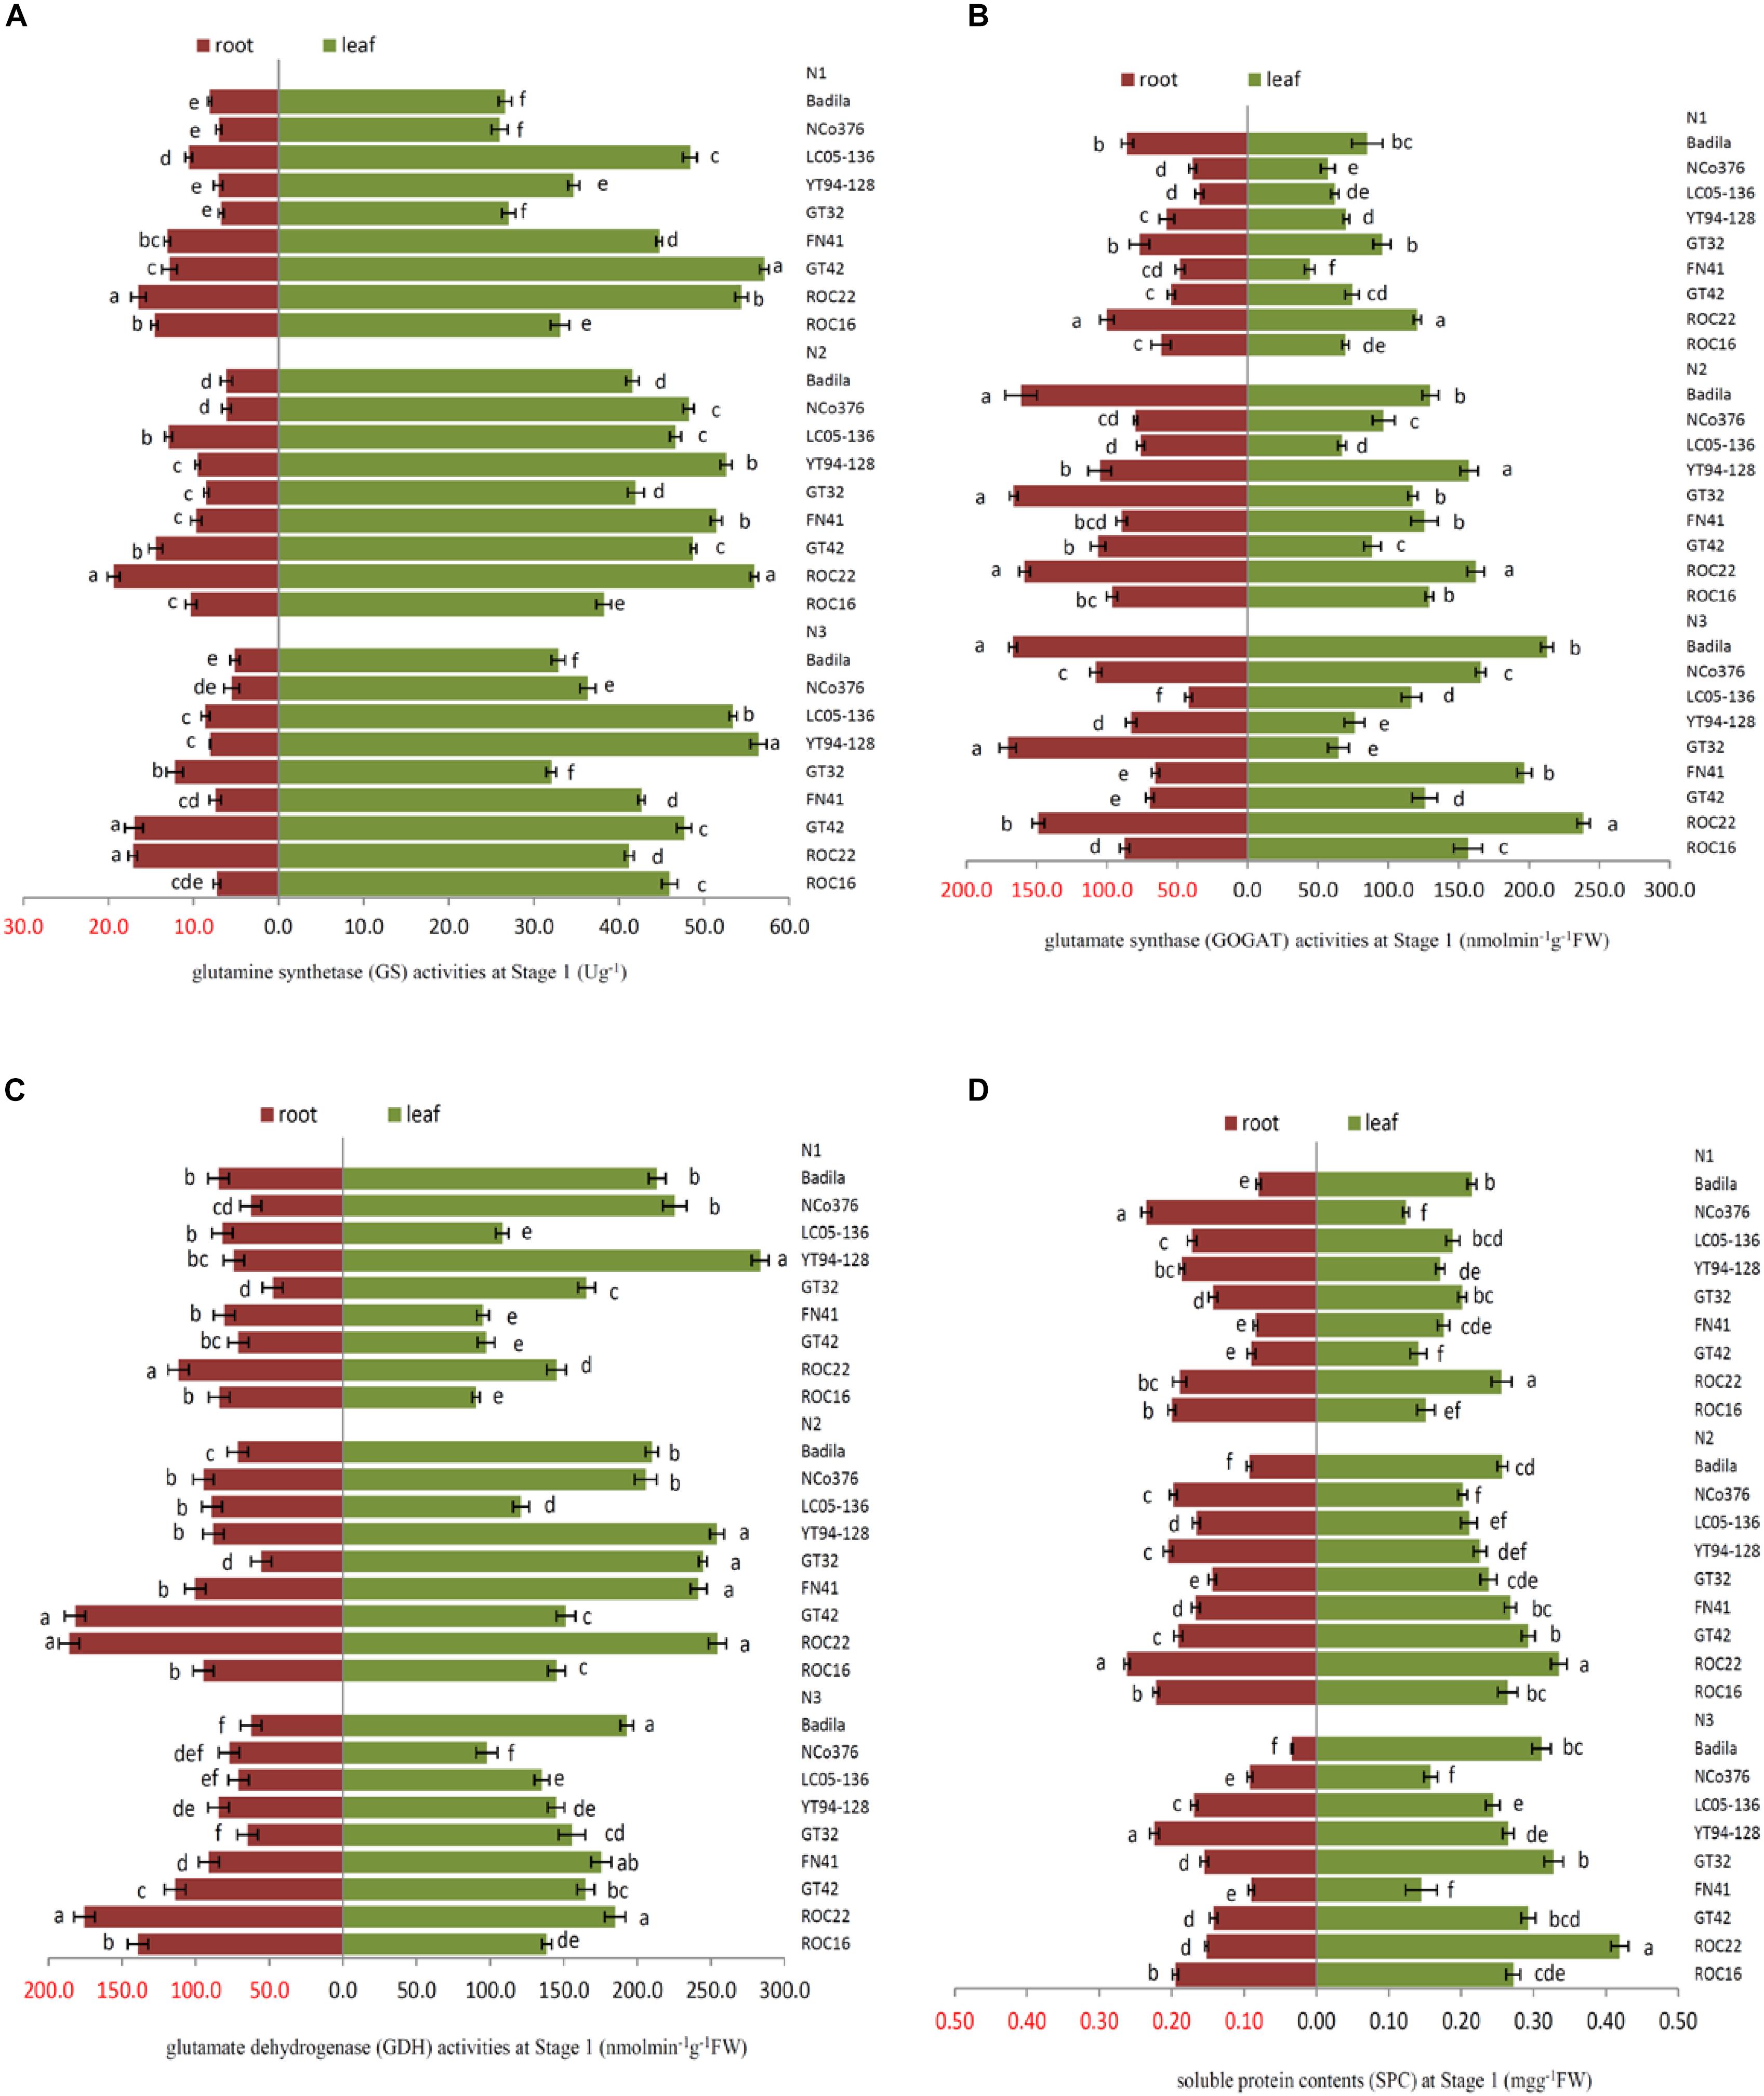
Figure 1. Effects of different N application rates on N assimilation enzyme activities at Stage 1 in 2016. (A) GS (glutamine synthetase activity), (B) GOGAT (glutamate synthase activity), (C) GDH (glutamate dehydrogenase activity), (D) SPC (content of soluble protein). N1 was 225 kg/hm2 urea, N2 was 450 kg/hm2 urea, N3 was 675 kg/hm2 urea. Stage 1, the early elongation stage. Different lowercase letters represent significant differences between the different varieties with respect to the same N application rates (P < 0.05).
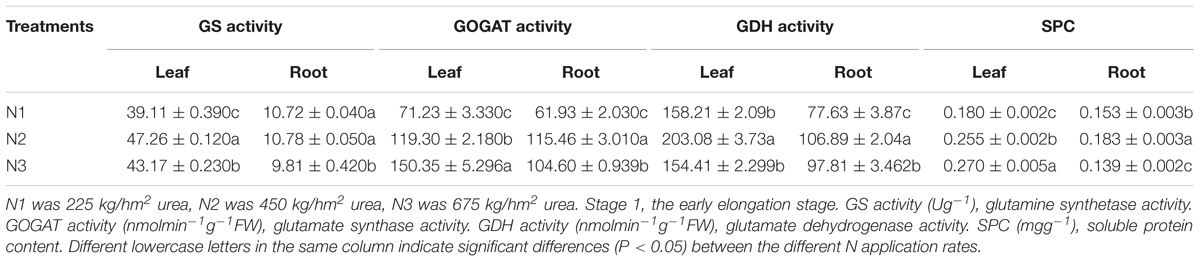
Table 1. Effects of different N application rates on GS, GOGAT, GDH, and SPC of sugarcane at Stage 1 in 2016.
In Figure 1, there were significant differences among the sugarcane varieties in response to N application. The SPC in the root of NCo 376 was significantly higher than that in the other varieties under N1 (Figure 1D). Compared with N2, YT94-128, and GT42 had the highest decrease in GS and GDH activities in roots among the nine varieties under N1, which decreased by 25.52% and 60.89%, respectively (Figures 1A,C). This indicates that the N assimilation capacity of YT94-128 and GT42 decreased significantly when the supply of N fertilizer was low. The GS activity of leaves and the SPC of the root in ROC22 under N2 were significantly higher than those in the other varieties (Figures 1A,D). The GS activity of leaves and SPC of roots in YT94-128 were significantly higher than those in the other varieties under N3 (Figures 1A,D). Compared with N2, LC05-136 had a largest decrease in the GS and GOGAT activities of roots under N3 among the nine varieties, which decreased by 33.49% and 44.87%, respectively (Figures 1A,B). It seemed that when LC05-136 was supplied with a large amount of N fertilizer, the activities of key enzymes involved in N metabolism decreased, which resulted in a decreased N assimilation capacity.
The Late Elongation Stage (Stage 2)
In Table 2, compared with N2, the GS, GOGAT, GDH activities and SPC of leaves and roots decreased significantly under low N application rate. The SPC of leaves and roots under N2 was obviously higher than that of the other treatments. Compared with N2, the activities of GS, GOGAT, GDH, and SPC under N3 were lower in the leaves. Leaves and roots under N2 had higher key enzyme activities of N metabolism and a powerful N assimilation capacity than that of N1 and N3.
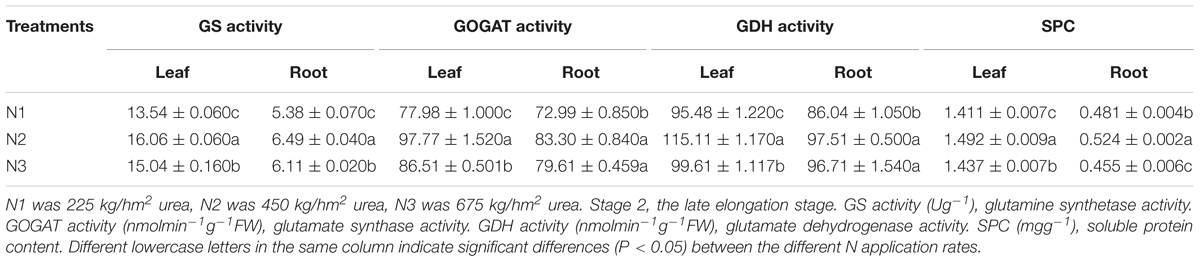
Table 2. Effects of different N application rates on GS, GOGAT, GDH and SPC of sugarcane at Stage 2 in 2016.
Under N1, the SPC of leaves of FN41, ROC16 was significantly lower than that of other varieties (Figure 2D). Compared with N2, under N1, ROC16 exhibited the largest decline in the GS activity of roots, which decreased by 35.76% (Figure 2A), it suggested that the N assimilation capacity of ROC16 was low under low N. The GS and GOGAT activities of leaves of ROC22 were significantly higher than those of other varieties under N1, N2, and N3 (Figures 2A,B), suggesting a higher N assimilation ability. In Figure 2D, under N3, the SPC of leaves of YT94-128 and ROC22 was significantly higher than that of other varieties. The SPC of leaves and roots of FN41 and LC05-136 was significantly lower than that of other varieties. Compared with N2, LC05-136 and FN41 under N3 showed the largest reduction of GS and GOGAT activities in the leaf among the nine varieties, i.e., decreases by 27.53% and 32.60%, respectively (Figures 2A,B). The varieties with the largest reduction in GOGAT and GDH activities in roots under N3 were NCo376 and LC05-136, i.e., respective decreases of 25.06% and 29.21% (Figures 2B,C). These results suggest that the N assimilation capacity of LC05-136, FN41, and NCo376 decreased under higher N application.
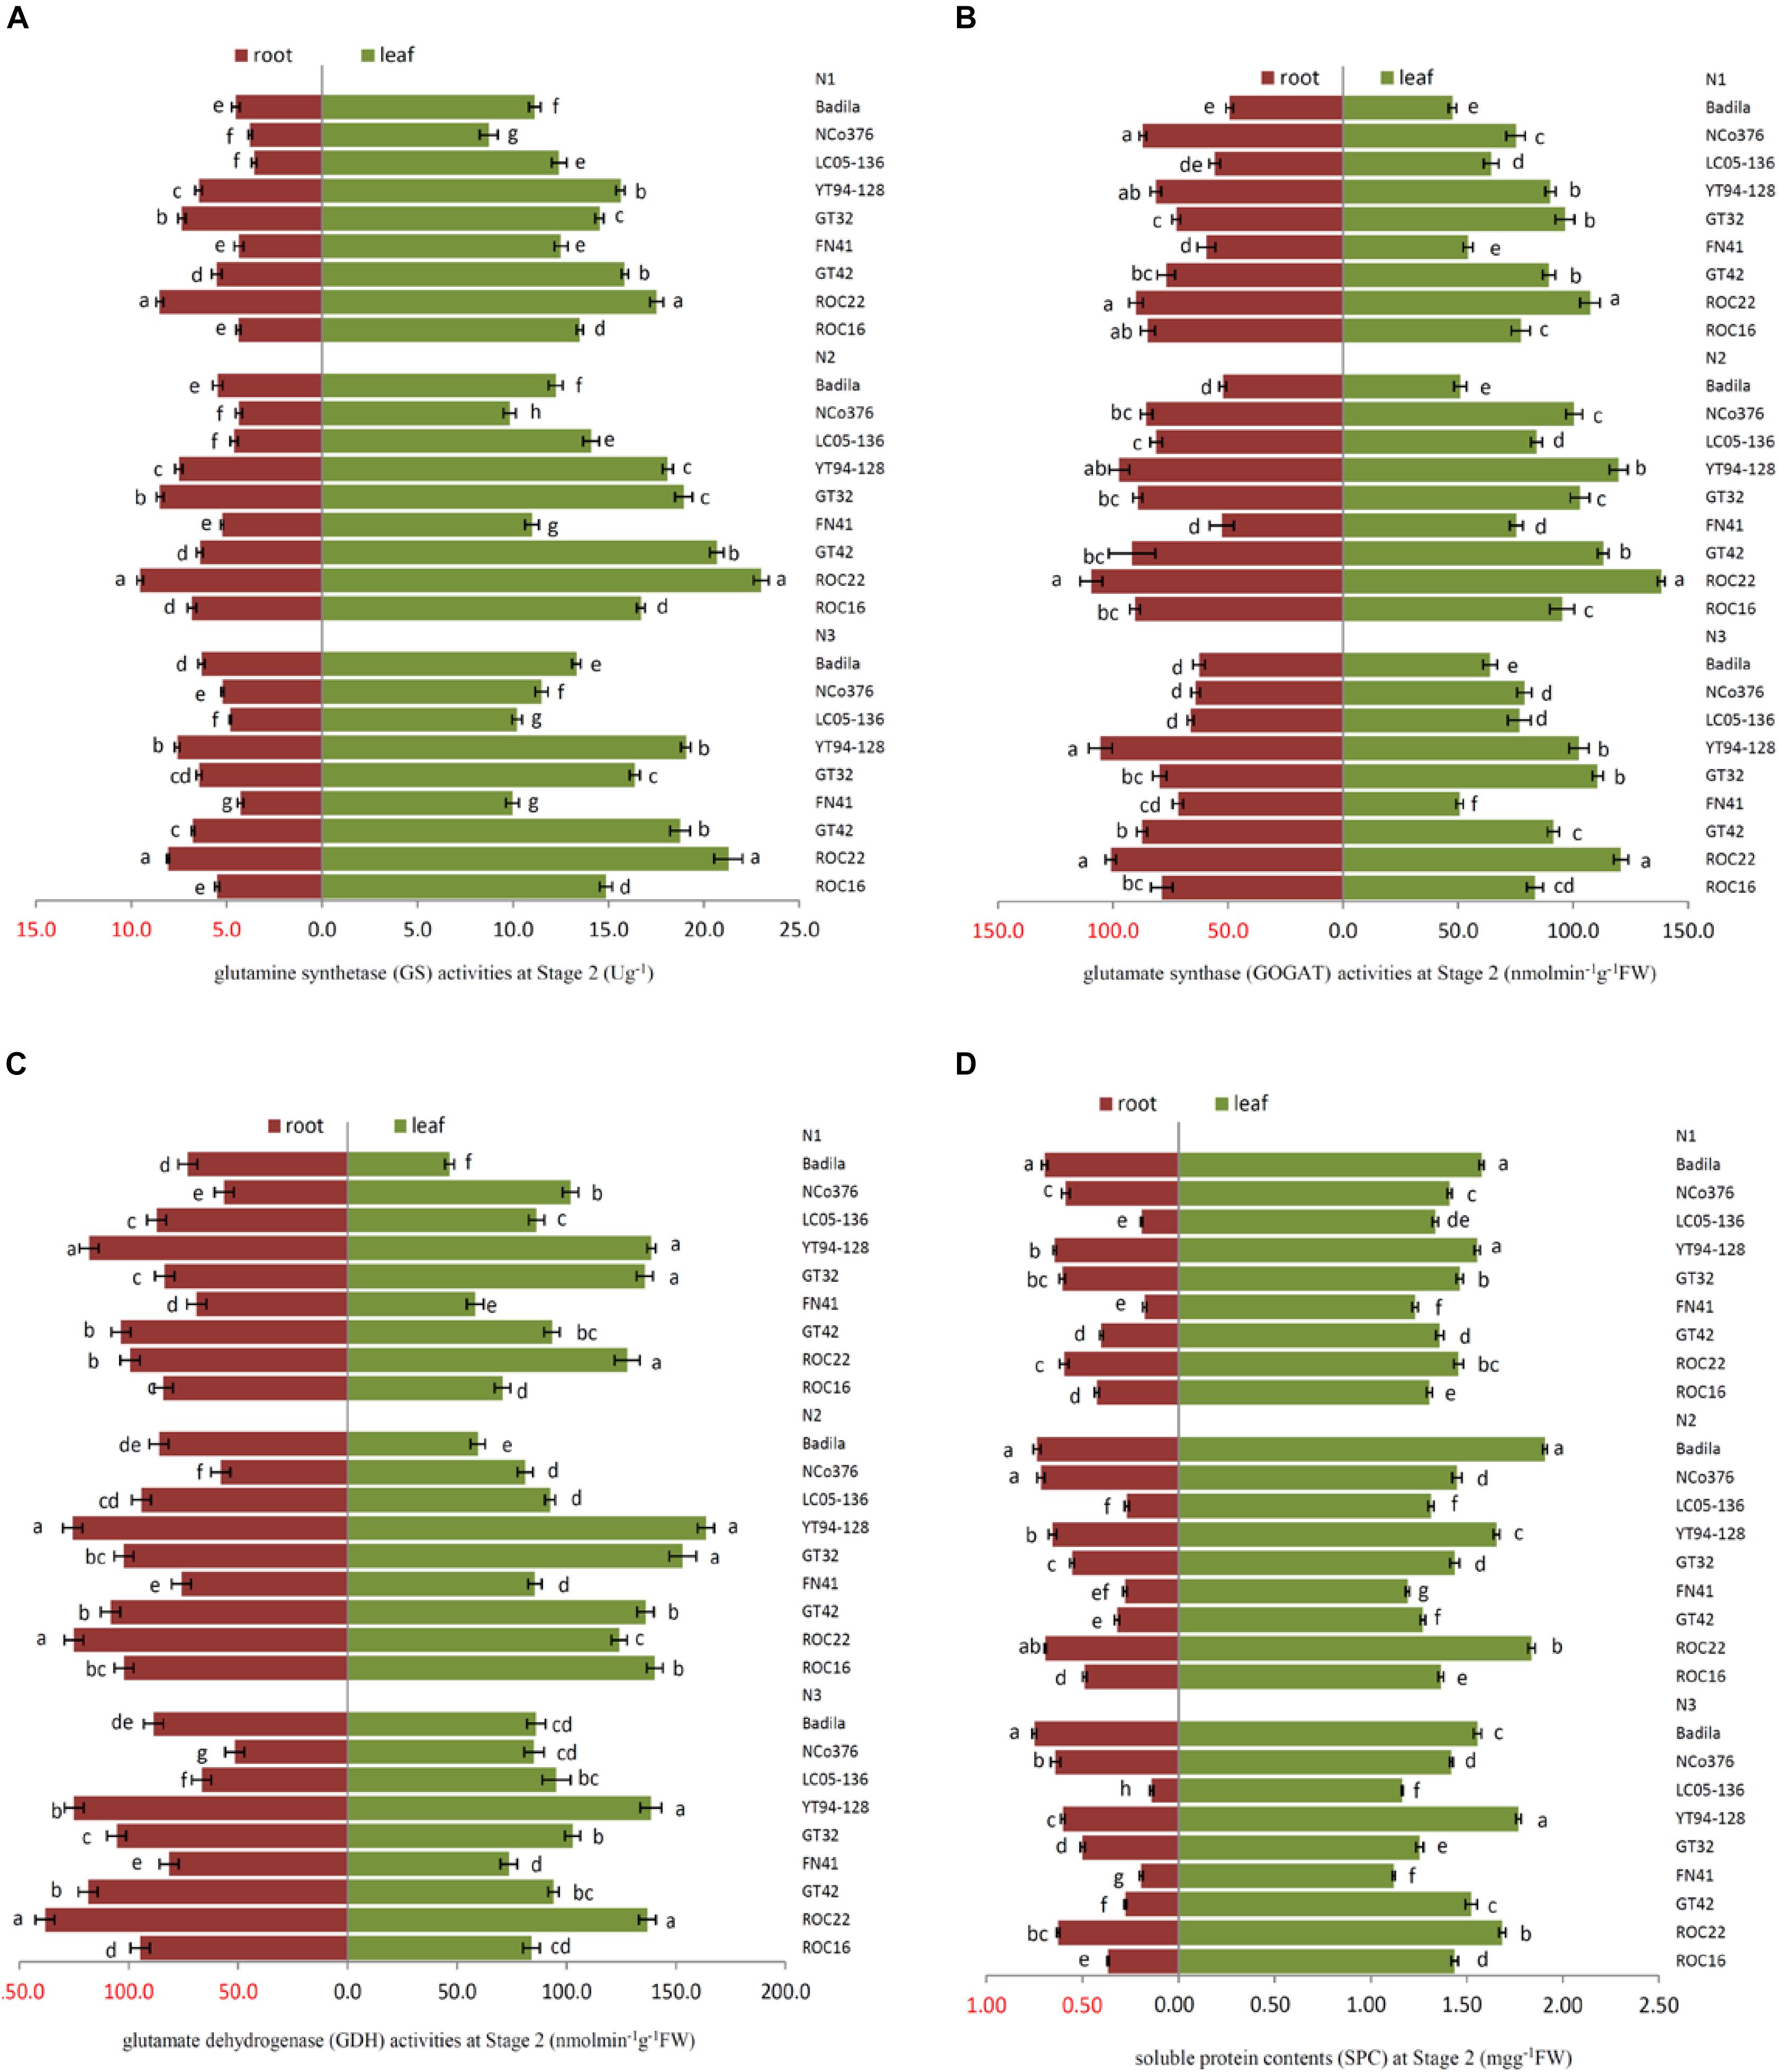
Figure 2. Effects of different N application rates on N assimilation enzyme activities at Stage 2 in 2016. (A) GS (glutamine synthetase activity), (B) GOGAT (glutamate synthase activity), (C) GDH (glutamate dehydrogenase activity), (D) SPC (content of soluble protein). N1 was 225 kg/hm2 urea, N2 was 450 kg/hm2 urea, N3 was 675 kg/hm2 urea. Stage 2, the late elongation stage. Different lowercase letters represent significant differences between the different varieties with respect to the same N application rates (P < 0.05).
Correlation of Key Enzymes Activities Between Leaf and Root in Stage 1 and Stage 2
Table 3 showed that in Stage 1, only the activity of GS in the leaf was significantly correlated with that in the root among three enzymes of GS, GOGAT and GDH, and so was SPC. While, in Stage 2, the significant correlation of activity between leaf and root was observed in each of the above three enzymes, and so was SPC.
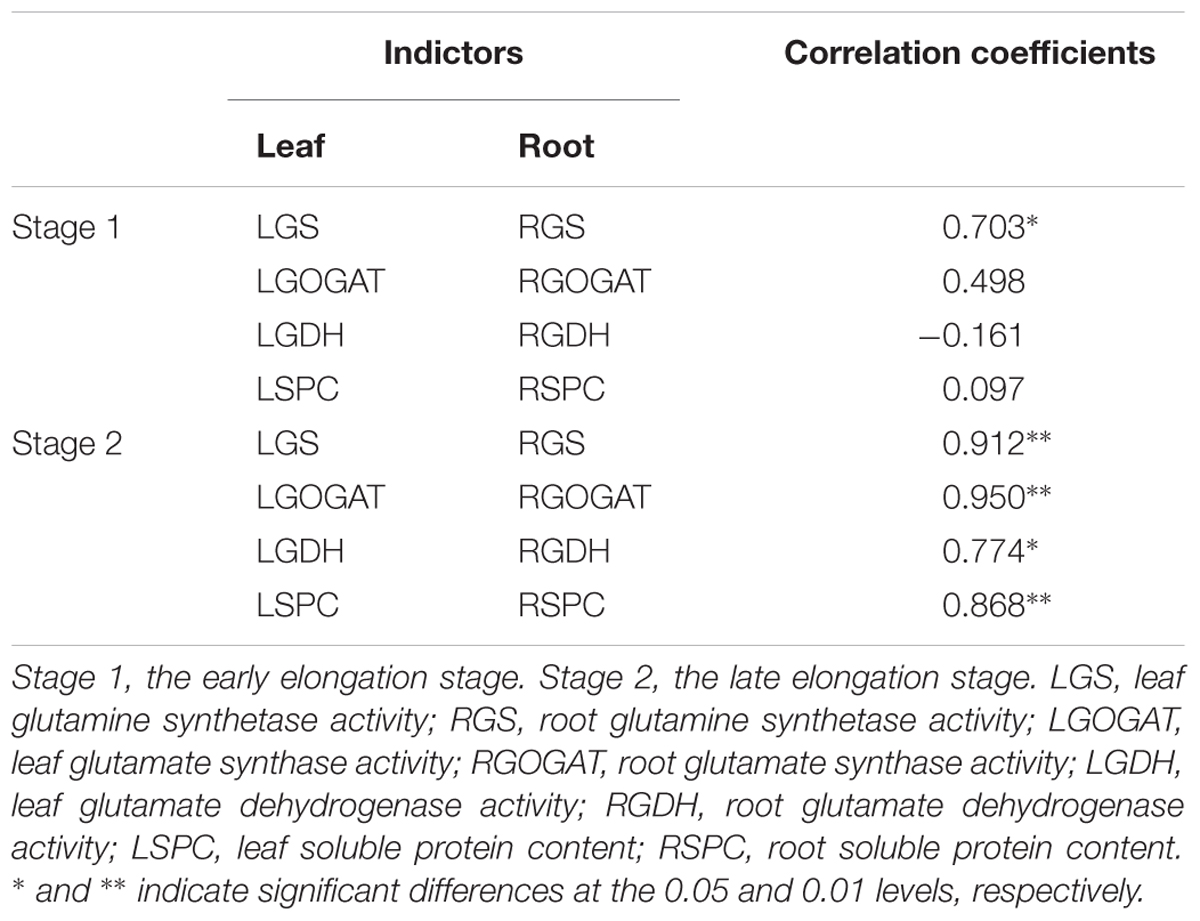
Table 3. Pearson’s correlation coefficients among enzymes activities between leaves and roots at Stage1 and Stage 2 in 2016.
Photosynthesis, Fluorescence Indicators and Chlorophyll Relative Content of Sugarcane Under Different N Application Rates
In Stage 1 (Table 4), the SPAD value and Fv/Fm under N1 were significantly lower than those under N2 and N3. Pn of N2 was significantly higher than that under N1 and N3. The Pn and Fv/Fm of ROC22 were significantly higher than those of other varieties under N2. The SPAD value and Pn of YT94-128 were significantly higher than those of other varieties under N3.
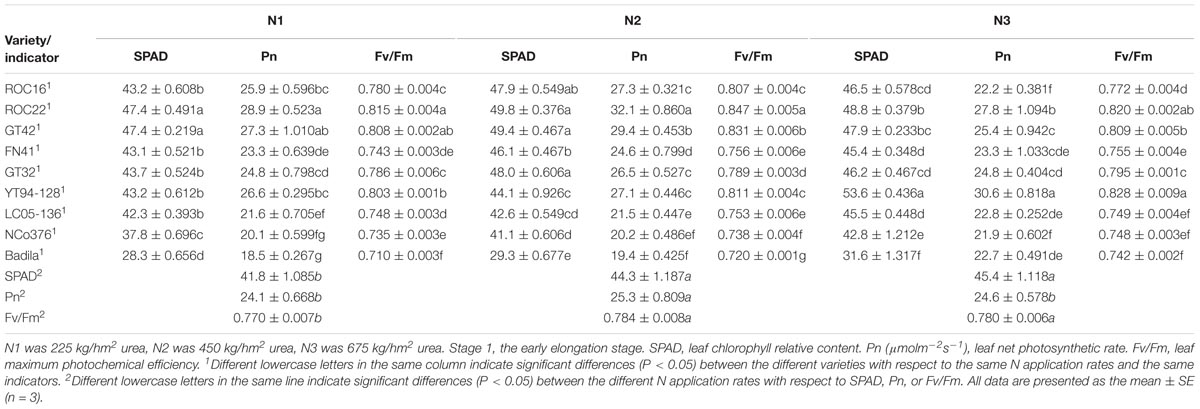
Table 4. Effects of different N application rates on SPAD, Pn, and Fv/Fm of sugarcane at Stage 1 in 2016.
In Stage 2 (Table 5), the SPAD value and Fv/Fm under N3 were significantly higher than those under N2 and N1. The Fv/Fm of ROC22 was significantly higher than those of other varieties under N1. Compared with N2, the SPAD value of ROC16 exhibited the largest decline under N1 (13.90%), the Pn of YT94-128 exhibited the largest increase under N3 (54.80%).
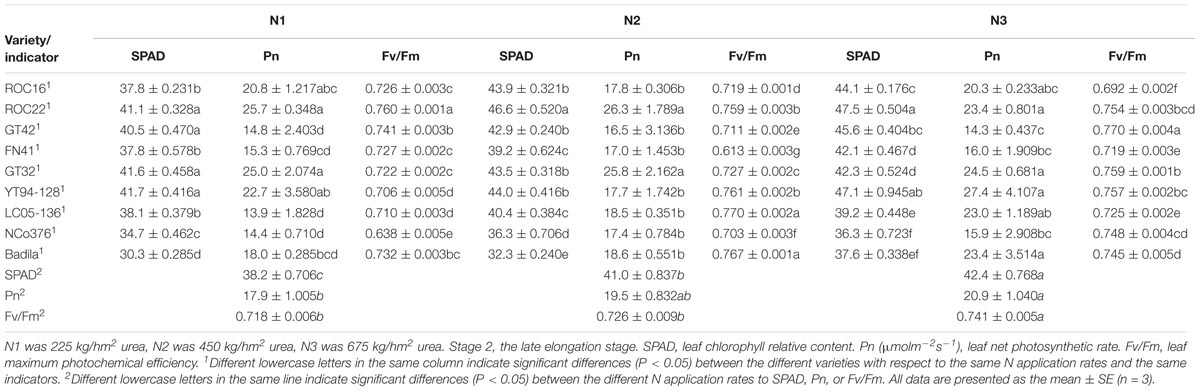
Table 5. Effects of different N application rates on SPAD, Pn, and Fv/Fm of sugarcane at Stage 2 in 2016.
As can be seen, ROC22 had high leaf chlorophyll relative content and high photosynthetic capacities under low N stress and moderate N application rate. ROC16 maintained a low leaf chlorophyll relative content and showed low tolerance to low N stress. YT94-128, which had a strong photosynthetic capacity under high N fertilizer application, was more suitable for a high N environment.
Effects of Different N Application Rates on PNA, PDW, and NUE
PNA and PDW at Stage 1 and Stage 2
As shown in Table 6, at Stage 1 and Stage 2, PNA under N2 and N3 was significantly higher than that under N1. PDW under N2 was significantly higher than that under N1 and N3, indicating that sugarcane could absorb a higher percentage of N at a moderate dose of N than at the two other doses and also produced more dry matter.
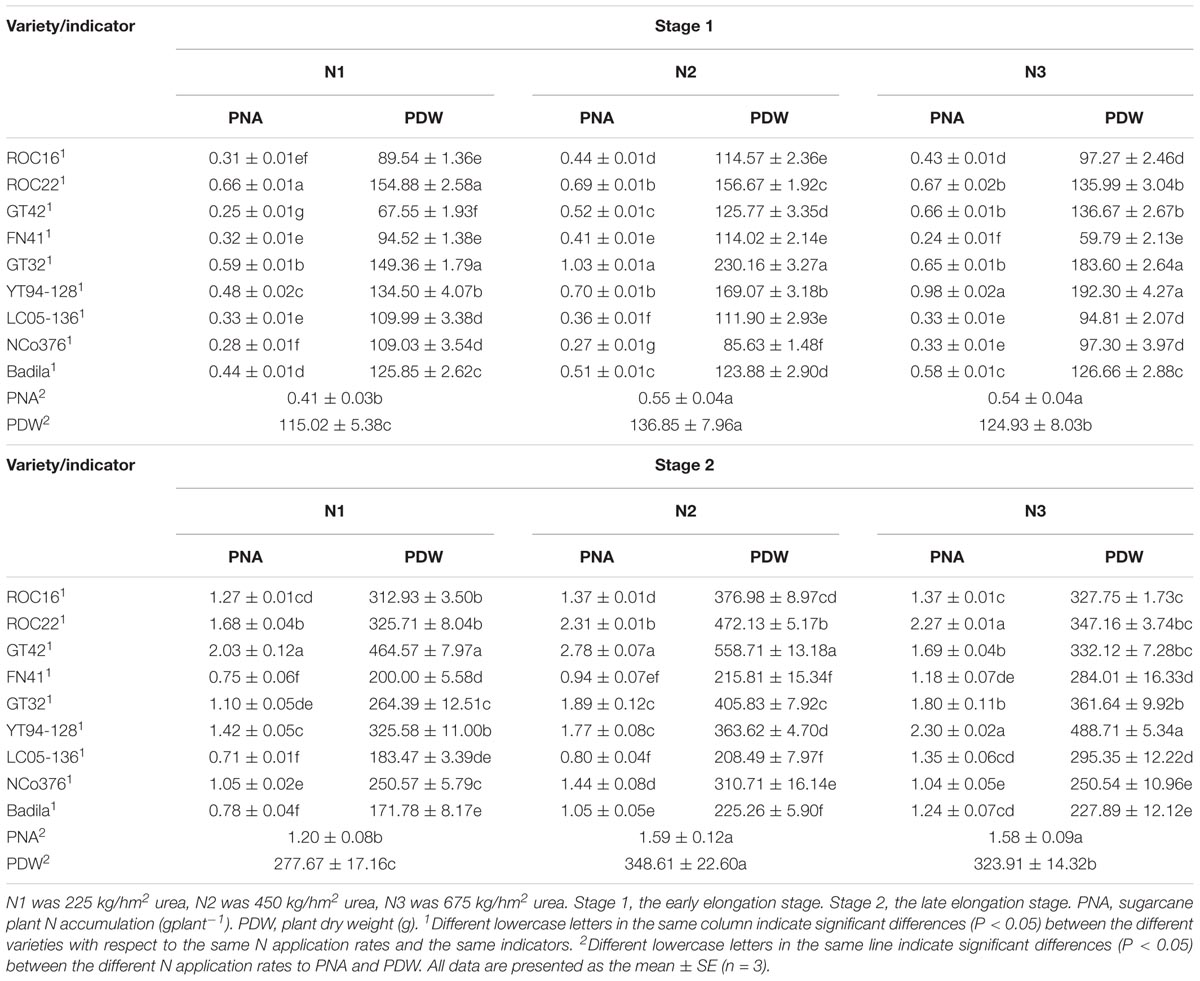
Table 6. Effects of different N application rates and varieties on PNA and PDW of sugarcane at Stage 1 and Stage 2 in 2016.
Table 6 shows that at Stage 1, under N1, PDW and PNA of ROC22 and GT32 were significantly higher than that of other varieties. Under N2, PNA and PDW of NCo376 was significantly lower than that of other varieties. Under N3, PNA of YT94-128 was significantly higher than that of other varieties, PNA and PDW of FN41 was significantly lower than that of other varieties. At Stage 2, under N1, PNA of ROC22 and GT42 were significantly higher than those of other varieties. PNA and PDW of ROC22 and GT42 were significantly higher than those of other varieties under N2. Under N3, PDW of YT94-128 was significantly higher than those of other varieties, and PNA of YT94-128 and ROC22 was significantly higher than that in other varieties. These results suggested that ROC22 has a strong adaptability to moderate and low doses of N, absorbed more N and produced more dry matter. YT94-128 was shown to be more tolerant at a high N level.
PNA, PDW, and NUE at Stage 3
As we can see in Table 7, at Stage 3, PDW under N2 was significantly higher than that under N1 but was not significantly different from that under N3. PNA under N2 and N3 was significantly higher than that under N1. NUE under N3 was significantly lower than that under N2 and N3.
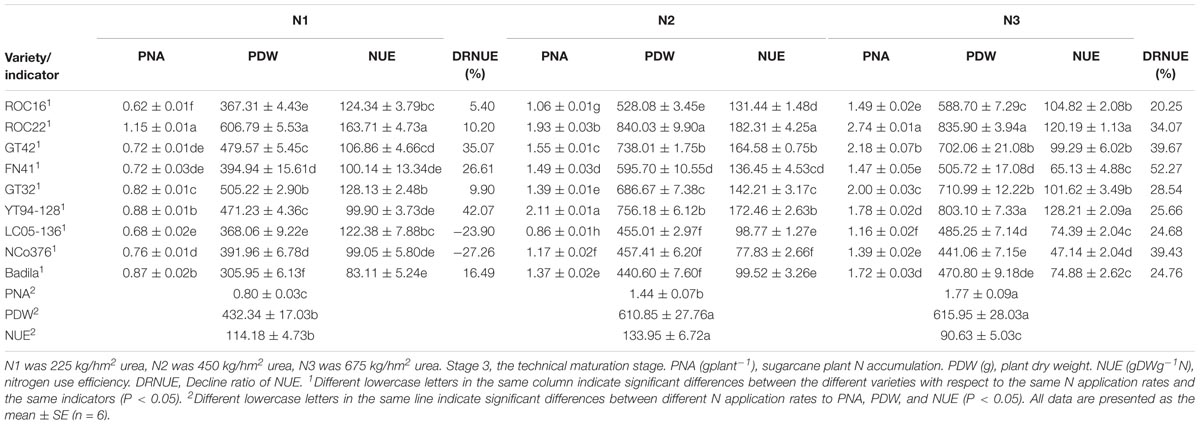
Table 7. Effects of different N application rates on PNA, PDW, and NUE of sugarcane at Stage 3 in 2016.
As shown in Table 7, the values of PNA, PDW, and NUE of NCo376, LC05-136, FN41, and Badila were relatively low under different N application rates than that of other varieties under N3. Compared with N2, the largest decrease of PNA, PDW, and NUE under N1 was observed in YT94-128, with respective decreases of 58.29%, 37.68%, and 42.07%. Under N1 and N2, PDW, and NUE of ROC22 were significantly higher than those of other varieties. PNA of ROC22 was significantly higher than that of other varieties under N3. Compared with N2, the largest decrease of PDW and NUE under N3 was observed in FN41, i.e., respective decreases of 15.10% and 52.27%.
The above results suggested that ROC22 has a strong adaptability to different N application rates. Besides, PDW and NUE of ROC22 were relatively high regardless of low or high N application rates. In addition, ROC22 was more tolerant to low N stress, and thus the cultivation of ROC22 only requires the application of low to moderate doses of N. However, Badila was distinctive, its NUE and PDW were similar to those of NCo376, LC05-136 and FN41, while the values were quite low. Similar to ROC22, compared with N2, NUE of GT32 and ROC16 was decreased by 9.90% and 5.40% under N1 treatment, and decreased by 28.54% and 20.25% under N3 treatment, respectively (Table 7). GT32 and ROC16 did not decrease much in NUE under N1 and N3 treatments. GT32 and ROC16 were insensitive to fertilizer application. Compared with other seven varieties except ROC22, GT32 had relatively better growth based on NUE and PDW under N1 treatment. Compared with N2, NUE of GT42 and YT94-128 was decreased by 39.67% and 25.66% under N3 treatment, respectively. Compared with other N treatments, GT42 was more suitable for moderate N environment (450 kg/hm2 urea) based on NUE and PDW under N2 treatment. Compared with N1 treatment, YT94-128 was more suitable for moderate to high N environments (450–675 kg/hm2 urea) based on NUE and PDW under N2 and N3 treatments (Table 7).
Correlations Between NUE at Stage 3 and the Other Indicators at Stage 1 and Stage 2
It is shown in Table 8 that a significant correlation was obtained between PNA at Stage 1 and NUE at Stage 3, but a non-significant correlation was observed for PDW at Stage 1 and NUE at Stage 3 (P < 0.05). A significant correlation was also observed between PNA at Stage 2 and NUE at Stage 3 (P < 0.01), and the correlation between PDW at Stage 2 and NUE at Stage 3 was significant at P < 0.05. These results suggested that PNA and PDW at Stage 2 could better reflect NUE at Stage 3 than the PNA and PDW at Stage 1.
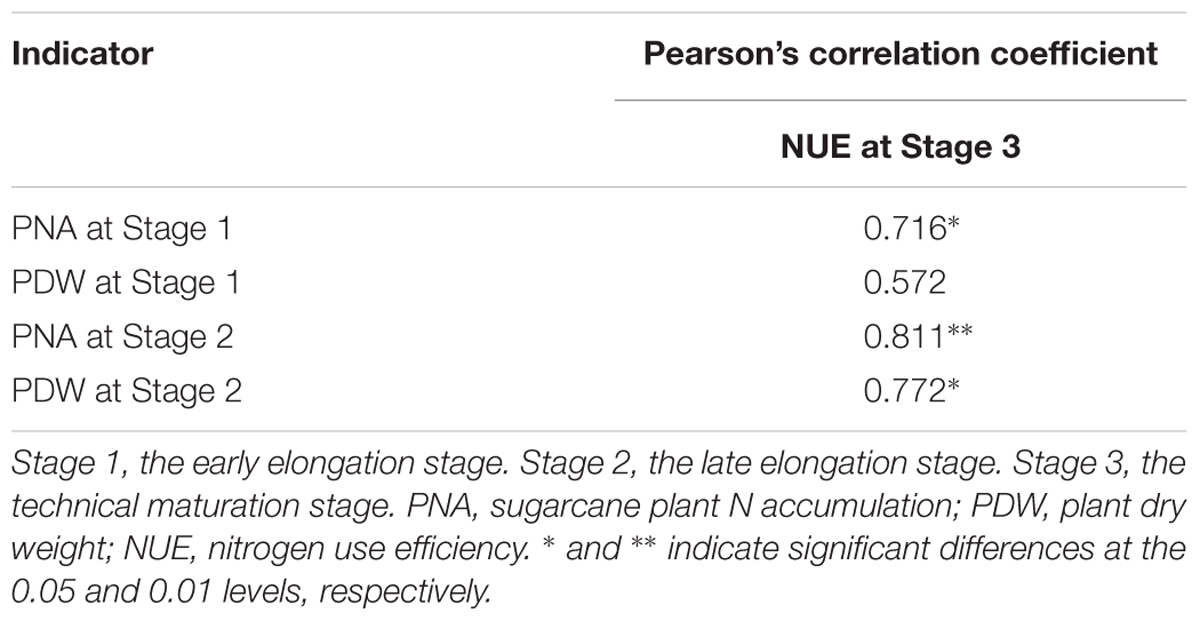
Table 8. Pearson’s correlation coefficients among indicators of nine sugarcane varieties cultivated in a pot experiment under different N application rates at different stages in 2016.
Principal Component Analysis of Physiological and Agronomic Indicators at Stage 2
According to the correlation analysis, the PCA of agronomic and physiological indicators was concentrated on Stage 2. The loading plots of principle components 1 and 2 of the PCA analysis on 15 selected indicators obtained from the average value of nine sugarcane varieties at Stage 2 under different N application rates are illustrated in Figure 3. The 15 selected indicators were H, D, SPAD, Pn, Fv/Fm, LGS, LGDH, LGOGAT, LSPC, RGS, RGDH, RGOGAT, RSPC, PNA, and PDW. The total variance contributions for the first and second principal components were 62.37% and 20.94%, respectively, and the accumulated contribution reached 83.31%, which basically represented the original information. In the first principal component, the absolute values of the eigenvectors of H, SPAD, LGS, LGOGAT, LGDH, RGS, RGOGAT, RGDH, PNA, and PDW were relatively large, indicating that key enzyme activities of N metabolism were closely related to PDW and PNA at Stage 2. In the second principal component, the absolute values of indicators such as D, LSPC, RSPC, Pn, and Fv/Fm were relatively large, indicating that the second component mainly characterized the soluble protein content of the leaf and root and photosynthetic fluorescence indicators.
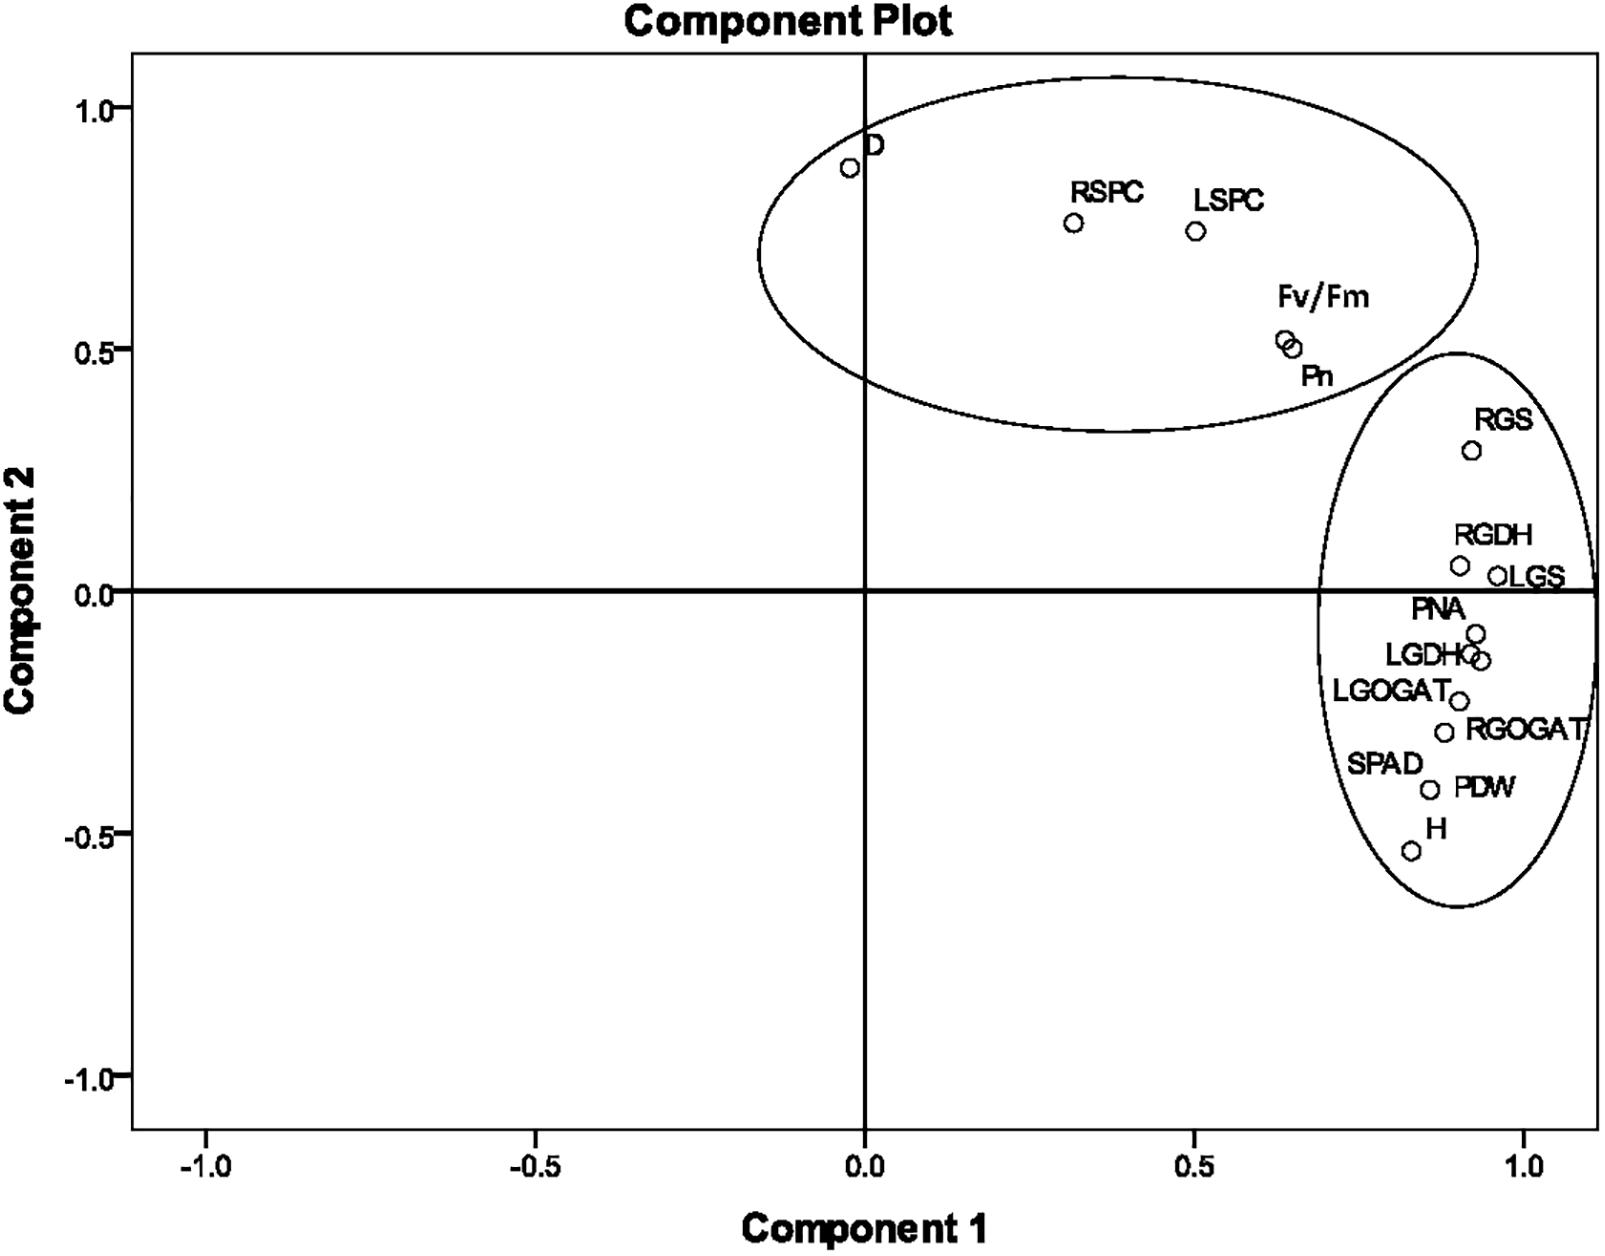
Figure 3. The principal component analysis (PCA) of 15 agronomic and physiological indicators at Stage 2 in 2016. The PCA shows the biplot of the first two principal components. The eigenvectors were as follows. H, plant height; D, stalk diameter; SPAD, leaf chlorophyll relative content; LGS, leaf glutamine synthetase activity; LGDH, leaf glutamate dehydrogenase activity; LGOGAT, leaf glutamate synthase activity; LSPC, content of soluble protein in the leaf; RGS, root glutamine synthetase activity; RGDH, root glutamate dehydrogenase activity; RGOGAT, root glutamate synthase activity; RSPC, content of soluble protein in the root; Pn, leaf net photosynthetic rate; Fv/Fm, leaf maximum photochemical efficiency; PNA, plant nitrogen accumulation; PDW, plant dry weight. Stage 2, the late elongation stage.
Correlations Between PDW and NUE of Stage 3 and All the Other Indicators at Stage 2
Table 9 indicated that, PNA and PDW were significantly correlated with H, SPAD, LGS, LGOGAT, LGDH, RGS, RGOGAT, and RGDH at Stage 2. In addition, a similar significant correlation between PDW and NUE at Stage 3 and H, SPAD, LGS, LGOGAT, LGDH, RGS, RGOGAT, RGDH, PNA, and PDW at Stage 2 was observed, respectively (Table 10).
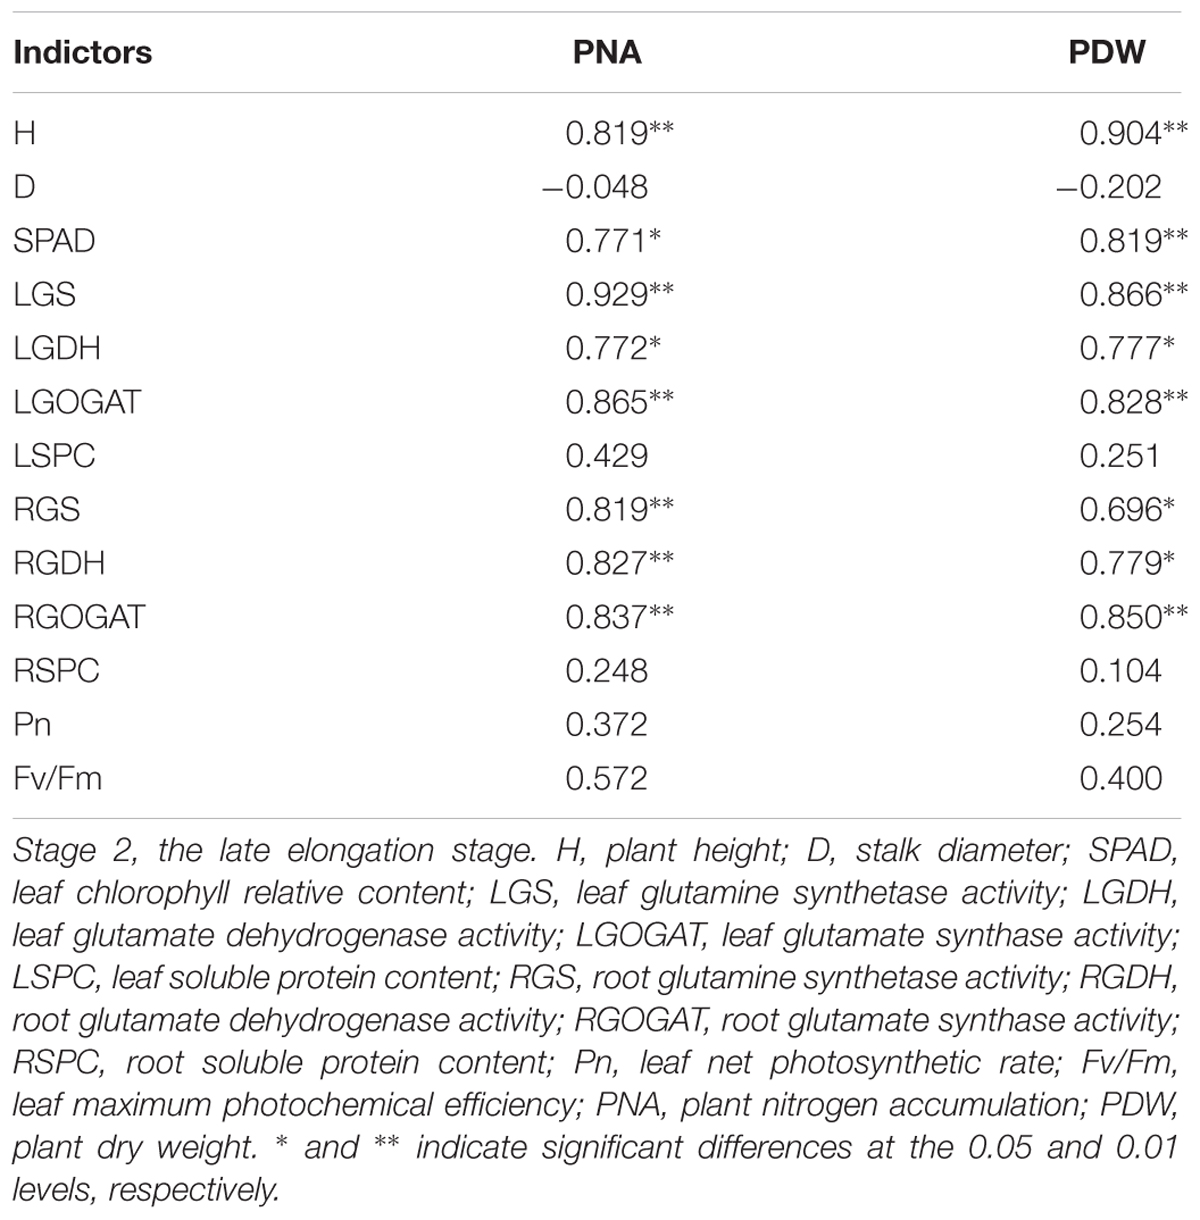
Table 9. Pearson’s correlation coefficients among indicators at Stage 2 in 2016.
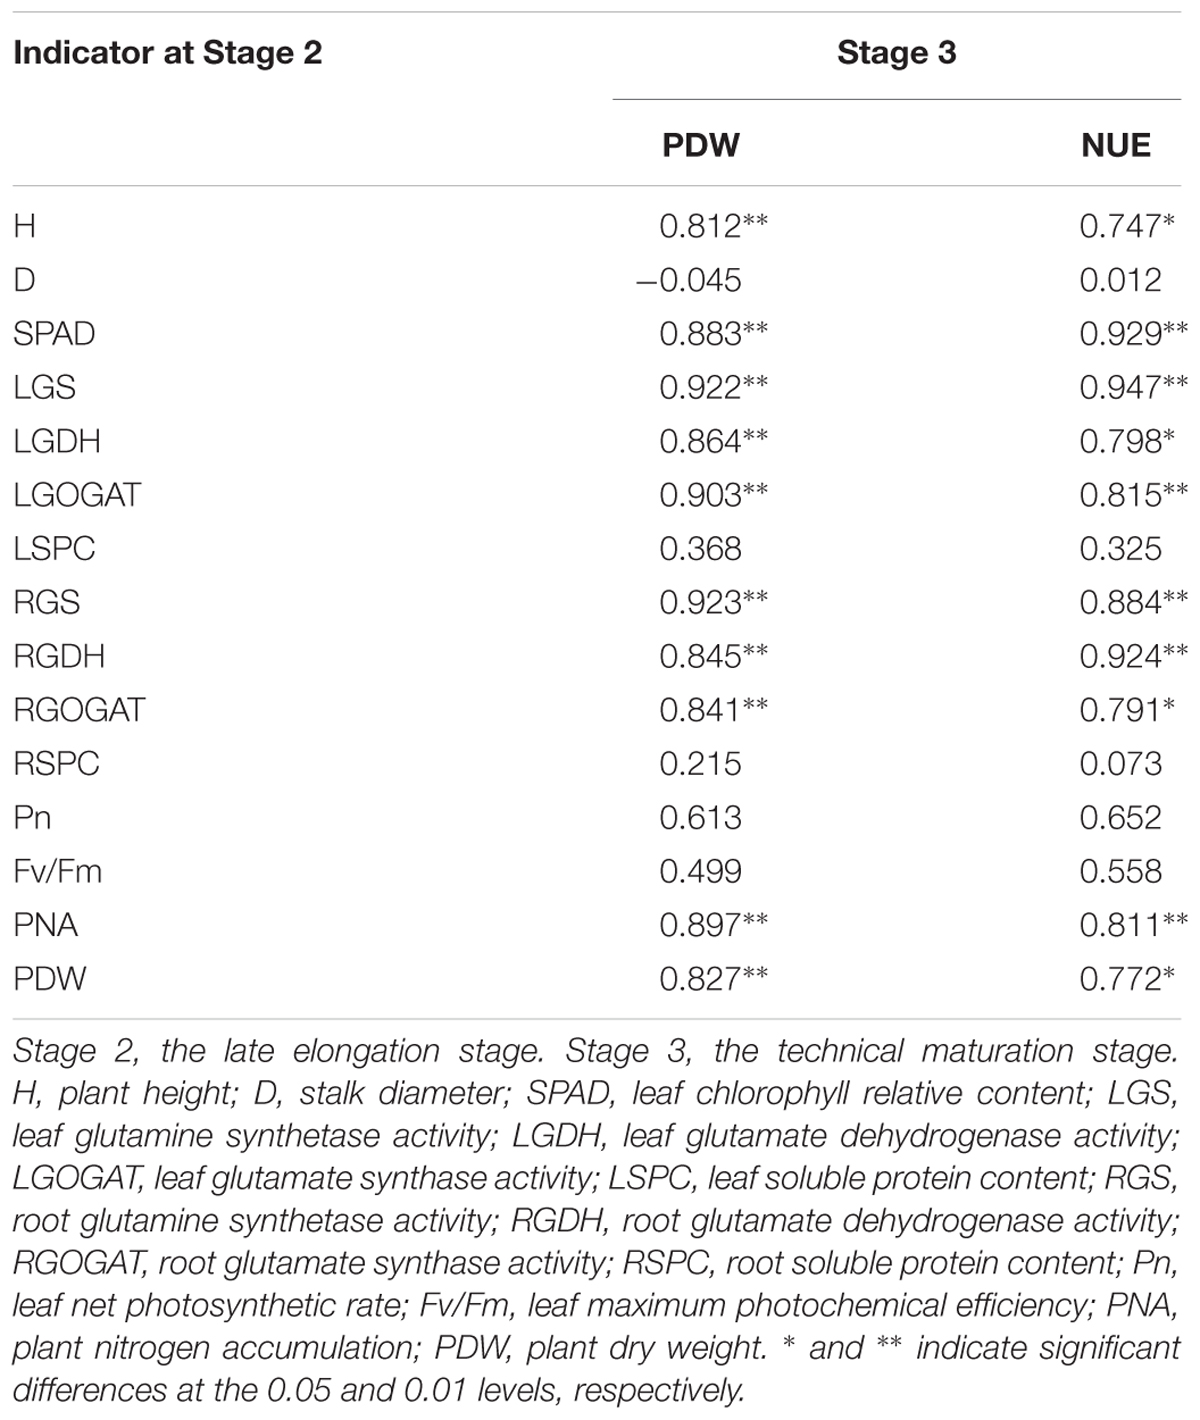
Table 10. Pearson’s correlation coefficients among indicators at Stage 2 and Stage 3 in 2016.
Screening Characteristic Indictors for Estimation of Sugarcane NUE
In order to establish a comprehensive evaluation method of sugarcane NUE, stepwise regression analysis was carried out, and NUE was predicted based on indicators (H, D, SPAD, LGS, LGOGAT, LGDH, LSPC, RGS, RGOGAT, RGDH, RSPC, Pn, Fv/Fm, PNA, PDW) at Stage 2. The stepwise regression equation was as follows: Y = -80.50 + 5.52X1 + 3.64X2 - 0.12X3 (R2 = 0.99, P < 0.01), indicating that the model simulation results were trustworthy. In the equation, Y is the predicted value of NUE at Stage 3, and X1, X2, and X3 are LGS, SPAD, and PDW, respectively, at Stage 2. The three variables (LGS, SPAD, and PDW) at Stage 2 could determine 99% of the total variation of the F value (138.53), and the overall model was significant. This suggested that sugarcane NUE could be estimated based on leaf GS activity, leaf SPAD and PDW at Stage 2.
In most of higher plants, GS can be divided into two main isoforms, GS1 (cytoplasmic type) and GS2 (plastid type) (Morey et al., 2002). GS1 are encoded by a gene family (GS1.a, GS1.b, GS1.c) (Nogueira et al., 2005), and GS2 are encoded by a single gene (Lam et al., 1996; Nogueira et al., 2005). In addition, Eduardo found that gene for dodecameric GS (GSI) were observed in sugarcane (Nogueira et al., 2005). In our research, the correlation between GS1.b expression and LGS activity was significant (Table 11). The GS1.b expression in various sugarcane varieties under different N concentration treatments was shown in the Figure 4.
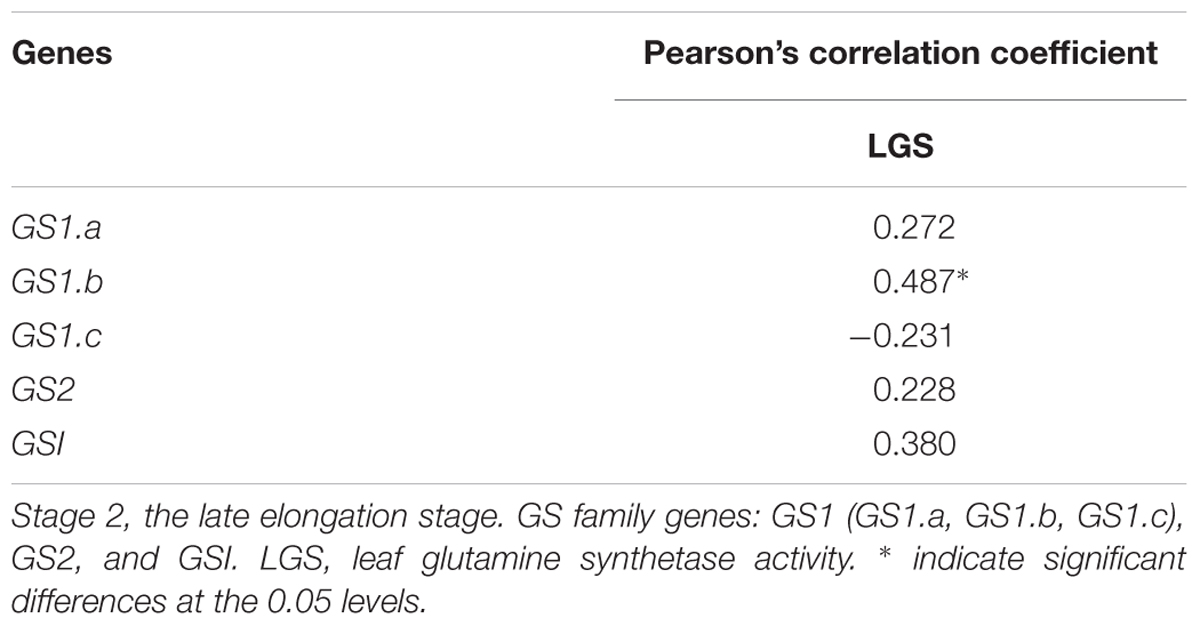
Table 11. Pearson’s correlation coefficients between LGS and the expressions of GS family genes at Stage 2 in 2016.
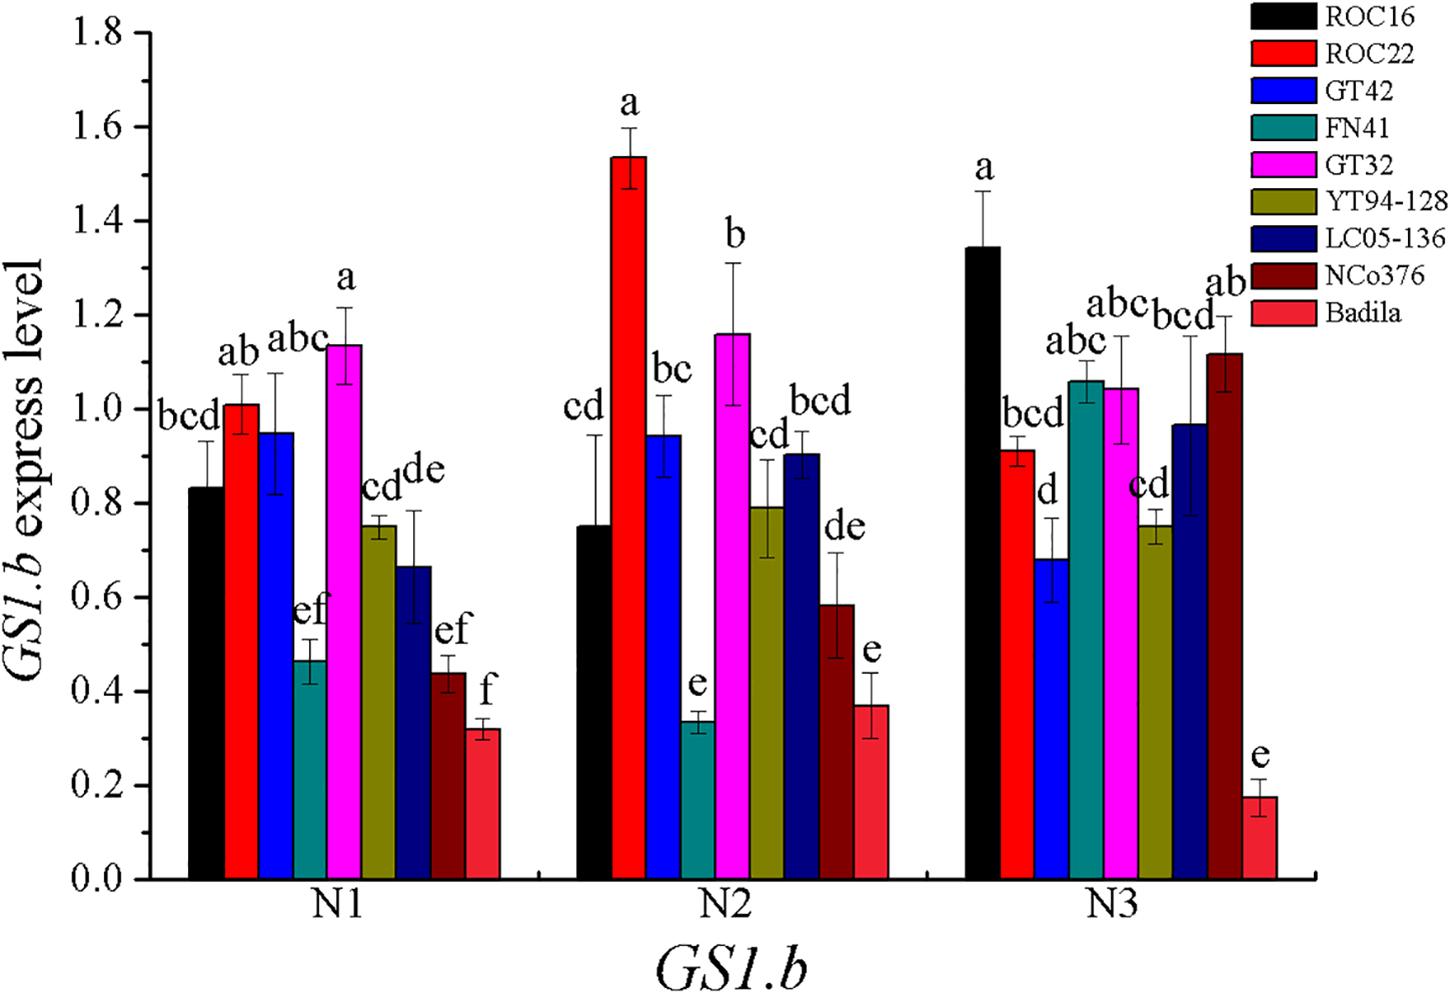
Figure 4. GS1.b expression under different N application rates at Stage 2 in 2016. N1 was 225 kg/hm2 urea, N2 was 450 kg/hm2 urea, N3 was 675 kg/hm2 urea. Stage 2, the late elongation stage. Different lowercase letters represent significant differences between the different varieties with respect to the same N application rates (P < 0.05).
Path analysis was conducted to further analyze the direct and indirect effect of each indictor based on the results of stepwise regression analysis. As shown in Table 12, among the three indicators (LGS, SPAD, and PDW) at Stage 2, LGS had the most direct effect on NUE at Stage 3, followed by SPAD and PDW. Indirect path coefficient analysis showed that both SPAD and PDW had a positive effect on NUE through LGS. The above results suggested that LGS is the most critical indicator for prediction of sugarcane NUE.
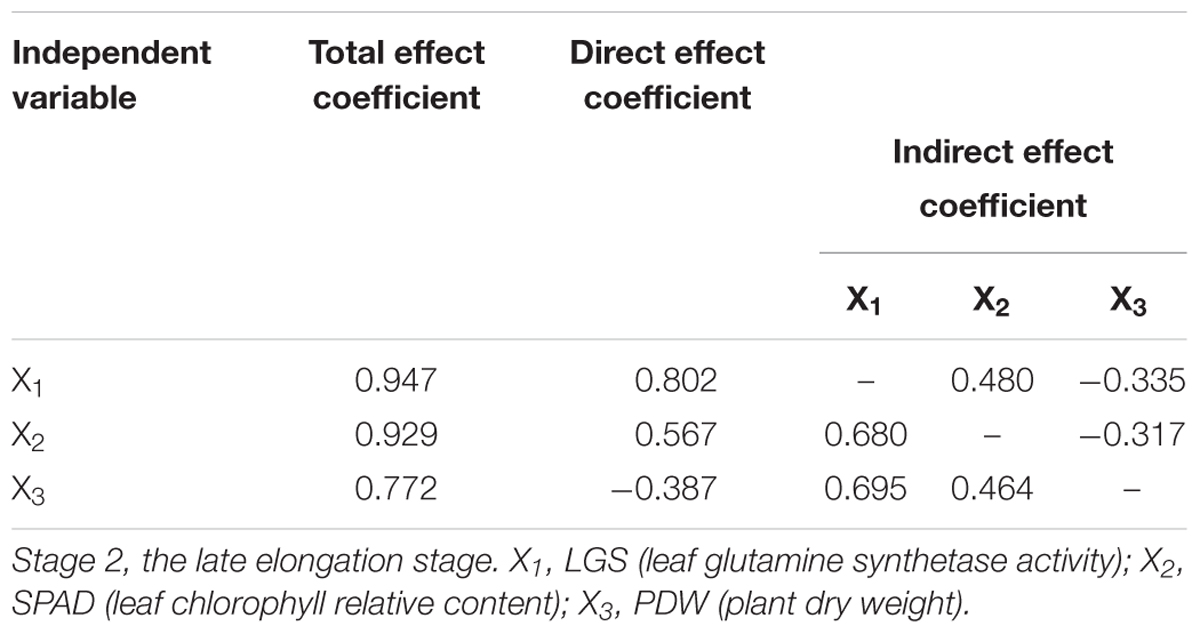
Table 12. Path analysis among indicators (LGS, SPAD, and PDW) at Stage 2 in 2016.
To verify the accuracy of the indicators used in the model to estimate NUE, three linear regression equations were established based on the indicators LGS, SPAD, and PDW collected at Stage 2 in the field experiment in 2017. The data were used to establish the (X) of Stage 2 and (Y) of Stage 3 (Figure 5): Y (NUE) = 6.51X (LGS)-66.41 (R2 = 0.86, P < 0.01), Y (NUE) = 6.90X (SPAD)-197.3 (R2 = 0.61, P < 0.01), and Y (NUE) = 0.23X (PDW)-39.24 (R2 = 0.63, P < 0.01). This indicates that each of the three indicators used in the linear regression equation is suitable for the estimation of sugarcane NUE, however the LGS was the most critical indicator because of its stronger relationship with NUE than that of SPAD and PDW. This suggested that the characteristic indicators, selected based on the pot experiment for the estimation of sugarcane NUE, are consistent with the field experiment.
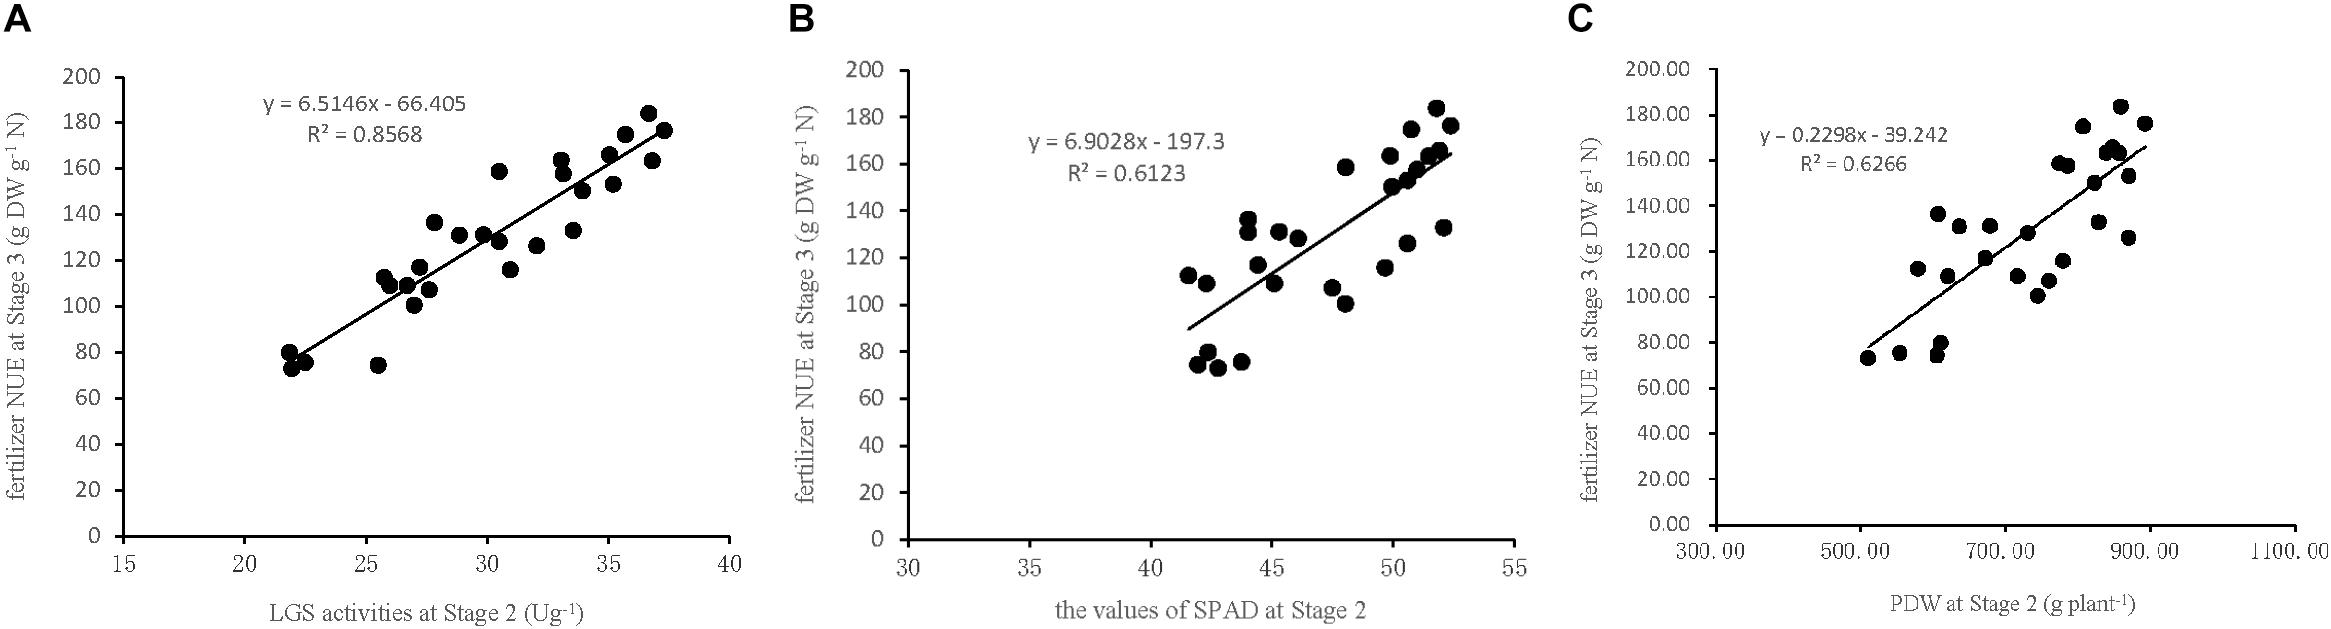
Figure 5. Relationships between NUE at Stage3 and the indicators of LGS, SPAD, and PDW at Stage 2 in the field experiment in 2017. (A) LGS (leaf glutamine synthetase activity), (B) SPAD (leaf chlorophyll relative content), (C) PDW (plant dry weight). Stage 2, the late elongation stage. Stage 3, the technical maturation stage.
Discussion
The Physiological and Agronomic Changes in Sugarcane Responsive to the Different N Application Rate
N is closely related to plant growth and development and affects cell regulation and metabolism. The supply of N determines the crop yield (Xu et al., 2012). Usually, nitrate-N and ammonium-N absorbed by plants are transformed into amino acid by enzymes of N assimilation and then to proteins that can be utilized by plants. Therefore, the enzyme activity of N assimilation would have a great effect on the N metabolic rate, leading to differences in NUE (Jawad et al., 2017). The activities of N assimilation key enzymes GS, GOGAT, and GDH in N metabolism reflect the strength of N assimilation of crops. Different N application rates affect the activities of the key N assimilation enzymes in sugarcane (Jawad et al., 2017). In our experiment, N assimilation enzymes in the leaf and root at the late elongation stage exhibited higher activity under the moderate N application rate, along with higher SPC, SPAD, Pn, and Fv/Fm resulting in higher PDW and NUE at the technical maturation stage. In addition, the activities of GS, GOGAT, and GDH of the high NUE varieties were generally higher than those with low NUE. These findings are similar to the previous report. In barley, activities of GS, GOGAT, and GDH in the root or leaf of plantlets increased with increasing N-content (0–2 mmol L-1) under hydroponic culture, and varieties with high NUE had higher GS, GOGAT, and GDH activities (Jawad et al., 2017). Fluorescence indicators, which are dramatically affected under biotic or abiotic stresses, are usually regarded as indicators of stress tolerance (Chai et al., 2016). It was reported that the chlorophyll content (Kumara and Bandara, 2001), photosynthesis (Meinzer and Zhu, 1998; Kumara and Bandara, 2001), maximal photochemical efficiency (Meinzer and Zhu, 1998), N content and biomass (Kumara and Bandara, 2001) decreased significantly in sugarcane under a low N supply. Our results showed that several key enzyme activities of N-metabolism, such as GS, GDH and GOGAT, were significantly decreased at early and late elongation stages under low N stress compared with those of the moderate N application rate, similar to Pn and Fv/Fm. This resulted in the obviously lower PNA and PDW but higher NUE under low N stress compared to the moderate and high doses of N. These observations might suggest that low N restricted N-assimilation, leading to photo inhibition with lower potential photochemistry, and then decreased photosynthesis and Pn, accompanied by reduced N accumulation at the technical maturation stage, and the decreased photosynthesis eventually resulted in lower biomass. In addition, the decreased amount of N that accumulated in the plant was greater than that of biomass after low N stress, resulting in higher NUE.
The final product of N-metabolism is protein, while the content of soluble protein can reflect the process of N-metabolism to a certain extent, and then the senescence state of the leaf (Weng et al., 2014). Our research showed, compared with the moderate and low application rates, the higher SPC of leaves under the high N application rate at Stage 1 indicated that more proteins were synthesized in the sugarcane leaf to alleviate the damage caused by high N stress. At the technical maturation stage, maximum PNA was observed in the high N application rate while the PDW of the moderate N application rate had no difference with that of high application rate, which demonstrated that a high supply of N could promote N accumulation in sugarcane but failed to further increase the biomass.
Under N stress, above-ground partitioning in crops is more sensitive to N than that of roots (Chen et al., 2016). The enzyme activities of GS and GOGAT and the SPC content of sugarcane leaves under N stress at the early/late elongation stages were higher than those of the roots in our experiment. However, N stress had a smaller effect on root GS activity and a greater effect on leaf GS and GOGAT activities. This may due to the reason that leaf is the most important organ for photosynthesis, in which N-metabolism mainly occurs, and Glutamine produced by the GS/GOGAT pathway is transferred from the leaf to the root, which inhibits the synthesis of key N-metabolism enzymes in the root. Therefore, the GS/GOGAT pathway in the leaf was more vigorous than that in the root under N stress.
Fertilization Guidelines for Sugarcane Varieties
Applying N fertilizer in the key fertilizer requirement period, increasing the number of fertilization and enhancing efficiency fertilizers can better match N supply to crop demand and have an impact on crop NUE. In addition, genetic improvement, trait physiology, transgenic approaches, and remote sensing technologies can improve sugarcane NUE (Bell et al., 2014). However, screening crop varieties with low N tolerance and high NUE from those widely planted at present is an effective means to promote agricultural production at a lower cost of N-fertilizer input (Zhang C. et al., 2017). In the present study, the NUE differences among different varieties supplied with different dosage of N-fertilizer was analyzed to identify the NUE types of varieties under LN, NN, and HN environments. ROC22 was identified to have high NUE under low N (225 kg/hm2 urea). The activities of key enzymes involved in the N-metabolism of ROC22 decreased to a lesser extent under a low supply of N-fertilizer in this study, along with a high chlorophyll content in the leaf maintained photosynthesis, and relatively high Pn, Fv/Fm and soluble protein aided in the adaption to low N stress to decrease leaf senescence. These maybe are part of the important factors that its agronomic performance especially the stability of cane yield in different years and varied ecological regions is outstanding, and resulting in the largest planting in recent 15 years and at present China. Similar results of tolerance to low dosage N were obtained by Li (2011) in sand culture of ROC22. Our experiment found that the variety GT32 had a good tolerance to low N (225 kg/hm2 urea), GT42 was more suitable for moderate N environment (450 kg/hm2 urea), and YT94-128 was more suitable for middle N and high N supply (450–675 kg/hm2 urea) based on the analysis of key enzyme activities of N-metabolism, photosynthesis fluorescent, NUE and PDW at different growth stages. In addition, the variety of Badila had lowest PDW and NUE among nine varieties under low N supply (225 kg/hm2 urea). NCo376 has low PDW and NUE under low N condition (225 kg/hm2 urea), illustrating a low NUE variety, which consisted with Hajari et al. (2014) research. It is anticipated that these results can guide the use of fertilizer in sugarcane cultivation to promote production according to the NUE of the variety and the soil N content.
One of the purposes in this study is to reduce the applied amount of N fertilizer while maintaining or reducing the yield loss, which should result in a better input–output ratio. Indeed, an increment of the application amount of N fertilizer can increase the yield, while too much N fertilizer applied will definitely increase the input and result in the decrement of the input–output ratio. Previously, excessive application of N fertilizer in China has caused acidic soil, eutrophic water, and non-point pollution. Thus, in order to reduce the risk of environmental pollution, one of the incentive policies issued by government is to subsidize farmers if one reduces the application amount of N fertilizer during cultivation. In order to obtain subsidies and good input–output ratio, farmers may reduce the use of N fertilizer.
Screening of NUE Characteristic Indicators for Sugarcane
N is a key limited factor for continuous sugarcane output, while excessive application of N will lead to many problems, such as soil acidification, eutrophication of water bodies and high cost. NUE is an important indicator of N uptake and utilization, and thus it attracts a lot of research (Foulkes et al., 2009; Oliveira et al., 2013; Jawad et al., 2017; Rajesh et al., 2017; Zhang C. et al., 2017). In these previous studies, the conventional calculation method of NUE (the total productivity or PDW divided by the fertilizer N applied) is biomass/N supplied (NUE = NUpE × NUtE) (Snyman et al., 2015), which took both N uptake efficiency (NUpE; plant N content/N supplied) and N utilization efficiency (NUtE; biomass/plant N content) into account. However, an increase in either soil or applied N could be equally important in determining NUE (Bell et al., 2014). Without understanding the effects of basic soil fertility on plants and the incremental responses of fertilizer N application, fertilizer NUE could not be reasonably assessed. The above calculation method does not take account of the background effect of N application rate of 0 kg/hm2, and may be not so suitable. To eliminate objective errors as far as possible, the calculation method of NUE adopted in this paper is that the difference between PDW with N treatment and PDW without N treatment is divided by N supply (Zhao et al., 2014).
With respect to the screening methods, Pearson’s correlation and multiple regression were used to obtain the predictive models (Pavuluri et al., 2015). Based on correlation analysis, a stepwise regression equation was established to screen the indicators and to quantify the relationship between dependent and independent variables. In Tartary buckwheat, based on correlation analysis, an optimal regression equation was built to identify eight physiological and morphological indicators (plant height, stem diameter, leaf area, root-shoot ratio, chlorophyll content, Fm, SOD activity, and NUE) (Zhang C. et al., 2017), which were also used as the screening indicators for winter wheat varieties with low N tolerance (Zhang Z.Y. et al., 2017). In rice, a combined method of stepwise regression equation and correlation analysis was used to identify five morphological and yield indicators (plant height, spikelets per panicle, seed set, 1000-grain weight, and yield per plant) to evaluate low N tolerance (Hu et al., 2015). However, in sugarcane, a stepwise regression equation was only used in the estimation of cane yield (Luo et al., 2014). In our research, principle componential analysis, correlation analysis, stepwise regression analysis and path analysis were all carried out to evaluate the physiological and agronomic parameters for the selection of characteristic indictors to predict the NUE of sugarcane.
Physiologically and genetically, NUE is a complex trait, and so far there is not an indirect selection trait in crops, which can be used for variety improvement. A better understanding of N physiology in the local crop germplasm is fundamental for genetic improvement of NUE (Bell et al., 2014). In our research, we carried out a pot- and field- experiments under low N, moderate N and high N to investigate 15 parameters of aboveground and belowground attributes, including 12 physiological parameters (SPAD, Pn, Fv/Fm, LGS, LGDH, LGOGAT, LSPC, RGS, RGDH, RGOGAT, RSPC, PNA) and three agronomic indicators (H, D, PDW), and found out LGS, SPAD, and PDW at the late elongation stage were suitable indicators for the evaluation of sugarcane NUE according to a stepwise regression equation and a linear regression equation. However, LGS was the most critical indicator, which was supported by path analysis. This is consistent with the view that GS is considered as the key regulator of NUE for maize (Oliveira et al., 2013), rice (Rajesh et al., 2017), and wheat (Zhang Z.Y. et al., 2017). However, Robinson et al. (2007) found no obvious correlation of LGS with NUE in sugarcane plantlets cultured under various N-content solutions, which may be related to the opinion that most N accumulation occurs within the 3–6 month growing period in sugarcane (Wood et al., 1996), and a later measurement in plant other than in plantlet may result in better reflection of N uptake in sugarcane. This phenomenon, i.e., weak N uptake of sugarcane in the first 3 months of the crop season, was also observed in a field experiment (Robinson et al., 2011). In addition, SPAD at the heading stage was suggested to be a good indicator for the estimation of wheat NUE by simple linear regression (Nguyen et al., 2016). Silva et al. (2012) found that SPAD values were not affected by N topdressing based on polynomial regression and simple linear correlation analyses, and there was no significant correlation between SPAD value and leaf N during the full flowering stage of Crambe. Our research found that SPAD at the late elongation stage may be another suitable indicator to predict NUE. Besides, Li (2011) thought that above-ground biomass and photosynthesis could be used as screening indicators for NUE under low N stress in sugarcane plantlets. However a weak correlation between photosynthesis at the late elongation stage and NUE was found in our research, and only plant biomass was significantly correlated with NUE.
GS is divided into two types, including dodecameric and octameric subunits. In our research, the dodecameric GS gene, GSI, was expressed in the leaf of sugarcane, which was similar to the previous report (Nogueira et al., 2005). We found that the correlation between GSI expression and LGS enzyme activity was not significant. Octameric GS is the best characterized type of GS in plants, which can be divided into GS1 and GS2 (Nogueira et al., 2005). GS1 exists in roots, stems, nodules and other plant tissues, mainly assimilating primary ammonium into glutamine for transportation and re-assimilating N released by N circulation pathway; GS2 exists in mesophyll cells and can assimilate ammonia released nitrate reduction and photorespiration (Wang et al., 2013). In many C3 plants, GS1 is generally less abundant in photosynthetic tissues, however in the leaves of C4 plants, the relatively high abundance of GS1 was enriched, which was assumed to play a key role in N metabolism (Nogueira et al., 2005). The previous researches reported that in the leaves, the GS1 activity in C4 crops sorghum represented about 70% of the total GS activity (Hirel and Gadal, 1982; Mcnally et al., 1983). In sugarcane, GS1 can be important for N primary assimilation and N re-assimilation released by protein degradation in senescing leaves (Nogueira et al., 2005; James et al., 2018). In the present study, the gene expression of GS1.b was significantly correlated with LGS enzyme activity, thus GS1.b can be a potential candidate marker gene for screening NUE at Stage 2 in sugarcane.
In maize, QTLs for various agronomic traits, dependent on N availability of soil, coincide with cytosolic GS locus on chromosome 5 (Gallais and Hirel, 2004). If we can sequence the genes encoding the presented enzymes of N metabolism and find those SNPs that are associated with the NUE, then it should greatly increase the efficiency of NUE screening in sugarcane. However, sugarcane is an 8–10 ploid (It is not clear now) crop with multiple alleles and multiple copies of genes, and the genome of modern sugarcane cultivar has not yet been deciphered. Obvious differentially expression of gene at the RNA level may not always be corresponded to sequence difference at the DNA level. What is more, N-efficient genes are quantitative traits controlled by multiple genes. At present, the key genes for N-efficient utilization that we selected for analysis are some among them, and the remaining N-efficient genes need to be further explored and studied.
Conclusion
In sum, the physiological data at Stage 2 were more suitable for the evaluation of sugarcane NUE than those at Stage 1. Among 15 indictors (H, D, SPAD, Pn, Fv/Fm, LGS, RGS, LGDH, RGDH, LGOGAT, RGOGAT, LSPC, RSPC, PDW, and NUE at Stage 2), LGS, SPAD and PDW were selected to predict NUE by PCA, correction analysis and stepwise regression equation. Based on three parameters, LGS, SPAD or PDW, a linear regression equation was built for the estimation of NUE in a field experiment. LGS was identified as the most critical indicator, and GS1.b expression was significantly correlated with LGS activity at Stage 2 in sugarcane. NUE in the low-N application rate was significantly higher than that at high-N (P < 0.05). The dominant variety ROC22 having been used in Chinese industry for more than 15 years and at present China, with excellent low-N tolerance (225 kg/hm2 urea), has high NUE. The varietiesYT94-128 and GT42 exhibited weak tolerance to low N, GT42 was more suitable for moderate N environment (450 kg/hm2 urea) and YT94-128 was identified to be more suitable for middle N and high N supply (450–675 kg/hm2 urea), while GT32 was good performing genotype for PDW and NUE under low N supply (225 kg/hm2 urea).
Author Contributions
YY, LX, and YQ conceived, designed, initiated the project, and revised and approved the final version of the manuscript. YY, SG, YJ, ZL, JL, ML, JG, and YS performed the experiments and contributed to data analysis and validation. YY wrote the manuscript.
Funding
This work was supported by the earmarked fund for the China Agricultural Research System (CARS-17).
Conflict of Interest Statement
The authors declare that the research was conducted in the absence of any commercial or financial relationships that could be construed as a potential conflict of interest.
Supplementary Material
The Supplementary Material for this article can be found online at: https://www.frontiersin.org/articles/10.3389/fpls.2019.00406/full#supplementary-material
Footnotes
References
Bell, M. J., Moody, P., Salter, B., Connellan, J., and Garside, A. L. (2014). Agronomy and Physiology of Nitrogen Use in Australian Sugarcane Crops. Final report in a review of nitrogen use efficieny in sugarcane. Indooroopilly, Sugar Research Australia Ltd.
Cao, X. C., Zhong, C., Sajid, H., Zhu, L. F., Zhang, J. H., Wu, L. H., et al. (2017). Effects of watering regime and nitrogen application rate on the photosynthetic parameters, physiological characteristics, and agronomic traits of rice. Acta Physiol. Plant 39:135. doi: 10.1007/s11738-017-2432-7
Chai, L. Y., Mubarak, H., Yang, Z. H., Yong, W., Tang, C. J., and Mirza, N. (2016). Growth, photosynthesis, and defense mechanism of antimony (Sb)-contaminated Boehmeria nivea L. Environ. Sci. Pollut. Res. Int. 23, 7470–7481. doi: 10.1007/s11356-015-5987-0
Chapman, L. S., Haysom, M., and Saffigna, P. G. (1994). The recovery of 15N from labelled urea fertilizer in crop components of sugarcane and in soil profiles. Aust. J. Agr. Res. 45, 1577–1585. doi: 10.1071/AR9941577
Chen, E. Y., Yang, Y. B., Qin, L., Zhang, H. W., Liu, B., Wang, H. L., et al. (2016). Evaluation of nitrogen efficient cultivars of foxtail millet and analysis of the related characters at seedling stage. Sci. Agric. Sin. 49, 3287–3297.
Chen, X. P., Cui, Z. L., Fan, M. S., Vitousek, P., Zhao, M., Ma, W. Q., et al. (2014). Producing more grain with lower environmental costs. Nature 514, 486–489. doi: 10.1038/nature13609
Cohan, J. P., Hannon, C., Houilliez, B., Gravoueille, J. M., Geille, A., Lampaert, E., et al. (2018). Effects of potato cultivar on the components of nitrogen use efficiency. Potato Res. 3, 231–246. doi: 10.1007/s11540-018-9371-6
Cong, X. H., Shi, F. Z., Ruan, X. M., Luo, Y. X., Ma, T. C., and Luo, Z. X. (2017). Effects of nitrogen fertilizer application rate on nitrogen use efficiency and grain yield and quality of different rice varieties. Chin. J. Appl. Ecol. 28, 1219–1226. doi: 10.13287/j.1001-9332.201704.010
Dinh, T. H., Watanabe, K., Takaragawa, H., Mai, N., and Kawamitsu, Y. (2017). Photosynthetic response and nitrogen use efficiency of sugarcane under drought stress conditions with different nitrogen application levels. Plant Prod. Sci. 20, 412–422. doi: 10.1080/1343943X.2017.1371570
Foulkes, M. J., Hawkesford, M. J., Barraclough, P. B., Holdsworth, M. J., Kerr, S., Kightley, S., et al. (2009). Identifying traits to improve the nitrogen economy of wheat: Recent advances and future prospects. Field Crops Res. 114, 329–342. doi: 10.1016/j.fcr.2009.09.005
Franco, H., Otto, R., Faroni, C., Vitti, A., and Oliveira, E. (2010). Nitrogen in sugarcane derived from fertilizer under Brazilian field conditions. Field Crops Res. 121, 29–41. doi: 10.1016/j.fcr.2010.11.011
Gallais, A., and Hirel, B. (2004). An approach to the genetics of nitrogen use efficiency in maize. J. Exp. Bot. 55, 295–306. doi: 10.1093/jxb/erh006
Gopalasundaram, P., Bhaskaran, A., and Rakkiyappan, P. (2012). Integrated nutrient management in sugarcane. Sugar Tech. 14, 3–20. doi: 10.1007/s12355-011-0097-x
Groat, R. G., and Vance, C. P. (1981). Root nodule enzymes of ammonia assimilation in alfalfa (Medicago sativa L.) developmental patterns and response to applied nitrogen. Plant Physiol. 67, 1198–1203. doi: 10.1104/pp.67.6.1198
Hajari, E., Snyman, S. J., and Watt, M. P. (2014). Inorganic nitrogen uptake kinetics of sugarcane (Saccharum spp.) varieties under in vitro conditions with varying N supply. Plant Cell Tiss. Org. 117, 361–371. doi: 10.1007/s11240-014-0445-0
Hirel, B., Andrieu, B., Valadie, R. M. H., Renard, S., Quilleré, I., Chelle, M., et al. (2005). Physiology of maize II: Identification of physiological markers representative of the nitrogen status of maize (Zea mays) leaves during grain filling. Physiol. Plant. 124, 178–188. doi: 10.1111/j.1399-3054.2005.00511.x
Hirel, B., Bertin, P., Quilleré, I., Bourdoncle, W., Attagnant, C., Dellay, C., et al. (2001). Towards a better understanding of the genetic and physiological basis for nitrogen use efficiency in maize. Plant Physiol. 125, 1258–1270. doi: 10.1104/pp.125.3.1258
Hirel, B., and Gadal, P. (1982). Glutamine synthetase isoforms in leaves of a C4 plant: Sorghum vulgare. Physiol. Plant. 54, 69–74. doi: 10.1111/j.1399-3054.1982.tb00579.x
Hu, B. L., Li, X., Wan, Y., Qiu, Z. H., Nie, Y. Y., and Xie, J. K. (2015). Index screening and comprehensive evaluation of phenotypic traits of low nitrogen tolerance using BILs populationg derived from Dongxiang wild rice (Oryza rufipogon Griff.). Chin. J. Appl. Ecol. 26, 2346–2352.
Islam, M. S., Yang, X. P., Sood, S., Comstock, J. C., and Wang, J. P. (2018). Molecular characterization of genetic basis of sugarcane Yellow Leaf Virus (SCYLV) resistance in Saccharum spp.hybrid. Plant Breed. 137, 598–604. doi: 10.1111/pbr.12614
James, D., Borphukan, B., Fartyal, D., Ram, B., Singh, J., Manna, M., et al. (2018). Concurrent overexpression of OsGS1;1 and OsGS2 genes in transgenic rice (Oryza sativa L.): impact on tolerance to abiotic stresses. Front. Plant Sci. 9:786. doi: 10.3389/fpls.2018.00786
Jawad, M. S., Syed, A. H. B., Zeng, J. B., Quan, X. Y., Essa, A., Noor, M., et al. (2017). Nitrogen (N) metabolism related enzyme activities, cell ultrastructure and nutrient contents as affected by N level and barley genotype. J. Integr. Agr. 16, 190–198. doi: 10.1016/S2095-3119(15)61308-9
Ju, C. X., Buresh, R. J., Wang, Z. Q., Zhang, H., Liu, L. J., Yang, J. C., et al. (2015). Root and shoot traits for rice varieties with higher grain yield and higher nitrogen use efficiency at lower nitrogen rates application. Field Crops Res. 175, 47–55. doi: 10.1016/j.fcr.2015.02.007
Ju, X. T., Xing, G. X., Chen, X. P., Zhang, S. L., Zhang, L. J., Liu, X. J., et al. (2009). Reducing environmental risk by improving N management in intensive Chinese agricultural systems. Proc. Natl. Acad. Sci. U.S.A. 106, 3041–3046. doi: 10.1073/pnas.0813417106
Kingston, G., Anink, M. C., and Allen, D. (2008). Acquisition of nitrogen by ratoon crops of sugarcane as influenced by waterlogging and split applications. Proc. Conf. Aust. Soc. Sugar Cane Technol. 30, 202–211.
Kumara, A. D. S., and Bandara, D. C. (2001). Influence of nitrogen application and varietal differences on selected physiological parameters of sugarcane. Trop. Agric. Res. 13, 220–230.
Ladha, J. K., Pathak, H., Krupnik, T. J., Six, J., and Kessel, C. V. (2005). Efficiency of fertilizer nitrogen in cereal production: retrospects and prospects. Adv. Agron. 87, 85–156. doi: 10.1016/S0065-2113(05)87003-8
Lam, H. M., Coschigano, K. T., Oliveira, I. C., Melo-Oliveira, R., and Coruzzi, G. M. (1996). The molecular-genetics of nitrogen assimilation into amino acids in higher plants. Annu. Rev. Plant Physiol. Plant Mol. Biol. 47, 569–593. doi: 10.1146/annurev.arplant.47.1.569
Laukkanen, H., and Sarjala, T. (1997). Effect of exogenous polyamines on Scots pine callus in vitro. J. Plant Physiol. 150, 167–172. doi: 10.1016/S0176-1617(97)80197-6
Li, W. B. (2011). Screenning for Higher Nutrients Use Efficiency of Sugarcane Germplasm. thesis, Guangxi Univercity.
Li, X., Huang, Q. Y., Huang, H. R., Wang, L. W., Zhou, Z. F., Zhou, H., et al. (2015). Evaluation of different sugarcane clones under low nitrogen stress. Bangladesh J. Bot. 44, 821–825.
Li, Y. R., Song, X. P., Wu, J. M., Li, C. N., Liang, Q., Liu, X. H., et al. (2016). Sugar industry and improved sugarcane farming technologies in china. Sugar Tech. 18, 603–611. doi: 10.1007/s12355-016-0480-8
Ling, H., Wu, Q. B., Guo, J. L., Xu, L. P., and Que, Y. X. (2014). Comprehensive selection of reference genes for gene expression normalization in sugarcane by real time quantitative RT-PCR. PLoS One 9:e97469. doi: 10.1371/journal.pone.0097469
Livak, K. J., and Schmittgen, T. D. (2001). Analysis of relative gene expression data using real-time quantitative PCR and the 2-ΔΔCt method. Methods 25, 402–408. doi: 10.1006/meth.2001.1262
Luo, J., Pan, Y. B., Xu, L. P., Zhang, Y. Y., Zhang, H., Chen, R. K., et al. (2014). Photosynthetic and canopy characteristics of different varieties at the early elongation stage and their relationships with the cane yield in sugarcane. Sci. World J. 2014, 1–9. doi: 10.1155/2014/707095
Mcnally, S. F., Hirel, B., Gadal, P., Mann, A. F., and Stewart, G. R. (1983). Glutamine synthetases of higher plants: evidence for a specific isoform content related to their possible physiological role and their compartmentation within the leaf. Plant Physiol. 72, 22–25. doi: 10.1104/pp.72.1.22
Meinzer, F. C., and Zhu, J. (1998). Nitrogen stress reduces the efficiency of the C4 CO2 concentrating system, and therefore quantum yield, in Saccharum (sugarcane) species. J. Exp. Bot. 49, 1227–1234. doi: 10.1093/jexbot/49.324.1227
Meyer, J. H., Schumann, A. W., Wood, R. A., Nixon, D. J., and Berg, M. V. D. (2007). Recent advances to improve nitrogen use efficiency of sugarcane in the South African sugar industry. Proc. Int. Soc. Sugar Cane Technol. 26, 238–246.
Morey, K. J., Ortega, J. L., and Sengupta-Gopalan, C. (2002). Cytosolic glutamine synthetase in soybean is encoded by a multigene family, and the members are regulated in an organ-specific and developmental manner. Plant Physiol. 128, 182–193. doi: 10.1104/pp.010380
Muchow, R. C., Robertson, M. J., Wood, A. W., and Keating, B. A. (1996). Effect of nitrogen on the time-course of sucrose accumulation in sugarcane. Field Crops Res. 47, 143–153. doi: 10.1016/0378-4290(96)00022-6
Nguyen, G. N., Panozzo, J., Spangenberg, G., and Kant, S. (2016). Phenotyping approaches to evaluate nitrogen-use efficiency related traits of diverse wheat varieties under field conditions. Crop Pasture Sci. 67, 1139–1148. doi: 10.1071/CP16173
Nogueira, E. D. M., Olivares, F. L., Japiassu, J. C., Vilar, C., Vinagre, F., Baldani, J. I., et al. (2005). Characterization of glutamine synthetase genes in sugarcane genotypes with different rates of biological nitrogen fixation. Plant Sci. 169, 819–832. doi: 10.1016/j.plantsci.2005.05.031
Oliveira, L. R. D., Miranda, G. V., Delima, R. O., Fritsche Neto, R., and Galvão, J. C. C. (2013). Nitrogen uptake and utilization efficiency and enzymatic activity in maize genotypes. Rev. Ciênc. Agron. 44, 614–621. doi: 10.1590/S1806-66902013000300025
Pavuluri, K., Chim, B. K., Griffey, C. A., Reiter, M. S., Balota, M., and Thomason, W. E. (2015). Canopy spectral reflectance can predict grain nitrogen use efficiency in soft red winter wheat. Precis. Agric. 16, 405–424. doi: 10.1007/s11119-014-9385-2
Rajesh, K., Thatikunta, R., and Naik, D. S. (2017). Enzymatic study of glutamine synthetase activity for validating nitrogen use efficiency in rice genotypes. Int. J. Pure App. Biosci. 5, 1416–1423. doi: 10.18782/2320-7051.5213
Robinson, N., Brackin, R., Vinall, K., Soper, F., Holst, J., Gamage, H., et al. (2011). Nitrate paradigm does not hold up for sugarcane. PLoS One 6:e19045. doi: 10.1371/journal.pone.0019045
Robinson, N., Fletcher, A., Whan, A., Critchley, C., von Wirén, N., Lakshmanan, P., et al. (2007). Sugarcane genotypes differ in internal nitrogen use efficiency. Funct. Plant Biol. 34, 1122–1129. doi: 10.1071/FP07183
Sharma, A., and Chandra, A. (2018). Identification of new leuconostoc species responsible for post-harvest sucrose losses in sugarcane. Sugar Tech. 20, 492–496. doi: 10.1007/s12355-017-0562-2
Shu, S. R., Tang, Y. Y., Yuan, Y. H., Sun, J., Zhong, M., and Guo, S. R. (2016). The role of 24-epibrassinolide in the regulation of photosynthetic characteristics and nitrogen metabolism of tomato seedlings under a combined low temperature and weak light stress. Plant Physiol. Biochem. 107, 344–353. doi: 10.1016/j.plaphy.2016.06.021
Silva, T. R. B. D., Reis, A. C. D. S., and Maciel, C. D. D. G. (2012). Relationship between chlorophyll meter readings and total N in crambe leaves as affected by nitrogen topdressing. Ind. Crop. Prod. 39, 135–138. doi: 10.1016/j.indcrop.2012.02.008
Snyman, S. J., Hajari, E., Watt, M. P., Lu, Y., and Kridl, J. C. (2015). Improved nitrogen use efficiency in transgenic sugarcane: phenotypic assessment in a pot trial under low nitrogen conditions. Plant Cell Rep. 34, 667–669. doi: 10.1007/s00299-015-1768-y
Wang, G. L., Ding, G. D., Li, L., Cai, H. M., Ye, X. S., Zou, J., et al. (2014). Identification and characterization of improved nitrogen efficiency in interspecific hybridized new-type Brassica napus. Ann. Bot. 114, 549–559. doi: 10.1093/aob/mcu135
Wang, X. C., Wang, X. H., Xiong, S. P., Ma, X. M., Ding, S. J., Wu, K. Y., et al. (2015). Differences in nitrogen efficiency and nitrogen metabolism of wheat varieties under different nitrogen levels. Sci. Agric. Sin. 48, 2569–2579.
Wang, Y. L., Fu, B., Pan, L. F., Chen, L. M., Fu, X. H., and Li, K. Z. (2013). Overexpression of Arabidopsis Dof1, GS1 and GS2 enhanced nitrogen assimilation in transgenic tobacco grown under low-nitrogen conditions. Plant Mol. Biol. Rep. 31, 886–900. doi: 10.1007/s11105-013-0561-8
Weng, B. Q., Zheng, X. L., Zhao, T., Xu, G. Z., Wang, J. H., and Ye, H. L. (2014). Analyses on protein content and enzyme activity involved in nitrogen metabolism of peanut (Arachis hypogaea) leaf at different growth stages. J. Plant Resour. Environ. 23, 65–70.
Wood, A. W., Muchow, R. C., and Robertson, M. J. (1996). Growth of sugarcane under high input conditions in tropical Australia. III. Accumulation, partitioning and use of nitrogen. Field Crops Res. 48, 223–233. doi: 10.1016/S0378-4290(96)00043-3
Xu, G., Fan, X., and Miller, A. J. (2012). Plant nitrogen assimilation and use efficiency. Annu. Rev. Plant Biol. 63, 153–182. doi: 10.1146/annurev-arplant-042811-105532
Yang, L., Qu, H. P., Liang, Y. J., Liu, X. H., Yang, L. T., Wang, M., et al. (2014). The research progress of nitrogen physiology in sugarcane. Soil Fertil. Sci. Chin. 6, 1–7.
Yang, R. Z., Tan, Y. M., Wang, L. W., Liu, L. M., Tan, F., and Li, Y. R. (2006). Evaluation of low nitrogen stress for sugarcane. Southwest China J. Agr. Sci. 19, 1132–1138.
Zhang, C., Zhang, Y. Q., Lu, Z. J., and Liu, L. Q. (2017). Screening Fagopyrum tararicum genotypes tolerant to low nitrogen stress at seedling stage and its evaluating indices. Acta Agron. Sin. 43, 1205–1215. doi: 10.3724/SP.J.1006.2017.01205
Zhang, Z. Y., Xiong, S. P., Wei, Y. H., Meng, X. D., Wang, X. C., and Ma, X. M. (2017). The role of glutamine synthetase isozymes in enhancing nitrogen use efficiency of N-efficient winter wheat. Sci. Rep. 7:1000. doi: 10.1038/s41598-017-01071-1
Zhao, D., Glaz, B., and Comstock, J. C. (2013). Sugarcane leaf photosynthesis and growth characters during development of water-deficit stress. Crop Sci. 53, 1066–1075. doi: 10.2135/cropsci2012.09.0554
Keywords: sugarcane, variety, physiological, agronomic, indicators, nitrogen use efficiency, screening, nitrogen fertilizer application
Citation: Yang Y, Gao S, Jiang Y, Lin Z, Luo J, Li M, Guo J, Su Y, Xu L and Que Y (2019) The Physiological and Agronomic Responses to Nitrogen Dosage in Different Sugarcane Varieties. Front. Plant Sci. 10:406. doi: 10.3389/fpls.2019.00406
Received: 04 August 2018; Accepted: 18 March 2019;
Published: 05 April 2019.
Edited by:
Susana M. P. Carvalho, Universidade do Porto, PortugalReviewed by:
Graham Bonnett, Commonwealth Scientific and Industrial Research Organisation (CSIRO), AustraliaLuiz-Eduardo Del-Bem, Federal University of Minas Gerais, Brazil
Copyright © 2019 Yang, Gao, Jiang, Lin, Luo, Li, Guo, Su, Xu and Que. This is an open-access article distributed under the terms of the Creative Commons Attribution License (CC BY). The use, distribution or reproduction in other forums is permitted, provided the original author(s) and the copyright owner(s) are credited and that the original publication in this journal is cited, in accordance with accepted academic practice. No use, distribution or reproduction is permitted which does not comply with these terms.
*Correspondence: Liping Xu, eGxwbWFpbEAxMjYuY29t Youxiong Que, cXVleW91eGlvbmdAMTI2LmNvbQ==