 Francesca Desiderio1*
 Leila Zarei2Stefania Licciardello3
 Kianoosh Cheghamirza2Ezatollah Farshadfar2Nino Virzi3Fabiola Sciacca3
 Paolo Bagnaresi1
 Raffaella Battaglia1
 Davide Guerra1
 Massimo Palumbo3
 Luigi Cattivelli1
 Elisabetta Mazzucotelli1*
- 1Council for Agricultural Research and Economics, Research Centre for Genomics and Bioinformatics, Fiorenzuola d'Arda, Italy
- 2Department of Agronomy and Plant Breeding, Razi University, Kermanshah, Iran
- 3Council for Agricultural Research and Economics, Research Centre for Cereal and Industrial Crops, Acireale, Italy
Kernel size and shape are important parameters determining the wheat profitability, being main determinants of yield and its technological quality. In this study, a segregating population of 118 recombinant inbred lines, derived from a cross between the Iranian durum landrace accession “Iran_249” and the Iranian durum cultivar “Zardak”, was used to investigate durum wheat kernel morphology factors and their relationships with kernel weight, and to map the corresponding QTLs. A high density genetic map, based on wheat 90k iSelect Infinium SNP assay, comprising 6,195 markers, was developed and used to perform the QTL analysis for kernel length and width, traits related to kernel shape and weight, and heading date, using phenotypic data from three environments. Overall, a total of 31 different QTLs and 9 QTL interactions for kernel size, and 21 different QTLs and 5 QTL interactions for kernel shape were identified. The landrace Iran_249 contributed the allele with positive effect for most of the QTLs related to kernel length and kernel weight suggesting that the landrace might have considerable potential toward enhancing the existing gene pool for grain shape and size traits and for further yield improvement in wheat. The correlation among traits and co-localization of corresponding QTLs permitted to define 11 clusters suggesting causal relationships between simplest kernel size trait, like kernel length and width, and more complex secondary trait, like kernel shape and weight related traits. Lastly, the recent release of the T. durum reference genome sequence allowed to define the physical interval of our QTL/clusters and to hypothesize novel candidate genes inspecting the gene content of the genomic regions associated to target traits.
Introduction
Durum wheat (T. turgidum L. var. durum) is a major crop in Mediterranean regions with a total of about 14 million hectares cultivated worldwide. Commercial wheat cultivars have a rather narrow genetic base (Van de Wouw et al., 2010) therefore investigation and exploitation of new genetic diversity is a fundamental requirement for modern breeding programs. Landraces, the locally adapted germplasm as result of the natural and farmers' selection, represent interesting genetic materials, they usually exhibit a high genetic diversity with relevant allele variations including rare variants and/or potentially new alleles (Lopes et al., 2015).
The development of high yielding wheat cultivars is a major objective of modern breeding programs. Since grain yield is a complex trait, it is often dissected in two main components that are kernel weight, expressed as 1,000 kernel weight (TKW), and number of seeds per square meter resulting from the number of spikes per unit area and number of kernels per spike. Kernel dimensions, as kernel length (KL) and kernel width (KW), greatly influence the TKW. Moreover, especially for durum wheat, kernel size and shape also influence the test weight (TW), which, in turn, has an effect on semolina yield (Gegas et al., 2010). For these reasons, increasing TKW and TW are main targets in wheat breeding, in addition to total yield. Larger kernels not only impact on grain yield but also have favorable effects on seedling vigor and early growth (Peng et al., 2003). These traits are quantitative and complex, highly influenced by the environment (E) and display high Genotype × Environment interactions (GxE). Modern durum wheat varieties exhibit large kernels and rather uniform seed size, because of domestication and breeding for increased yield and TW. On the contrary, durum wheat landraces show a much greater variability for kernel size and shape (Moore, 2015; Liu et al., 2017).
The understanding of the genetic and molecular determinants of grain size and grain shape might provide valuable information on genetic diversity and corresponding markers to be used for improving grain yield. The most advanced genetic knowledge on the genetic factors controlling grain size and shape is available in rice where many genes have been functionally characterized. An update about genetic pathways controlling kernel size and weight in rice and Arabidopsis has been recently reported in Li and Yang (2017). Some genes (for instance: D1, D61, and SRS5) have pleiotropic effects on organ growth, including a reduction in seed size in the corresponding mutants, due to alteration of phytohormones signaling (Yamamuro et al., 2000; Ashikari et al., 2005; Segami et al., 2012). Others (for instance: GW2, GS2, GS5, GLW7, GIF1) appear to specifically affect grain morphology (Song et al., 2007; Wang et al., 2008; Li et al., 2011; Hu et al., 2016; Si et al., 2016). At the cellular level, increase of the grain size could be a consequence of an increase in cell number, such as for the activity of D1 and GS5, or of cell size expansion, as for the role of D61 and GLW7, or of both as observed for GS2.
The direct translation of genetic knowledge gained from rice to wheat allowed the identification of several orthologs. As in rice, TaGW2, encoding an E3 RING ligase (Su et al., 2011; Simmonds et al., 2016), is a negative regulator of grain size and weight (Hong et al., 2014), and showed natural allelic variation in extensive studies in both tetraploid and hexaploid wheat (Su et al., 2011; Qin et al., 2014; Jaiswal et al., 2015; Simmonds et al., 2016). Similarly, allelic variation at TaGS-D1, the wheat homolog of the rice GS3 (Wang et al., 2012), and at TaTGW6, an enzyme related to the auxin metabolism (Hanif et al., 2015; Hu et al., 2016), showed main effects on TKW and kernel size. TaGS5 is a positive regulator of grain size (Ma et al., 2016) and TaCwi, homolog of GIF1, encodes a cell wall invertase with effects on TKW (Jiang et al., 2015). Other genes have been found in wheat as related to kernel weight, they include TaSAP-A1, TaGS1a, 6-SFT-A2, TaSus1, and TaSus2 (Jiang et al., 2011; Chang et al., 2013; Guo et al., 2013; Hou et al., 2014; Yue et al., 2015). All these genes except TaSAP-A1 have specific roles during the grain filling.
Many studies have been conducted to identify quantitative trait loci (QTL) associated to kernel traits, TKW above all, but also parameters related to kernel size in common wheat (Sun et al., 2008; Gegas et al., 2010; Ramya et al., 2010; Tsilo et al., 2010; Prashant et al., 2012; Maphosa et al., 2014; Rasheed et al., 2014; Williams and Sorrells, 2014; Wu et al., 2015; Kumar et al., 2016; Cheng et al., 2017; Su et al., 2018; Würschum et al., 2018). In these studies, some QTLs for TKW co-localized with QTL of kernel size, thus confirming also at genetic level the positive correlation between grain size and grain weight. Furthermore, a co-location of yield related traits was also found with QTL for flowering time and plant height suggesting pleiotropic effects on fundamental agronomic traits (Gegas et al., 2010; Bogard et al., 2011). In tetraploid wheat, only two studies unravel the genetic bases of kernel size (Russo et al., 2014; Golan et al., 2015), but much more identified regions related to kernel weight (Maccaferri et al., 2016; Kidane et al., 2017; Roncallo et al., 2017; Soriano et al., 2017; Mangini et al., 2018). All findings have been collected by a global metaQTL analysis which summarized and projected all known QTLs on the durum wheat reference genome providing a tool for comparison between QTLs and candidate genes (cv Svevo; Maccaferri et al., 2019).
The current study was designed to identify novel regions of the durum wheat genome controlling kernel related traits in a RIL population derived from a cross between the Iranian cultivar Zardak and the Iranian landrace Iran_249. For this purpose, we developed a high-density genetic map, and conducted a QTL mapping whose results were physically mapped on the recently published durum wheat reference genome (Maccaferri et al., 2019). The results provide the physical position of QTLs directly on the durum wheat pseudomolecules and a list of candidate genes laying within the QTL confidential regions.
Materials and Methods
Genetic Materials
A population of 118 F7−8 RILs, derived from a cross between the landrace accession “Iran_249” originated from Western Iran, and the old cultivar “Zardak” from the Iranian Kermanshah province, was used in the current study. A leaf of each line was ground using the Retsch_MM300 Mixer Mill instrument, then the DNA was isolated and purified with the Wizard_Magnetic 96 DNA Plant System (Promega) following the manufacturer's instructions.
Field Experiments and Phenotypic Evaluation
Seed increase was done in the experimental farm of the CREA-Research Centre for Genomics and Bioinformatics in Fiorenzuola d'Arda (Italy). The RIL population and the two parents were evaluated in Libertinia (Sicily island, southern Italy) during the 2013–2014 (L14) and 2014–2015 (L15) seasons, and in Fiorenzuola d'Arda (northern Italy) in 2014–2015 (F15), thus providing phenotypic data for three environments.
In each environment, a randomized complete block design with three replications was used; the experimental units consisted of 1.8 m2 in Libertinia and 3 m2 plot in Fiorenzuola d'Arda. Trials were fertilized following the standard agronomic practices for each location, weeds were chemically controlled. Supplementary Table 1 reports the details about field experimental conditions and relevant environmental parameters. Heading date (HD) was recorded as number of days from the April 1st to the time when 50% of tillers within a plot have spike emerged from the flag leaf sheet. Test Weight (TW) was recorded for each plot/environment. After several months of storage at constant temperature and humidity, three samples of 100 kernels were randomly chosen from the seed bulk of each plot/experiment and weighted to calculate the corresponding Thousand Kernel Weight (TKW). One 100 kernel punch for each plot/experiment was randomly sampled out and used for batch scanner imaging. Then through image analysis by the software Winseedle pro1 (2011 Regents Instruments Inc., Canada) kernels were measured for several descriptors of seed morphology as reported in Table 1.
Table 1. Kernel morphological traits evaluated through image analysis by WinSeedle software.
Statistical Analysis of Phenotypic Data
For each environment and trait, the frequency distribution of the RIL phenotypic data was evaluated and analysis of variance (ANOVA) was performed. Overall data were analyzed by fitting a model by the REstricted Maximum Likelihood (REML) method to assess significance of Genotype (G), environment (E), and Genotype × Environment interaction (GxE). Broad sense heritability (H) was calculated according to Nyquist (1991): H = /[ + /E) + /rE)], where is the genetic variance, is the GxE interaction variance, is the residual variance, E is the number of environments, and r the number of replicates. was calculated as (MSG – MSGxE)/n where MSG is the genotype mean square and MSGxE is the mean square of GxE. All these statistical analyses were conducted by using JMP version 7 software (SAS Institute Inc., 2007).
Pearson's correlation coefficients were calculated for all trait combinations based on data recorded for each year/environment, and using overall data across the three environments using the standard cor.test function in R. The significance of correlations was assessed with the t-test implemented in the cor.test function.
For each trait, QTL analysis was performed based on mean values of the three replicates for each single environment.
Molecular Marker Analysis
Both simple sequence repeat (SSR) and single-nucleotide polymorphism (SNP) molecular markers were used to analyze the parental lines and the RILs.
The parental lines were screened with a total of 360 SSR markers selected from the published wheat map (Röder et al., 1998; Eujayl et al., 2002; Gupta et al., 2002; Guyomarc'h et al., 2002; Sourdille et al., 2003; Peng and Lapitan, 2005; Song et al., 2005; Xue et al., 2008). The PCR and fragment analysis were carried out as described in Desiderio et al. (2014).
Genotyping for SNPs was performed at the Trait Genetics Laboratory (Gatersleben, Germany) with the Infinium iSelect 90K wheat SNP BeadChip array (Illumina Inc., San Diego, USA), which contains 81,587 functional markers (Wang et al., 2014).
Linkage Analysis
Linkage analysis was performed using CarthaGene software (de Givry et al., 2005) with a logarithm of odds (LOD) score threshold of 9.0, maximum distance of 20 cM and the Kosambi mapping function to calculate map distances (Kosambi, 1944). The linkage groups obtained were assigned to chromosomes by comparing markers of the generated maps to the high-density consensus durum map (Maccaferri et al., 2015). Within each linkage group, the best order of markers and the genetic distances were established using different CarthaGene functions: “build,” “greedy,” “flips,” and “polish.” All mapped markers were tested for the expected 1:1 segregation ratio using a Chi squared (χ2) goodness-of-fit test.
QTL Analysis
QTL mapping was conducted with the R/qtl module of the R statistical computing package (Broman et al., 2003). For each trait, an initial QTL scan was performed using simple interval mapping with a 1-cM step (Lander and Botstein, 1989) and the position of the highest LOD was recorded. A genome-wide significance level of 5% was calculated after 1,000 permutations (Churchill and Doerge, 1994). The position and the effect of the QTL were then estimated using the multiple imputation method (Sen and Churchill, 2001) by executing the “sim.geno” command, followed by the “fitqtl” command. To search additional QTLs, the “addqtl” command was used. If a second QTL was detected, “fitqtl” was used to test a model containing both QTLs and their interaction effect. If both QTL remained significant, the “refineqtl” command was used to re-estimate the QTL positions based on the full model including both QTLs. QTL interactions were analyzed and the significant locus combinations are reported based on F value. The additive effects of QTLs were estimated as half the difference between the phenotypic values of the respective homozygotes.
The confidence interval (CI) of each QTL was determined as proposed by Darvasi and Soller (1997). The QTLs were named according to the rule “trait.gb + chromosome.locus number.”
Analysis of Physical Regions Carrying QTLs Related to Kernel Traits
The most significant QTLs identified in the present study were projected on the T. durum reference genome sequence (cv. Svevo) (Maccaferri et al., 2019). Peak markers and flanking markers corresponding to the CIs were located on the reference genome based on the Blast matches of the corresponding SNP's nucleotide sequences. Whenever the marker was a singleton and/or found similarity hit within the unassembled fraction of the Svevo genome (chromosome 0), the marker was searched on the consensus durum map (Maccaferri et al., 2015), the cosegregant markers from the consensus were identified and the corresponding sequence localized by Blast on the Svevo genome. This approach was used to roughly locate the QTLs on the reference genome for three different comparison analyses. Firstly, the likely position of the identified QTLs was compared with that of durum wheat homologs of common wheat and rice cloned genes whose function is known to be associated to kernel related traits. Secondly, the physical position of the identified QTLs was compared with QTLs previously genetically mapped and published in tetraploid wheat for the same traits and recently anchored to the durum reference genome by Maccaferri et al. (2019). Finally, the physical region underlined by the most significant QTLs was inspected to identify candidate genes, their functional annotation, and the expression data available for the homologous genes in bread wheat.
Toward this end, durum genes were annotated via blast2GOPRO (Götz et al., 2008) using as queries proteins run against viridiplantae database (NCBI non-redundant protein dataset; available at FIGSHARE (https://figshare.com/s/2629b4b8166217890971).
Next, best reciprocal hit (BRH) blasts of durum wheat (cv. Svevo) CDS queries (longest representative isoforms for each gene in the physical region of interest) were conducted against a database consisting of bread wheat (Chinese Spring) CDS (longest representative isoforms for each gene; only genes located in the chromosome homologous to Svevo's query genes chromosome). The bread wheat best hits (filtered for a percent identity threshold of at least 90%) were subsequently used as queries for blasts (blast2; version 2.2.26) against the WheatExp database at https://wheat.pw.usda.gov/WheatExp/. Blasts were fine-tuned by testing several parameters (gapped vs. ungapped blasts and various score penalties for gap opening and gap extension). Finally, blast results were again filtered for a minimum identity of 90%. The expected chromosome location of hits as well as the consistency of their annotation with respect to original Svevo queries annotated with blast2GOPRO was evaluated. To be able to compare the expression profile of all the genes mapping under a specific QTL and to represent these data into a heat map, the z-scores of the FPKM log mean values have been calculated.
Results
Phenotypic Evaluation
The two parents, the cultivar Zardak and the landrace Iran_249, and the RILs were evaluated for traits related to kernel morphology and size (Table 1), grain weight, and for heading time in 3 years × environment combinations (Libertinia 2014 -L14- and 2015 -L15- Fiorenzuola d'Arda 2015 -F15).
Mean values of Zardak, Iran_249, and RILs across the three environments are reported in Table 2, single environment data are in Supplementary Table 2. The two parents showed significant differences for kernel length, perimeter, area and shape related traits (WL, FC) in all environments, while for TKW only in L15. In detail, kernels of Iran_249 were longer and not significantly but generally narrower and heavier compared to those of Zardak cv (Figure 1; Table 2), while kernels of Zardak had a higher degree of roundness (FC, WL) and a higher test weight, as a consequence. Data about the RILs population showed a continuous variation and a normal distribution for most of the traits, suggesting a polygenic inheritance (Figure 2). For kernel width, transgressive segregation was observed in both directions, while for kernel length, perimeter and area only RILs with kernels shorter/smaller than the worse parent were present within the population. Consequently, RILs producing kernels with a roundness degree higher than the better parent were reported. Interestingly, some RILs showed values higher than the better parent for TKW, and TW. Overall, this evidence suggests the presence of superior QTL alleles for TKW and TW in both parents, likely supported by larger kernels and higher grain roundness.
Table 2. Summary of phenotypic data and variation parameters for parental lines and RILs for kernel shape (C, curvature; WL, width length ratio; FC, Form coefficient), size (L, length; W, width; P, perimeter; A, area), and weight related traits (TKW, Thousand kernel weight; TW, Test weight), and heading date (HD).
Figure 1. Kernel morphology of Iran_249 (a) and Zardak (b).
Figure 2. Frequency distribution for all the traits analyzed in this study. The normal distribution was represented as solid red line. Mean data for each environment (A) L14, (B) L15, and (C) F15 have been reported.
Variation for the phenotypic measures was assessed by ANOVA for each single environment and for the overall dataset, evaluating the effects of G, E and GxE (Table 2; Supplementary Table 3). In each single environment the variability for replications was significant for almost all traits, but much more of the variation was attributed to the genotype effect. Considering overall data across the three environments, all effects were significant for all traits. However, although the strong environment effect, the genotype variability was higher than GxE component for all traits, with the exception of the TW. As a consequence, high values of broad sense heritability were obtained for kernel size and shape related traits, ranging from 0.65 to 0.94, with generally lowest values for kernel width and curvature, and highest values for kernel length (Table 2). Moderate to low heritability values were calculated for TKW and TW (0.62 and 0.34, respectively). Finally, a high heritability (0.88) was found for heading date. Based on the highly significant GxE interaction showed by some traits, QTLs were determined using the mean values of the three replicates for each environment.
Pearson's correlation coefficients between all possible couple of target traits were calculated based on both single-environment data (Supplementary Table 4; Supplementary Figure 1), and overall dataset of the three environments (Supplementary Table 4; Figure 3). As expected, some traits were inherently correlated, like perimeter vs. length (r = 0.97), and WL vs. FC (r = 0.99). TKW and TW showed a high positive correlation with kernel width (r = 0.98 and r = 0.7, respectively), and kernel roundness as showed by WL (r = 0.88 and 0.82) and FC traits (r = 0.88 and r = 0.83), while they had negative correlations with seed length (r = −0.66 and −0.8, respectively). However, considering single environment data, a significant positive correlation was found between L and TKW in L15. Finally, HD was negatively correlated to L and P (r-values ranging from −0.6 to −0.7) and positively associated to traits about kernel width (W, WL, r = 0.88 and 0.85, respectively), and kernel weight related traits (TKW: r = 0.93, TW: r = 0.68).
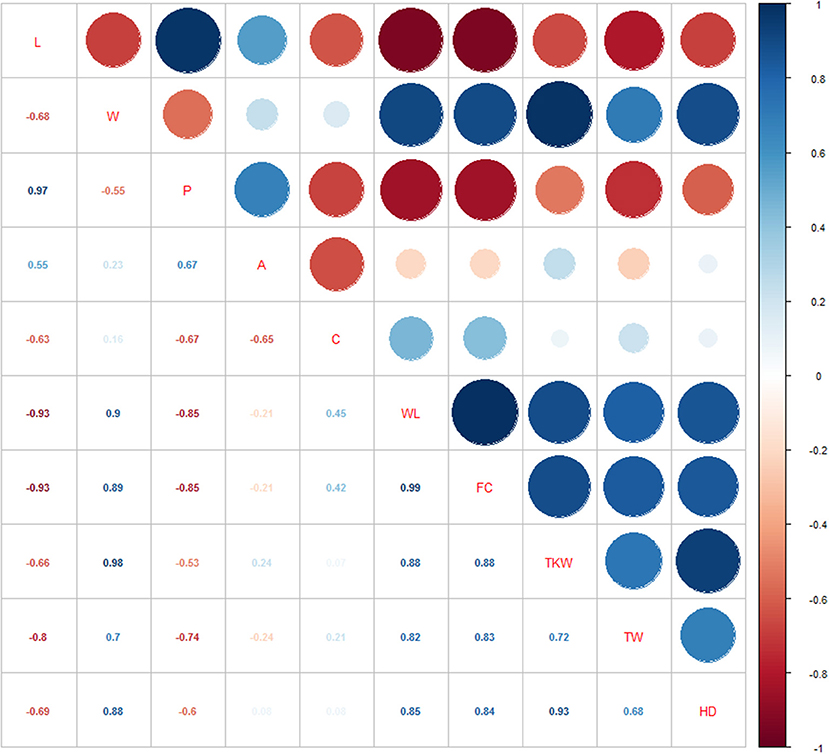
Figure 3. Pearson correlations among the phenotypic traits analyzed using overall data.
Molecular Analysis and Map Construction
The Zardak × Iran_249 genetic linkage map integrated both SSR and SNP markers. Out of 360 SSRs used to screen the parental lines, 87 (24%) were polymorphic between parents and were tested on the whole segregating population. Within the 81,587 markers of the 90k iSelect Infinium, 5,591 SNPs failed the hybridization and were discarded, while 8,220 (10.8%) were polymorphic between the two parents. Within the polymorphic marker set, we further removed markers showing more than 10% missing values and markers with a minor allele frequency (MAF) significantly deviating from the expected 1:1 ratio (MAF < 0.3). After these checks, 6,452 high-quality SNP markers represented the valuable SNP data set. On the overall, 6,539 polymorphic loci (comprising 87 SSR and 6,452 SNP markers) were therefore identified and used for the construction of the molecular marker map. After elimination of the unlinked loci, the genotype data relating to 6,195 informative marker loci were assembled into 18 linkage groups corresponding to the 14 durum wheat chromosomes, for a total of 977 unique loci (Table 3 and Supplementary Table 5). Two linkage groups were identified for chromosomes 1B, 2B, 6A and 6B.
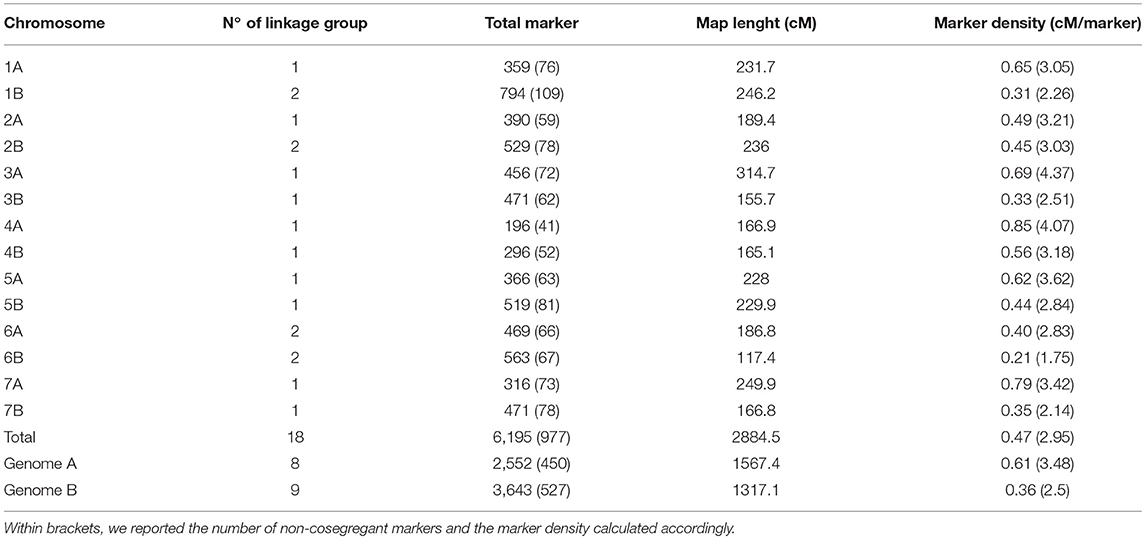
Table 3. Distribution of molecular markers in the chromosomes and in the homeologous groups of the Zardak × Iran249 map.
The overall length of the map was 2,884.5 cM with individual chromosome genetic length ranging from 314.7 cM (chromosome 3A) to 117.4 cM (chromosome 6B) and average chromosome length of 206.04 cM. The total number of mapped loci per chromosome ranged from 196 (chromosome 4A) to 794 (chromosome 1B) with an average of 442.5 loci. The genome-wide marker density was 0.47 cM, varying from 0.21 cM (chromosome 6B) to 0.85 cM (chromosome 4A).
Considering the two sub-genomes (A and B), genome B showed a higher number of loci (3,643) and a higher marker density (mean of 0.36 cM/marker), while genome A the longer map length (1,567.4 cM, Table 3).
QTL Mapping Analysis for Kernel Size
QTL analysis was performed for traits related to kernel size, shape and weight, and HD, using phenotypic data from single environments (L14, L15 and F15). Overall, 94 QTLs distributed on all chromosomes were identified, in addition to 16 epistatic interactions (Tables 4A,B). Chromosomes 6B and 2B reported the highest QTL frequency (24 and 19, respectively). The kernel length identified the highest number of QTLs (17), followed by WL ratio (14), and perimeter (11). QTLs for the same trait, identified in different environment and with overlapping CIs or QTL peak at < 20 cM were considered the same (Maccaferri et al., 2008). Upon this merging, we identified a total of 31 different QTLs and 9 QTL interactions for kernel size (L, W) and the correlated measures (P, A), and 21 different QTLs and 5 interactions for kernel shape (C, WL, and FC; Table 4).
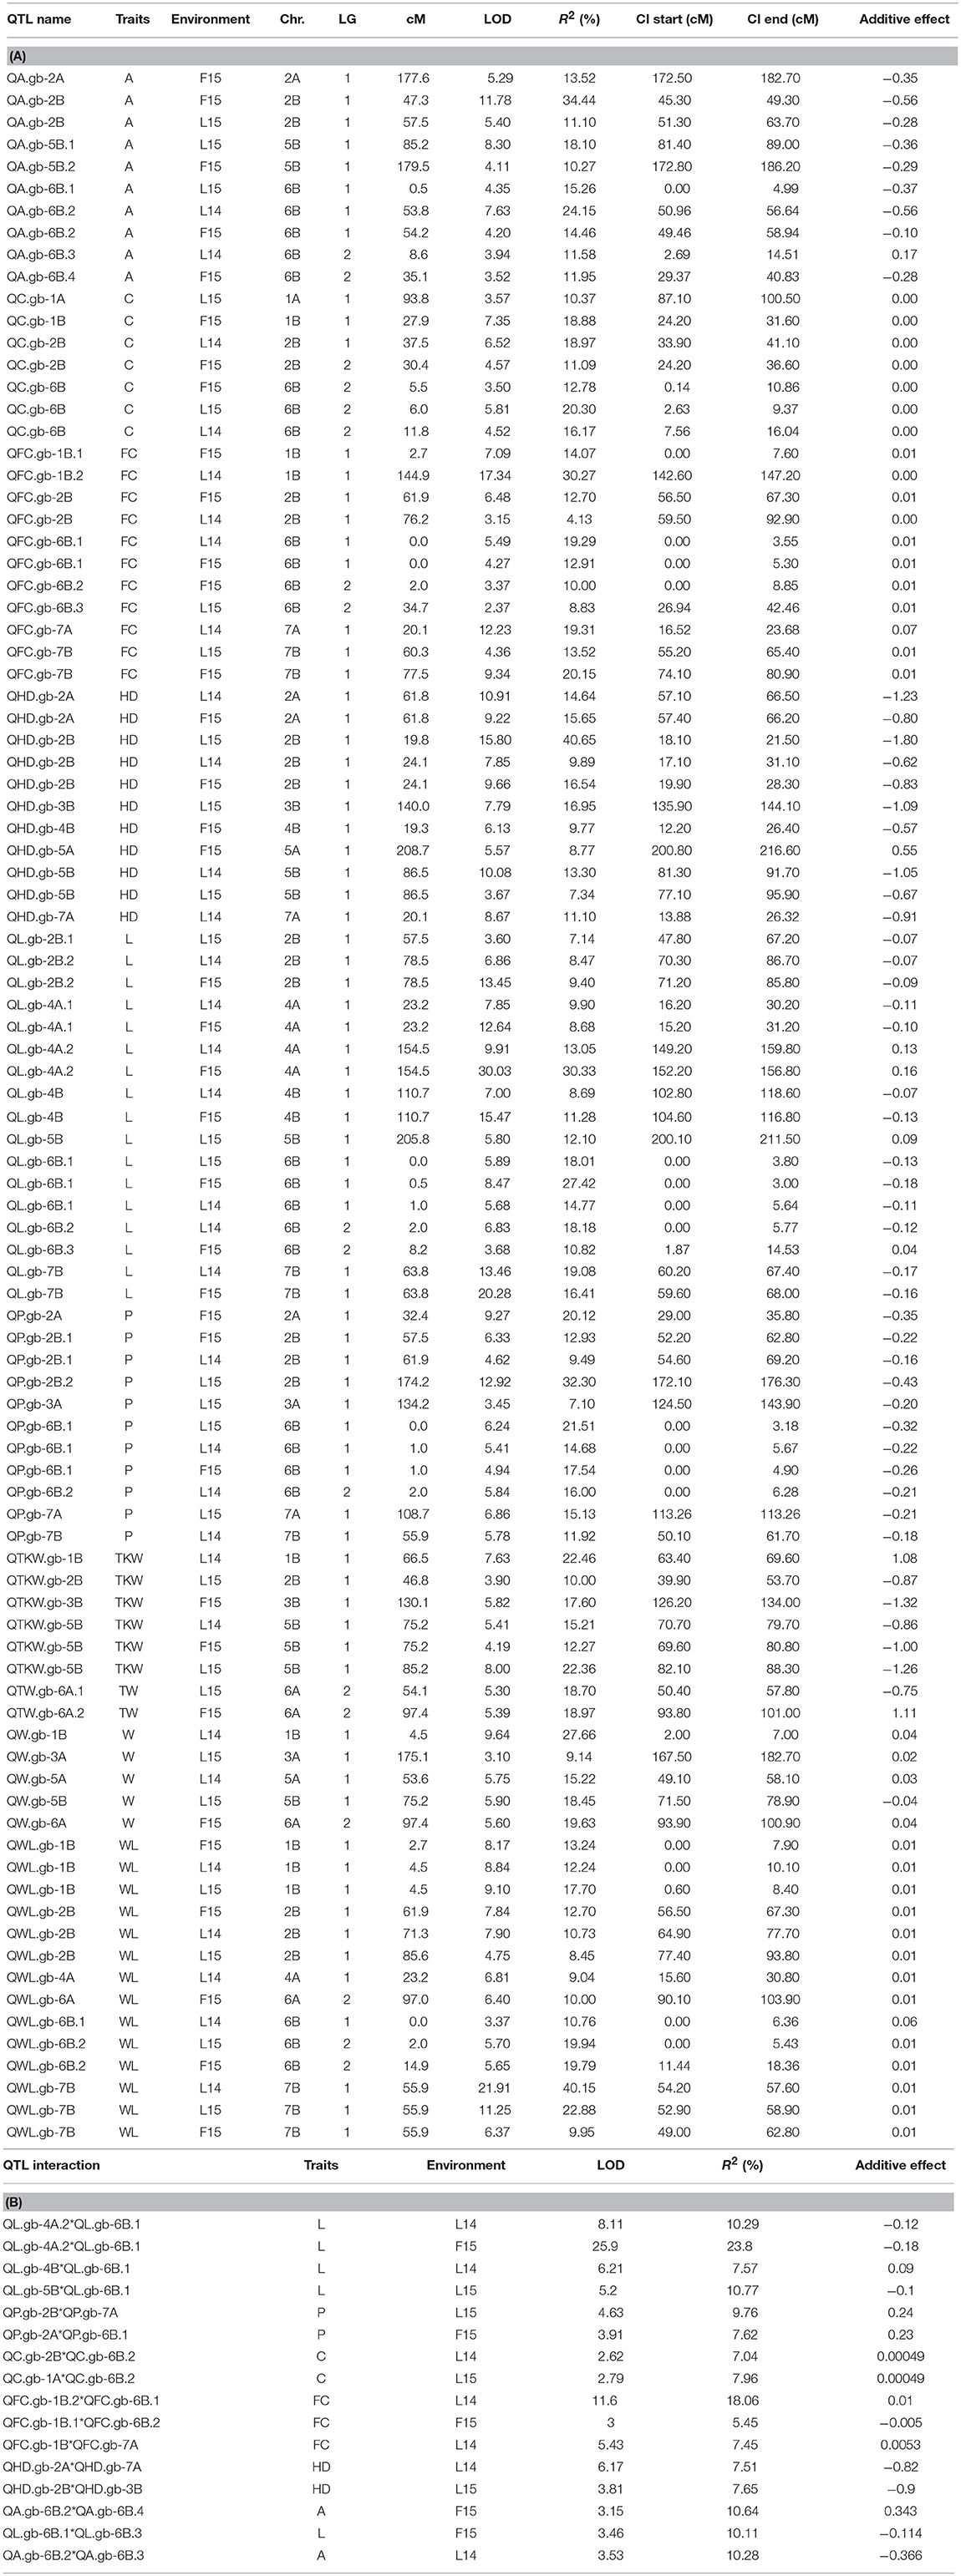
Table 4. QTLs (A) and their interactions (B) detected in Zardak × Iran249 segregating population for traits related to kernel morphology (L, W, P, A, C, WL, FC), kernel weight (TKW, TW), and heading date (HD).
Kernel Length
Ten QTLs were found to be significantly associated with kernel length (L, Table 4). Among them, QL.gb-6B.1 was reported in all environments, while other five QTLs were reported in the two environments L14 and F15, on chromosomes 2B, 4B, and 7B, and two QTLs on chromosome 4A (QL.gb-4A.1, QL.gb-4A.2). For all these QTLs, excepted for QL.gb-4A.2, the landrace Iran_249 contributed the allele for longer kernels. Major QTLs were QL.gb-4A.2 and QL.gb-6B.1, which showed up to 30.3 and 27.4% of phenotypic explained variance (PEV), respectively, thus defining confidence intervals narrower than 5 cM. Out of four different epistatic effects among L-related QTLs, QL.gb-6B.1 had environmentally stable relationships with QL.gb-4A.2, which explained further phenotypic variation of 8.1–25.9%.
Kernel Width
Five QTLs were associated with kernel width (W) on chromosomes 1B, 3A, 5A, 5B, and 6A, but none of them were conserved among environments. The region that explained the highest value for LOD and phenotypic variance (9.6 and 27.7%, respectively) was detected on chromosome 1B, QW.gb-1B (Table 4), with a confidence interval of 5cM. Zardak contributed the allele for larger kernel for all QTLs, except for the region identified on chromosome 5B based on data from L15 (QW.gb-5B, with R2 = 18.45%).
Kernel Perimeter
Eight QTLs were identified for kernel perimeter (P) on chromosomes 2A, 2B, 3A, 6B, 7A, and 7B. QP.gb-6B.1 was identified based on phenotypic data recorded from all environments, while QP.gb-2B.1 was reported in two environments (L14 and F15). QP.gb-6B.1 had from 14.7 to 21.5% of PEV and showed epistatic interaction with the region QP.gb-2A. QP.gb-2B.1 phenotypic variation ranged from 9.5 and 12.9% for L14 and F15 data analysis, respectively. However, the major QTL QP.gb-2B.2, with a confidence interval of 4.2 cM and around 32% PEV, was obtained based on L15 phenotypic data only and showed the highest additive effect value (0.43). In addition, this QTL showed epistatic interaction with QP.gb-7A, thus explaining a further 10% quote of PEV. For all these QTLs, the alleles for increased perimeter were contributed by Iran_249.
Kernel Area
Eight QTLs were detected for kernel area (A) on four different chromosomes, 2A, 2B, 5B, 6B, but only the QA.gb-6B.2 was reported in two environments (L14, F15). This QTL explained up to 24.1% of PEV and an additional quote of 10% resulted from the interaction with other two different regions identified on the same chromosome (QA.gb-6B.3 and QA.gb-6B.4). The QTL with the largest effect was identified on chromosome 2B based on F15 data. It was named QA.gb-2B.1 and explained 34.4% of phenotypic variation. The parent landrace Iran_249 contributed the positive allele for all QTLs associated to kernel area, except for QA.gb-6B.3 (Table 4).
QTL Mapping Analysis for Kernel Shape
The analysis of three kernel shape parameters, the curvature (C), the WL ratio and the form coefficient (FC), discovered a total of 21 different QTLs and 5 QTL interactions (Table 4).
Curvature
Five QTLs were associated with kernel curvature (C), but only QC.gb-6B was stable across the three environments and showed the highest PEV (up to 20.3%). For all QTLs identified, with the only exception of QC.gb-2B.2 detected using data from F15, Zardak positively contributed for increased curvature, as a combination of greater width and/or shorter length.
WL Ratio
Seven QTLs associated with width/length phenotypic variability were found where Zardak contributed the allele with the positive effect on the target trait (Table 4). Notably, QWL.gb-1B, QWL.gb-2B, and QWL.gb-7B were stable across the three environments. In detail, QWL.gb-7B registered the highest LOD and R2 values based on data from L14 (21.91 and 40.15%, respectively), thus defining a confidence interval of 3.4 cM. QWL.gb-1B had LOD values comprised between 8.17 and 9.1 and explained a phenotypic variation ranging from 12.2 to 17.7%. About the region on chromosome 2B, the data from F15 identified the highest LOD and R2 values (LOD = 7.9, R2 = 12.7%). The region QWL.gb-6B.2 conserved across environments L15 and F15 showed till 20% of PEV.
Form Coefficient
Out of nine QTLs associated with FC, three were identified across two environments and located on chromosomes 2B, 6B and 7B (named as QFC.gb-2B, QFC.gb-6B.1, QFC.gb-7B, respectively). The major conserved QTLs were QFC.gb-7B and QFC.gb-6B.1, which explained around 20% PEV each. Overall, the cultivar Zardak contributed the positive allele at all loci, with the only exception of another major QTL, detected on chromosome 1B using data from L14 and explaining 30.3% of phenotypic variance (QFC.gb-1B.2). Additional quote of explained variance was retrieved by the interactions among QTLs detected, particularly for QFC.gb-1B.2 and QFC.gb-6B.1 (R2 = 18.1%).
QTL Mapping Analysis for Kernel Weight Related Traits and Heading Date
Thousand Kernel Weight
Four QTLs associated with TKW were detected on chromosomes 1B, 2B, 3B and 5B explaining 10–22.5% of PEV (Table 4). Notably, the QTL detected on 5B (QTKW.gb-5B) was stable across three environments, explaining 12.3–22.4% of the phenotypic variation. The allele of Iran_249 positively contributed to most of the QTLs.
Test Weight
Only two significant QTLs were found both on chromosome 6A and explaining around 18% of phenotypic variance with positive allele contributed by both parents.
Heading Date
Seven QTLs for heading date (HD) were detected on chromosomes 2A, 2B, 3B, 4B, 5A, 5B, 7A, and three of these were environmentally stable. In detail, the QTL located on 2B (named as QHD.gb-2B) was conserved among the three sites and explained from 9.9 to 40.6% of variation. Other two QTLs on chromosomes 2A (QHD.gb-2A) and 5B (QHD.gb-5B) were stable in two environments and explained up to 15.6% of PEV. For all these regions, the additive effect responsible for late flowering was contributed by Iran_249, with the only exception of QHD.gb-5A.
Cluster of QTLs
Since the parameters used to characterize the kernel are all geometrically or biologically related, we expected to identify coincident loci for different traits. Indeed, the co-localization of QTLs for different traits, proven the coherence about parent providing the QTL additive effect, allowed to define 11 QTL clusters (Table 5 and Figure 4). Clusters included up to 14 QTLs, and the largest clusters were found on chromosomes 2B (cluster 2) and 7B (cluster 11). Regarding cluster 2, the overlapping covered a region that spanned for about 60 cM. We can suppose that this cluster include at least two different associated regions located on chromosome 2B, but based on the resolution of our data they were indistinguishable. Cluster 11 spanned for 30 cM based on two associations for FC whose peaks were located < 20 cM and thus considered the same QTL. Clusters 7 and 8, located on chromosome 6B, were considered as different based on the opposite additive effect values shown by QTL identified for length trait.
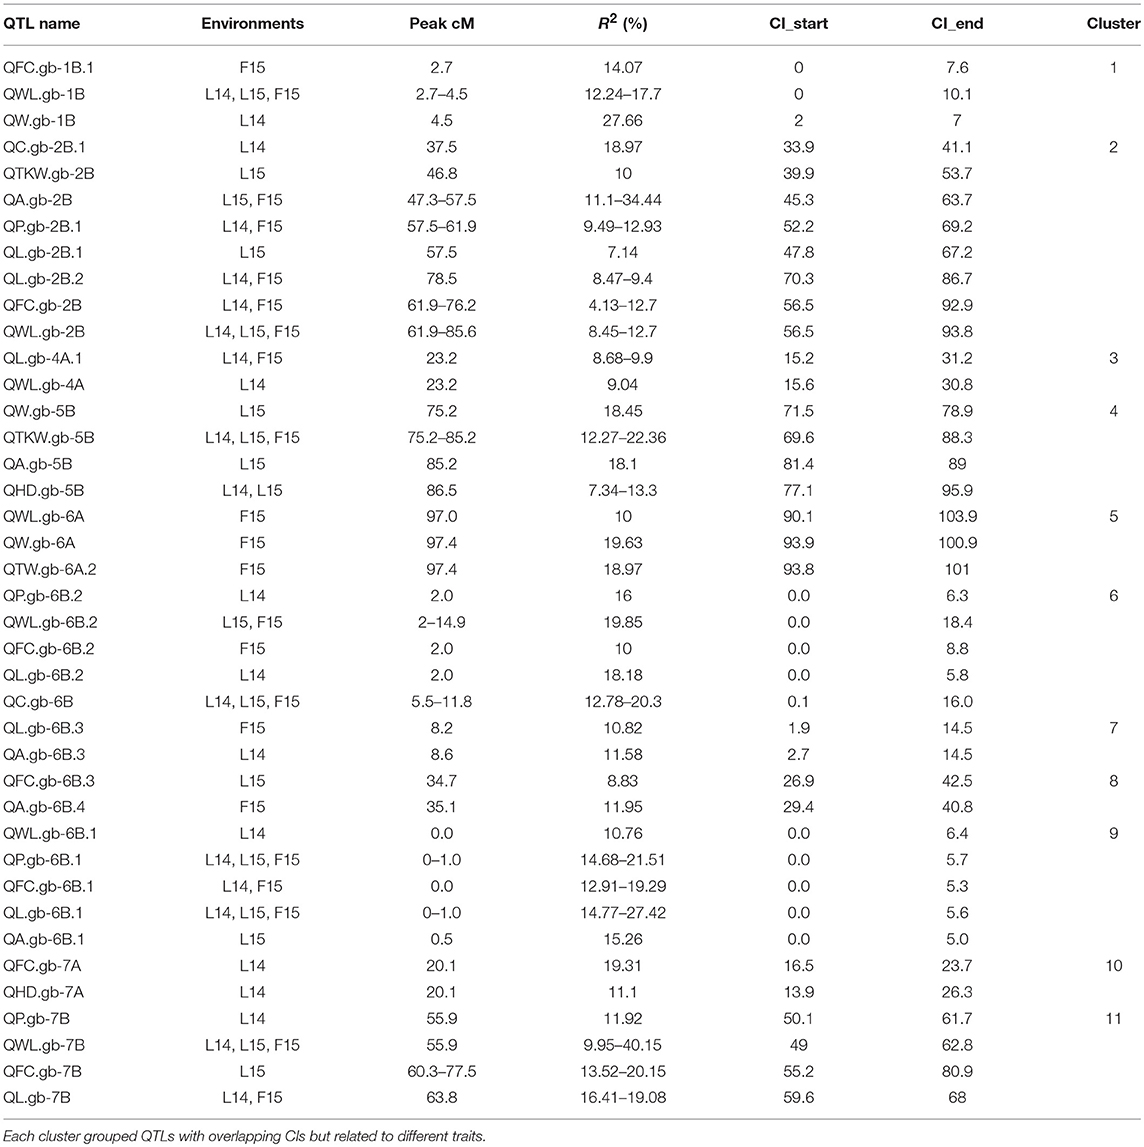
Table 5. Clusters of QTLs.
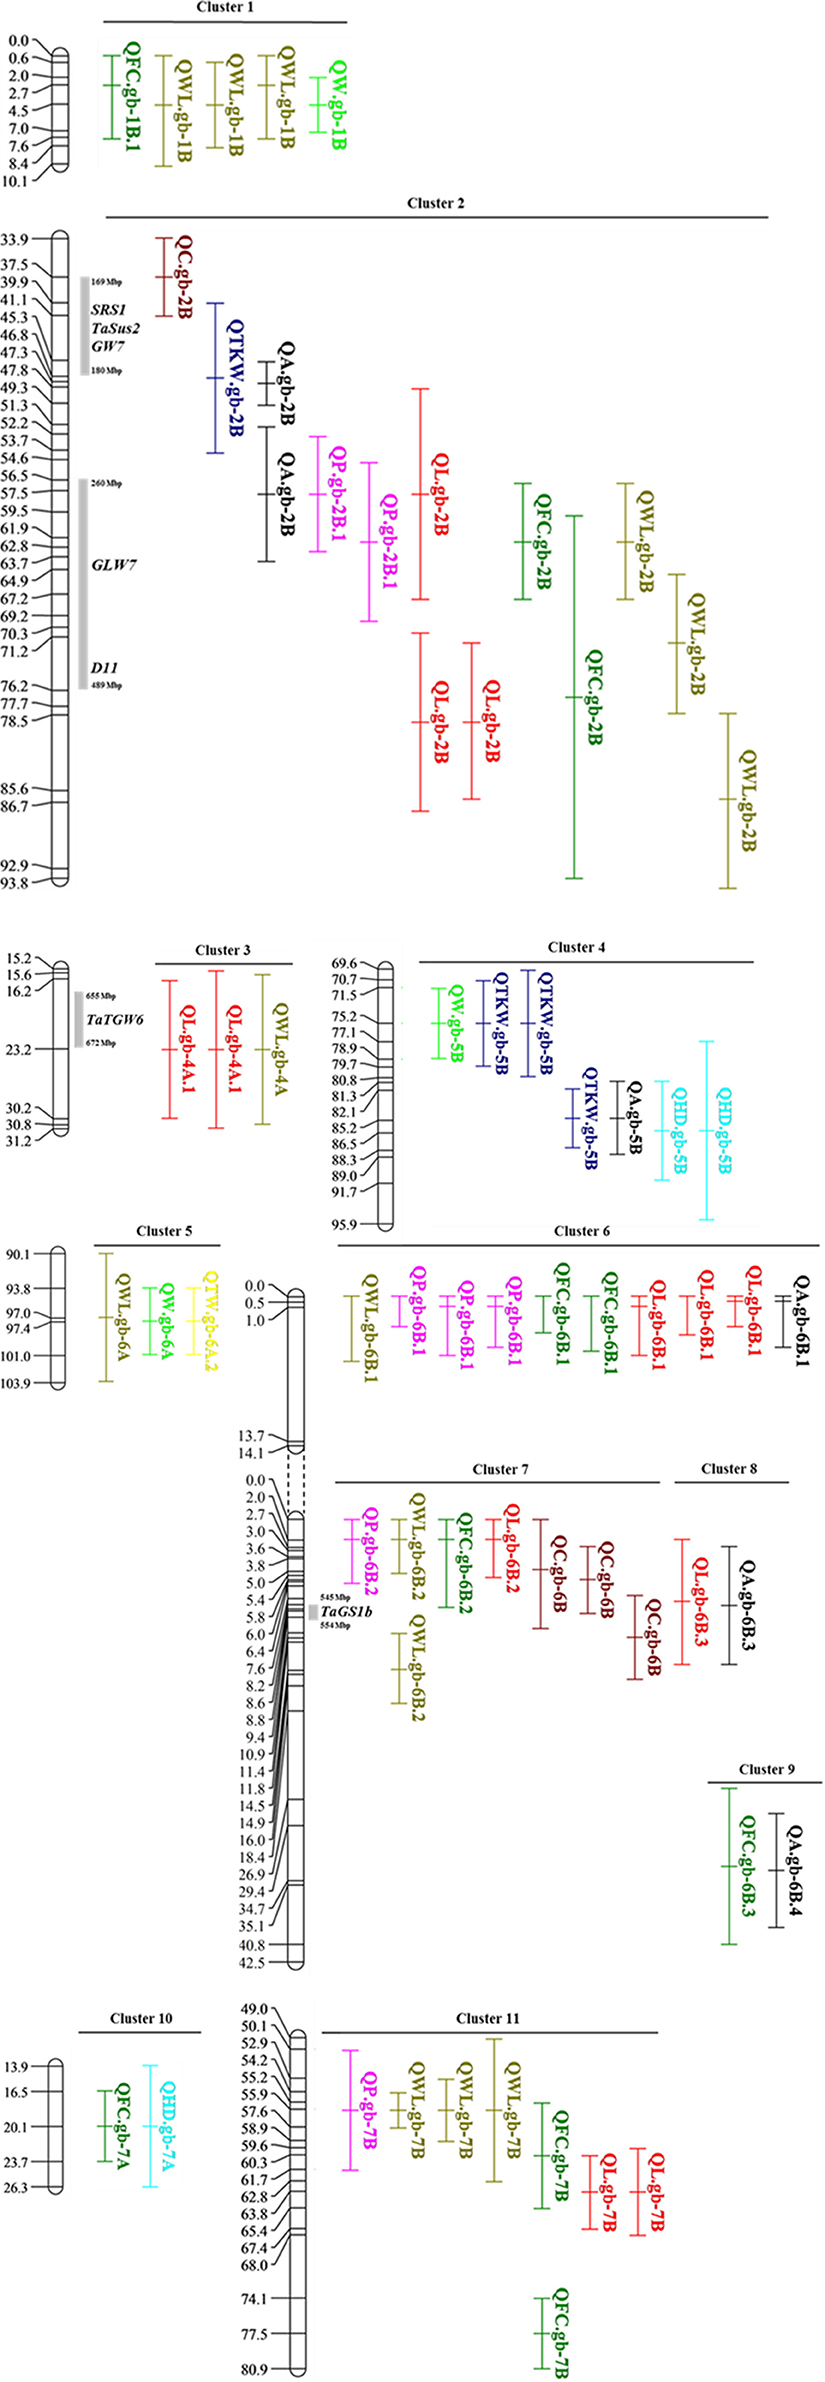
Figure 4. Distribution of co-localized QTLs in clusters detected in this work. Known genes co-localized with our regions have been reported.
Notably, the overlapping of QTL, also supported by correlation between traits, can suggest causative relationships among the different kernel parameters. Coincidences might derive from different parameters describing the same kernel trait, like WL, FC and C, and thus indicate simple relationships. For instance, the chromosome 6B (clusters 6 and 9) hosted coincident QTLs for all three shape related traits, while three regions on chromosomes 1B, 2B, and 7B were identified using both WL and FC data, and defined clusters 1, 2, and 11, respectively. More intriguingly, QTL co-localizations might depend on geometric relationships between primary characters, like L and W, and the secondary traits like WL, P, A and FC, which directly derive from L and W based on geometric formulas (Table 1). As an example, cluster 1 on chromosome 1B grouped QTL related to traits W, WL and FC, suggesting that phenotypic variation for kernel shape associated to the cluster 1 might depend on width variation. Contrarily, in clusters 2 (chromosome 2B), 3 (4A) and 11 (7B), the kernel length was the primary trait associated to a QTL together with a WL locus, indicating a main effect of kernel length on the grain shape. Finally, other clusters included kernel size/shape QTLs and regions associated to TKW and TW. These co-localizations, together with significant correlation between traits, can suggest causal relationships between the simplest kernel trait, kernel length, width and shape, and the more complex relevant agronomic traits, TKW and TW, which indirectly depend on kernel size. This kind of coincidences was indeed revealed by cluster 2, 4 and 5. In detail, the cluster 2 included QTLs for both TKW and kernel size and morphology (A, P, L, FC and C). Notably, cluster 4 contains the QTKW.gb-5B stable in three environments and QTLs for W and A, but also for HD, highlighting a possible effect of phenology on kernel weight, through an impact on specific kernel dimension. An interesting coincidence was also found in cluster 5 (6A) between TW, WL and W, as expected based on the known positive impact of kernel roundness on TW. Notably, Iran_249 contributes the positive allele at cluster 2 and 4, respectively through an allele with positive effect for kernel length and width, respectively. This finding suggested that increase of kernel size from the landrace might improve important agronomic traits like TKW.
Analysis of Physical Regions Carrying QTLs Related to Kernel Traits
The recent durum wheat reference genome was used as common framework to compare our results with QTLs related to kernel traits already published. To this aim, the CI of the most consistent QTLs as well as the extreme positions of the QTL clusters were anchored on the Svevo genome assembly through the projection of the associated markers. Analogously, the nucleotide sequences of all known (bread) wheat genes or rice genes related to kernel morphology/weight were used as Blast queries to identify the durum wheat orthologs and define their physical position on the Svevo pseudomolecules (Supplementary Table 6).
The comparison of physical position of QTLs and of these orthologs revealed some interesting overlapping which might suggest worth candidate genes (Figure 4; Table 5 and Supplementary Table 6). When anchored to the Svevo genome sequence, the large cluster 2 on chromosome 2B, including a total of 8 QTLs, encompassed several wheat genes or wheat homologs cloned for their effect on kernel size and weight, namely TaSus2, SRS1, GW7, GLW7 and D11. Interesting coincidences were also found on chromosome 4A and 6B where the TaTGW6 and TaGS1a felt in cluster 3 and 9, respectively. In addition, QL-gb.4A.2 maps at around 3Mb from the candidate gene 6-SFT-A2 (Yue et al., 2015).
To further support these genes as candidates of mapped QTLs, we checked if possible sequence variations at these genes are represented by SNPs of the Illumina 90K wheat SNP BeadChip array which also proved to be polymorphic and mapped within our population. Although most of the candidates were covered by Illumina 90K SNP markers, a polymorphic marker was found only for TaGS1, in detail IWB13090 mapped at 8.2 cM on chromosome 6B (linkage group 2) in the Zardak × Iran_249 genetic map. This finding allowed us to genetically map the gene TaGS1b under the QTL cluster 9.
To assess the novelty of our results, we compared the clusters identified in this work with known QTLs for related traits reported in tetraploid wheat species. Firstly, we checked the physical position of our clusters on the durum reference genome together with those of the QTL previously reported for kernel shape and size by Russo et al. (2014) and Golan et al. (2015) and recently physically anchored on the durum wheat reference genome by the whole metaQTL analysis conducted by Maccaferri et al. (2019). This analysis did not reveal any overlapping. Analogously, we checked the coincidence of our clusters with the physical positions of QTLs genetically mapped for weight related traits and HD in previous studies in tetraploid wheat and physically defined by Maccaferri et al. (2019) on the Svevo genome. In this case, coincidences were found for all 11 clusters (Table 6). In detail, clusters 2, 4, 5, and 10 included QTLs for TKW, TW and HD located in genome regions where QTLs for the same traits have been already detected. Other clusters (3, 6, 7, 8, 9, 11), which grouped QTLs for kernel morphology and size, co-localized with regions known to be associated with yield related traits, thus remarking the functional/biological relationship between grain size and weight. Finally, for all clusters, except 4 and 9, the correspondence with QTLs for HD was reported suggesting the probable pleiotropic effect of phenology on traits about grain size and weight.
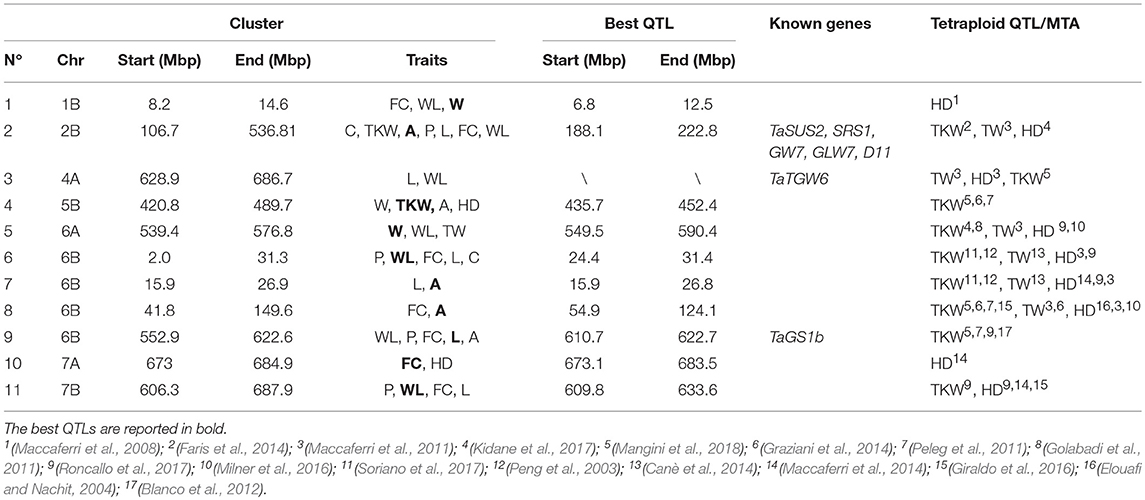
Table 6. Co-localization of QTL clusters with known wheat and/or rice genes and known QTLs in tetraploid germplasm related to seed size and shape.
For each cluster, the physical region underlined by the CI of the most consistent QTLs was inspected for candidate genes. To this purpose, we took advantage of the durum wheat reference genome (Maccaferri et al., 2019) together with the expression data available for the orthologous bread wheat genes. All predicted genes on the T. durum reference genome were functionally annotated through Blast2Go available at FIGSHARE (https://figshare.com/s/2629b4b8166217890971), while for T. durum genes lying under the anchored QTLs the T. aestivum ortholog was identified. Expression data of these bread wheat genes were retrieved and reported as a heat map in Supplementary Table 7. This approach was expected to support the identification of candidate genes based both on the functional annotation and expression profile in the closely related species T. aestivum. Focusing the attention on expression data, grain and spike specific genes have been identified in the genomic regions controlling the following traits: kernel width (chromosome 1B and 6A), kernel length (4B, 6B), kernel area (6B), kernel shape (7B and 7A), and TKW trait (5B). Among these candidate genes, seed and spike specific chromatin remodeling factors (TRITD4Bv1G205360, TRITD5Bv1G146200, TRITD6Av1G202880, TRITD6Bv1G197750, and TRITD7Bv1 G204890), ubiquitin ligases (TRITD5Bv1G144430, TRITD 5Bv1G144440, TRITD6Av1G195410, TRITD6Av1G212580, and TRITD6Av1G212590), and cell wall modeling factors (TRITD6Av1G205500 and TRITD6Av1G205580) might play a role in controlling seed morphology.
Discussion
Kernel weight and shape are important parameters determining the wheat profitability, being the main determinants of yield and its technological quality. Indeed durum wheat breeding has constantly pursued the improvement of TKW and TW. In parallel, a plethora of studies dissected the genetic bases of TKW and TW in wheat. However, while some works investigated the genetic bases of grain shape and size traits and their relationship with TKW and TW in bread wheat (Sun et al., 2008; Gegas et al., 2010; Ramya et al., 2010; Tsilo et al., 2010; Prashant et al., 2012; Maphosa et al., 2014; Rasheed et al., 2014; Williams and Sorrells, 2014; Wu et al., 2015; Kumar et al., 2016; Cheng et al., 2017; Würschum et al., 2018), very few were dedicated to durum wheat (Russo et al., 2014; Golan et al., 2015). Moreover, only a few studies based on the linkage mapping approach (Russo et al., 2014; Wu et al., 2015; Kumar et al., 2016; Cheng et al., 2017; Su et al., 2018) used a high-density genetic map to analyze kernel size related traits. Therefore, an understanding of the genetic basis of kernel size/shape traits is an important objective whose results could be deployed in future (durum) wheat breeding. Furthermore, this study was also conceived to inspect the relevant genetic diversity present in less cultivated materials, such as landraces. Therefore, a RIL population derived from a cross among two Iranian durum wheat genotypes, a landrace and a local old cultivar (Iran_249 and Zardak, respectively), was used to investigate durum wheat kernel morphology factors and their relationships with kernel weight, and to map the corresponding QTLs. The two genotypes derive from different regions of Iran and show significant differences for morphology of kernel and spike, with Iran_249 being similar to T. turanicum. This wheat, currently cultivated in Iran, is a tetraploid subspecies also called Khorasan wheat, but it is genetically not dissimilar from durum landrace as shown in Maccaferri et al. (2019). For our analysis, we considered the most common parameters used to describe kernel size and shape, in the above mentioned genetic studies, and we applied high-throughput phenotyping based on digital image analysis to get accurate scoring data from a higher amount of seeds per samples from two experimental sites, thus addressing the variability present in seed sample as well as the environment effect. In addition, a high density genetic map, comprising 6,195 markers, was developed and used to perform the QTL analysis. Lastly, we anchored the mapped QTLs on the recently released T. durum reference genome.
The experimental field provided phenotypic data that highlight significant variability for the genotype effect for all traits considered, thus allowing to conduct QTL analysis on each single environment data. As possible for large field trial that may likely encompass non-uniform soil parameters, the replicate effect was also significant for almost all traits, however most of the variation was accounted by the genotype component.
About overall data across the three environments, all effects (G, E, and GxE interaction) were significant for all traits, with E accounting for most of the variability. The two sites used for field trail represent two durum wheat growing areas in Italy characterized by strong differences in soil fertility and climatic conditions (Supplementary Table 1). Consequently, for some traits known to be influenced by environment (like HD, TW and TKW), a large environmental effect, even larger than the genotype component, was observed, that is large differences among environmental means causing most of the variation in genotype performances. This confirms that the experimental sites were enough different to highlight the environment and possible GxE effect on the target traits. We can suppose that major differences in these trait phenotypes were associated to rainfall levels and temperature values. This was already reported in studies about the performances of durum genotypes conducted in the same two experimental sites (De Vita et al., 2010), and in general for the target traits across different environments (Graziani et al., 2014; Kumar et al., 2016). The observation that environment affects also kernel width, and consequently WL ratio and FC, may suggest that the environment impacts on TKW and TW through effects on width of kernel, and in a minor extent through length of kernel. More interesting is the impact of GxE interaction on total variation. We found significant GxE variability for almost all traits, but interactions contributed significantly less to the phenotypic variations, compared with the genotypic effects. Indeed, we were able to identify QTLs stable across the three environments. The only exception is TW that, with a GxE variance higher than that due to genotype, revealed its low heritability level. Accordingly, lowest level of heritability was observed for kernel width which is the morphology trait more correlated with TW. Previous studies have already reported lower level of heritability for width of kernel in comparison to length of kernel (Russo et al., 2014; Kumar et al., 2016; Su et al., 2018), thus length promises to be an effective target for breeding.
Correlations among size and shape related traits, as well as with kernel weight have been addressed in all the mentioned studies in wheat, aiming to highlight distinct genetic controls and to disentangle complex traits in their simplest but likely causative primary traits. In our case, we observed positive correlation between size related traits and grain weight, a higher correlation of width with weight of kernels as opposed to length of kernels, and a negative correlation among kernel width and kernel length. These observations, in agreement with insights from previous studies (Russo et al., 2014; Kumar et al., 2016; Cheng et al., 2017; Su et al., 2018), suggest that kernel width should be the main contributor to the increased grain weight and that kernel length and width are probably under different genetic control. Analogous results have been obtained in bread wheat, through a detailed analysis which has dissected the phenotypic and genetic structure of kernel size and shape (Gegas et al., 2010). The authors developed a phenotypic model integrating grain size and shape parameters, thus demonstrating that the kernel length and width traits are probably under the control of distinct genetic components.
The present study identified a total of 94 QTLs along all chromosomes; in detail, 43 QTLs for traits related to kernel size (L, W, P, A), 32 QTLs associated with kernel shape (C, WL, and FC), 8 QTLs for kernel weight (TKW and TW) and 11 regions associated with heading date. The phenotypic variation explained by each QTL ranged from 4.1% (QFC.gb-2B) to 40.1% (QWL.gb-7B), with an average of 15.7%. Thus, both few major and several minor QTLs for all the grain characteristics were identified, confirming the polygenic control of these traits suggested by the distribution of phenotypic data as already reported. Many of the QTLs identified were environment specific as expected according to the significant GxE effect observed for all traits. However, we were able to identify robust QTLs stable across two or three environments. Indeed, three regions associated to WL (QWL.gb-1B, QWL.gb-2B, and QWL.gb-7B), two regions identified by length data (QL.gb-2B and QL.gb-6B.1) and one region for P (QP.gb-6B.1), C (QC.gb-6B), HD (QHD.gb-2B) and TKW (QTKW.gb-5B) were effective in all evaluation trials. Other 14 QTLs detected for traits A, C, P, FC, HD, L, and WL, and spanning on different chromosomes (2A, 2B, 4A, 4B, 5B, 6B, and 7B) were expressed in two environments.
Focusing on the parent contribution, Iran_249 contributed the allele with increasing effect for most of the QTLs related to kernel length, vice versa for QTLs related to kernel width is Zardak the parent conferring the allele with positive effect. Moreover, Iran_249 conferred positive allele at 4 out of 6 loci related to kernel weight (TKW and TW), although kernel width showed consistently higher positive correlation with kernel weight than kernel length. Landraces are considered valuable resource to enlarge the genetic diversity of modern cultivated genetic pools (Moore, 2015), however, to the better of our knowledge, the variance available for kernel length has been rarely addressed so far for the landraces, neither in durum wheat nor in bread wheat (Abdipour et al., 2016). For common wheat, a detailed analysis of the kernel size and shape trait assessed the genetic variation available among/within wheat subspecies, including primitives. In contrast to modern wheat varieties, these primitives exhibited broader variation in grain size and shape with grain width being the least variable trait, meaning that the modern breeding germplasm has lost grain morphology variation, probably due to selection for more uniform grain shape in the élite varieties (Gegas et al., 2010). In this context, our finding suggest that landraces, as exemplified by Iran_249, might have considerable potential toward enhancing the existing gene pool for grain shape and size traits and for further yield improvement in wheat, without the issue of linkage drag related to using primitive wheat's.
QTLs identified in the present study were grouped according to their genetic positions and the parent responsible of positive additive effect, thus identifying 11 cluster regions which include both loci for the primary traits L and W, as well as their corresponding derivative traits (WL, P, A and FC), and relevant agronomic traits (TKW, TW and HD). QTL clustering or coincidence is common in wheat for a number of traits and has been already reported for kernel morphology and weight (Gegas et al., 2010; Russo et al., 2014; Wu et al., 2015). It suggests that associated loci either have pleiotropic effect or are closely linked, both resulting in phenotypic correlations among corresponding traits (Kumar et al., 2016; Cheng et al., 2017). The cloning of several genes for grain shape and size genes in rice and wheat also confirmed the pleiotropic effects of those genes (Fan et al., 2006; Song et al., 2007). Following this rationale, because of the geometric and/or physiologic relationship among the traits, clusters are expected to suggest which primary kernel trait, between kernel length and width, might more strongly impact on a co-located and more complex secondary trait, like kernel shape and, more intriguingly, weight related traits. For instance, based on this assumption, we could hypothesize that for the cluster 1 (chromosome 1B) phenotypic variation for WL might depend on the co-located QTL for kernel width. Analogously, in clusters 2 (2B), 3 (4A), and 11 (7B) variation for length was likely responsible for the identification of the WL and FC loci. Notably, the comparison of the regions associated to TKW with QTLs for kernel size might identify relevant relationships between kernel size and yield related traits. This coincidence was revealed by two clusters, evidencing effect of both kernel length (cluster 2 on 2B) and width (cluster 4 on 5B) on kernel weight. Interestingly, cluster 4 contains the robust QTKW.gb-5B, repeatedly identified in three environments, QTLs for W and A, but also for HD, highlighting a possible effect of phenology on kernel weight, putatively through an impact of regulation of HD on specific kernel dimension (W). Another interesting coincidence might indicate the positive impact of kernel roundness on TW. This is the case of cluster 5 (6A) which included QTLs for TW, WL and W. Notably, Iran_249 contributes the positive allele at cluster 2 and 4, respectively through an allele with positive effect for kernel length and width, respectively. As we already pointed out, this finding suggested that increase of kernel size from the landrace might improve important agronomic traits like TKW.
The projection of the clusters on the T. durum reference genome sequence allowed to enlarge this approach considering QTLs for the target traits so far mapped in tetraploid wheat germplasm. Within all clusters some potentially coincidences emerged with QTL previously identified through both linkage and association mapping and recently physically mapped on the reference genome (Maccaferri et al., 2019). Interestingly, most of our clusters of QTLs for kernel morphology and size co-located with known QTLs for TKW and TW (Peng et al., 2003; Elouafi and Nachit, 2004; Maccaferri et al., 2008; Peleg et al., 2011; Canè et al., 2014; Graziani et al., 2014; Roncallo et al., 2017; Soriano et al., 2017; Mangini et al., 2018). This result further indicates that kernel size/shape genetic determinants are responsible for variability in kernel weight, suggesting that selection for these traits can indirectly improve grain weight. In other cases, coincidence was found between QTLs for the same traits, thus validating the results shown in the present study, also for those QTLs that are expressed only in one environment. For example, Faris et al. (2014) and Mangini et al. (2018) reported QTL for TKW on chromosome 2B that may correspond to QTKW.gb-2B, while QTKW.gb-5B and QTW.gb-6A could correspond to the QTLs previously reported on chromosomes 5B and 6A for the same traits (Maccaferri et al., 2011; Peleg et al., 2011; Graziani et al., 2014; Mangini et al., 2018).
The recent release of the T. durum reference genome (cv. Svevo) allowed us to identify durum wheat homologs to rice genes known to be involved in the regulation of kernel size and weight [as summarized by Huang et al. (2013); Li and Yang (2017)] as well as new candidate genes. The base assumption supporting this approach is that most of the gene content is conserved among the cv. Svevo and parental lines selected for this study. Consequently, the diversity observed in the current work is supposed to be mainly related to allelic variation at conserved loci, at to a lesser extent to different gene content. The large cluster 2 on chromosome 2B, including 8 QTLs detected for kernel size/shape (C, A, P, L, FC) and weight traits (TKW), encompassed several wheat genes or wheat homologs cloned for they effect on kernel size and weight (TaSus2, SRS1, GW7, GLW7 and D11). In details, TaSus2, involved in the starch synthesis pathway had a direct association with grain yield in wheat representing one of the major target of indirect selection in wheat breeding for higher yield. Other cloned rice genes (SRS1, GW7, GLW7 and D11) appear to be involved directly in the seed morphology, by determining the spatial control of cell division, and indirectly in the regulation of yield. However, the extension of cluster 2 impaired us to hypothesized which gene represents the best candidate gene involved in the trait determination. Interesting coincidences were also found on chromosome 4A and 6B where the TaTGW6 and TaGS1b felt in cluster 3 and 9, respectively. We were also able to genetically map the TaGS1b gene in the Zardak × Iran_249 population under the QTL cluster 9. Both these genes were associated to high grain weight but for the homeolog form TaGS1a functions for grain size and shape functions have been also hypothesized (Bernard et al., 2008; Guo et al., 2013). Therefore, the QTL present in cluster 9 as associated to kernel size could correspond to TaGS1b.
Besides known genes, novel candidates emerged by inspecting the gene content of the genomic regions underlined by the most consistent QTL for each cluster. Both functional annotation and expression data, as predicted based on the tissue specific RNA-seq data available for T. aestivum, were considered. Among the tens of genes located under the target QTLs, we were able to find a subset of genes specifically expressed in grain and spikes and having functional annotation already reported for genes related to grain size and shape in rice and wheat. However, fine mapping approaches together with detailed expression profile analysis in the parental lines are required to increase the mapping resolution and thus identify best candidate genes.
In the most recent breeding above all, the market and industry requirements for almost spherical grains led to selection for larger grains. However, yield was unaffected due to reduced kernel number (Wiersma et al., 2001), as consequence of the physiological trade-offs between individual components of yield (kernel number, kernel weight, kernel shape, etc.). These complex physiological relationships hinder improvement of grain yield when trying to manipulate single yield component using only phenotypic data. The knowledge of the genetic bases of such complex quantitative traits, together with relevant new alleles from less cultivated germplasm can contribute to model the interactions among components, to find effective combinations of traits and candidate genes, toward the improvement of wheat kernel size and yield.
Author Contributions
FD and EM carried out the data analyses and wrote the manuscript. FD, EM, DG, SL, NV, and FS participated in field and post-harvest evaluations of phenotypic traits. PB and RB performed the bioinformatic analysis. LZ, KC, and EF developed RIL population. FD, MP, LC, and EM designed the study. All authors have read and approved the final manuscript.
Conflict of Interest Statement
The authors declare that the research was conducted in the absence of any commercial or financial relationships that could be construed as a potential conflict of interest.
Acknowledgments
This work was supported by PON01_01145 project ISCOCEM, H2020-MSCA-RISE-2015 project ExpoSEED (grant no. 691109) and project BIOTECH-WHEADIT (Approcci di genome editing per ottimizzare la performance dei cereali tramite il controllo dei pathway ormonali).
Supplementary Material
The Supplementary Material for this article can be found online at: https://www.frontiersin.org/articles/10.3389/fpls.2019.00448/full#supplementary-material
Supplementary Figure 1. Pearson correlations among the phenotypic traits analyzed using single environment data: L14 (A), L15 (B), and F15 (C).
Supplementary Table 1. Field experimental conditions and environmental parameters.
Supplementary Table 2. Summary of phenotypic data and variation parameters for parental lines and RILs for kernel shape, size and weight related traits, and heading date. Mean data for each environment (L14, L15, and F15) has been reported.
Supplementary Table 3. Variance components of RIL population for each trait using both mean data across the three environments and data from single environments (L14, L15, and F15).
Supplementary Table 4. Pearson correlations and corresponding p-value, among the phenotypic traits analyzed using both overall data and data from single environments (L14, L15, and F15).
Supplementary Table 5. Zardak × Iran_249 linkage map. Linkage groups, chromosomes, marker names and their position (cM, obtained using the Kosambi mapping function) are reported.
Supplementary Table 6. Genes controlling kernel related phenotypes (TKW, L, W) identified in wheat and/or rice. Gene name, gene ID, wheat chromosome and the physical position on the T. durum reference genome are reported.
Supplementary Table 7. Gene content under the selected QTL regions. Functional annotation and expression data are also reported. Expression data related to the ortholog bread wheat genes were downloaded from the WheatExp database (https://wheat.pw.usda.gov/WheatExp/). Tissues and stages are the following: Grains collected at the Zadoks scale 71, 75, and 85, whole endosperm collected at 10 and 20 days After Pollination (DAP), endosperm tissues as starchy endosperm, transfer cells, the aleurone, maternal tissues as the inner and outer pericarp, spikes collected at the Zadoks scale 32, 39, and 65, leaves collected at the Zadoks scale 10, 23, and 71, root collected at the Zadoks scale 10, 13, and 39, and stem collect at the Zadoks scale 30, 32, 65.
Footnotes
1. ^Winseedle pro (2011 Regents Instruments Inc., Canada).
References
Abdipour, M., Ebrahimi, M., Izadi-Darbandi, A., Mastrangelo, A. M., Najafian, G., Arshad, Y., et al. (2016). Association between grain size and shape and quality traits, and path analysis of thousand grain weight in Iranian bread wheat landraces from different geographic regions. Not. Bot. Hort. Agrobo. 44, 228–236. doi: 10.15835/nbha44110256
Abe, Y., Mieda, K., Ando, T., Kono, I., Yano, M., Kitano, H., et al. (2010). The SMALL AND ROUND SEED1 (SRS1/DEP2) gene is involved in the regulation of seed size in rice. Genes Genet. Syst. 85, 327–339. doi: 10.1266/ggs.85.327
Ashikari, M., Sakakibara, H., Lin, S., Yamamoto, T., Takashi, T., Nishimura, A., et al. (2005). Cytokinin oxidase regulates rice grain production. Science. 309, 741–745. doi: 10.1126/science.1113373
Ashikari, M., Wu, J., Yano, M., Sasaki, T., and Yoshimura, A. (1999). Rice gibberellin-insensitive dwarf mutant gene Dwarf 1 encodes the alpha-subunit of GTP-binding protein. Proc. Natl. Acad. Sci. U.S.A. 96, 10284–10289. doi: 10.1073/pnas.96.18.10284
Bernard, S. M., Molle, R. A. L. B., Dionisio, G., Kichey, T., Jahn, T. P., Dubois, F., et al. (2008). Gene expression, cellular localisation and function of glutamine synthetase isozymes in wheat (Triticum aestivum L.). Plant Mol. Biol. 67, 89–105. doi: 10.1007/s11103-008-9303-y
Blanco, A., Mangini, G., Giancaspro, A., Giove, S., Colasuonno, P., Simeone, R., et al. (2012). Relationships between grain protein content and grain yield components through quantitative trait locus analyses in a recombinant inbred line population derived from two elite durum wheat cultivars. Mol. Breed. 30, 79–92. doi: 10.1007/s11032-011-9600-z
Bogard, M., Jourdan, M., Allard, V., Martre, P., Perretant, M. R., Ravel, C., et al. (2011). Anthesis date mainly explained correlations between post-anthesis leaf senescence, grain yield, and grain protein concentration in a winter wheat population segregating for flowering time QTLs. J. Exp. Bot. 62, 3621–3636. doi: 10.1093/jxb/err061
Broman, K. W., Wu, H., Sen, S., and Churchill, G. A. (2003). R/qtl: QTL mapping in experimental crosses. Bioinformatics. 19, 889–890. doi: 10.1093/bioinformatics/btg112
Canè, M. A., Maccaferri, M., Nazemi, G., Salvi, S., Francia, R., Colalongo, C., et al. (2014). Association mapping for root architectural traits in durum wheat seedlings as related to agronomic performance. Mol. Breed. 34, 1629–1645. doi: 10.1007/s11032-014-0177-1
Chang, J., Zhang, J., Mao, X., Li, A., Jia, J., and Jing, R. (2013). Polymorphism of TaSAP1-A1 and its association with agronomic traits in wheat. Planta. 237, 1495–1508. doi: 10.1007/s00425-013-1860-x
Chen, J., Gao, H., Zheng, X.-M., Jin, M., Weng, J.-F., Ma, J., et al. (2015). An evolutionarily conserved gene, FUWA, plays a role in determining panicle architecture, grain shape and grain weight in rice. Plant J. 83, 427–438. doi: 10.1111/tpj.12895
Cheng, R., Kong, Z., Zhang, L., Xie, Q., Jia, H., Yu, D., et al. (2017). Mapping QTLs controlling kernel dimensions in a wheat inter-varietal RIL mapping population. Theor. Appl. Genet. 130, 1405–1414. doi: 10.1007/s00122-017-2896-2
Churchill, G. A., and Doerge, R. W. (1994). Empirical threshold values for quantitative trait mapping. Genetics 138, 963–971.
Darvasi, A., and Soller, M. (1997). A simple method to calculate resolving power and confidence interval of QTL map location. Behav. Genet. 27, 125–132. doi: 10.1023/A:1025685324830
de Givry, S., Bouchez, M., Chabrier, P., Milan, D., and Schiex, T. (2005). CARHTA GENE: multipopulation integrated genetic and radiation hybrid mapping. Bioinformatics. 21, 1703–1704. doi: 10.1093/bioinformatics/bti222
De Vita, P., Mastrangelo, A. M., Matteu, L., Mazzucotelli, E., Virzi, N., Palumbo, M., et al. (2010). Genetic improvement effects of yield stability in durum wheat genotypes grown in Italy. Field Crops Res. 119, 68–77. doi: 10.1016/j.fcr.2010.06.016
Desiderio, F., Guerra, D., Rubiales, D., Piarulli, L., Pasquini, M., Mastrangelo, A. M., et al. (2014). Identification and mapping of quantitative trait loci for leaf rust resistance derived from a tetraploid wheat Triticum dicoccum accession. Mol. Breed. 34, 1659–1675. doi: 10.1007/s11032-014-0186-0
Elouafi, I., and Nachit, M. M. (2004). A genetic linkage map of the durum × Triticum dicoccoides backcross population based on SSRs and AFLP markers, and QTL analysis for milling traits. Theor. Appl. Genet. 108,401–413. doi: 10.1007/s00122-003-1440-8
Eujayl, I., Sorrells, M. E., Baum, M., Wolters, P., and Powell, W. (2002). Isolation of EST-derived microsatellite markers for genotyping the A and B genomes of wheat. Theor. Appl. Genet. 104, 399–407. doi: 10.1007/s001220100738
Fan, C., Xing, Y., Mao, H., Lu, T., Han, B., Xu, C., et al. (2006). GS3, a major QTL for grain length and weight and minor QTL for grain width and thickness in rice, encodes a putative transmembrane protein. Theor. Appl. Genet. 112, 1164–1171. doi: 10.1007/s00122-006-0218-1
Faris, J. D., Zhang, Q., Chao, S., Zhang, Z., and Xu, S. S. (2014). Analysis of agronomic and domestication traits in a durum × cultivated emmer wheat population using a high-density single nucleotide polymorphism-based linkage map. Theor. Appl. Genet. 127, 2333–2348. doi: 10.1007/s00122-014-2380-1
Gegas, V. C., Nazari, A., Griffiths, S., Simmonds, J., Fish, L., Orford, S., et al. (2010). A genetic framework for grain size and shape variation in wheat. Plant Cell. 22, 1046–1056. doi: 10.1105/tpc.110.074153
Giraldo, P., Royo, C., González, M., Carrillo, J. M., and Ruiz, M. (2016). Genetic diversity and association mapping for agromorphological and grain quality traits of a structured collection of durum wheat landraces including subsp. durum, turgidum and diccocon. PLoS ONE 11:e0166577. doi: 10.1371/journal.pone.0166577
Golabadi, M., Arzani, A., Mirmohammadi Maibody, S. A. M., Tabatabaei, B. E. S., and Mohammadi, S. A. (2011). Identification of microsatellite markers linked with yield components under drought stress at terminal growth stages in durum wheat. Euphytica 177, 207–221. doi: 10.1007/s10681-010-0242-8
Golan, G., Oksenberg, A., and Peleg, Z. (2015). Genetic evidence for differential selection of grain and embryo weight during wheat evolution under domestication. J. Exp. Bot. 66, 5703–5711. doi: 10.1093/jxb/erv249
Götz, S., García-Gómez, J. M., Terol, J., Williams, T. D., Nagaraj, S. H., Nueda, M. J., et al. (2008). High-throughput functional annotation and data mining with the Blast2GO suite. Nucleic Acids Res. 36, 3420–3435. doi: 10.1093/nar/gkn176
Graziani, M., Maccaferri, M., Royo, C., Salvatorelli, F., and Tuberosa, R. (2014). QTL dissection of yield components and morpho-physiological traits in a durum wheat elite population tested in contrasting thermo-pluviometric conditions. Crop Pasture Sci. 65, 80–95. doi: 10.1071/CP13349
Guo, Y., Sun, J., Zhang, G., Wang, Y., Kong, F., Zhao, Y., et al. (2013). Haplotype, molecular marker and phenotype effects associated with mineral nutrient and grain size traits of TaGS1a in wheat. Field Crops Res. 154, 119–125. doi: 10.1016/j.fcr.2013.07.012
Gupta, K., Balyan, S., Edwards, J., Isaac, P., Korzun, V., Röder, M., et al. (2002). Genetic mapping of 66 new microsatellite (SSR) loci in bread wheat. Theor. Appl. Genet. 105, 413–422. doi: 10.1007/s00122-002-0865-9
Guyomarc'h, H., Sourdille, P., Edwards, J., and Bernard, M. (2002). Studies of the transferability of microsatellites derived from Triticum tauschii to hexaploid wheat and to diploid related species using amplification, hybridization and sequence comparisons. Theor. Appl. Genet. 105, 736–744. doi: 10.1007/s00122-002-0963-8
Hanif, M., Gao, F., Liu, J., Wen, W., Zhang, Y., Rasheed, A., et al. (2015). TaTGW6-A1, an ortholog of rice TGW6, is associated with grain weight and yield in bread wheat. Mol Breeding 36, 1. doi: 10.1007/s11032-015-0425-z
Hong, Y., Chen, L., Du, L., Su, Z., Wang, J., Ye, X., et al. (2014). Transcript suppression of TaGW2 increased grain width and weight in bread wheat. Funct. Integr. Genomics. 14, 341–349. doi: 10.1007/s10142-014-0380-5
Hong, Z., Ueguchi-Tanaka, M., Umemura, K., Uozu, S., Fujioka, S., Takatsuto, S., et al. (2003). A rice brassinosteroid-deficient mutant, ebisu dwarf (d2), is caused by a loss of function of a new member of cytochrome P450. Plant Cell. 15, 2900–2910. doi: 10.1105/tpc.014712
Hou, J., Jiang, Q., Hao, C., Wang, Y., Zhang, H., and Zhang, X. (2014). Global selection on sucrose synthase haplotypes during a century of wheat breeding. Plant Physiol. 164, 1918–1929. doi: 10.1104/pp.113.232454
Hu, M.-J., Zhang, H.-P., Cao, J.-J., Zhu, X.-F., Wang, S.-X., Jiang, H., et al. (2016). Characterization of an IAA-glucose hydrolase gene TaTGW6 associated with grain weight in common wheat (Triticum aestivum L.). Mol Breeding 36, 25. doi: 10.1007/s11032-016-0449-z
Huang, R., Jiang, L., Zheng, J., Wang, T., Wang, H., Huang, Y., et al. (2013). Genetic bases of rice grain shape: so many genes, so little known. Trends Plant Sci. 18, 218–226. doi: 10.1016/j.tplants.2012.11.001
Ishimaru, K., Hirotsu, N., Madoka, Y., Murakami, N., Hara, N., Onodera, H., et al. (2013). Loss of function of the IAA-glucose hydrolase gene TGW6 enhances rice grain weight and increases yield. Nat. Genet. 45, 707–711. doi: 10.1038/ng.2612
Jaiswal, V., Gahlaut, V., Mathur, S., Agarwal, P., Khandelwal, M. K., Khurana, J. P., et al. (2015). Identification of novel SNP in promoter sequence of TaGW2-6A associated with grain weight and other agronomic traits in wheat (Triticum aestivum L.). PLoS ONE. 10:e0129400. doi: 10.1371/journal.pone.0129400
Jiang, Q., Hou, J., Hao, C., Wang, L., Ge, H., Dong, Y., et al. (2011). The wheat (T. aestivum) sucrose synthase 2 gene (TaSus2) active in endosperm development is associated with yield traits. Funct. Integr. Genomics. 11, 49–61. doi: 10.1007/s10142-010-0188-x
Jiang, Y., Jiang, Q., Hao, C., Hou, J., Wang, L., Zhang, H., et al. (2015). A yield-associated gene TaCWI, in wheat: its function, selection and evolution in global breeding revealed by haplotype analysis. Theor. Appl. Genet. 128, 131–143. doi: 10.1007/s00122-014-2417-5
Kidane, Y. G., Hailemariam, B. N., Mengistu, D. K., Fadda, C., Pè, M. E., and Dell'Acqua, M. (2017). Genome-wide association study of Septoria tritici blotch resistance in Ethiopian durum wheat landraces. Front. Plant Sci. 8:1586. doi: 10.3389/fpls.2017.01586
Kitagawa, K., Kurinami, S., Oki, K., Abe, Y., Ando, T., Kono, I., et al. (2010). A novel kinesin 13 protein regulating rice seed length. Plant Cell Physiol. 51, 1315–1329. doi: 10.1093/pcp/pcq092
Kosambi, D. D. (1944). The estimation of map distances from recombination values. Ann. Eugen. 12, 172–175. doi: 10.1111/j.1469-1809.1943.tb02321.x
Kumar, A., Mantovani, E. E., Seetan, R., Soltani, A., Echeverry-Solarte, M., Jain, S., et al. (2016). Dissection of genetic factors underlying wheat kernel shape and size in an elite × nonadapted cross using a high density SNP linkage map. Plant Genome. 9:81. doi: 10.3835/plantgenome2015.09.0081
Lander, E. S., and Botstein, D. (1989). Mapping mendelian factors underlying quantitative traits using RFLP linkage maps. Genetics. 121, 185–199.
Li, W., and Yang, B. (2017). Translational genomics of grain size regulation in wheat. Theor. Appl. Genet. 130, 1765–1771. doi: 10.1007/s00122-017-2953-x
Li, Y., Fan, C., Xing, Y., Jiang, Y., Luo, L., Sun, L., et al. (2011). Natural variation in GS5 plays an important role in regulating grain size and yield in rice. Nat. Genet. 43, 1266–1269. doi: 10.1038/ng.977
Liu, Y., Lin, Y., Gao, S., Li, Z., Ma, J., Deng, M., et al. (2017). A genome-wide association study of 23 agronomic traits in Chinese wheat landraces. Plant J. 91, 861–873. doi: 10.1111/tpj.13614
Lopes, S. M., El-Basyoni, I., Baenziger, P. S., Singh, S., Royo, C., Ozbek, K., et al. (2015). Exploiting genetic diversity from landraces in wheat breeding for adaptation to climate change. J. Exp. Bot. 66, 3625–3638. doi: 10.1093/jxb/erv122
Ma, D., Yan, J., He, Z., Wu, L., and Xia, X. (2012). Characterization of a cell wall invertase gene TaCwi-A1 on common wheat chromosome 2A and development of functional markers. Mol. Breed. 29, 43–52. doi: 10.1007/s11032-010-9524-z
Ma, L., Li, T., Hao, C., Wang, Y., Chen, X., and Zhang, X. (2016). TaGS5-3A, a grain size gene selected during wheat improvement for larger kernel and yield. Plant Biotechnol. J. 14, 1269–1280. doi: 10.1111/pbi.12492
Maccaferri, M., Cane, M. A., Sanguineti, M. C., Salvi, S., Colalongo, M. C., Massi, A., et al. (2014). A consensus framework map of durum wheat (Triticum durum Desf.) suitable for linkage disequilibrium analysis and genome-wide association mapping. BMC Genom. 15:873. doi: 10.1186/1471-2164-15-873
Maccaferri, M., El-Feki, W., Nazemi, G., Salvi, S., Canè, M. A., Colalongo, M. C., et al. (2016). Prioritizing quantitative trait loci for root system architecture in tetraploid wheat. J. Exp. Bot. 67, 1161–1178. doi: 10.1093/jxb/erw039
Maccaferri, M., Harris, N. S., Twardziok, S. O., Pasam, R. K., Gundlach, H., Spannagl, M., et al. (2019). Durum wheat genome reveals past domestication signatures and future improvement targets. Nature Genetics. doi: 10.1038/s41588-019-0381-3
Maccaferri, M., Ricci, A., Salvi, S., Milner, S. G., Noli, E., Martelli, P. L., et al. (2015). A high-density, SNP-based consensus map of tetraploid wheat as a bridge to integrate durum and bread wheat genomics and breeding. Plant Biotechnol. J. 13, 648–663. doi: 10.1111/pbi.12288
Maccaferri, M., Sanguineti, M. C., Corneti, S., Ortega, J. L. A., Salem, M. B., Bort, J., et al. (2008). Quantitative trait loci for grain yield and adaptation of durum wheat (Triticum durum Desf.) across a wide range of water availability. Genetics. 178, 489–511. doi: 10.1534/genetics.107.077297
Maccaferri, M., Sanguineti, M. C., Demontis, A., El-Ahmed, A., Garcia del Moral, L., Maalouf, F., et al. (2011). Association mapping in durum wheat grown across a broad range of water regimes. J. Exp. Bot. 62, 409–438. doi: 10.1093/jxb/erq287
Mangini, G., Gadaleta, A., Colasuonno, P., Marcotuli, I., Signorile, A. M., Simeone, R., et al. (2018). Genetic dissection of the relationships between grain yield components by genome-wide association mapping in a collection of tetraploid wheats. PLoS ONE. 13:e0190162. doi: 10.1371/journal.pone.0190162
Mao, H., Sun, S., Yao, J., Wang, C., Yu, S., Xu, C., et al. (2010). Linking differential domain functions of the GS3 protein to natural variation of grain size in rice. Proc. Natl. Acad. Sci. U.S.A. 107, 19579–19584. doi: 10.1073/pnas.1014419107
Maphosa, L., Langridge, P., Taylor, H., Parent, B., Emebiri, L. C., Kuchel, H., et al. (2014). Genetic control of grain yield and grain physical characteristics in a bread wheat population grown under a range of environmental conditions. Theor. Appl. Genet. 127, 1607–1624. doi: 10.1007/s00122-014-2322-y
Milner, S. G., Maccaferri, M., Huang, B. E., Mantovani, P., Massi, A., Frascaroli, E., et al. (2016). A multiparental cross population for mapping QTL for agronomic traits in durum wheat (Triticum turgidum ssp. durum). Plant Biotechnol. J. 14, 735–748. doi: 10.1111/pbi.12424
Mohler, V., Albrecht, T., Castell, A., Diethelm, M., Schweizer, G., and Hartl, L. (2016). Considering causal genes in the genetic dissection of kernel traits in common wheat. J. Appl. Genet. 57, 467–476. doi: 10.1007/s13353-016-0349-2
Moore, G. (2015). Strategic pre-breeding for wheat improvement. Nat. Plants. 1:15018. doi: 10.1038/nplants.2015.18
Nyquist, W. E. (1991). Estimation of heritability and prediction of selection response in plant populations. Crit. Rev. Plant Sci. 10, 235–322. doi: 10.1080/07352689109382313
Peleg, Z., Fahima, T., Korol, A. B., Abbo, S., and Saranga, Y. (2011). Genetic analysis of wheat domestication and evolution under domestication. J. Exp. Bot. 62, 5051–5061. doi: 10.1093/jxb/err206
Peng, J., Ronin, Y., Fahima, T., Röder, M. S., Li, Y., Nevo, E., et al. (2003). Domestication quantitative trait loci in Triticum dicoccoides, the progenitor of wheat. Proc. Natl. Acad. Sci. U.S.A. 100, 2489–2494. doi: 10.1073/pnas.252763199
Peng, J. H., and Lapitan, N. L. V. (2005). Characterization of EST-derived microsatellites in the wheat genome and development of eSSR markers. Funct. Integr. Genomics. 5, 80–96. doi: 10.1007/s10142-004-0128-8
Prashant, R., Kadoo, N., Desale, C., Kore, P., Dhaliwal, H. S., Chhuneja, P., et al. (2012). Kernel morphometric traits in hexaploid wheat (Triticum aestivum L.) are modulated by intricate QTL × QTL and genotype × environment interactions. J. Cereal Sci. 56, 432–439. doi: 10.1016/j.jcs.2012.05.010
Qin, L., Hao, C., Hou, J., Wang, Y., Li, T., Wang, L., et al. (2014). Homologous haplotypes, expression, genetic effects and geographic distribution of the wheat yield gene TaGW2. BMC Plant Biol. 14:107. doi: 10.1186/1471-2229-14-107
Ramya, P., Chaubal, A., Kulkarni, K., Gupta, L., Kadoo, N., Dhaliwal, H. S., et al. (2010). QTL mapping of 1000-kernel weight, kernel length, and kernel width in bread wheat (Triticum aestivum L.). J. Appl. Genet. 51, 421–429. doi: 10.1007/BF03208872
Rasheed, A., Xia, X., Ogbonnaya, F., Mahmood, T., Zhang, Z., Mujeeb-Kazi, A., et al. (2014). Genome-wide association for grain morphology in synthetic hexaploid wheats using digital imaging analysis. BMC Plant Biol. 14:128. doi: 10.1186/1471-2229-14-128
Röder, M. S., Korzun, V., Wendehake, K., Plaschke, J., Tixier, M. H., Leroy, P., et al. (1998). A microsatellite map of wheat. Genetics. 149, 2007–2023.
Roncallo, P. F., Akkiraju, P. C., Cervigni, G. L., and Echenique, V. C. (2017). QTL mapping and analysis of epistatic interactions for grain yield and yield-related traits in Triticum turgidum L. var. durum. Euphytica. 213:277. doi: 10.1007/s10681-017-2058-2
Russo, M. A., Ficco, D. B. M., Laidò, G., Marone, D., Papa, R., Blanco, A., et al. (2014). A dense durum wheat × T. dicoccum linkage map based on SNP markers for the study of seed morphology. Mol. Breed. 34, 1579–1597. doi: 10.1007/s11032-014-0181-5
Sajjad, M., Ma, X., Habibullah Khan, S., Shoaib, M., Song, Y., Yang, W., et al. (2017). TaFlo2-A1, an ortholog of rice Flo2, is associated with thousand grain weight in bread wheat (Triticum aestivum L.). BMC Plant Biol. 17:164. doi: 10.1186/s12870-017-1114-3
Segami, S., Kono, I., Ando, T., Yano, M., Kitano, H., Miura, K., et al. (2012). Small and round seed 5 gene encodes alpha-tubulin regulating seed cell elongation in rice. Rice. 5:4. doi: 10.1186/1939-8433-5-4
Sen, S., and Churchill, G. A. (2001). A statistical framework for quantitative trait mapping. Genetics. 159, 371–387.
She, K.-C., Kusano, H., Koizumi, K., Yamakawa, H., Hakata, M., Imamura, T., et al. (2010). A novel factor FLOURY ENDOSPERM2 is involved in regulation of rice grain size and starch quality. Plant Cell. 22, 3280–3294. doi: 10.1105/tpc.109.070821
Shomura, A., Izawa, T., Ebana, K., Ebitani, T., Kanegae, H., Konishi, S., et al. (2008). Deletion in a gene associated with grain size increased yields during rice domestication. Nat. Genet. 40, 1023–1028. doi: 10.1038/ng.169
Si, L., Chen, J., Huang, X., Gong, H., Luo, J., Hou, Q., et al. (2016). OsSPL13 controls grain size in cultivated rice. Nat. Genet. 48, 447–456. doi: 10.1038/ng.3518
Simmonds, J., Scott, P., Brinton, J., Mestre, T. C., Bush, M., Del Blanco, A., et al. (2016). A splice acceptor site mutation in TaGW2-A1 increases thousand grain weight in tetraploid and hexaploid wheat through wider and longer grains. Theor. Appl. Genet. 129, 1099–1112. doi: 10.1007/s00122-016-2686-2
Song, Q. J., Shi, J. R., Singh, S., Fickus, E. W., Costa, J. M., Lewis, J., et al. (2005). Development and mapping of microsatellite (SSR) markers in wheat. Theor. Appl. Genet. 110, 550–560. doi: 10.1007/s00122-004-1871-x
Song, X.-J., Huang, W., Shi, M., Zhu, M.-Z., and Lin, H.-X. (2007). A QTL for rice grain width and weight encodes a previously unknown RING-type E3 ubiquitin ligase. Nat. Genet. 39, 623–630. doi: 10.1038/ng2014
Soriano, J. M., Malosetti, M., Roselló, M., Sorrells, M. E., and Royo, C. (2017). Dissecting the old Mediterranean durum wheat genetic architecture for phenology, biomass and yield formation by association mapping and QTL meta-analysis. PLoS ONE. 12:e0178290. doi: 10.1371/journal.pone.0178290
Sourdille, P., Cadalen, T., Guyomarc'h, H., Snape, J. W., Perretant, M. R., Charmet, G., et al. (2003). An update of the Courtot × Chinese Spring intervarietal molecular marker linkage map for the QTL detection of agronomic traits in wheat. Theor. Appl. Genet. 106, 530–538. doi: 10.1007/s00122-002-1044-8
Su, Q., Zhang, X., Zhang, W., Zhang, N., Song, L., Liu, L., et al. (2018). QTL detection for kernel size and weight in bread wheat (Triticum aestivum L.) using a high-density SNP and SSR-based linkage map. Front. Plant Sci. 9:1484. doi: 10.3389/fpls.2018.01484
Su, Z., Hao, C., Wang, L., Dong, Y., and Zhang, X. (2011). Identification and development of a functional marker of TaGW2 associated with grain weight in bread wheat (Triticum aestivum L.). Theor. Appl. Genet. 122, 211–223. doi: 10.1007/s00122-010-1437-z
Sun, C., Zhang, F., Yan, X., Zhang, X., Dong, Z., Cui, D., et al. (2017). Genome-wide association study for 13 agronomic traits reveals distribution of superior alleles in bread wheat from the Yellow and Huai Valley of China. Plant Biotechnol. J. 15, 953–969. doi: 10.1111/pbi.12690
Sun, X.-Y., Wu, K., Zhao, Y., Kong, F.-M., Han, G.-Z., Jiang, H.-M., et al. (2008). QTL analysis of kernel shape and weight using recombinant inbred lines in wheat. Euphytica 165:615. doi: 10.1007/s10681-008-9794-2
Takano-Kai, N., Jiang, H., Kubo, T., Sweeney, M., Matsumoto, T., Kanamori, H., et al. (2009). Evolutionary history of GS3, a gene conferring grain length in rice. Genetics. 182, 1323–1334. doi: 10.1534/genetics.109.103002
Tanabe, S., Ashikari, M., Fujioka, S., Takatsuto, S., Yoshida, S., Yano, M., et al. (2005). A novel cytochrome P450 is implicated in brassinosteroid biosynthesis via the characterization of a rice dwarf mutant, dwarf11, with reduced seed length. Plant Cell. 17, 776–790. doi: 10.1105/tpc.104.024950
Tsilo, T. J., Hareland, G. A., Simsek, S., Chao, S., and Anderson, J. A. (2010). Genome mapping of kernel characteristics in hard red spring wheat breeding lines. Theor. Appl. Genet. 121, 717–730. doi: 10.1007/s00122-010-1343-4
Van de Wouw, M., Kik, C., Van Hintum, T., Van Treuren, R., and Visser, B. (2010). Genetic erosion in crops: Concept, research results and challenges. Plant Genet. Resour. 8, 1–15. doi: 10.1017/S1479262109990062
Wang, E., Wang, J., Zhu, X., Hao, W., Wang, L., Li, Q., et al. (2008). Control of rice grain-filling and yield by a gene with a potential signature of domestication. Nat. Genet. 40, 1370–1374. doi: 10.1038/ng.220
Wang, S., Li, S., Liu, Q., Wu, K., Zhang, J., Wang, S., et al. (2015b). The OsSPL16-GW7 regulatory module determines grain shape and simultaneously improves rice yield and grain quality. Nat. Genet. 47, 949–954. doi: 10.1038/ng.3352
Wang, S., Wong, D., Forrest, K., Allen, A., Chao, S., Huang, B. E., et al. (2014). Characterization of polyploid wheat genomic diversity using a high-density 90,000 single nucleotide polymorphism array. Plant Biotechnol. J. 12, 787–796. doi: 10.1111/pbi.12183
Wang, S., Wu, K., Yuan, Q., Liu, X., Liu, Z., Lin, X., et al. (2012). Control of grain size, shape and quality by OsSPL16 in rice. Nat. Genet. 44, 950–954. doi: 10.1038/ng.2327
Wang, S., Zhang, X., Chen, F., and Cui, D. (2015a). A single-nucleotide polymorphism of TaGS5 gene revealed its association with kernel weight in Chinese bread wheat. Front. Plant Sci. 6:1166. doi: 10.3389/fpls.2015.01166
Wang, Y., Xiong, G., Hu, J., Jiang, L., Yu, H., Xu, J., et al. (2015c). Copy number variation at the GL7 locus contributes to grain size diversity in rice. Nat. Genet. 47, 944–948. doi: 10.1038/ng.3346
Wei, X., Jiao, G., Lin, H., Sheng, Z., Shao, G., Xie, L., et al. (2017). GRAIN INCOMPLETE FILLING 2 regulates grain filling and starch synthesis during rice caryopsis development. J. Integr. Plant Biol. 59, 134–153. doi: 10.1111/jipb.12510
Weng, J., Gu, S., Wan, X., Gao, H., Guo, T., Su, N., et al. (2008). Isolation and initial characterization of GW5, a major QTL associated with rice grain width and weight. Cell Res. 18, 1199–1209. doi: 10.1038/cr.2008.307
Wiersma, J. J., Busch, R. H., Fulcher, G. G., and Hareland, G. A. (2001). Recurrent selection for kernel weight in spring wheat. Crop Sci. 41, 999–1005. doi: 10.2135/cropsci2001.414999x
Williams, K., and Sorrells, M. E. (2014). Three-dimensional seed size and shape QTL in hexaploid wheat (Triticum aestivum L.) populations. Crop Sci. 54, 98–110. doi: 10.2135/cropsci2012.10.0609
Wu, Q.-H., Chen, Y.-X., Zhou, S.-H., Fu, L., Chen, J.-J., Xiao, Y., et al. (2015). High-density genetic linkage map construction and QTL mapping of grain shape and size in the wheat population Yanda1817 × Beinong6. PLoS ONE. 10:e0118144. doi: 10.1371/journal.pone.0118144
Würschum, T., Leiser, W. L., Langer, S. M., Tucker, M. R., and Longin, C. F. H. (2018). Phenotypic and genetic analysis of spike and kernel characteristics in wheat reveals long-term genetic trends of grain yield components. Theor. Appl. Genet. 131, 2071–2084. doi: 10.1007/s00122-018-3133-3
Xue, S., Zhang, Z., Lin, F., Kong, Z., Cao, Y., Li, C., et al. (2008). A high-density intervarietal map of the wheat genome enriched with markers derived from expressed sequence tags. Theor. Appl. Genet. 117, 181–189. doi: 10.1007/s00122-008-0764-9
Yamamuro, C., Ihara, Y., Wu, X., Noguchi, T., Fujioka, S., Takatsuto, S., et al. (2000). Loss of function of a rice brassinosteroid insensitive1 homolog prevents internode elongation and bending of the lamina joint. Plant Cell. 12, 1591–1606. doi: 10.1105/tpc.12.9.1591
Yu, J., Xiong, H., Zhu, X., Zhang, H., Li, H., Miao, J., et al. (2017). OsLG3 contributing to rice grain length and yield was mined by Ho-LAMap. BMC Biol. 15:28. doi: 10.1186/s12915-017-0365-7
Yue, A., Li, A., Mao, X., Chang, X., Li, R., and Jing, R. (2015). Identification and development of a functional marker from 6-SFT-A2 associated with grain weight in wheat. Mol. Breed. 35:63. doi: 10.1007/s11032-015-0266-9
Zhai, H., Feng, Z., Du, X., Song, Y., Liu, X., Qi, Z., et al. (2018). A novel allele of TaGW2-A1 is located in a finely mapped QTL that increases grain weight but decreases grain number in wheat (Triticum aestivum L.). Theor. Appl. Genet. 131, 539–553. doi: 10.1007/s00122-017-3017-y
Zhang, L., Zhao, Y.-L., Gao, L.-F., Zhao, G.-Y., Zhou, R.-H., Zhang, B.-S., et al. (2012a). TaCKX6-D1, the ortholog of rice OsCKX2, is associated with grain weight in hexaploid wheat. New Phytol. 195, 574–584. doi: 10.1111/j.1469-8137.2012.04194.x
Zhang, X., Wang, J., Huang, J., Lan, H., Wang, C., Yin, C., et al. (2012b). Rare allele of OsPPKL1 associated with grain length causes extra-large grain and a significant yield increase in rice. Proc. Natl. Acad. Sci. U.S.A. 109, 21534–21539. doi: 10.1073/pnas.1219776110
Zhang, Y., Liu, J., Xia, X., and He, Z. (2014). TaGS-D1, an ortholog of rice OsGS3, is associated with grain weight and grain length in common wheat. Mol. Breed. 34, 1097–1107. doi: 10.1007/s11032-014-0102-7
Keywords: T. durum, landrace, QTL, kernel size, kernel weight
Citation: Desiderio F, Zarei L, Licciardello S, Cheghamirza K, Farshadfar E, Virzi N, Sciacca F, Bagnaresi P, Battaglia R, Guerra D, Palumbo M, Cattivelli L and Mazzucotelli E (2019) Genomic Regions From an Iranian Landrace Increase Kernel Size in Durum Wheat. Front. Plant Sci. 10:448. doi: 10.3389/fpls.2019.00448
Received: 15 January 2019; Accepted: 25 March 2019;
Published: 18 April 2019.
Edited by:
Thomas Miedaner, University of Hohenheim, GermanyReviewed by:
Conxita Royo, Institute of Agrifood Research and Technology (IRTA), SpainIldikó Karsai, Centre for Agricultural Research (MTA), Hungary
Copyright © 2019 Desiderio, Zarei, Licciardello, Cheghamirza, Farshadfar, Virzi, Sciacca, Bagnaresi, Battaglia, Guerra, Palumbo, Cattivelli and Mazzucotelli. This is an open-access article distributed under the terms of the Creative Commons Attribution License (CC BY). The use, distribution or reproduction in other forums is permitted, provided the original author(s) and the copyright owner(s) are credited and that the original publication in this journal is cited, in accordance with accepted academic practice. No use, distribution or reproduction is permitted which does not comply with these terms.
*Correspondence: Francesca Desiderio, ZnJhbmNlc2NhLmRlc2lkZXJpb0BjcmVhLmdvdi5pdA==
Elisabetta Mazzucotelli, ZWxpc2FiZXR0YS5tYXp6dWNvdGVsbGlAY3JlYS5nb3YuaXQ=