 Henrik R. Hallingbäck
 Sofia Berlin
 Nils-Erik Nordh
 Martin Weih
 Ann-Christin Rönnberg-Wästljung
- 1Department of Plant Biology, Uppsala BioCenter, Linnean Centre for Plant Biology, Swedish University of Agricultural Sciences, Uppsala, Sweden
- 2Department of Crop Production Ecology, Linnean Centre for Plant Biology, Swedish University of Agricultural Sciences, Uppsala, Sweden
The short rotation biomass crop willow (Salix genera) has been of interest for bioenergy but recently also for biofuel production. For a faster development of new varieties molecular markers could be used as selection tool in an early stage of the breeding cycle. To identify markers associated with growth traits, genome-wide association mapping was conducted using a population of 291 Salix viminalis accessions collected across Europe and Russia and a large set of genotyping-by-sequencing markers. The accessions were vegetatively propagated and planted in replicated field experiments, one in Southern Sweden and one in Central Sweden. Phenology data, including bud burst and leaf senescence, as well as different growth traits were collected and measured repeatedly between 2010 and 2017 at both field environments. A value of the plasticity for each accession was calculated for all traits that were measured the same year in both environments as the normalized accession value in one environment subtracted by the corresponding value in the other environment. Broad-sense accession heritabilities and narrow-sense chip heritabilities ranged from 0.68 to 0.95 and 0.45 to 0.99, respectively for phenology traits and from 0.56 to 0.85 and 0.24 to 0.97 for growth traits indicating a considerable genetic component for most traits. Population structure and kinship between accessions were taken into account in the association analyses. In total, 39 marker-trait associations were found where four were specifically connected to plasticity and interestingly one particular marker was associated to several different plasticity growth traits. Otherwise association consistency was poor, possibly due to accession by environment interactions which were demonstrated by the low structure adjusted accession correlations across environments (ranging from 0.40 to 0.58). However, one marker association with biomass fresh weight was repeatedly observed in the same environment over two harvest years. For some traits where several associations were found, the markers jointly explained over 20% of the accession variation. The result from this study using a population of unrelated accessions has given useful information about marker-trait associations especially highlighting marker-plasticity associations and genotype-by-environment interactions as important factors to take account of in future strategies of Salix breeding.
Introduction
Fast growing trees for bioenergy has been of interest since the 1980s and lately the increasing demand of non-fossil fuels has further put fast growing woody biomass production into focus. Fast growing shrubby Salix species and more recently also Populus species have been used in a short rotation coppice (SRC) system with harvests every 3–5 years from the same plants in order to continuously have a high biomass production (Weih, 2004). Breeding programs for Salix and Populus has been developed both in Europe and North America to fulfill the goals of high producing and well adapted plant material for cultivation (Karp and Shield, 2008; Kuzovkina et al., 2008; Karp et al., 2011; Stanton et al., 2010; Serapiglia et al., 2013). In Europe Salix viminalis, S. dasyclados, and S. schwerinii have been the main willow species used for SRC plantations (Karp et al., 2011; Hanley and Karp, 2014). Salix viminalis has a history of cultivation to provide raw material for basketry and for stabilization of river banks across Europe and has been domesticated to some degree due to trading of clonal material between countries resulting in successive expansion of the species geographic distribution (Lascoux et al., 1996; Kuzovkina et al., 2008; Berlin et al., 2014). Despite this the Salix species of interest for SRC are still at a low level of domestication implying substantial genetic variation within species and a high degree of individual heterozygosity (Berlin et al., 2011, 2014). As a result, recurrent selection programs have developed cultivars with increased biomass production compared to old varieties originating from wild collections (Åhman and Larsson, 1994; Larsson, 1998; Kuzovkina et al., 2008; Karp et al., 2011).
An important aspect of breeding for improved local adaptation is how environmental differences influence the performance of the different genotypes, also called genotype-by-environment interaction (G × E). The response of a genotype across environments reflect the plasticity of the genotype and its possibility to survive and grow in different environmental conditions (Bradshaw, 1965; Schlichting, 1986; Wu, 1998). Studying and identifying genetic factors that regulate plasticity of traits is highly interesting from an evolutionary and ecological point of view since it ultimately sets the limit for the distribution of a species (Stapley et al., 2010; Tétard-Jones et al., 2011; Savolainen et al., 2013). For plant breeding it is also crucial to understand how plant material can be transferred and used in different environmental conditions in order to set up breeding zones within which material can be transferred without losing in productivity (Via and Lande, 1985; Nicotra et al., 2010). To identify the genetic basis of plasticity per se would make it possible to breed for more or less plastic individuals. Many studies have been conducted to reveal the genetic base and the genetic regulation of plasticity in plants (see reviews by Nicotra et al., 2010; El Soda et al., 2014). In Populus quantitative trait loci (QTL) mapping have gained more insight into the genetic background of plasticity (Rae et al., 2008; Fabbrini et al., 2012) and in Rae et al. (2008) evidence for heritable genetic variation for plasticity traits was shown and these traits were in many cases regulated by QTL different from QTL regulating the traits themselves. Also, in Salix species, studies show clonal differences in plasticity across environments and identified QTL for plasticity demonstrates a genetic basis for the plasticity traits (Berlin et al., 2014, 2017).
To further increase the genetic gain in a recurrent selection breeding program, selection tools using molecular markers could be included in the breeding process (Allwright and Taylors, 2016). A first step toward marker-assisted selection (MAS) has been to dissect the genetic basis for different important breeding traits and identify markers influencing the trait variation. This has been accomplished with several molecular marker techniques and various statistical approaches giving different genomic resolution. For instance, QTL mapping can be performed, where regions in the genome important for the trait variation are indicated, whereas in association mapping either variation in trait candidate genes or genome wide single nucleotide polymorphism (SNP) markers are used to attempt the identification of the actual gene that regulate the trait variation. A drawback with QTL-studies is that the variation seen in the mapping population originates from a limited set of parents and thus restricts the generality of the results. In association mapping studies, on the other hand, where preferably unrelated individuals are sampled from natural populations of the species, any detected genotype-phenotype association would have a more general applicability for the species since more alleles are studied (Khan and Korban, 2012). Because recombination at an evolutionary timescale has made the extent of linkage disequilibrium very short, many thousands of markers are needed for a genome wide association study (GWAS) to be able to find an association (Neale and Kremer, 2011).
With the aim of identifying markers for MAS, different QTL studies have been conducted in Populus and Salix species to understand the genetics of different disease resistance traits (Jorge et al., 2005; Rönnberg-Wästljung et al., 2008; Hanley et al., 2011; Samils et al., 2011), phenology and biomass related traits (Dillen et al., 2009; Rae et al., 2009; Wullschleger et al., 2011; Berlin et al., 2014, 2017; Ghelardini et al., 2014). More recently association mapping studies have been performed that identified putative causative genes for growth and phenology traits in Salix and in Populus species (Allwright and Taylors, 2016; Fahrenkrog et al., 2016; Hallingbäck et al., 2016; Carlson et al., 2019) and for traits related to chemical wood properties (Wegrzyn et al., 2010; Guerra et al., 2013; Porth et al., 2013; Muchero et al., 2015; Carlson et al., 2019), all that are of potential interest for breeding purposes.
Salix viminalis is an excellent model species for trees due to the possibility of propagating genotypes vegetatively and thus simplifying the establishment and analysis of common garden experiments across environments. Salix viminalis also has a very short generation time of one or two years which facilitates genetic studies and breeding. Furthermore, S. viminalis is dioecious (like other species of the Salicaceae family) and thus 100% outcrossing giving a high genetic diversity and heterozygosity (Berlin et al., 2014). Linkage disequilibrium for S. viminalis has been estimated to vary from 0.5 to 0.6 with a decrease to 0.2 at around 4000 bp, a slower decrease than in S. schwerinii which could be of importance for GWAS and the possibility to identify associations (Berlin et al., 2011). With a population of S. viminalis consisting of 291 accessions earlier genetically and phenotypically described (Berlin et al., 2014) and studied for associations using a candidate gene approach (Hallingbäck et al., 2016), we here perform a GWAS with markers positioned across the whole genome and biomass traits. The main objective of this study was to identify genotype-phenotype associations for different biomass related traits as well as for plasticity traits. We report on multi-year and multi-environment association analysis on phenology and growth traits as well as plasticity across environments.
Materials and Methods
Plant Material and Field Experiments
The association mapping population includes S. viminalis accessions that originates from the United Kingdom, Sweden, Belgium, Germany, and Western Russia (Berlin et al., 2014), and from natural willow stands in the Czechia (Trybush et al., 2012). The different accessions were collected at latitudes between 48.1°N to 62.4°N and longitudes from 4.8°W to 104.3°E. In spring 2009, field experiments were established at two different environments in Sweden; Pustnäs, south of Uppsala (59.80°N, 17.67°E, 25 m ASL) and in Svalöv, southern Sweden (55.56°N, 13.06°E, 75 m ASL). The two environments differ with respect to temperature during spring (April) and autumn (September, October) months (Table 1) where the town Lund close to Svalöv, showed consistently higher mean month temperatures (difference ranging from 0.9 to 3.6°C) than that of Uppsala close to Pustnäs. Also, the soil in the Pustnäs experiment is a sandy soil with approx. 2% clay while the soil in the Svalöv experiment is a loam with 15–25% of clay content.
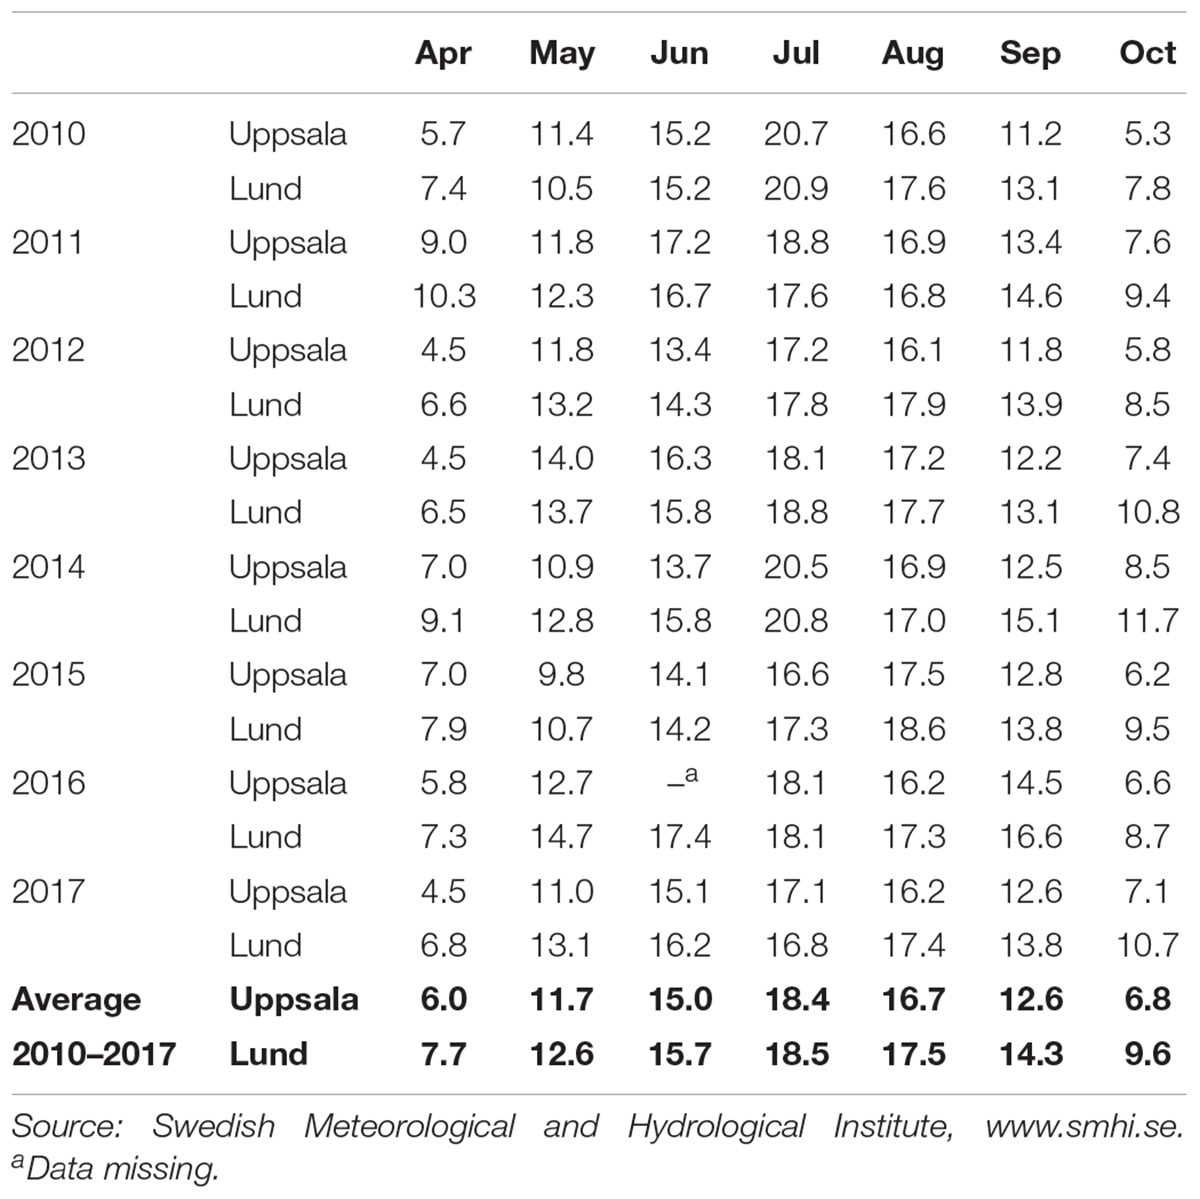
Table 1. Monthly mean temperatures (°C) during the growing seasons of the years in which assessments were made in the Salix field experiments in Pustnäs (near Uppsala) and Svalöv (near Lund).
A total of 388 accessions were planted with 20 cm long cuttings at a density of 15,000 ha-1 at both field experiments. Each accession was represented by six clonal replicates per experiment arranged in a randomized complete block design. The spacing was 130 cm between rows and 50 cm between plants within rows. To avoid border effects, two rows of the accession 78183 were planted outside the experimental plants. Later genetic analyses revealed that several of the accessions were the same clone (Berlin et al., 2014; Hallingbäck et al., 2016) and subsequently they were collapsed and treated as one accession leading to a final number of 321 accessions. Except for the first year when no fertilization was made to the field experiments, fertilization corresponding to 70 kg N ha-1 was applied each year. The plants were cut back in winter 2009/2010, 2013/2014, 2014/2015, and 2016/2017 at both experiments and an additional cut back was made during winter 2010/2011 at Svalöv. Further details about the association mapping collection are found in Berlin et al. (2014).
Phenotypic Measurements
Leaf bud burst was assessed on each individual plant in Pustnäs during spring 2010, 2011, 2013, and 2014 using a scale between 1 and 5 where 1 equals no sign of bud growth and 5 equals the most developed bud burst stage, with one or more leaves growing perpendicular to the shoot axis (Weih, 2009). The bud burst assessments were repeated during a period between late April and middle of May in order to find the time point for each year where the most variation in bud burst was observed (May 5, 2010; April 15, 2011; May 2, 2013; April 29, 2014, respectively). These timepoints were chosen as traits for further analyses (BB10, BB11, BB13, BB14; Table 2). Leaf senescence and abscission were visually assessed in Pustnäs on November 4 and 5, 2010 (LS10), on October 31, 2011 (LS11), and in Svalöv on November 9, 2016 (LS16) according to a leaf senescence index (LSI) from 0 to 4 with 0 = no leaves left on the plant (100% abscission) and 4 = more than 80% green leaves (∼10% abscission) (Ghelardini et al., 2014). During winter 2010/2011 and 2015/2016 two growth traits closely related to total biomass (Nordh and Verwijst, 2004) were assessed at Pustnäs, while at Svalöv these measurements were taken only during winter 2015/2016. The number of shoots (Nsh11, Nsh16) was counted and the diameters on all shoots above 105 cm from the ground were measured. Mean diameter (MeanD11, MeanD16) and the summed basal area (SumBA11, SumBA16) were calculated and used for analysis. During cut back of all plants winter 2013/2014 and 2016/2017 fresh weight (FW14, FW17) and total number of shoots (Nsh14, Nsh17) of each plant were taken at both experiments.
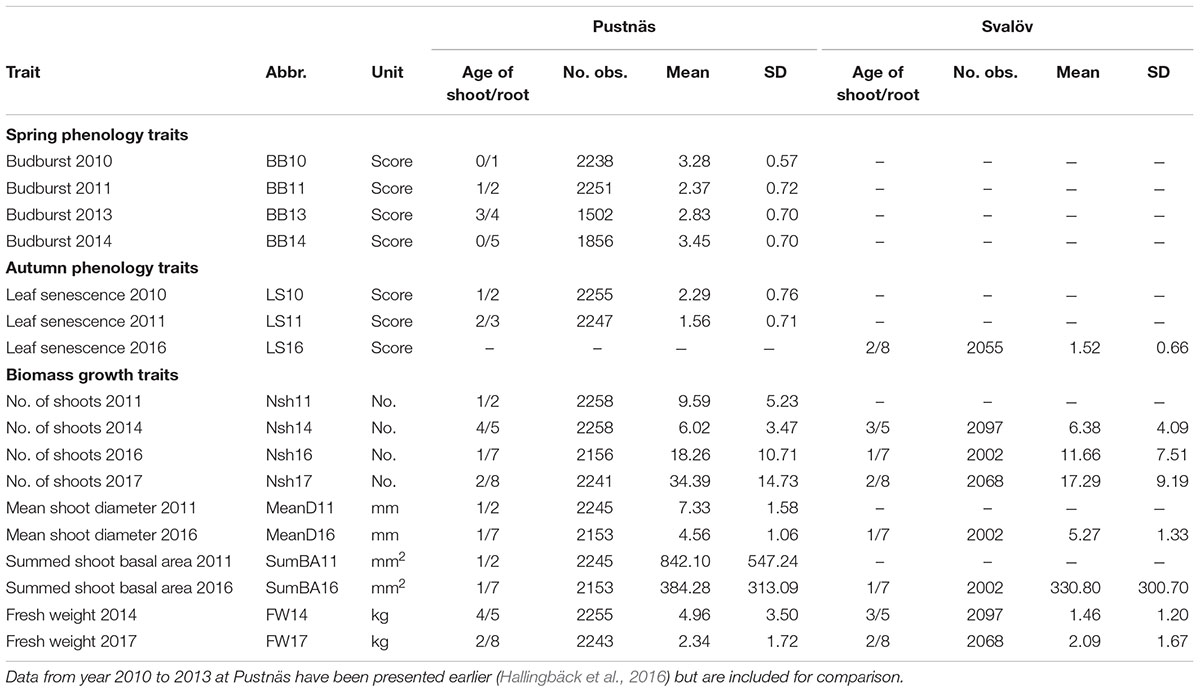
Table 2. Summary statistics for the traits; abbreviations, measurement units, number of plants measured, overall arithmetic means (per plant), and individual standard deviations (SD) for Pustnäs and Svalöv.
Genotyping-by-Sequencing
From unique accessions of the study population, young leaves were sampled (approximately 200 mg) and DNA was extracted following a CTAB-protocol described in Pucholt et al. (2017), which in turn was a modification of the protocol from Brunner et al. (2001). DNA-extracts were genotyped with the genotyping-by-sequencing method (GBS) at the Genomic Diversity Facility, Cornell University, Ithaca, NY, United States. In a manner much similar to that of Elshire et al. (2011), the DNA was digested by the ApeKI restriction endonuclease, ligated to sample specific barcode adapter sequences and subsequently sequenced on an Illumina Next-generation sequencing (NGS) platform (Illumina Inc., San Diego, CA, United States). Sequence reads and polymorphisms were provided at the Genomic Diversity Facility by running the Tassel GBS analysis pipeline v. 3.0.166 (Glaubitz et al., 2014) using the available genome sequence of the close relative Salix purpurea as a mapping reference (Zhou et al., 2018; Salix purpurea v1.0, DOE-JGI1). For the 291 accessions for which sampling, DNA extractions, and genotyping were successful, DNA sequence sites showing polymorphisms were identified. The resulting genotype data were merged by Tassel ver. 4.3.7, provided to us as Variant Call Format files (VCF) and is stored at a publicly available repository (Hallingbäck et al., 2019). The polymorphisms consisted mainly of biallelic SNPs (1,235,800) plus smaller numbers of alleged triallelic SNPs (231,512), biallelic indels (67,435), and triallelic indel/SNP combinations (21,047).
For each putative polymorphic site, diploid genotypes were called by finding the maximum likelihood for the observed distribution of haplotype sequence reads (Hohenlohe et al., 2010). But in order to avoid biases and to ensure sufficient calling accuracy, genotypes were called only provided a read depth of at least five at any particular site and accession. Otherwise the genotype was set as missing. Assuming an Illumina genotyping error rate of 0.1% this procedure implies a diploid genotype calling accuracy above 97%. The polymorphism data produced by GBS was thereafter merged with genotype data from 1290 SNPs previously developed for this population (Hallingbäck et al., 2016). Mapping of the old SNPs to the S. purpurea genome was performed by Blast (e < 10-9) whereupon all polymorphic sites were sorted according to increasing chromosome number and position with respect to the reference. The polymorphic sites were then filtered based on data completeness and on minor allele frequency (MAF) depending on intended downstream use. All the above-mentioned processing steps were performed with VCFtools ver.0.1.12b. Furthermore, to reduce the number of sites produced by erroneous merging of paralog or repetitive sequences, all sites for which the frequency of heterozygotes exceeded 70% were removed using a custom perl script. Assuming Hardy–Weinberg equilibrium, even triallelic sites should never exhibit heterozygosity frequencies above 66.7%.
Structure and Kinship Analysis
In order to take into account the effects of population structure and relatedness, structure and relatedness was inferred. This was done using a dataset which used all polymorphic sites with >95% called genotypes and a MAF of >1% resulting in total 19,243 markers. Using this dataset, a kinship matrix (K) for the sample population was estimated in accordance with Loiselle et al. (1995). Moreover, population structure was investigated by applying an admixture model with correlated allele frequencies within populations using the software STRUCTURE ver. 2.3.4 (Pritchard et al., 2000; Falush et al., 2003). In order to avoid potentially adverse effects of linkage disequilibrium between markers the dataset used for this was reduced by selecting every fifth marker (3,848 markers) out of those used for kinship estimation. The number of clusters assumed (k) was set to vary from one to ten. The length of the burn-in period was set to 20,000 iterations and the subsequent sample recording period was set an additional 40,000 iterations. For each k, ten replicates were run. Similarly to previous studies using smaller marker sets (Berlin et al., 2014), the optimal value of k was found to be 4 by examination of the maximum log-likelihood at convergence and on Evanno’s Δk statistics (Evanno et al., 2005). A graphical illustration of the ancestry of individual accessions to the population structure clusters is shown in Supplementary Figure S1.
Development of Accession Estimators
To obtain unbiased estimators (BLUEs) for each accession and trait, phenotypic data was subjected to variance decomposition applying linear mixed models (LMM) with the statistics software ASReml 3.0 (Gilmour et al., 2009). All analyses were made on untransformed data since, even though the distributions for some of the number of shoots, summed shoot basal area and fresh weight deviated from normal, the results from the analysis with transformed data did not differ from analyses with original data. The mixed linear model applied was:
where yijkl is the phenotypic trait value in the ith block for the jth accession located at row k and position l. The overall mean is denoted as μ while b signifies the fixed block effect, c the fixed accession effect, r ×p the random interaction between rows and positions (spatial term) and e the random residual. Random effects were assumed to be independent except for the spatial term (r ×p) which was restricted to follow a two-dimensional first order autoregressive correlation structure (Cullis and Gleeson, 1991) across plant rows and positions. Thus accession estimators (yes) adjusted for block and spatial environmental effects were obtained from the effect estimates as yes,j =  + ĉj and were used in subsequent analyses.
In addition to the estimators per se, the (broad sense) accession estimator heritability was also estimated for each trait and for that purpose c was instead considered to be random. may serve as an indicator of accession estimator precision and was calculated from the estimated accession variance () and error variance () components as:
where n is the harmonic mean of the number of measured plants per accession.
For each clone, plasticity variables of traits were calculated as the standardized (mean = 0, standard deviation = 1) BLUE values in Pustnäs subtracted with standardized BLUE values in Svalöv when traits were measured the same year (Nsh14, Nsh16, Nsh17, MeanD16, SumBA16, FW14, FW17).
Association Mapping Marker Dataset
Polymorphic sites used as markers for the association mapping itself were required to be biallelic, have clear genotypic calls for at least 75% of the individuals and MAF > 5%. Furthermore, any adjacently located indel polymorphisms that would cancel each other out (erroneously called in the GBS pipeline) were removed. The LD (r2) between closely situated markers (according to the S. purpurea reference) was estimated using a maximum likelihood method (Hill, 1974) implemented in the function “LD” in the Genetics library of R. This calculation was performed using a sliding window scheme where the LD was estimated between each marker and its 100 closest neighbor markers – upstream and downstream. In this way, certain groups of markers were found to be redundant (r2 > 0.99) and only one representative marker, having the highest genotype call percentage in that group, were retained for further analysis. Redundant markers were nonetheless kept in a separate accessory marker list to enable future reference. In all, the fully filtered association mapping dataset comprised 19,411 polymorphic markers. Missing marker genotypes were imputed using the LD-kNNi method as implemented by Money et al. (2015) in the software LinkImpute. The number of nearest relatives (k) and the number of SNP markers within a 10 Mb distance that were in closest LD with the marker to be imputed (l), were optimized by LinkImpute and were determined as k = 15 and l = 5.
Association Mapping Analysis and Model Selection
Using the imputed marker dataset and the previously calculated accession estimators (yes), a second series of multilocus linear mixed model (MLMM) analyses were performed, again using ASReml 3.0 (Gilmour et al., 2009). The number of accessions having both the required genotype data and accession BLUE estimators were 291 and 288 for Pustnäs and Svalöv, respectively (288 accessions in common). The MLMM were applied in separate analyses for each trait at the Pustnäs experiment, the Svalöv experiment and for the plasticity traits as:
where yes is the vector form of the BLUE accession estimators (yes,j), q and g are the vectors of fixed population ancestry and SNP genotype effects, respectively, u is the vector of random chip additive genetic effects (Speed et al., 2012; Kruijer et al., 2015) linked to the marker-based kinship matrix K, and ees is the vector of the random residual effects. The design matrix S constitutes the individual genotypes for one or several analyzed SNPs as separate and independent factors, implying genetic effects of the form: g = [gAA,1 gAa,1 gaa,1 … gAA,n gAa,n gaa,n]T for markers 1 to n included in the model, each featuring the genotypes AA, Aa, and aa, respectively. F and Z link the respective individual ancestry proportion and additive chip effect to its observation. All effects were considered to be statistically independent except for the chip additive genetic effects whose variance was assumed to be structured as where is the chip additive genetic variance. The number of markers included in the Sg model factor was determined by consecutive scans of all markers using the forward–backward stepwise model selection approach of Segura et al. (2012). Structure component effects (q) and chip additive genetic variance () were re-estimated for each analysis. In the forward model selection phase, the SNP with the largest -log(p) values (Wald-F test) was selected and during the backward phase, the included SNP with the smallest -log(p) value was eliminated. Forward selections of up to five markers were made and the model with the maximum number of markers all exhibiting Bonferroni corrected p-values of 0.2 or less (p < 1.03 × 10⁻⁵) was reported and further analyzed. The percentage variance explained of any marker i added to the model (), was calculated as the difference between the percentage variance explained of all fixed effects already in the model including marker i () and the corresponding percentage of variance explained of a reduced model including the same fixed effects except for marker i (). Please note that and comprise fixed effects of ancestral structure (q) as well as all marker genotype effects (g) of stronger statistical significance than marker i in order to discount R2 inflation due to collinearity (e.g., due to LD). Both and were estimated using the fixed effect estimators for their respective models as advocated by Nakagawa and Schielzeth (2013). Finally LD correlations were estimated between all significantly trait-associated markers using the “LD” function of the Genetics R-package.
For each identified marker association, all genes in the region 3,000 bp up- and downstream the marker position were checked in the S. purpurea genome (Zhou et al., 2018; Salix purpurea v1.0, DOE-JGI, see footnote 1). The size of the region to check genes were based on LD estimates of S. viminalis (Berlin et al., 2011), which show a decay of LD to a non-significant value of 0.2 at a distance of 4,000 bp from the marker.
Chip Genetic Parameter Estimation
For the association analyses the full model previously presented was used, but in order to estimate other genetic parameters adjusted for ancestral structure such as the chip narrow sense heritability () and accession correlations between traits or environments (rs), analyses were made were the model component of individual markers (Sg) was excluded.
Thus, for each trait, was calculated from the estimated chip additive genetic and residual variance components () as:
Furthermore, in order to structure adjusted estimate accession correlations (rs) between traits thereby also assessing the potential occurrence of genotype-by-environment (G × E) interactions, multivariate extensions of the previously described model were made treating each trait-year-environment combination as a separate variate (e.g., Burdon, 1977). Accession correlations were based on the summed variances of the random effect model terms for any trait 1 or 2 (e.g., ) and the correspondingly summed covariances between trait 1 and 2 (σA12 + σe,es12) as:
Estimation errors for all genetic parameters were calculated using the delta method based on the Taylor series approximation (Casella and Berger, 2002).
Results
Trait Means and Variation
The association mapping population showed large variation for all measured traits both at Pustnäs and at Svalöv (Table 2 and Figure 1). The number of shoots and fresh weight during 2014 were measured and harvested when the experiments had different shoot ages, 4 and 3 years for the Pustnäs and Svalöv experiments, respectively. This was reflected by the higher mean fresh weight in Pustnäs compared to Svalöv (Table 2). During 2016 there were some tendencies for a higher number of shoots with lower mean diameter at the Pustnäs experiment compared to Svalöv, which also resulted in a higher summed basal area in Pustnäs. Still, these values were accompanied by large standard deviations and might not reflect a true difference between the experiments. For 2017 a comparison between the experiments show larger number of shoots in Pustnäs but during this year the difference in fresh weight between experiments was small.
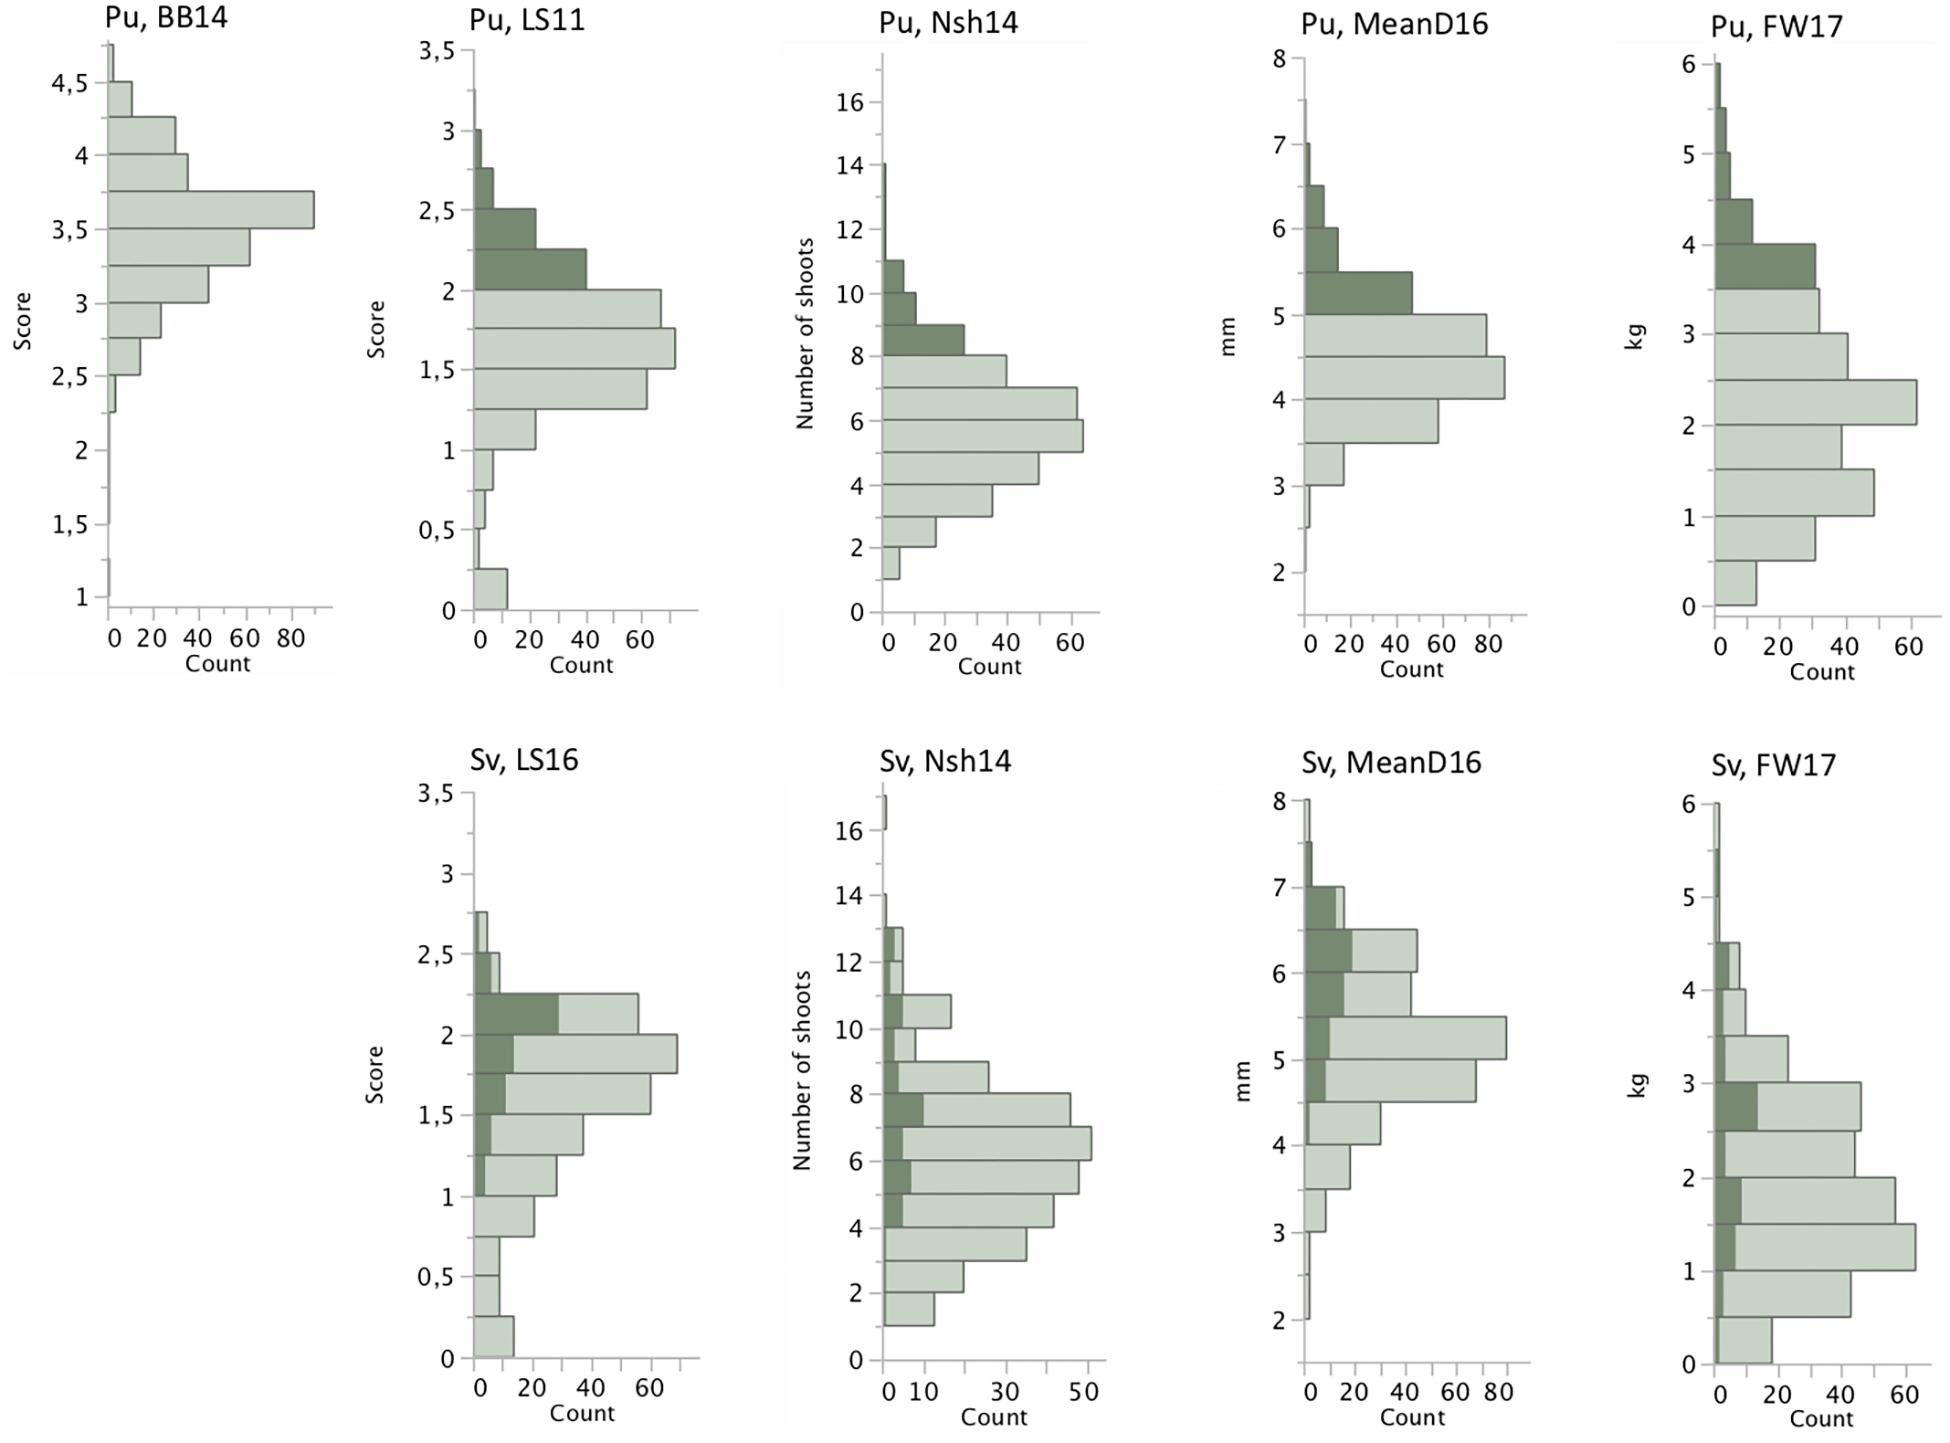
Figure 1. Phenotypic distributions of a subset of the measured traits based on arithmetic means of each accession in the two field experiments, Pustnäs and Svalöv. Shaded bars indicate the accessions with highest trait mean values in Pustnäs and the values for the corresponding trait and the same accessions in Svalöv.
Marker Variation
The marker dataset used for association mapping analyses consisted of 19,411 polymorphic markers fairly evenly distributed across the genome (Figure 2). Of these markers 18,273 (94%) were genotyped using the genotyping-by-sequencing approach while the remainder 1,138 markers were available from previous candidate gene exploration (Hallingbäck et al., 2016). Mapping to a chromosome of the established S. purpurea genome was possible for 16,943 markers (87%) while the remainder 2,468 markers could only be mapped to 569 incompletely integrated sequence in smaller sized scaffolds (Figure 2). 17,853 (92%) of the markers were regular biallelic SNPs while the remainder 1,558 (8%) were single nucleotide indels.
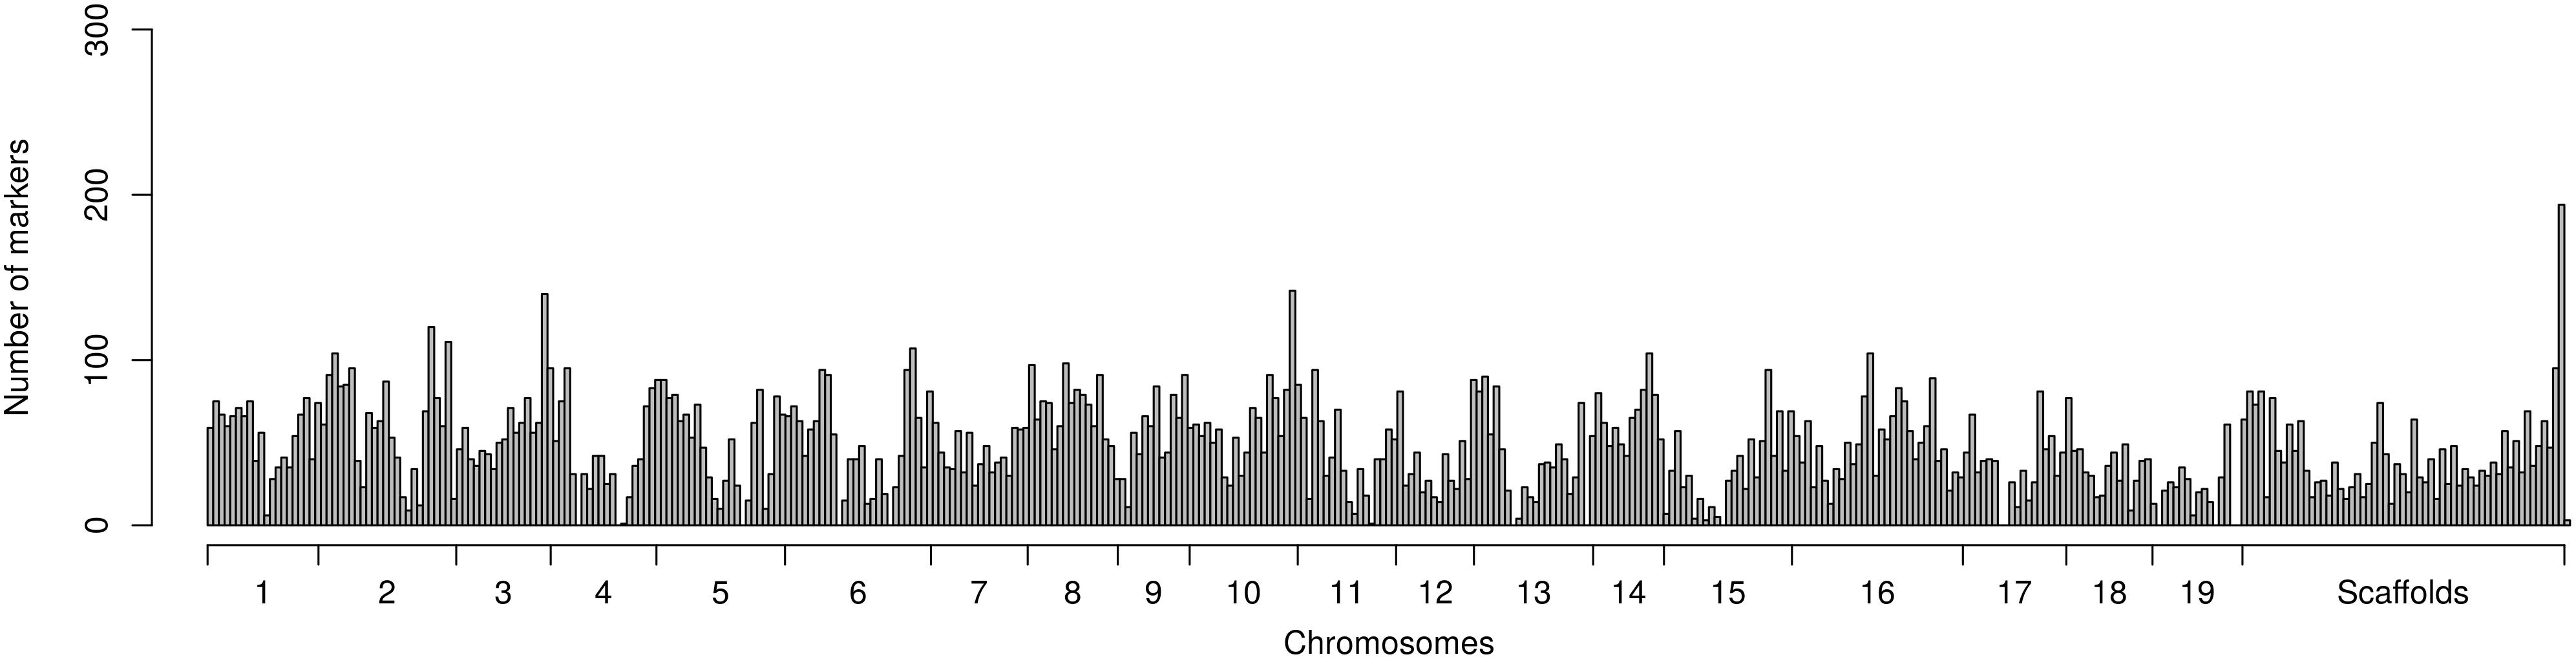
Figure 2. Distribution of markers mapped across the genome sequence of Salix purpurea genome available to the public. Each marker distribution bin encompasses 1 Mb of the genome sequence.
Genetic Parameters
Table 3 shows broad-sense accession estimator heritabilities () as well as structure-adjusted narrow sense chip heritabilities () for each trait in both Pustnäs and Svalöv. In general, -estimates were medium ( between 0.56 and 0.69) to high ( above 0.70) reflecting a considerable genetic component underlying the accession variation. Autumn phenology traits showed especially high -estimates ranging from 0.89 to 0.95. Also, chip heritabilities in Svalöv were high ( above 0.73) independent of the trait while in Pustnäs estimates varied considerably (from 0.24 for SumBA11 to 0.97 for MeanD16) for growth traits. The phenology -estimates in Pustnäs were high (0.75–0.99) with BB10 being the only exception ( at 0.45). As the relationship between accessions was generally low, estimation errors of the chip heritabilities are considerable.
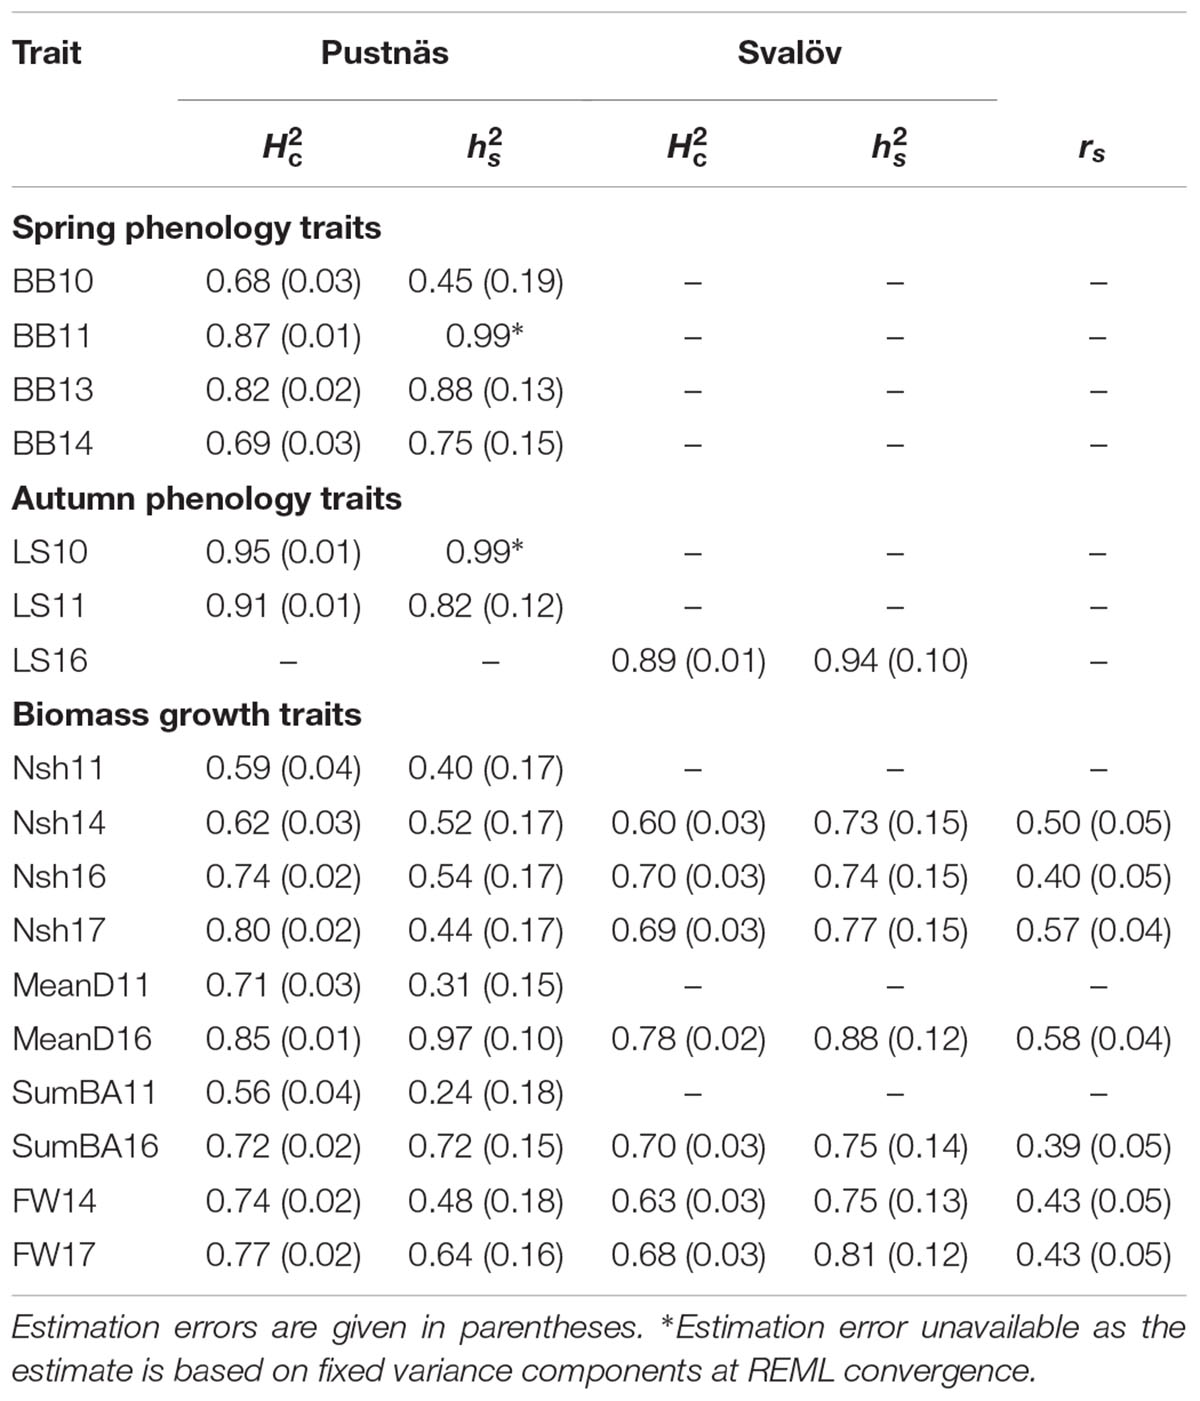
Table 3. Broad sense accession estimator heritability () and structure-adjusted narrow-sense chip heritabilities () estimated for each trait measured at Pustnäs and Svalöv along with the structure-adjusted accession correlations (rs) between these two field experiments.
Structure adjusted accession correlation estimates across environments were low-to-moderate for the different traits (0.39–0.58) indicating G × E-interactions (Table 3). This was also reflected in Figure 1 where the accessions with highest mean values in Pustnäs (shaded) do not always have the highest values in Svalöv. Plots of accession BLUEs in Figure 3 illustrate for fresh weight (FW) 2017 and 2014 the limited structure-adjusted accession correlations between experiments where the accessions with highest FW in Pustnäs were not the accessions with highest FW in Svalöv and vice versa. Still some accessions showed a stability in FW17 across experiments (Figure 3A).
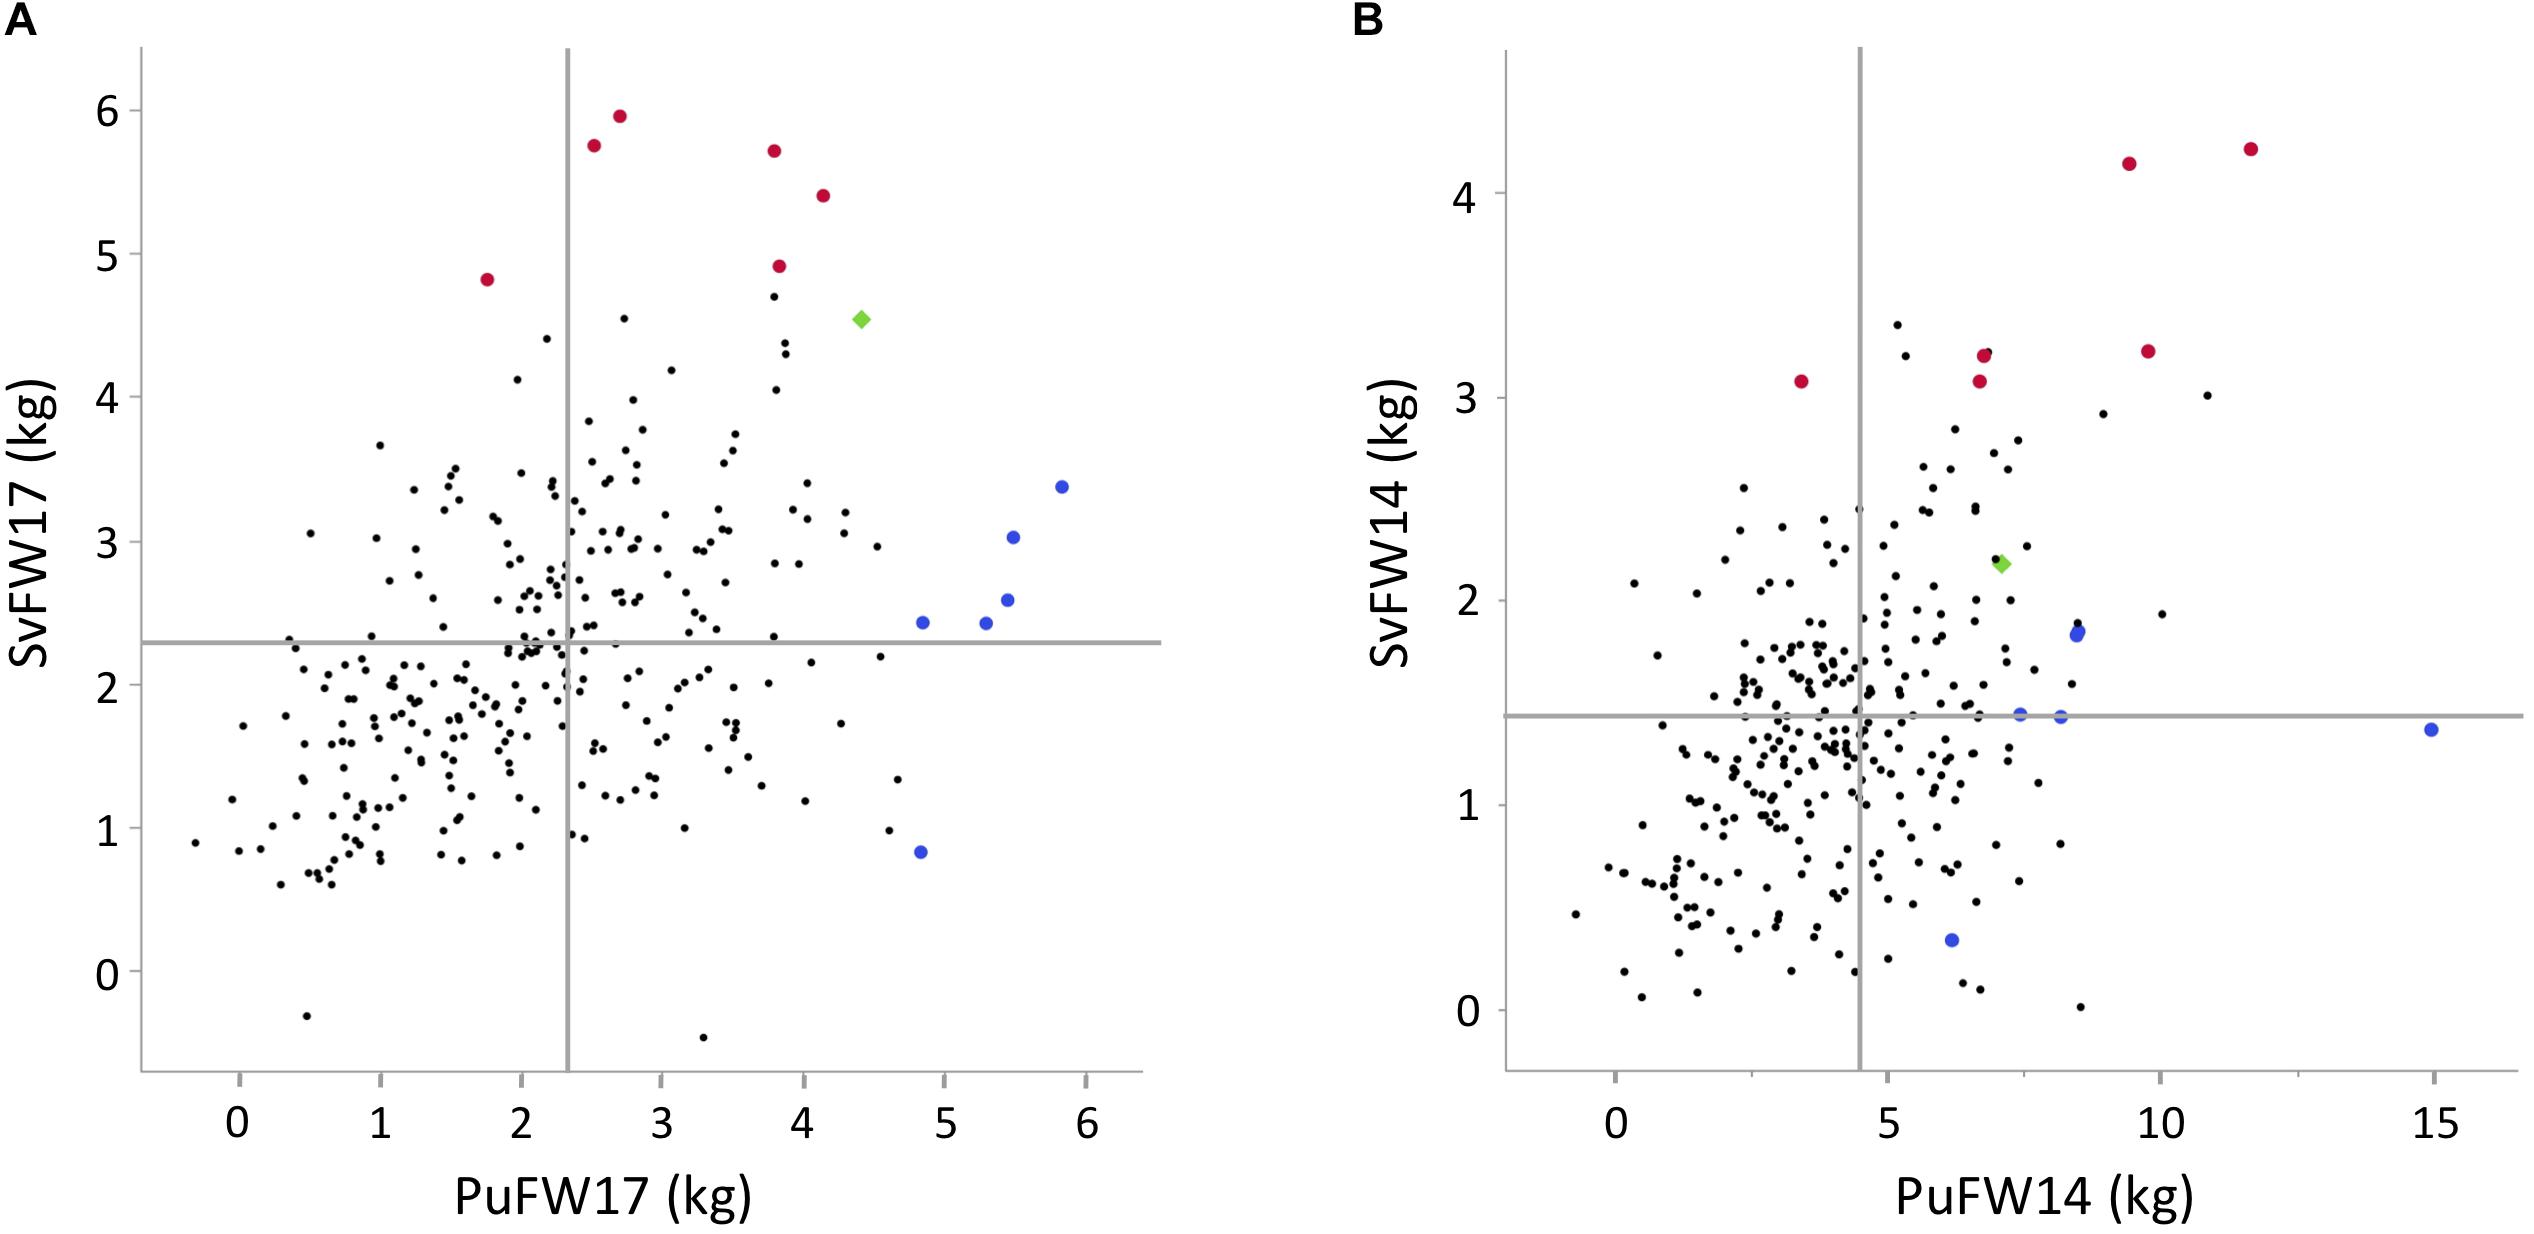
Figure 3. Plots of BLUE accession estimators for different traits between the two field experiments, (A) FW17, (B) FW14. Red enlarged dots represent the best accessions for FW17 in Svalöv, the blue enlarged dots in Pustnäs, and the green square represent an accession that has high FW17 at both experiments. Horizontal lines indicate the BLUE means in Svalöv and vertical line indicate BLUE means in Pustnäs.
For structure adjusted accession correlations between traits at the same environment but measured during different years, estimates were moderate-to-high (0.45–0.94) for the number of shoots (Nsh), estimated biomass (SumBA) and fresh weight (FW) both at Pustnäs and Svalöv (Table 4). For FW this is also illustrated in Figure 3 where, especially in Svalöv, the accessions with the highest FW in 2017 also in many cases exhibited the highest FW in 2014. Bud burst in Pustnäs did not show high correlations between measurements (0.15–0.52). In particular the 2013 bud burst assessment correlated poorly with the assessment made in 2010 as well as in 2014. Bud burst in 2010 and 2014 was scored from the stump close to ground level which implies an environment different from the budburst scoring in 2013 which was performed on 3-year-old stems on a height level of one or several meters above the ground. This difference would be the most reasonable explanation for the low rs-estimates. The structure-adjusted accession correlations between different growth traits were above 0.50 in 50% of the possible correlations in Pustnäs and in 82% of the correlations in Svalöv while correlation magnitudes between the two different phenology traits measured in Pustnäs never exceeded 0.5 (-0.07 to 0.15) (Table 4). Very few accession correlations between phenology and growth traits at any of the environments were above 0.5 (2% in Pustnäs and none in Svalöv).
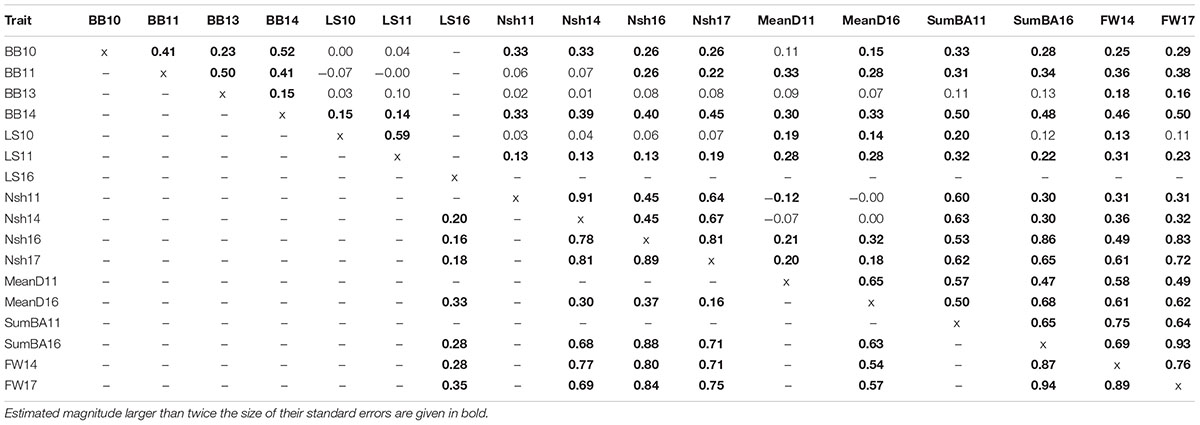
Table 4. Accession correlations (rs) adjusted for population structure between traits measured in Pustnäs (above diagonal) and Svalöv (below diagonal).
Association Mapping
In total, across all traits and environments as well as for the plasticity of traits, 39 marker-trait associations of significance (p < 0.2 after Bonferroni correction) were found (Tables 5, 6 and Supplementary Figures S2–S8). Of these associations five were based on recessive effects linked to a homozygote group with only one accession while an additional six associations were based on recessive effects linked to a homozygote group of five accessions with very close kinship (𝜃 ranging from 0.620 to 0.672) that originated from beyond the Ural Mountains. These particular associations should thus be treated with skepticism. However, discounting such associations ten associations between markers and phenology traits were nonetheless found in Pustnäs (Table 5). For growth traits we also found eight such associations in Pustnäs. In Svalöv no significant association was found for the only phenology trait (LS16), but for growth traits six marker-trait associations not affected by the aforementioned issues, were identified.
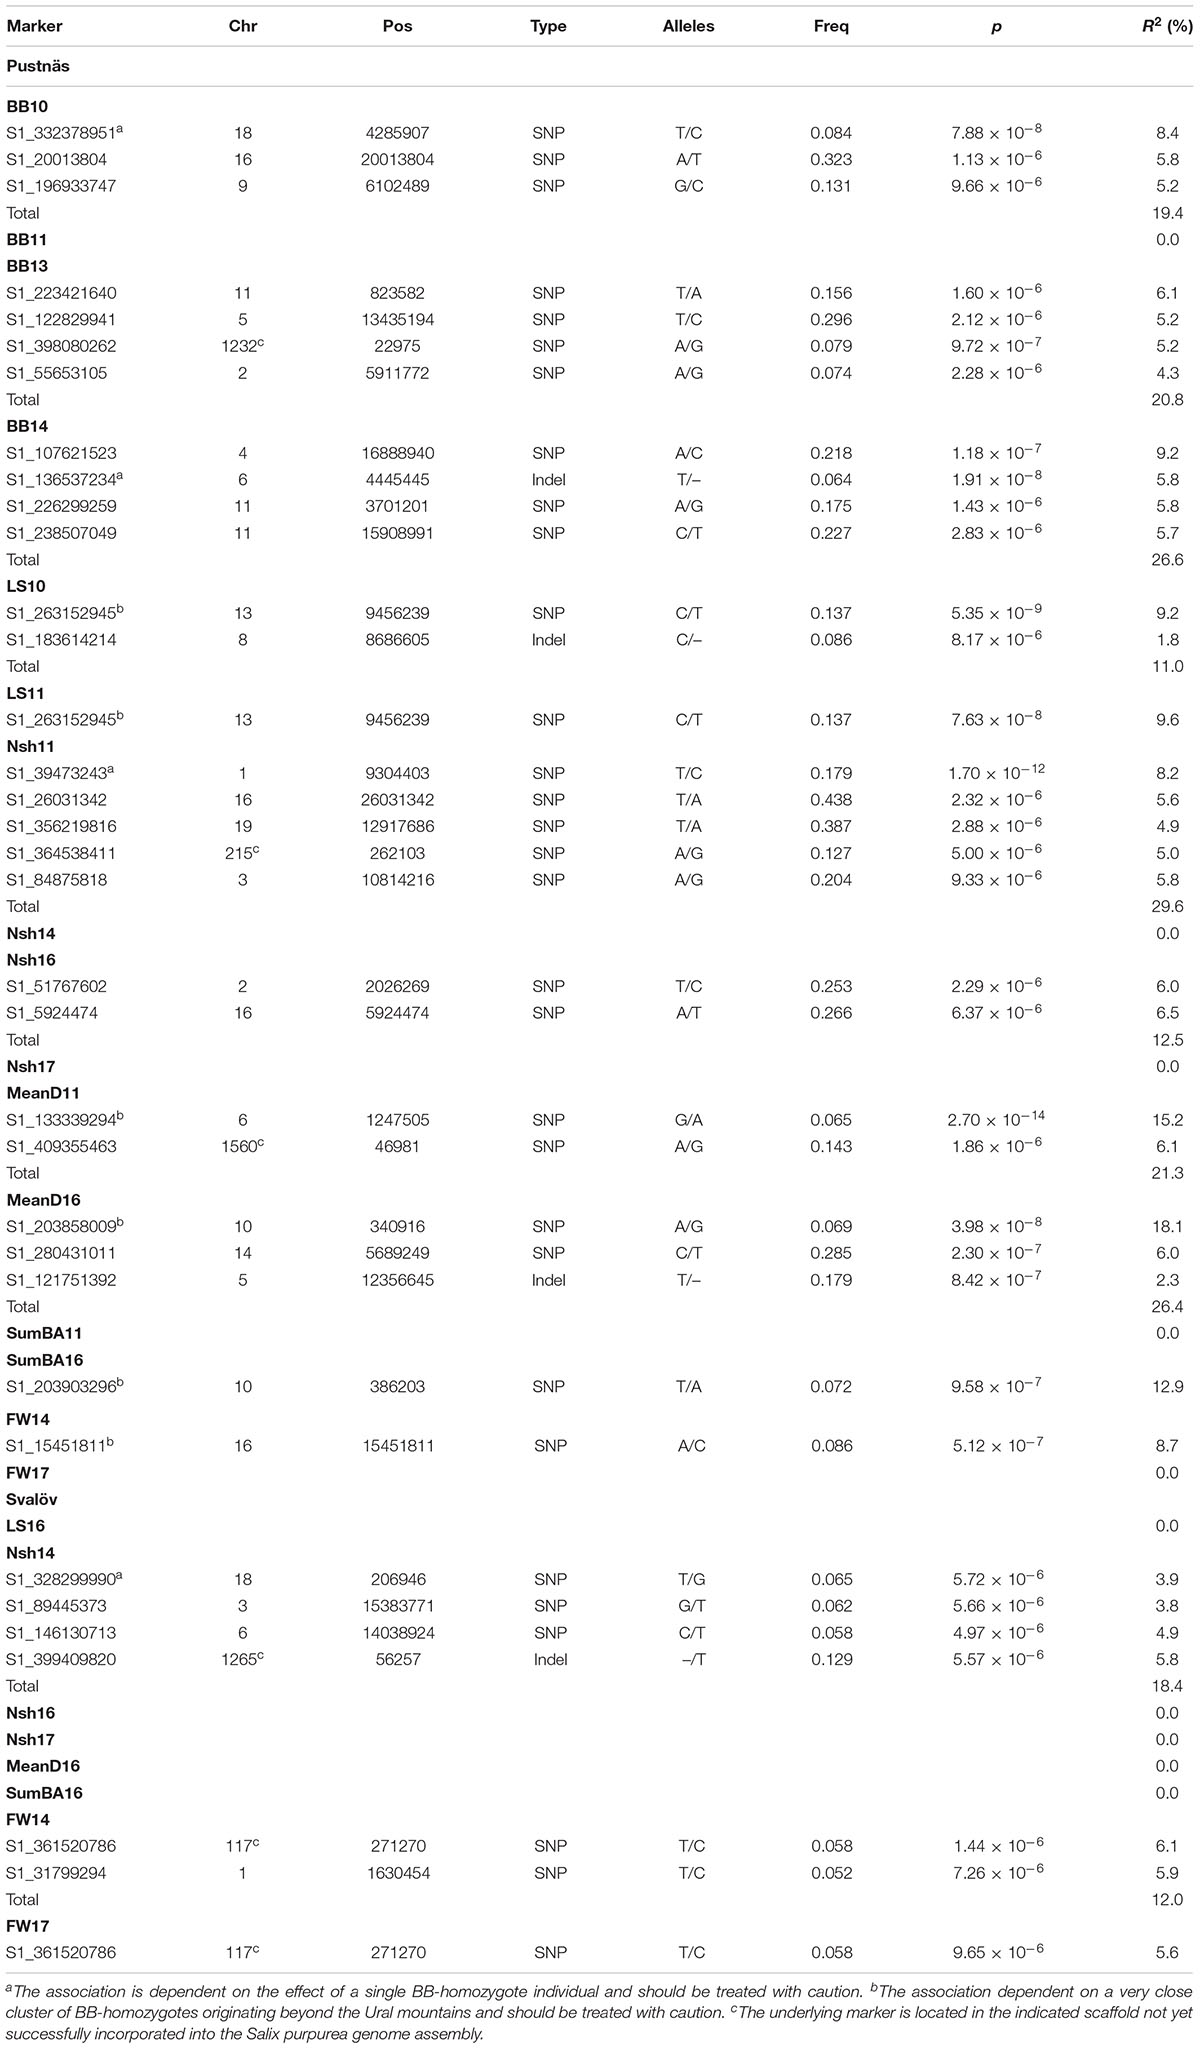
Table 5. Marker-trait associations satisfying the chosen significance threshold (p < 1.03 × 10⁻⁵) observed from analysis of the Pustnäs or Svalöv experiments plus marker type, alleles (common/rare), and rare allele frequencies for the corresponding markers.
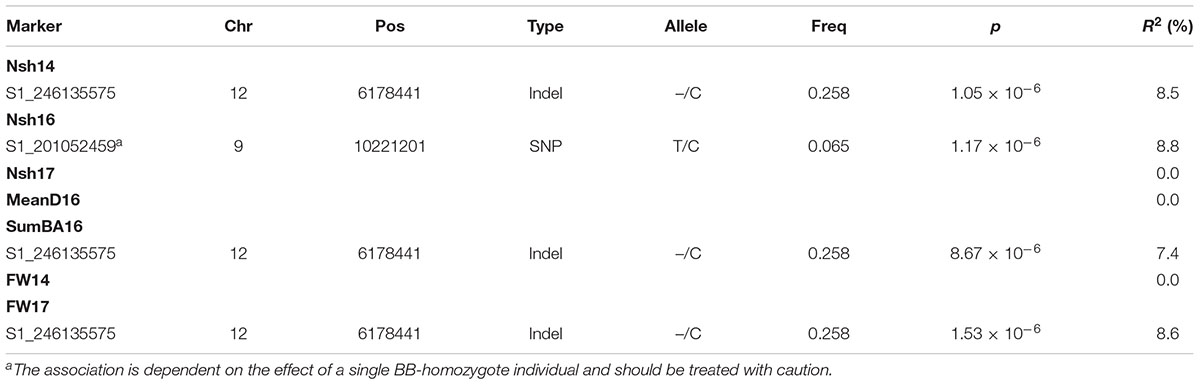
Table 6. Marker-trait associations satisfying the chosen significance threshold (p < 1.03 × 10⁻⁵) observed for calculated plasticity of traits between the Pustnäs and Svalöv experiments plus marker type, alleles (common/rare), and rare allele frequencies for the corresponding markers.
When considered individually, trait-associated markers explained from 1.8 to 18.1% of the accession variation but when discounting for association effects dependent on single homozygotes or to the five accessions beyond the Ural Mountains, any single trait-marker association explained up to 9.2% of the accession variation. Taking into account the variation explained by all marker associations for a trait, -estimates could reach 20.8% (BB13, BB14) when many markers were identified. Significant markers were rarely associated to several traits simultaneously but the marker S1_361520786 was a notable exception being connected to fresh weight in Svalöv during both harvests in 2014 and in 2017 (Table 5). With respect to this marker the rare allele homozygotes exhibited 130 to 151% better growth in terms of biomass traits (SumBA, FW) in Svalöv (Figure 4B) in comparison to the population mean. Indeed this marker showed effects of similar tendencies for SumBA11 and FW14 also in Pustnäs (25–80%; Figure 4A) although this trend was not statistically significant (p > 0.2 after Bonferroni correction). The interpretation of the marker S1_361520786 effects also requires some caution because only two rare allele homozygotic accessions constituted the basis for the apparent recessive effect raising the possibility that the effects may be overestimated. Nonetheless the effect cannot be dismissed as a case of cryptic structure because the two homozygotic accessions involved were almost completely unrelated according to kinship estimates (𝜃 = 0.010).
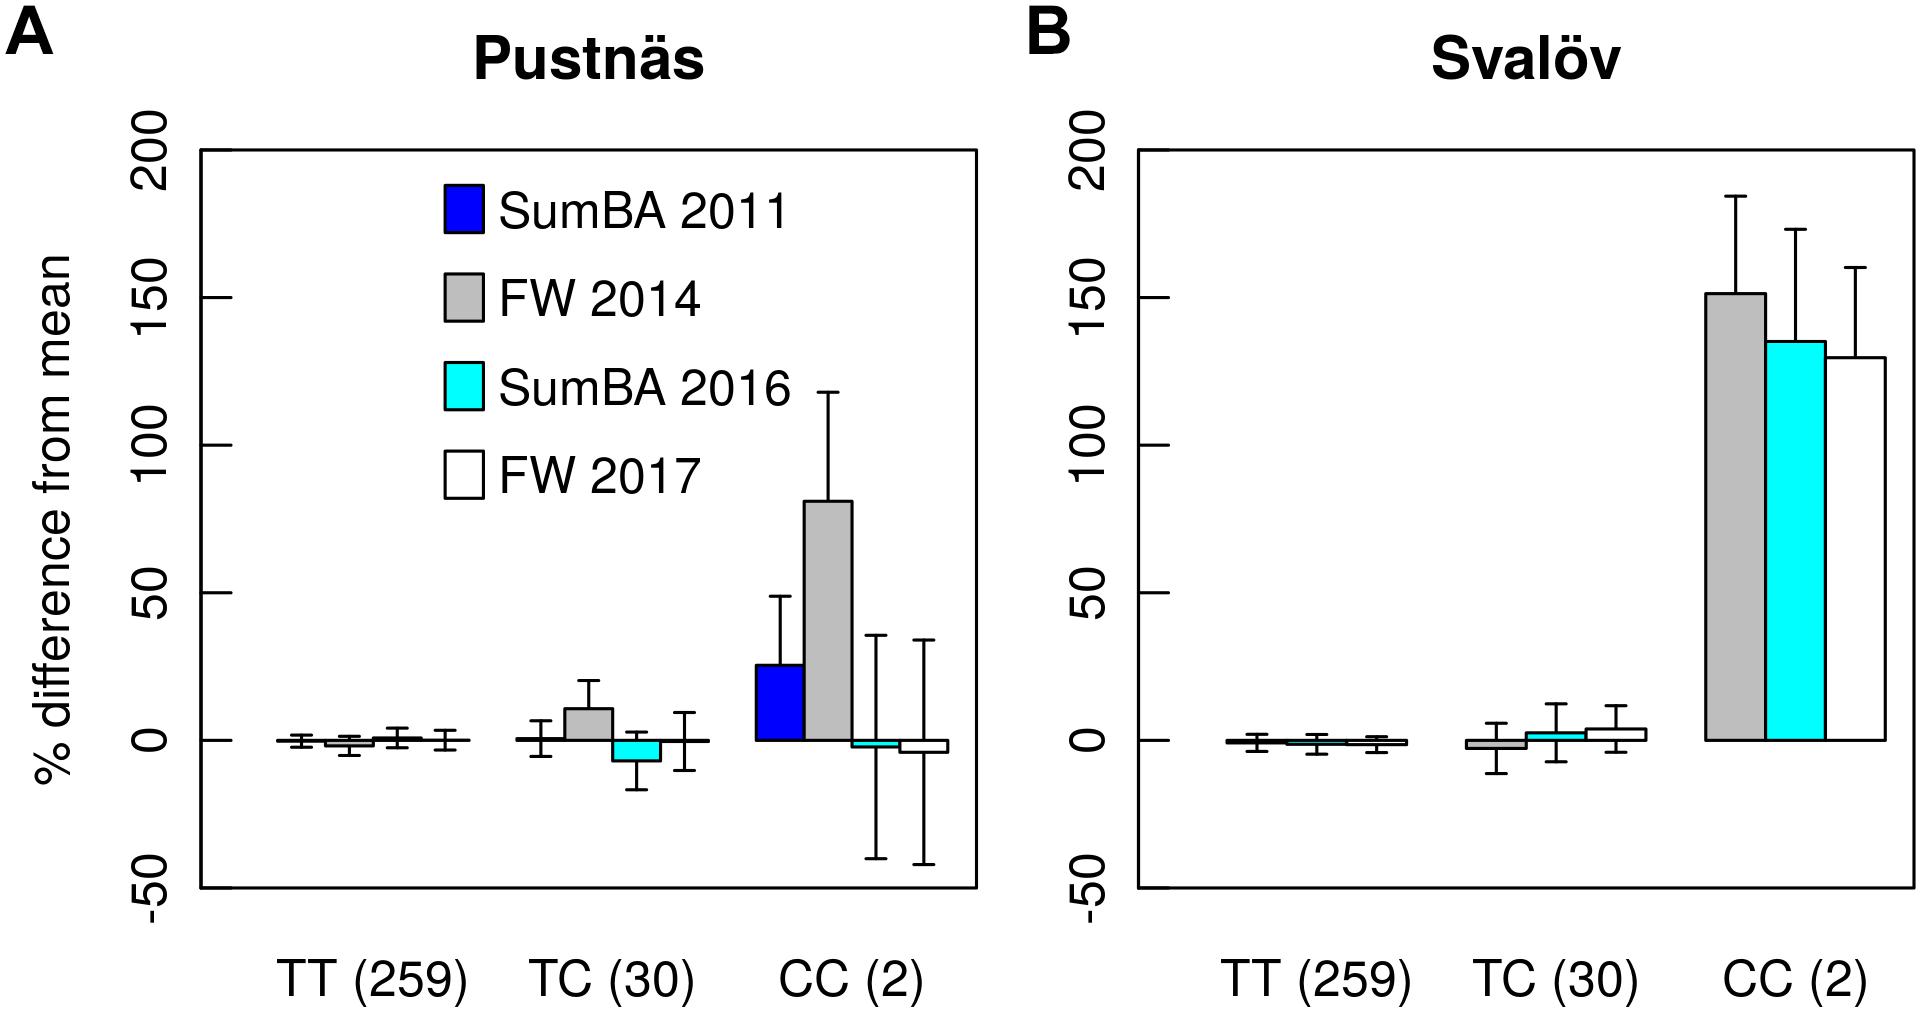
Figure 4. Genotype effects for the marker S1_361520786 on summed basal area of shoots (SumBA) and fresh weight (FW) at Pustnäs (A) and Svalöv (B) as percentages related to the population mean. The values in parentheses after each genotype group describe the number of accessions belonging to that group.
A total of four associations were found for plasticity traits. Interestingly, one specific marker on chromosome 12 (S1_246135575) was associated both with the plasticity of number of shoots 2014, SumBA16 and FW17 explaining from 7.4 to 8.6% of the accession variation (Table 6 and Supplementary Figures S7, S8). In Figure 5 the effects of this indel marker is shown for different genotypes both with respect to the plasticity traits (subplots E,F) as well as for the biomass traits themselves at the two field experimental locations (subplots A–D). The addition of an insert-C allele appeared to confer a substantial negative effect in Svalöv for SumBA16 and FW17 (-12 to -17%, Figure 5D) while exerting a positive effect on the corresponding traits in Pustnäs (7–20%, Figure 5B). A similar although less obvious pattern was also observed for the number of shoots (Figures 5A,C). In terms of plasticity this implied an overall positive additive effect of an added insert-C allele ranging from 0.10 to 0.61 accession standard deviations (Figures 5E,F).
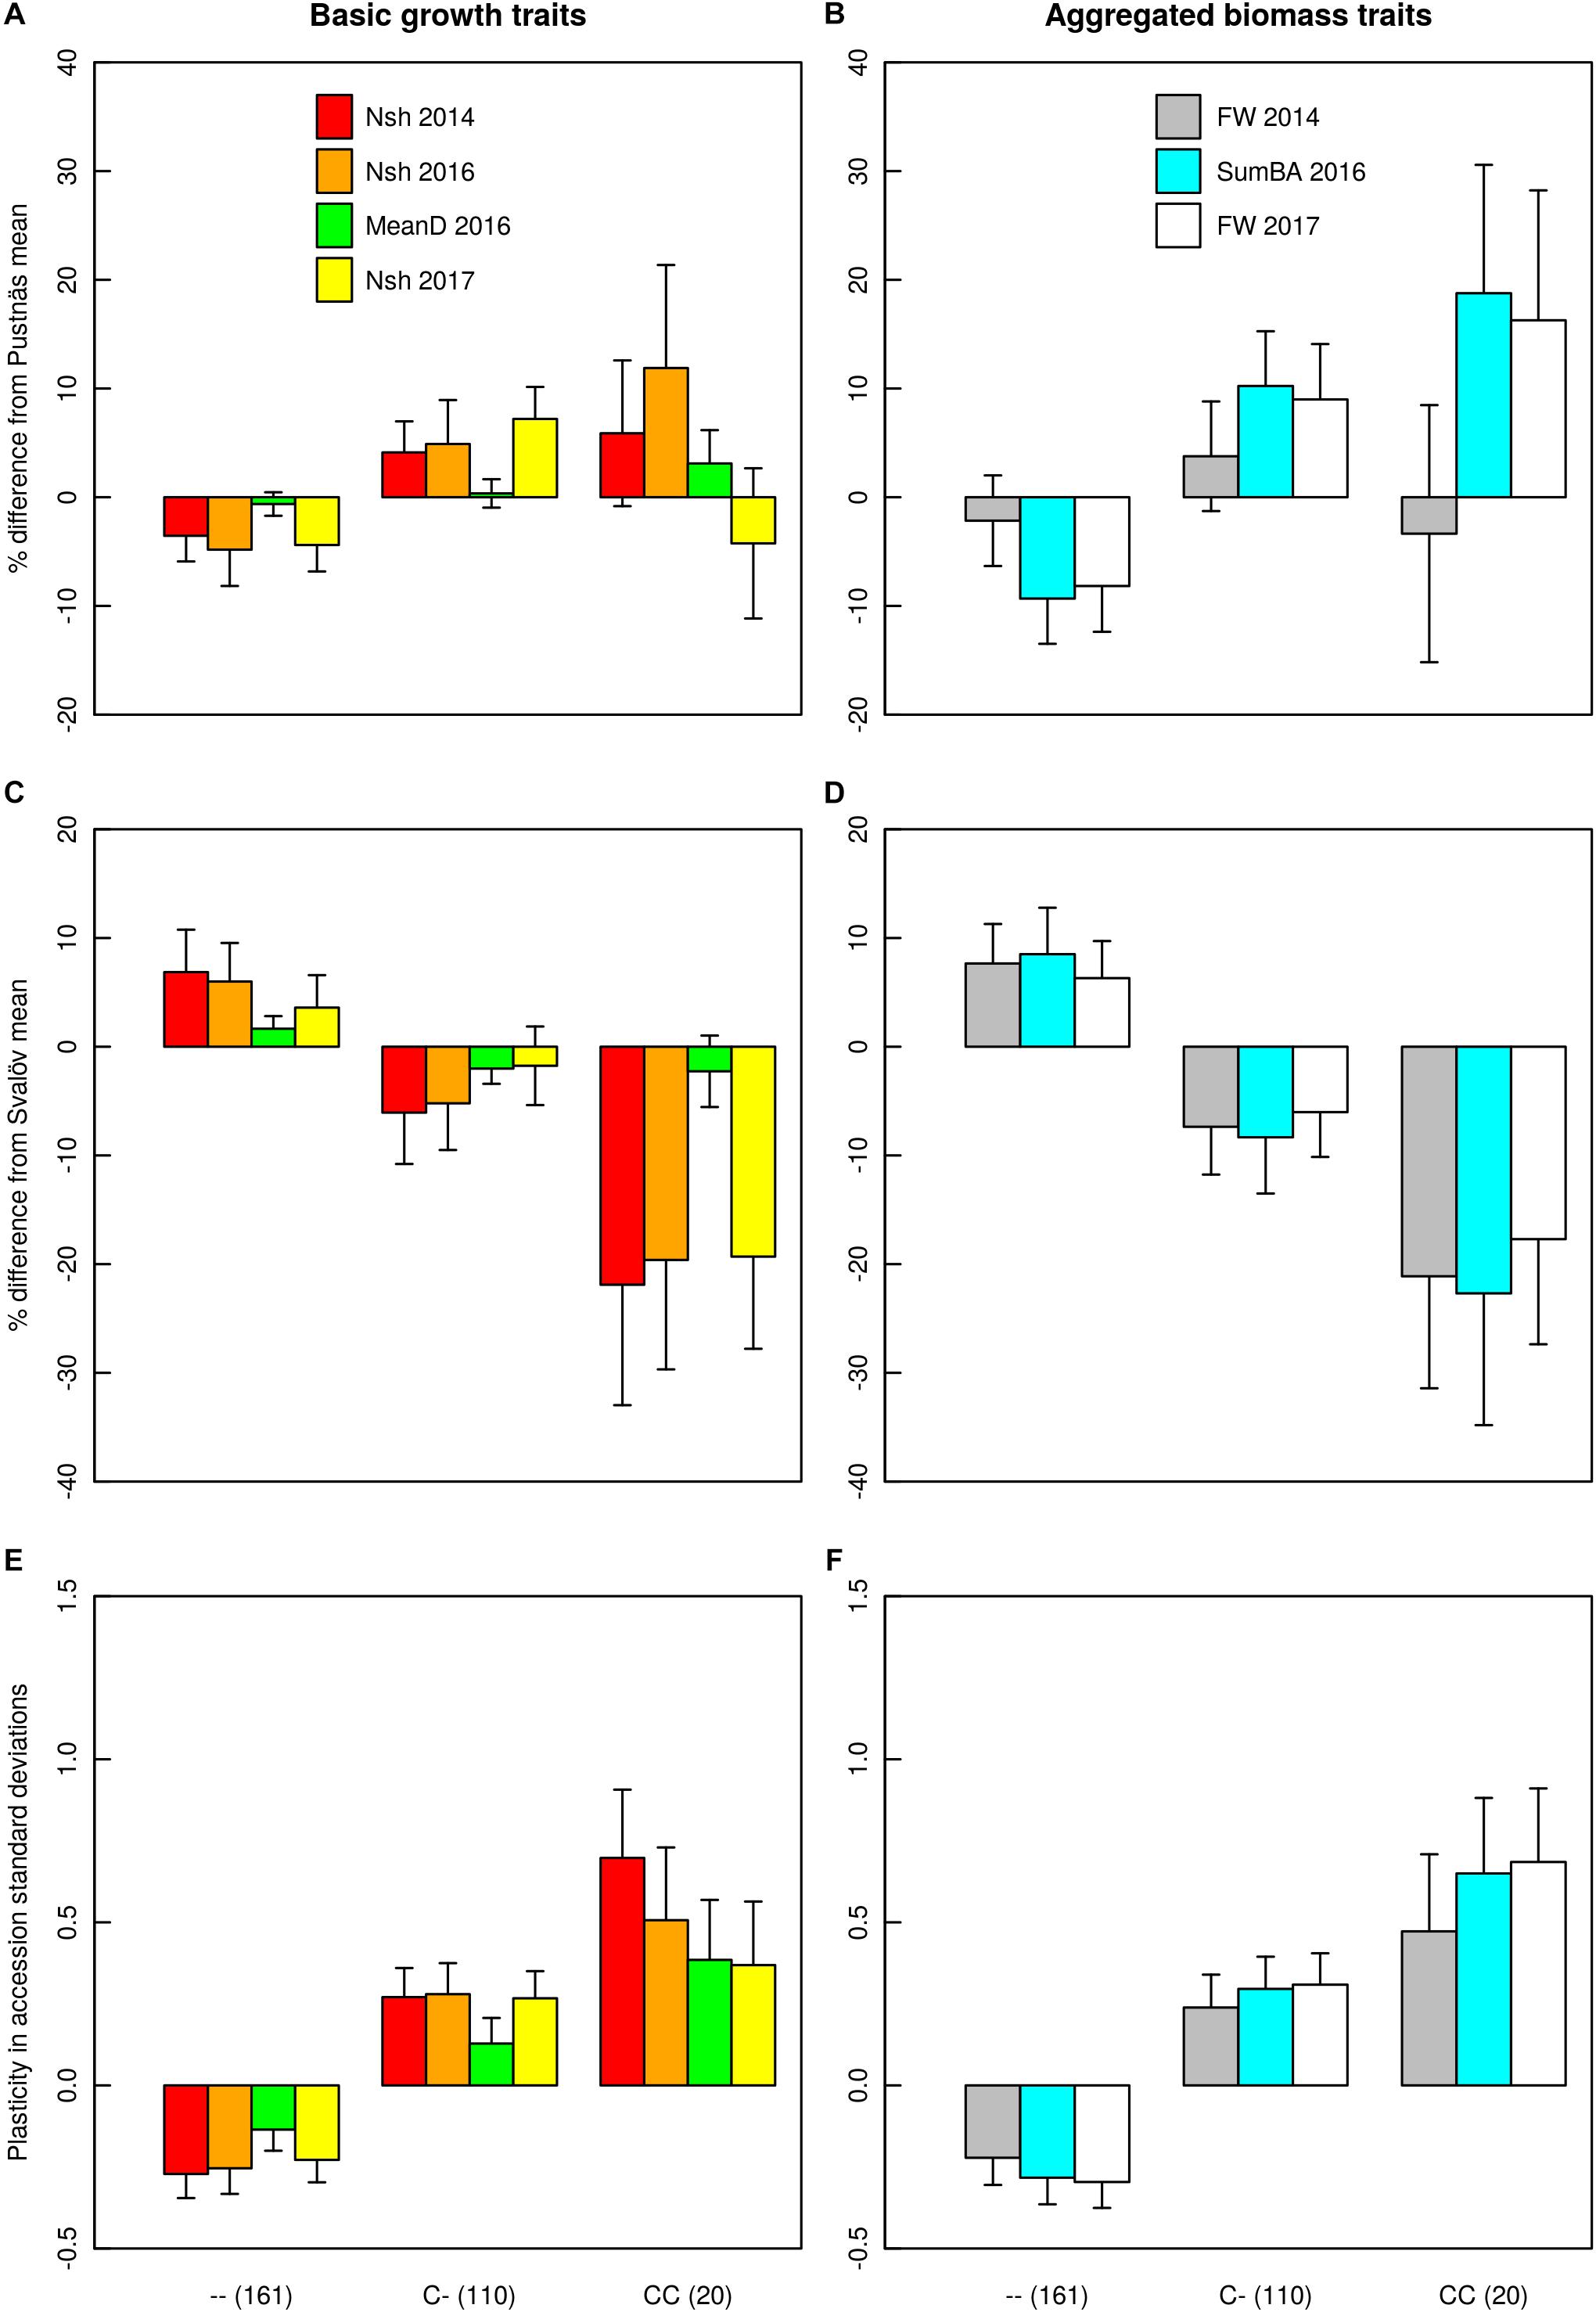
Figure 5. Genotype effects for the marker S1_246135575 on number of shoots (Nsh), mean shoot diameter (MeanD), summed basal area of shoots (SumBA), and fresh weight (FW) at Pustnäs (A,B), Svalöv (C,D) and for the corresponding differences (plasticity) between Pustnäs and Svalöv (E,F). Genotype effects at Pustnäs and Svalöv are described as percentages relative to the population mean, while plasticity effects are given in unit standard deviations of BLUE accession estimators. The values in parentheses after each genotype (class) describe the number of accessions having that genotype (class).
In order to know whether the multiple marker-trait associations detected in this study could reflect a smaller set of unique associations, we estimated linkage disequilibrium (LD) correlations between all markers that had significant trait associations. However, such correlation estimates were generally very low indicating no or little LD (Supplementary Figure S9). Only 14 marker pairs (out of 595) showed LD correlations with magnitudes above 0.2. Seven of those cases, including the case with the strongest LD correlation (r = 0.35), were between markers whose trait association effects depended on the rare homozygotic accession group originating beyond the Ural mountain range and these were viewed with skepticism anyway. In summary, there was no substantive evidence that the other associations constituted multiple reflections of a lower set of unique associations.
All genes in the region 3000 bp up- and downstream the associated markers are reported in Supplementary Table S1. Many of the genes were connected to membrane transport or to transcription factors. The marker that in Svalöv repeatedly was identified for FW14 and FW17 (S1_361520786) was situated in a gene connected to translational initiation factor 4B. Translational initiation factors are involved in a number of processes connected to growth and to interaction with different stresses and could thus be important factors in plant improvement (Dutt et al., 2015). The marker identified for plasticity of different growth traits (S1_246135575) was in a gene resulting in an integral membrane HPP family protein which is a large group of proteins that involved in many different processes connected to membranes. Both markers were in the non-coding region of the genes.
Discussion
In this study, we investigated associations between a genome wide set of markers and growth and phenology related traits, measured repeatedly during several years and in two different environments. Genome wide association studies with biomass traits has never been conducted in Salix viminalis but recently within the same genera in S. purpurea (Carlson et al., 2019). Previously, Hallingbäck et al. (2016) used a candidate gene approach and identified associations between growth traits and phenology traits and markers in S. viminalis. An obvious drawback with this approach is that only genes with known functions will be analyzed. Compared with previous QTL-mapping studies, (e.g., Berlin et al., 2014, 2017; Ghelardini et al., 2014) the identified associations in the current GWAS and in the candidate gene study will have a better resolution and be closer to the causative genes due to the shorter LD in a population of unrelated individuals compared to biparental populations (Neale and Kremer, 2011; Khan and Korban, 2012). On the other hand, in a population with short LD, a GWAS requires a large number of markers to cover the complete genome to identify associations (Khan and Korban, 2012). In S. viminalis LD has earlier been estimated to drop to low non-significant values within 4000 bp from a marker which is longer compared to the closely related species S. schwerinii (Berlin et al., 2011) and show promise for possibilities to identify associations with a reasonable number of markers. Here we have identified 19,411 SNPs and single nucleotide indel markers from a GBS-effort, quite evenly distributed across the genome, to use in a first attempt of GWAS with biomass traits in Salix viminalis.
The population of S. viminalis used in the study contains accessions collected from the British Isles in the west throughout Europe into Russia as well as clonal material from breeding programs in England and in Sweden (Berlin et al., 2014). It could be regarded as a population well representing Western and Central Europe while being a bit sparse in the Eastern distribution of the species. The population could also, based on GBS marker data (this study) and microsatellite data (Berlin et al., 2014), be divided into four subpopulations where one subpopulation includes the accessions with Russian origin. One complication was that the kinship analyses revealed another substructure within this Russian population where five accessions originating from diverse places beyond the Ural Mountain range were all indicated to be in very close kinship (Hallingbäck et al., 2016 and present study). As the population size was rather limited (291) it was not considered prudent to eliminate accessions only due to this reason. Instead, throughout the remainder of the discussion such associations whose effects are solely dependent on single accessions or the accessions beyond the Ural Mountains (footnotes in Tables 5, 6) will not be seriously considered even though they may appear strongly significant or show high R2-estimates.
Substantial phenotypic variation could be seen for all traits at both environments with mostly high broad-sense accession estimator heritability () values for phenology traits and medium-to-high for growth traits. Also, the narrow-sense chip heritabilities () were considerable with values up to 0.99 for phenology while estimates were more variable for growth traits (0.24–0.97) depending of trait and environment. This general trend with higher heritability estimates for phenology traits compared with growth traits was also observed earlier (Rönnberg-Wästljung, 2001) where two large factorial crossings of S. viminalis with clones of Swedish and Polish origin were used. This also seems to be a general trend in many boreal and temperate tree species (e.g., McKown et al., 2014; Guerra et al., 2016). Genetic correlation estimates between phenology and biomass traits were low indicating different genetic background of the different types of traits and suggest that these traits could be selected for independently of each other. In an earlier biparental QTL study (Berlin et al., 2017), phenology QTL overlapped in some cases with QTL for different biomass traits which could indicate a common genetic background but it should nonetheless be cautioned that the broad QTL regions identified in that study contains many different genes raising the possibility that the QTL overlap merely reflected linkage.
Taking into consideration the structure of the population as well as the kinship between accessions and corrections for multiple testing we could in total identify 25 associations across environments, traits and years whose genotypic effects could not be ascribed to either a single homozygotic accession or to the tightly related group of trans-Ural accessions. For bud burst (BB13, BB14) and for the number of shoots in 2011 (Nsh11) in Pustnäs, such associated markers explained over 20% of the total accession variation. GWAS in different Populus species identified markers for different wood traits (Porth et al., 2013; Du et al., 2015b) that in total explained above 20% of the variance for each trait. Du et al. (2015b) also identified markers for different growth traits as stem diameter, tree height and stem volume, that together explained from 24 to 33% of the accession variation. In any case it should be noted that even 20% explained variation is still a limited proportion in comparison to the percentage of accession variation explained by genetics overall, namely which varied from 59% to 82% for BB13, BB14, and Nsh11. This implies that, given the current sample size (291 accessions), a substantial portion of the genotypic variation was still unaccounted for in terms of individual marker-trait associations. In addition, we also found three associations, not connected to single homozygote or trans-Ural accessions, connected to plasticity of biomass traits.
Most of the associations individually explained a limited portion of the total accession variation ranging from 2.3 to 9.2%. Again, considering the previously mentioned large portions of genotypic variation unexplained by marker associations, and that the limited size of the study population would allow only the marker-trait associations with the greatest R2 to be detected with any confidence, the results of this study agree with the notion that biomass and phenology traits are regulated by a multitude of small effect QTL, a concept originally suggested by Fisher (1918). This is furthermore in agreement with previously reported GWAS results from Populus studies (McKown et al., 2014; Du et al., 2015a) and further supported by meta-analyses for a number of quantitative traits in tree species in general (e.g., Hall et al., 2016).
For traits studied in Pustnäs and Svalöv there was only one case where the marker-trait association was stable from one year to another (FW14 to FW17 in Svalöv). In line with this result, aggregated biomass traits, such as summed basal area and fresh weight, showed consistently strong accession correlations between years of measurement. For other traits, accession correlations were generally lower and associations were less stable and unique for the trait measurement. Some stable associations were found in the previous candidate gene study (Hallingbäck et al., 2016) where, for example a SNP situated in the ELF3b-gene was consistently identified across years and environments. But also in that investigation, most of the associations were unique. Similar results were found for S. purpurea where most of the identified associations were unique with some few consistent across years and environments (Carlson et al., 2019). The general trend also in Populus is that unique as well as some stable associations are found, e.g., Muchero et al. (2013, 2015) identified several associations for different wood traits that were stable across environments and between developmental stages.
It is notable that the association of SNP S1_361520786 to both FW14 and FW17 in Svalöv was largely dependent on a considerable recessive effect linked to two unrelated accessions that were homozygous for the rare C-allele of the SNP (Figure 4). Therefore this association certainly need more examination in order to be confirmed and one should remain skeptical of the large effect which may be considerably overestimated (e.g., Beavis, 1994; Xu, 2003). Nonetheless, one should not entirely disregard associations that are dependent on few individuals or on low allele frequency markers, since the effect may still become a considerable factor if frequency of the rare allele can be increased by MAS or by conventional breeding. Indeed, similar results were detected in the previous candidate gene study using the same population, where an interesting SNP in the ELF3b-gene showed highly significant effects connected to few individuals in one of the homozygote classes (Hallingbäck et al., 2016). It should be emphasized that the chief reason why the observation of this association was not repeated in this study was that one of the homozygote accessions of the SNP of ELF3b was not successfully genotyped by GBS likely leading to its non-significance in the current analyses. In summary, low frequency alleles might still play an important role to explain the variation in a complex trait and for the missing heritability but are often discarded in association analysis (Brachi et al., 2011; Fahrenkrog et al., 2016).
The two field environments exhibited differences in climate, especially in spring (April) and in autumn (September, October) temperature, and in soil type but both represent typical environments used for practical cultivation of SRC Salix. We found no common marker associations between environments for the different growth or phenology traits. This finding could of course be an effect of the statistical power of the analysis being insufficient to detect one and the same association repeatedly but could also be due to G × E-interactions between the Pustnäs and Svalöv. Indeed, the moderate accession correlations between Pustnäs and Svalöv indicate substantial G × E-interactions between the two environments and Hallingbäck et al. (2016) also identified G × E-interactions between Pustnäs and a contrasting site situated in the United Kingdom (Woburn). Similar patterns with few common associations between environments was also seen for bud burst using a population of Populus balsamifera grown in common garden experiments at two locations in Canada, while bud set shared more common associations between locations (Olson et al., 2013). These circumstances together with the non-stability of markers will have important implications for the eventual conduct of MAS where different sets of markers have to be used in different environments for breeding of adapted plant material.
Given the observed G × E-interactions in the current study, we estimated the plasticity of each genotype by examining the standardized differences in trait accession BLUEs between Pustnäs and Svalöv and then mapped this difference for associations. One specific marker (S1_246135575) was identified to associate with the plasticity of three different growth and biomass traits (Nsh14, SumBA16 and FW17) thus being remarkably consistent. This marker explained around 8% of the accession variation suggesting that we have identified an important element of the genetic base for growth trait plasticity. Furthermore, the genotypic effect of this marker showed that the rare C-insert allele produced an increase in biomass traits in one environment while a decrease in the other environment. Interestingly these effects behaved in a largely additive manner (Figure 5). The main climatic difference between the two field environments are in spring and autumn where Svalöv, the more southern environment, has higher temperatures and thus giving a longer growing season. In addition, the Svalöv environment also has a soil with more clay content which most probably also have an influence of the biomass growth. The marker identified is clearly influenced by environmental differences, an effect that could be used in breeding as indicated below.
Breeding Implications
This is one of the first association mapping study in Salix using a GWAS approach with biomass traits, that successfully has identified a set of candidate markers connected to growth and phenology traits as well as to plasticity of traits. Each marker does not explain much of the total phenotypic variation but the effect of the marker may still be substantial. Adding several markers together explain a greater amount of the accession variation. In a breeding perspective these markers and preferably a set of markers with specific allele combinations could be of value and interesting to use in the selection of parents as well for selection of individuals in early stages of the breeding cycle. An early selection of seed plants would reduce the number of plants for field testing and thus also make the breeding more cost effective. Some of the marker-trait associations identified were connected to a homozygote genotypic class with few individuals of large effect, these markers need to be validated through, for example, crossings of heterozygotes and study of the phenotypes in the segregating offspring, i.e., multiple family QTL mapping (Ukrainetz et al., 2008).
Even though the accession correlation across environments for the different traits was moderate indicating G × E-interactions, we still observed specific accessions that performed well in both environments. Such accessions could be of use for breeding toward stable performance across environments with plasticity close to zero. Another alternative to handle the G × E is to divide the area of cultivation into different breeding zones utilizing the very best performing accessions in each region and thus breed material for more specific use (Namkoong et al., 1988). As an example, the marker connected to plasticity gave a considerable effect for biomass traits and number of shoots with different effect dependent of environment and could be used to select for stability (heterozygotes) or for different alleles to increase the frequency of homozygotes for better performance in selected environments.
Nonetheless, given the general impression that the studied traits are likely regulated by a multitude of loci each exerting relatively minor effects and the considerable G × E-interactions encountered in this study, it appears difficult to efficiently utilize any specific set of few markers to perform MAS (see also Grattapaglia et al., 2018). A different alternative in this regard would be to perform MAS by genotyping breeding populations using large sets of markers that would utilize the LD with a multitude of small effect QTL, so called genomic selection (Meuwissen et al., 2001; Harfouche et al., 2012; Desta and Ortiz, 2014). The marker-trait associations observed in this or other studies could offer candidate targets for directed genotyping efforts, e.g., by developing SNP arrays. By enlisting markers linked to previously detected QTL into such arrays, further links, based on causality or LD, could be established between markers and QTL. Thereby the selection accuracy of genomic prediction models could be increased and the efficiency of genomic selection would be improved.
The results from this study using a population of unrelated accessions have given basic information about marker-trait associations that are of importance and could be used for future strategies and breeding of Salix. In general, individual associations explained a limited proportion (<10%) of the accession variation although, in concert, associations with budburst and number of shoots occasionally explained about 20%. Associations were generally not repeated across measurement years and environments, due to limited statistical power or to the substantial G × E-interactions observed. Still, one particular association for fresh weight was observed to be consistent across years in the Svalöv experiment and for the plasticity of growth traits between Pustnäs and Svalöv, another association was detected which was consistent across years and traits to a greater degree. Further examination of these associations should contribute to an improved understanding of the genetic architecture of important traits in Salix and facilitate the development of marker-assisted breeding methods for this species.
Author Contributions
A-CR-W, SB, and MW planned and designed the research. N-EN and A-CR-W performed the field measurements. HH and A-CR-W analyzed the data and wrote the manuscript. All authors read and approved the manuscript.
Funding
This work was supported by the Swedish Energy Agency, Grants No: 30599-3, and the NJ-Faculty at the Swedish University of Agricultural Sciences.
Conflict of Interest Statement
The authors declare that the research was conducted in the absence of any commercial or financial relationships that could be construed as a potential conflict of interest.
Acknowledgments
We thank Thomas Martin and Jennifer Petersson for preparation of DNA, and Luisa Gelardhini and Ewa Magnuski for measurements of leaf senescence and biomass traits. The GBS-sequencing was made at Cornell University, Itacha, New York, and the use of the Salix purpurea genome as reference (Salix purpurea v1.0, DOE-JGI, https://phytozome.jgi.doe.gov/pz/portal.html#!info?alias=Org_Spurpurea_er) was kindly permitted by Lawrence Smart at Cornell University. We also thank Lei Liu Conze for developing perl scripts for excluding polymorphic sites showing excessive heterozygosity patterns.
Supplementary Material
The Supplementary Material for this article can be found online at: https://www.frontiersin.org/articles/10.3389/fpls.2019.00753/full#supplementary-material
Footnotes
References
Allwright, M. R., and Taylors, G. (2016). Molecular breeding for improved second generation bioenergy crops. Trends Plant Sci. 21, 43–54. doi: 10.1016/j.tplants.2015.10.002
Åhman, I., and Larsson, S. (1994). Genetic improvement of willows (Salix) as a source of bioenergy. Norw. J. Agric. Sci. Suppl. 18, 47–56. doi: 10.1111/j.1744-7909.2010.01015.x
Beavis, W. D. (1994). “The power and deceit of QTL experiments: lessons from comparative QTL-studies,” in Proceedings of the 49th Annual Corn and Sorghum Industry Research Conference, (Washington, DC: American Seed Trade Association), 250–266.
Berlin, S., Fogelqvist, J., Lascoux, M., Lagercrantz, U., and Rönnberg-Wästljung, A. C. (2011). Polymorphism and divergence in two willow species, Salix viminalis L. and Salix schwerinii E. Wolf. G3 1, 387–400. doi: 10.1534/g3.111.000539
Berlin, S., Hallingbäck, H. R., Beyer, F., Nordh, N.-E., Weih, M., and Rönnberg-Wästljung, A.-C. (2017). Genetics of phenotypic plasticity and biomass traits in hybrid willows across contrasting environments and years. Ann. Bot. 120, 87–100. doi: 10.1093/aob/mcx029
Berlin, S., Trybush, S. O., Fogelqvist, J., Gyllenstrand, N., Hallingbäck, H. R., Åhman, I., et al. (2014). Genetic diversity, population structure and phenotypic variation in European Salix viminalis L. (Salicaceae). Tree Genet. Genomes 10, 1595–1610. doi: 10.1007/s11295-014-0782-5
Brachi, B., Morris, G. P., and Borevitz, J. O. (2011). Genome-wide association studies in plants: the missing heritability is in the field. Genome Biol. 12:232. doi: 10.1186/gb-2011-12-10-232
Bradshaw, A. D. (1965). Evolutionary significance of phenotypic plasticity in plants. Adv. Genet. 13, 115–155. doi: 10.1016/s0065-2660(08)60048-6
Brunner, I., Brodbeck, S., Buchler, U., and Sperisen, C. (2001). Molecular identification of fine roots of trees from the Alps: reliable and fast DNA extraction and PCR-RFLP analyses of plastid DNA. Mol. Ecol. 10, 2079–2087. doi: 10.1046/j.1365-294x.2001.01325.x
Burdon, R. D. (1977). Genetic correlation as a concept for studying genotype-environment Interaction in forest tree breeding. Silvae Genet. 26, 168–175.
Carlson, C. H., Gouker, F. E., Crowell, C. R., Evans, L., DiFazio, S. P., Smart, C. D., et al. (2019). Joint linkage and association mapping of complex traits in shrub willow (Salix purpurea L.). Ann. Bot. 1–15. doi: 10.1093/aob/mcz047
Cullis, B. R., and Gleeson, A. C. (1991). Spatial analysis of field experiments – an extension to two dimensions. Biometrics 47, 1449–1460.
Desta, Z. A., and Ortiz, R. (2014). Genomic selection: genome-wide prediction in plant improvement. Trends Plant Sci. 19, 592–601. doi: 10.1016/j.tplants.2014.05.006
Dillen, S. Y., Storme, V., Marron, N., Bastien, C., Neyrinck, S., Steenackers, M., et al. (2009). Genomic regions involved in productivity of two interspecific poplar families in Europe. 1. Stem height, circumference and volume. Tree Genet. Genomes 5, 147–164. doi: 10.1007/s11295-008-0175-8
Dutt, S., Parkash, J., Mehra, R., Sharma, N., Singh, B., Raigond, P., et al. (2015). Translation initiation in plants: roles and implications beyond protein synthesis. Biol. Plant. 59, 401–412. doi: 10.1101/gad.304543.117
Du, Q., Gong, C., Qingshi Wang, Q., Zhou, D., Yang, H., Pan, W., et al. (2015a). Genetic architecture of growth traits in populus revealed by integrated quantitative trait locus (QTL) analysis and association studies. New Phytol. 209, 1067–1082. doi: 10.1111/nph.13695
Du, Q., Tian, J., Yang, X., Pan, W., Xu, B., Li, B., et al. (2015b). Identification of additive, dominant, and epistatic variation conferred by key genes in cellulose biosynthesis pathway in Populus tomentosa. DNA Res. 22, 53–67. doi: 10.1093/dnares/dsu040
El Soda, M., Malosetti, M., Zwaan, B. J., Koornneef, M., and Aarts, M. G. M. (2014). Genotype x environment interaction QTL mapping in plants: lessons from Arabidopsis. Trends Plant Sci. 19, 390–398. doi: 10.1016/j.tplants.2014.01.001
Elshire, R. J., Glaubitz, J. C., Sun, Q., Poland, J. A., Kawamoto, K., Buckler, E. S., et al. (2011). A Robust, simple genotyping-by-sequencing (GBS) approach for high diversity species. PLoS One 6:e19379. doi: 10.1371/journal.pone.0019379
Evanno, G., Regnaut, S., and Goudet, J. (2005). Detecting the number of clusters of individuals using the software structure: a simulation study. Mol. Ecol. 14, 2611–2620. doi: 10.1111/j.1365-294x.2005.02553.x
Fabbrini, F., Gaudet, M., Bastien, C., Zaina, G., Harfouche, A., Beritognolo, I., et al. (2012). Phenotypic plasticity, QTL mapping and genomic characterization of bud set in black poplar. BMC Plant Biol. 12:47. doi: 10.1186/1471-2229-12-47
Fahrenkrog, A. M., Neves, L. G., Resende, M. F. R. Jr., Vazquez, A. I., de los Campos, G., Dervinis, C., et al. (2016). Genome-wide association study reveals putative regulators of bioenergy traits in Populus deltoides. New Phytol. 213, 799–811. doi: 10.1111/nph.14154
Falush, D., Stephens, M., and Pritchard, J. K. (2003). Inference of population structure using multilocus genotype data: linked loci and correlated allele frequencies. Genetics 164, 1567–1587.
Fisher, R. A. (1918). The correlation between relatives on the supposition of mendelian inheritance. Trans. R. Soc. Edinburgh 52, 399–433. doi: 10.1017/S0080456800012163
Ghelardini, L., Berlin, S., Weih, M., Lagercrantz, U., Gyllenstrand, N., and Rönnberg-Wästljung, A. C. (2014). Genetic architecture of spring and autumn phenology in Salix. BMC Plant Biol. 14:31. doi: 10.1186/1471-2229-14-31
Gilmour, A. R., Gogel, B. J., Cullis, B. R., and Thompson, R. (2009). ASReml User Guide, 3rd Edn. Hemel Hempstead: VSN International Ltd.
Glaubitz, J. C., Casstevens, T. M., Lu, F., Harriman, J., Elshire, R. J., Sun, Q., et al. (2014). TASSEL-GBS: a high capacity genotyping by sequencing analysis pipeline. PLoS One 9:e90346. doi: 10.1371/journal.pone.0090346
Grattapaglia, D., Silva-Junior, O. B., Resende, R. T., Cappa, E. P., Müller, B. S. F., Tan, B., et al. (2018). Quantitative genetics and genomics converge to accelerate forest tree breeding. Front. Plant Sci. 9:1693. doi: 10.3389/fpls.2018.01693
Guerra, F. P., Richards, J. H., Fiehn, O., Famula, R., Stanton, B. J., Shuren, R., et al. (2016). Analysis of the genetic variation in growth, ecophysiology, and chemical and metabolomic composition of wood of Populus trichocarpa provenances. Tree Genet. Genome 12:6. doi: 10.1007/s11295-015-0965-8
Guerra, F. P., Wegrzyn, J. L., Sykes, R., Davis, M. F., Stanton, B. J., and Neale, D. B. (2013). Association genetics of chemical wood properties in black poplar (Populus nigra). New Phytol. 197, 162–176. doi: 10.1111/nph.12003
Hall, D., Hallingbäck, H. R., and Wu, H. X. (2016). Estimation of the number and size of QTL effects in forest tree traits. Tree Genet. Genomes 12:110. doi: 10.1007/s11295-016-1073-0
Hallingbäck, H. R., Berlin, S., Nordh, N.-E., Weih, M., and Rönnberg-Wästljung, A.-C. (2019). Genotyping-by-sequencing (GBS) dataset for genome wide associations of growth, phenology and plasticity traits in willow (Salix viminalis (L.)). Zenodo. doi: 10.5281/zenodo.2607520
Hallingbäck, H. R., Fogelqvist, J., Powers, S. J., Turrion-Gomez, J., Rossiter, R., Amey, J., et al. (2016). Association mapping in Salix viminalis L. (Salicaceae) – identification of candidate genes associated with growth and phenology. Glob. Change Biol. Bioenergy 8, 670–685. doi: 10.1111/gcbb.12280
Hanley, S. J., and Karp, A. (2014). Genetic strategies for dissecting complex traits in biomass willows (Salix spp.). Tree Physiol. 34, 1167–1180. doi: 10.1093/treephys/tpt089
Hanley, S. J., Pei, M. H., Powers, S. J., Ruiz, C., Mallott, M. D., Barker, J. H., et al. (2011). Genetic mapping of rust resistance loci in biomass willow. Tree Genet. Genomes 7, 597–608. doi: 10.3390/ijms18030677
Harfouche, A., Meilan, R., Kirst, M., Morgante, M., Boerjan, W., Sabatti, M., et al. (2012). Accelerating the domestication of forest trees in a changing world. Trends Plant Sci. 17, 64–72. doi: 10.1016/j.tplants.2011.11.005
Hill, W. G. (1974). Estimation of linkage disequilibrium in randomly mating populations. Heredity 33, 229–239. doi: 10.1038/hdy.1974.89
Hohenlohe, P. A., Bassham, S., Etter, P. D., Stiffler, N., Johnson, E. A., and Cresko, W. A. (2010). Population genomics of parallel adaptation in threespine stickleback using sequenced RAD tags. PLoS Genet. 6:e1000862. doi: 10.1371/journal.pgen.1000862
Jorge, V., Dowkiw, A., Faivre-Rampant, P., and Bastien, C. (2005). genetic architecture of qualitative and quantitative melampsora larici-populina leaf rust resistance in hybrid poplar: genetic mapping and QTL detection. New Phytol. 167, 113–127. doi: 10.1111/j.1469-8137.2005.01424.x
Karp, A., Hanley, S. J., Trybush, S. O., Macalpine, W., Pei, M., and Shield, I. (2011). Genetic improvement of willow for bioenergy and biofuels. J. Integr. Plant Biol. 53, 151–165. doi: 10.1111/j.1744-7909.2010.01015.x
Karp, A., and Shield, I. (2008). Bioenergy from plants and the sustainable yield challenge. New Phytol. 179, 15–32. doi: 10.1111/j.1469-8137.2008.02432.x
Khan, M. A., and Korban, S. S. (2012). Association mapping in forest trees and fruit crops. J. Exp. Bot. 63, 4045–4060. doi: 10.1093/jxb/ers105
Kruijer, W., Boer, M. P., Malosetti, M., Flood, P. J., Engel, B., Kooke, R., et al. (2015). Marker-based estimation of heritability in immortal populations. Genetics 199, 379–398. doi: 10.1534/genetics.114.167916
Kuzovkina, Y., Weih, M., Abalos Romero, M., Charles, J., Hurst, S., McIvor, I., et al. (2008). Salix: botany and global horticulture. Hortic. Rev. 34, 447–489. doi: 10.1002/9780470380147.ch8
Larsson, S. (1998). Genetic improvement of willow for short-rotation coppice. Biomass Bioenergy 15, 23–26. doi: 10.1016/s0961-9534(98)80003-2
Lascoux, M., Thorsen, J., and Gullberg, U. (1996). Population structure of a riparian willow species, Salix viminalis L. Genet. Res. 68, 45–54. doi: 10.1017/s0016672300033875
Loiselle, B. A., Sork, V. L., Nason, J., and Graham, C. (1995). Spatial genetic structure of a tropical understory shrub, Psychotria officinalis (Rubiaceae). Am. J. Bot. 82, 1420–1425. doi: 10.1002/j.1537-2197.1995.tb12679.x
McKown, A. D., Guy, R. D., Klápšte, J., Geraldes, A., Friedmann, M., Cronk, Q. C. B., et al. (2014). Geographical and environmental gradients shape phenotypic trait variation and genetic structure in Populus trichocarpa. New Phytol. 201, 1263–1276. doi: 10.1111/nph.12601
Meuwissen, T. H. E., Hayes, B. J., and Goddard, M. E. (2001). Prediction of total genetic value using genome-wide dense marker maps. Genetics 157, 1819–1829.
Money, D., Gardner, K., Migicovsky, Z., Schwaninger, H., Zhong, G.-Y., and Myles, S. (2015). LinkImpute: fast and accurate genotype imputation for nonmodel organisms. G3 5, 2383–2390. doi: 10.1534/g3.115.021667
Muchero, W., Guo, J., DiFazio, S. P., Chen, J.-G., Ranjan, P., Slavov, G. T., et al. (2015). High-resolution genetic mapping of allelic variants associated with cell wall chemistry in Populus. BMC Genomics 16:24. doi: 10.1186/s12864-015-1215-z
Muchero, W., Sewell, M. M., Ranjan, P., Gunter, L. E., Rschaplinski, T. J., Yin, T., et al. (2013). Genome anchored QTLs for biomass productivity in hybrid Populus grown under contrasting environments. PLoS One 8:e54468 doi: 10.1371/journal.pone.0054468
Nakagawa, S., and Schielzeth, H. (2013). A general and simple method for obtaining R2 from generalized linear mixed-effects models. Methods Ecol. Evol. 4, 133–142. doi: 10.1093/sysbio/syy060
Namkoong, G., Kang, H. C., and Bourard, J. C. (1988). Tree Breeding: Priciples and Strategies. New York, NY: Springer-Verlag.
Neale, D. B., and Kremer, A. (2011). Forest tree genomics: growing resources and applications. Nat. Rev. Genet. 12, 111–122. doi: 10.1038/nrg2931
Nicotra, A. B., Atkin, O. K., Bonser, S. P., Davidson, A. M., Finnegan, E. J., Mathesius, U., et al. (2010). Plant phenotypic plasticity in a changing climate. Trends Plant Sci. 15, 684–692. doi: 10.1016/j.tplants.2010.09.008
Nordh, N.-E., and Verwijst, T. (2004). Above-ground biomass assessments and first cutting cycle production in willow (Salix sp.) coppice - a comparison between destructive and non-destructive methods. Biomass Bioenergy 27, 1–8. doi: 10.1016/j.biombioe.2003.10.007
Olson, M. S., Levsen, N., Soolanayakanahally, R. Y., Guy, R. D., Schroeder, W. R., Keller, S. R., et al. (2013). The adaptive potential of Populus balsamifera (L.) to phenology requirements in a warmer global climate. Mol. Ecol. 22, 1214–1230. doi: 10.1111/mec.12067
Porth, I., Klápště, J., Skyba, O., Lai, B. S. K., Geraldes, A., Muchero, W., et al. (2013). Populus trichocarpa cell wall chemistry and ultrastructure trait variation, genetic control and genetic correlations. New Phytol. 197, 777–790. doi: 10.1111/nph.12014
Pritchard, J. K., Stephens, M., and Donnelly, P. (2000). Inference of population structure using multilocus genotype data. Genetics 155, 945–959.
Pucholt, P., Hallingbäck, H. R., and Berlin, S. (2017). Allelic incompatibility can explain female biased sex ratios in dioecious plants. BMC Genomics 18:251. doi: 10.1186/s12864-017-3634-5
Rae, A. M., Pinel, M. P. C., Bastien, C., Sabatti, M., Tucker, J., Dixon, C., et al. (2008). QTL for yield in bioenergy populus: identifying GxE interactions from growth at three contrasting sites. Tree Genet. Genomes 4, 97–112. doi: 10.1007/s11295-007-0091-3
Rae, A. M., Street, N. R., Robinson, K. M., Harris, N., and Taylor, G. (2009). Five QTL hotspots for yield in short rotation coppice bioenergy poplar: the poplar biomass loci. BMC Plant Biol. 9:23. doi: 10.1186/1471-2229-9-23
Rönnberg-Wästljung, A. C. (2001). Genetic structure of growth and phenological traits in Salix viminalis. Can. J. For. Res. 31, 276–282. doi: 10.1139/x00-175
Rönnberg-Wästljung, A.-C., Samils, B., Tsarouhas, V., and Gullberg, U. (2008). Resistance to melampsora larici-epitea leaf rust in Salix: analyses of quantitative trait loci. J. Appl. Genet. 49, 321–331. doi: 10.1007/BF03195630
Samils, B., Rönnberg-Wästljung, A. C., and Stenlid, J. (2011). QTL mapping of resistance to leaf rust in Salix. Tree Genet. Genomes 7, 1219–1235. doi: 10.3390/ijms18030677
Savolainen, O., Lascoux, M., and Merilä, J. (2013). Ecological genomics of local adaptation. Nat. Rev. Genet. 14, 807–820. doi: 10.1038/nrg3522
Schlichting, C. D. (1986). The evolution of phenotypic plasticity in plants. Ann. Rev. Ecol. Syst. 17, 667–693. doi: 10.1146/annurev.ecolsys.17.1.667
Segura, V., Vilhjálmsson, B. J., Platt, A., Korte, A., Seren,Ü, Long, Q., et al. (2012). An efficient multi-locus mixed-model approach for genome-wide association studies in structured populations. Nat. Genet. 44, 825–830. doi: 10.1038/ng2314
Serapiglia, M. J., Cameron, K. D., Stipanovic, A. J., Abrahamson, L. P., Volk, T. A., Smart, L. B., et al. (2013). Yield and woody biomass traits of novel shrub willow hybrids at two contrasting sites. Bioenergy Res. 6, 533–546. doi: 10.1007/s12155-012-9272-5
Speed, D., Hermani, G., Johnson, M. R., and Balding, D. J. (2012). Improved heritability estimation from genome-wide SNPs. Am. J. Hum. Genet. 91, 1011–1021. doi: 10.1016/j.ajhg.2012.10.010
Stanton, B. J., Neale, D., and Li, S. (2010). “Populus breeding: from the classical to the genomic approach,” in Genetics and Genomics of Populus. Plant Genetics and Genomics: Crops and Models, Vol. 8, eds S. Jansson, R. Bhalerao, and A. Groover (New York, NY: Springer).
Stapley, J., Reger, J., Feulner, P. G. D., Smadja, C., Galindo, J., Eknlom, R., et al. (2010). Adaptation genomics: the next generation. Trends Ecol. Evol. 25, 705–711. doi: 10.1016/j.tree.2010.09.002
Tétard-Jones, C., Kertesz, M. A., and Preziosi, R. F. (2011). Quantitative trait loci mapping and phenotypic plasticity and genotype-environment interactions in plant and insect performance. Phil. Trans. R. Soc. B. 366, 1368–1379. doi: 10.1098/rstb.2010.0356
Trybush, S. O., Jahodová, Š,Èížková, L., Karp, A., and Hanley, S. J. (2012). high levels of genetic diversity in Salix viminalis of the czech republic as revealed by microsatellite markers. Bioenergy Res. 5, 969–977. doi: 10.1007/s12155-012-9212-4
Ukrainetz, N. K., Ritland, K., and Mansfield, S. D. (2008). Identification of quantitative trait loci for wood quality and growth across eight full-sib coastal douglas-fir families. Tree Genet. Genomes 4, 159–170. doi: 10.1007/s11295-007-0097-x
Via, S., and Lande, R. (1985). Genotype-environment interaction and the evolution of phenotypic plasticity. Evolution 39, 505–522. doi: 10.1111/j.1558-5646.1985.tb00391.x
Wegrzyn, J. L., Eckert, A. J., Choi, M., Lee, J. M., Stanton, B. J., Sykes, R., et al. (2010). Association genetics of traits controlling lignin and cellulose biosynthesis in black cottonwood (Populus trichocarpa, Salicaceae) secondary xylem. New Phytol. 188, 515–532. doi: 10.1111/j.1469-8137.2010.03415.x
Weih, M. (2004). Intensive short rotation forestry in boreal climates: present and future perspectives. Can. J. For. Res. 34, 1369–1378. doi: 10.1139/x04-090
Weih, M. (2009). Genetic and environmental variation in spring and autumn phenology of biomass willows (Salix spp.): effects on shoot growth and nitrogen economy. Tree Physiol. 29, 1479–1490. doi: 10.1093/treephys/tpp081
Wu, R. L. (1998). The detection of plasticity genes in heterogeneous environments. Evolution 52, 967–977. doi: 10.1111/j.1558-5646.1998.tb01826.x
Wullschleger, S. D., Yin, T. M., DiFazio, S. P., Tschaplinski, T. J., Gunter, L. E., Davis, M. F., et al. (2011). Phenptypic variation in growth and biomass distribution for two advanced-generation pedigrees of hybrid poplar. Can. J. For. Res. 35, 1779–1789. doi: 10.1139/x05-101
Keywords: SRC willows, biomass, phenology, plasticity, association mapping, Salix viminalis L., GWAS, marker-assisted selection
Citation: Hallingbäck HR, Berlin S, Nordh N-E, Weih M and Rönnberg-Wästljung A-C (2019) Genome Wide Associations of Growth, Phenology, and Plasticity Traits in Willow [Salix viminalis (L.)]. Front. Plant Sci. 10:753. doi: 10.3389/fpls.2019.00753
Received: 23 October 2018; Accepted: 23 May 2019;
Published: 12 June 2019.
Edited by:
Soren K. Rasmussen, University of Copenhagen, DenmarkReviewed by:
Francesca Taranto, Research Centre for Industrial Crops (CREA), ItalyZhiying Ma, Hebei Agricultural University, China
Ole Kim Hansen, University of Copenhagen, Denmark
Copyright © 2019 Hallingbäck, Berlin, Nordh, Weih and Rönnberg-Wästljung. This is an open-access article distributed under the terms of the Creative Commons Attribution License (CC BY). The use, distribution or reproduction in other forums is permitted, provided the original author(s) and the copyright owner(s) are credited and that the original publication in this journal is cited, in accordance with accepted academic practice. No use, distribution or reproduction is permitted which does not comply with these terms.
*Correspondence: Ann-Christin Rönnberg-Wästljung, YW5raS53YXN0bGp1bmdAc2x1LnNl
†Present address: Henrik R. Hallingbäck, Department of Forest Genetics and Plant Physiology, Umeå Plant Science Centre, Swedish University of Agricultural Sciences, Umeå, Sweden