 Verônica A. Thode
 Lúcia G. Lohmann
- Departamento de Botânica, Instituto de Biociências, Universidade de São Paulo, São Paulo, Brazil
Chloroplast (cp) genome organization, gene order, and content have long been considered conserved among land plants. Despite that, the generation of thousands of complete plastomes through next-generation sequencing (NGS) has challenged their conserved nature. In this study, we analyze 11 new complete plastomes of Amphilophium (Bignonieae, Bignoniaceae), a diverse genus of Neotropical lianas, and that of Anemopaegma prostratum. We explored the structure and content of the assembled plastomes and performed comparative analyses within Amphilophium and among other plastomes available for Bignoniaceae. The overall gene content and orientation of plastomes is similar in all species studied. Plastomes are not conserved among Amphilophium, showing significant differences in length (155,262–164,786 bp), number of genes duplicated in the IRs (eight, 18, or 19), and location of the SC/IR boundaries (i.e., LSC/IRa junction between rps19 and rpl2 genes, within petD, or within petB). Length differences reflect expansions of the IRs and contractions of the LSC regions. The plastome of A. prostratum is 168,172 bp, includes 19 duplicated genes, and has the LSC/IRa boundary located within the petB gene. Amphilophium plastomes show high nucleotide diversity, with many hypervariable regions, and 16 genes with signatures of positive selection. Multiple SSRs and repeat regions were identified for Amphilophium and Anemopaegma prostratum. The differences in structure detected within Amphilophium plastomes in terms of LSC/IR and IR/SSC boundaries, number of duplicated genes, and genome sizes are mostly shared between taxa that belong to the same clade. Our results bring new insights into the evolution of plastomes at low taxonomic levels.
Introduction
Chloroplasts are photosynthetic organelles that have an important role in plant carbon fixation, as well as in the biosynthesis of starch, fatty acids, amino acids, and pigments (Jansen and Ruhlman, 2012; Zhao et al., 2015; Daniell et al., 2016). In angiosperms, the chloroplast genome (plastome) generally has a circular structure that ranges from 120 to 180 kb in size and contains a quadripartite structure, composed of two Inverted Repeat (IR) regions, a Large Single Copy (LSC), and a Small Single Copy (SSC) region (Palmer, 1985; Green, 2011). While plastome organization, gene order, and content has been thought to be conserved among land plants (Odintsova and Yurina, 2003; Wicke et al., 2011; Cai et al., 2015; Smith and Keeling, 2015; Reginato et al., 2016), distinct patterns, rearrangements, differences in structure, size, gene content and order have been documented (Chumley et al., 2006; Haberle et al., 2008; Guisinger et al., 2011; Weng et al., 2014; Firetti et al., 2017; Fonseca and Lohmann, 2017). Furthermore, expansions and contractions of IRs with different orders of magnitude have occurred multiple times during land plant evolution (Zhu et al., 2016; Park S. et al., 2018). These shifts result in gene gains or losses attributed to the transfer of genes from SC regions into the IRs or otherwise, leading to plastome size variation among plant lineages (Goulding et al., 1996; Chumley et al., 2006; Raubeson et al., 2007; Wang et al., 2008; Dong et al., 2013; Sun et al., 2013; Zhu et al., 2016; Firetti et al., 2017).
The lianescent genus Amphilophium Kunth emend L.G. Lohmann includes 47 species and represents the third largest genus of the Neotropical tribe Bignonieae (Bignoniaceae, Lamiales) (Lohmann and Taylor, 2014). Species of Amphilophium occur from Mexico and the Antilles to northern Argentina, southern Brazil, and Uruguay, where they grow in wet and dry forests, or are restricted to savannas or the Amazonian “campinas” (Lohmann and Taylor, 2014). Species of the genus have attractive flowers and interesting fruit morphology, being commonly cultivated through South-Western United States (Lohmann, in review), Latin America, and Asia (Pool, 2007a,b). Corolla shape and fruit morphology can be highly variable (Alcantara and Lohmann, 2010). The first molecular phylogenetic studies to sample Amphilophium were based on the plastid gene ndhF and the nuclear pepC and included 11 species (Lohmann, 2006; Lohmann et al., 2013). These studies aimed at re-evaluating generic limits (Lohmann, 2006) and studying broad-scale biogeographical patterns (Lohmann et al., 2013) within the whole tribe Bignonieae. A subsequent phylogenomic study of the genus used sequences of 78 plastid-coding genes of 32 species of Amphilophium to reconstruct species-level relationships and the fine-scale biogeographic history of the genus (Thode et al., 2019). Thode et al. (2019) recovered a strongly supported phylogeny of Amphilophium, corroborating the monophyly of the genus and its division into five main clades (Lohmann, 2006; Lohmann et al., 2013). These five clades differ morphologically from each other and generally correspond to genera recognized in the past (Gentry, 1973; Pool, 2007a,b, 2009). Despite the existence of phylogenetic and biogeographic information for Amphilophium (Lohmann, 2006; Lohmann et al., 2013; Thode et al., 2019), the plastome structure for the members of this genus remains unknown.
The first complete Bignoniaceae plastome reported in the literature was that of Tanaecium tetragonolobum (Jacq.) L.G. Lohmann (tribe Bignonieae) (Nazareno et al., 2015). This plastome is 153,776 base pairs (bp) long, with a typical quadripartite structure, including 142 genes. Plastomes of eight Anemopaegma species (Firetti et al., 2017), and ten species from the “Adenocalymma-Neojobertia” clade (Fonseca and Lohmann, 2017) were published subsequently. Among all Lamiales plastomes published to date, those from Anemopaegma are the largest (Firetti et al., 2017). The plastomes of the Anemopaegma species range from 167,413 to 168,987 bp and include 141 genes (Firetti et al., 2017). The large size of the Anemopaegma plastomes is associated with the large amount of repetitive sequences and expansion of the IRs (Firetti et al., 2017). On the other hand, the plastomes of the “Adenocalymma-Neojobertia” clade range from 157,027 to 159,725 bp, and generally include 132 genes, although the ycf4 gene was lost in two species sampled (Fonseca and Lohmann, 2017). Plastomes of the “Adenocalymma-Neojobertia” clade also show a series of genomic translocations (Fonseca and Lohmann, 2017). Apart from the Bignonieae plastomes, the plastome of Crescentia cujete L., a member of the Tabebuia alliance (sensu Olmstead et al., 2009), was also sequenced (Moreira et al., 2016). This plastome is 154,662 bp in length and includes 132 genes (Moreira et al., 2016).
In this study, we assembled the complete plastomes of 11 species of Amphilophium (Bignonieae, Bignoniaceae) representing the breath of the morphological diversity of the genus and the five main clades recovered previously (Lohmann, 2006; Lohmann et al., 2013; Thode et al., 2019), plus that of Anemopaegma prostratum DC., an outgroup. This study aims to improve our understanding of plastome characteristics, structural diversity, and evolution within tribe Bignonieae. For that, we: (i) characterized the overall plastome structure; (ii) performed comparative genomic analyses within Amphilophium, and among Amphilophium and other Bignonieae genera; (iii) documented selection patterns within Amphilophium plastid genes; and (iv) identified putative repeated regions.
Materials and Methods
Sampling, Sequencing and Annotation
We analyzed 11 plastomes sequenced using an Illumina’s HiSeq 2500 Genome Analyzer (Illumina, San Diego, CA, United States) and assembled by Thode et al. (2019), namely: A. carolinae (Lindl.) L.G. Lohmann, A. chocoensis (A.H. Gentry) L.G. Lohmann, A. cuneifolium (DC.) L.G. Lohmann, A. dolichoides (Cham.) L.G. Lohmann, A. dusenianum (Kraenzl.) L.G. Lohmann, A. ecuadorense A.H. Gentry, A. gnatophalantum (A. Rich.) L.G. Lohmann, A. lactiflorum (Vahl) L.G. Lohmann, A. paniculatum (L.) Kunth, A. pilosum Standl., and A. steyermarkii (A.H. Gentry) L.G. Lohmann (Table 1). Plastomes assembled for 22 other species (Thode et al., 2019) were not complete and not included here. Furthermore, the plastome of Anemopaegma prostratum, another member of tribe Bignonieae, was also assembled in this study and selected as outgroup based on other studies (Lohmann, 2006; Lohmann et al., 2013). More information about DNA preparation, sequencing, and plastome assembly can be found in Thode et al. (2019). The GenBank accession numbers of all 12 plastomes assembled in this study are given in Table 1. In this study, we verified the boundaries between the LSC, the IRs, and the SSC iteratively using the software afin1 and by searching the specific motifs from each junction in the original read pool using the UNIX “grep” function for all plastomes assembled. The reads found with the sequences of the junctions between the plastome regions were later assembled in Sequencher 5.3.2 (Genecodes, Ann Arbor, MI, United States). Plastome annotations were performed in Geneious 9.1.5 (Kearse et al., 2012), DOGMA (Wyman et al., 2004), and BLAST (Altschul et al., 1990, 1997), with Open Reading Frames (ORFs) checked manually by searching for the start and stop codons. The graphical representations of each plastome with annotations were created in OGDRAW (Lohse et al., 2013). In addition, the junction sites between the LSC/IRa/SSC/IRb regions with full annotations for the adjacent genes were manually analyzed in Geneious, examined, and plotted in IRscope (Amiryousefi et al., 2018)2.
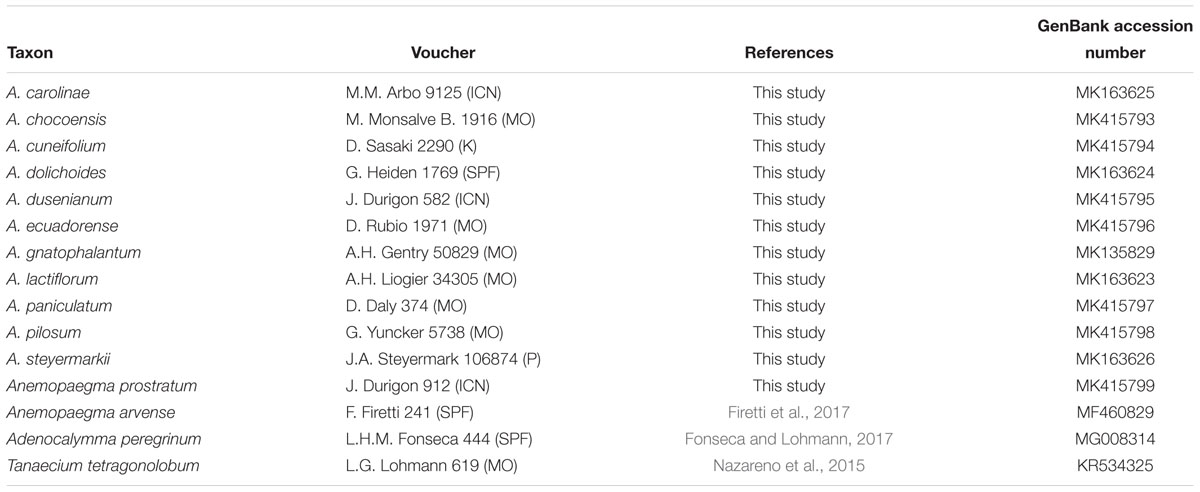
Table 1. Taxa, voucher, reference, and GenBank accession numbers of the taxa analyzed in this study.
Comparative Analyses of Chloroplast Genomes
Comparative analyses were performed between Amphilophium and Anemopaegma prostratum, as well as between those taxa and other previously published Bignoniaceae plastomes, and within Amphilophium only. One copy of the IRs of all plastomes was manually removed in all analyses to avoid data duplication.
To determine synteny and identify possible rearrangements, we compared the Amphilophium plastome sequences with those from three other Bignonieae genera [i.e., Adenocalymma peregrinum (Miers) L.G. Lohmann (GenBank accession number MG008314, Fonseca and Lohmann, 2017), Anemopaegma arvense (Vell.) Stellfeld ex J.F. Souza (GenBank accession number MF460829, Firetti et al., 2017), Anemopaegma prostratum (this study), and Tanaecium tetragonolobum (Jacq.) L.G. Lohmann (GenBank accession number KR534325, Nazareno et al., 2015)] (Table 1). This analysis was performed in Mauve 2.4.0 (Darling et al., 2010)3, with the following settings: progressiveMauve as alignment algorithm, MUSCLE 3.6 (Edgar, 2004) as the internal aligner, with full alignment and minimum locally collinear block (LCB) score automatically calculated. Genomes were not assumed to be collinear.
The 11 Amphilophium plastome sequences were aligned in MAFFT 7 (Katoh and Standley, 2013) using the FFT-NS-2 method (Katoh et al., 2002). To identify variable regions and intra-generic variations within the genus, we visualized the alignment using mVISTA (Frazer et al., 2004) in Shuffle-LAGAN mode (Brudno et al., 2003), using the annotated plastome of A. paniculatum as reference. The same alignment was used to calculate the nucleotide variability values (π) within Amphilophium plastomes. The sliding window analysis was performed in DnaSP 6.10 (Rozas et al., 2017) with step size of 200 bp and window length of 800 bp. We plotted the π values using R (R Development Core Team, 2017).
We estimated the percentage and total number of variable sites across the Amphilophium plastomes using MEGA 7 (Kumar et al., 2016). A total of 78 protein-coding genes were extracted from the 11 Amphilophium plastomes for all taxa and aligned separately considering codon positions in Geneious, using the translation alignment tool ClustalW plugin (Larkin et al., 2007): i.e., accD, atpA, B, E, F, H, I, ccsA, cemA, clpP, infA, matK, ndhA, B, C, D, E, F, H, I, J, K, petA, B, D, G, L, N, psaA, B, C, I, J, psbA, B, C, D, E, F, H, I, J, K, L, M, N, T, Z, rbcL, rpl2, 14, 16, 20, 22, 23, 32, 33, 36, rpoA, B, C1, C2, rps2, 3, 4, 7, 8, 11, 12, 14, 15, 16, 18, 19, ycf1, 2, 3, and 4. We also estimated the number of variable sites within each of the 78 protein-coding genes with MEGA 7.
Selection on Plastid Genes
To evaluate the role of selection on the plastid-coding regions, we used the CODEML application in PAML 4.8 (Yang, 2007) performing a Bayesian identification of codon sites under positive selection. This analysis infers the omega values (ω) in codon alignments of protein-coding sequences and tests for positive selection. The omega value measures the ratios of the non-synonymous and synonymous substitution (ω = dN/dS) (Nielsen and Yang, 1998). Sites are considered to be under negative selection (deleterious or purifying selection) when ω < 1; under neutrality (when the substitution does not change the amino acid) when ω = 1; and under positive selection (adaptive selection) when ω > 1. The fixation of advantageous mutations (adaptive evolution) may be related to evolutionary innovations and species divergence. The 78 protein-coding genes (see above) of the 11 Amphilophium plastomes and that of Anemopaegma prostratum were aligned in Geneious, using the translation alignment tool ClustalW plugin. The CODEML analysis for each gene was performed using as the constraint topology the ML tree from Thode et al. (2019). The terminal and corresponding internal branches of the taxa that were not sampled in this study were removed from the tree in the R package “ape” (Paradis and Schliep, 2018) using the function “drop.tip.” Anemopaegma prostratum was designated as outgroup. Parameters were: runmode = 0, seqtype = 1, CodonFreq = 2, and model = 0, and NSsites = 2 (modeling three classes of sites: 0 < = ω < 1, ω = 1, and ω > 1). Results were considered significant when the posterior probability (Pr) >0.95.
Repeat Analyses
We used MISA (Beier et al., 2017) to identify and locate microsatellites or Simple Sequence Repeats (SSRs; i.e., tandemly arranged repeats of short DNA motifs of 1–6 bp in length) in the plastomes of the Amphilophium species and Anemopaegma prostratum. The following criteria were used while searching for SSRs: SSR motif length between one and six nucleotides, with a minimum number of repetitions set as 10, 5, and 4 units for mono-, di-, and trinucleotide SSRs, respectively, and three units for each tetra-, penta-, and hexanucleotide SSRs. We used REPuter (Kurtz et al., 2001) to identify forward, palindrome, reverse, and complement repeated elements with a minimum repeat size ≥30 bp and a sequence identity ≥90% (Hamming distance = 3).
Results
Assembly and Characteristics of the Chloroplast Genomes
The eleven Amphilophium plastomes range in length from 155,262 (A. gnatophalantum) to 164,749 bp (A. steyermarkii) (Table 2, Figure 1, and Supplementary Figures S1, S2). A minimum of 8,102,426 paired-end raw reads, and a maximum of 23,885,903 reads, with average read depths between 54.5 and 248x for A. cuneifolium and A. dolichoides were obtained, respectively (Supplementary Table S1). All plastomes show the typical quadripartite structure of angiosperms, which consists of a LSC, with length between 75,206 (A. steyermarkii) and 84,697 bp (A. chocoensis); a SSC with length between 12,595 (A. dusenianum) and 12,852 bp (A. chocoensis); and a pair of IRs with length between 29,701 (A. chocoensis) and 38,390 bp (A. steyermarkii) (Table 2, Figures 1, 2, and Supplementary Figures S1, S2A). Anemopaegma prostratum exhibits the largest plastome assembled in this study, with a total length of 168,172 bp, including a LSC composed by 75,218 bp, a SSC with 12,776 bp, and IRs with 40,089 bp, similar to that of Anemopaegma arvense (Firetti et al., 2017; Table 2, Figures 1, 2, and Supplementary Figure 2A). The IR is expanded at the LSC/IRa and IRb/LSC boundaries in some Amphilophium species and in Anemopaegma relative to Adenocalymma peregrinum (Fonseca and Lohmann, 2017) and Tanaecium tetragonolobum (Nazareno et al., 2015; Table 2 and Figures 1, 2). The coding regions of the 11 Amphilophium plastomes range from 83,262 (A. chocoensis) to 88,536 bp (A. steyermarkii). The noncoding regions vary from 71,907 (A. gnatophalantum) to 76,284 bp (A. paniculatum). In Anemopaegma prostratum the coding regions are 89,640 bp in length, while the noncoding regions are 78,532 bp (Table 2 and Supplementary Figure S2B). The average GC content is 37.8% for all species studied (Table 2), similar to other Bignoniaceae plastomes sequenced to date (Nazareno et al., 2015; Moreira et al., 2016; Firetti et al., 2017; Fonseca and Lohmann, 2017).
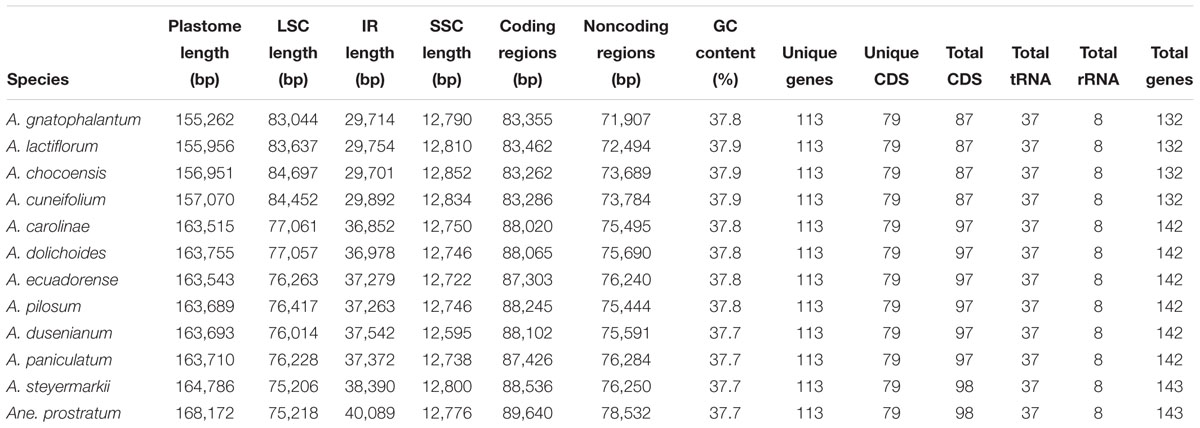
Table 2. Summary of the Amphilophium and Anemopaegma plastomes sequenced.
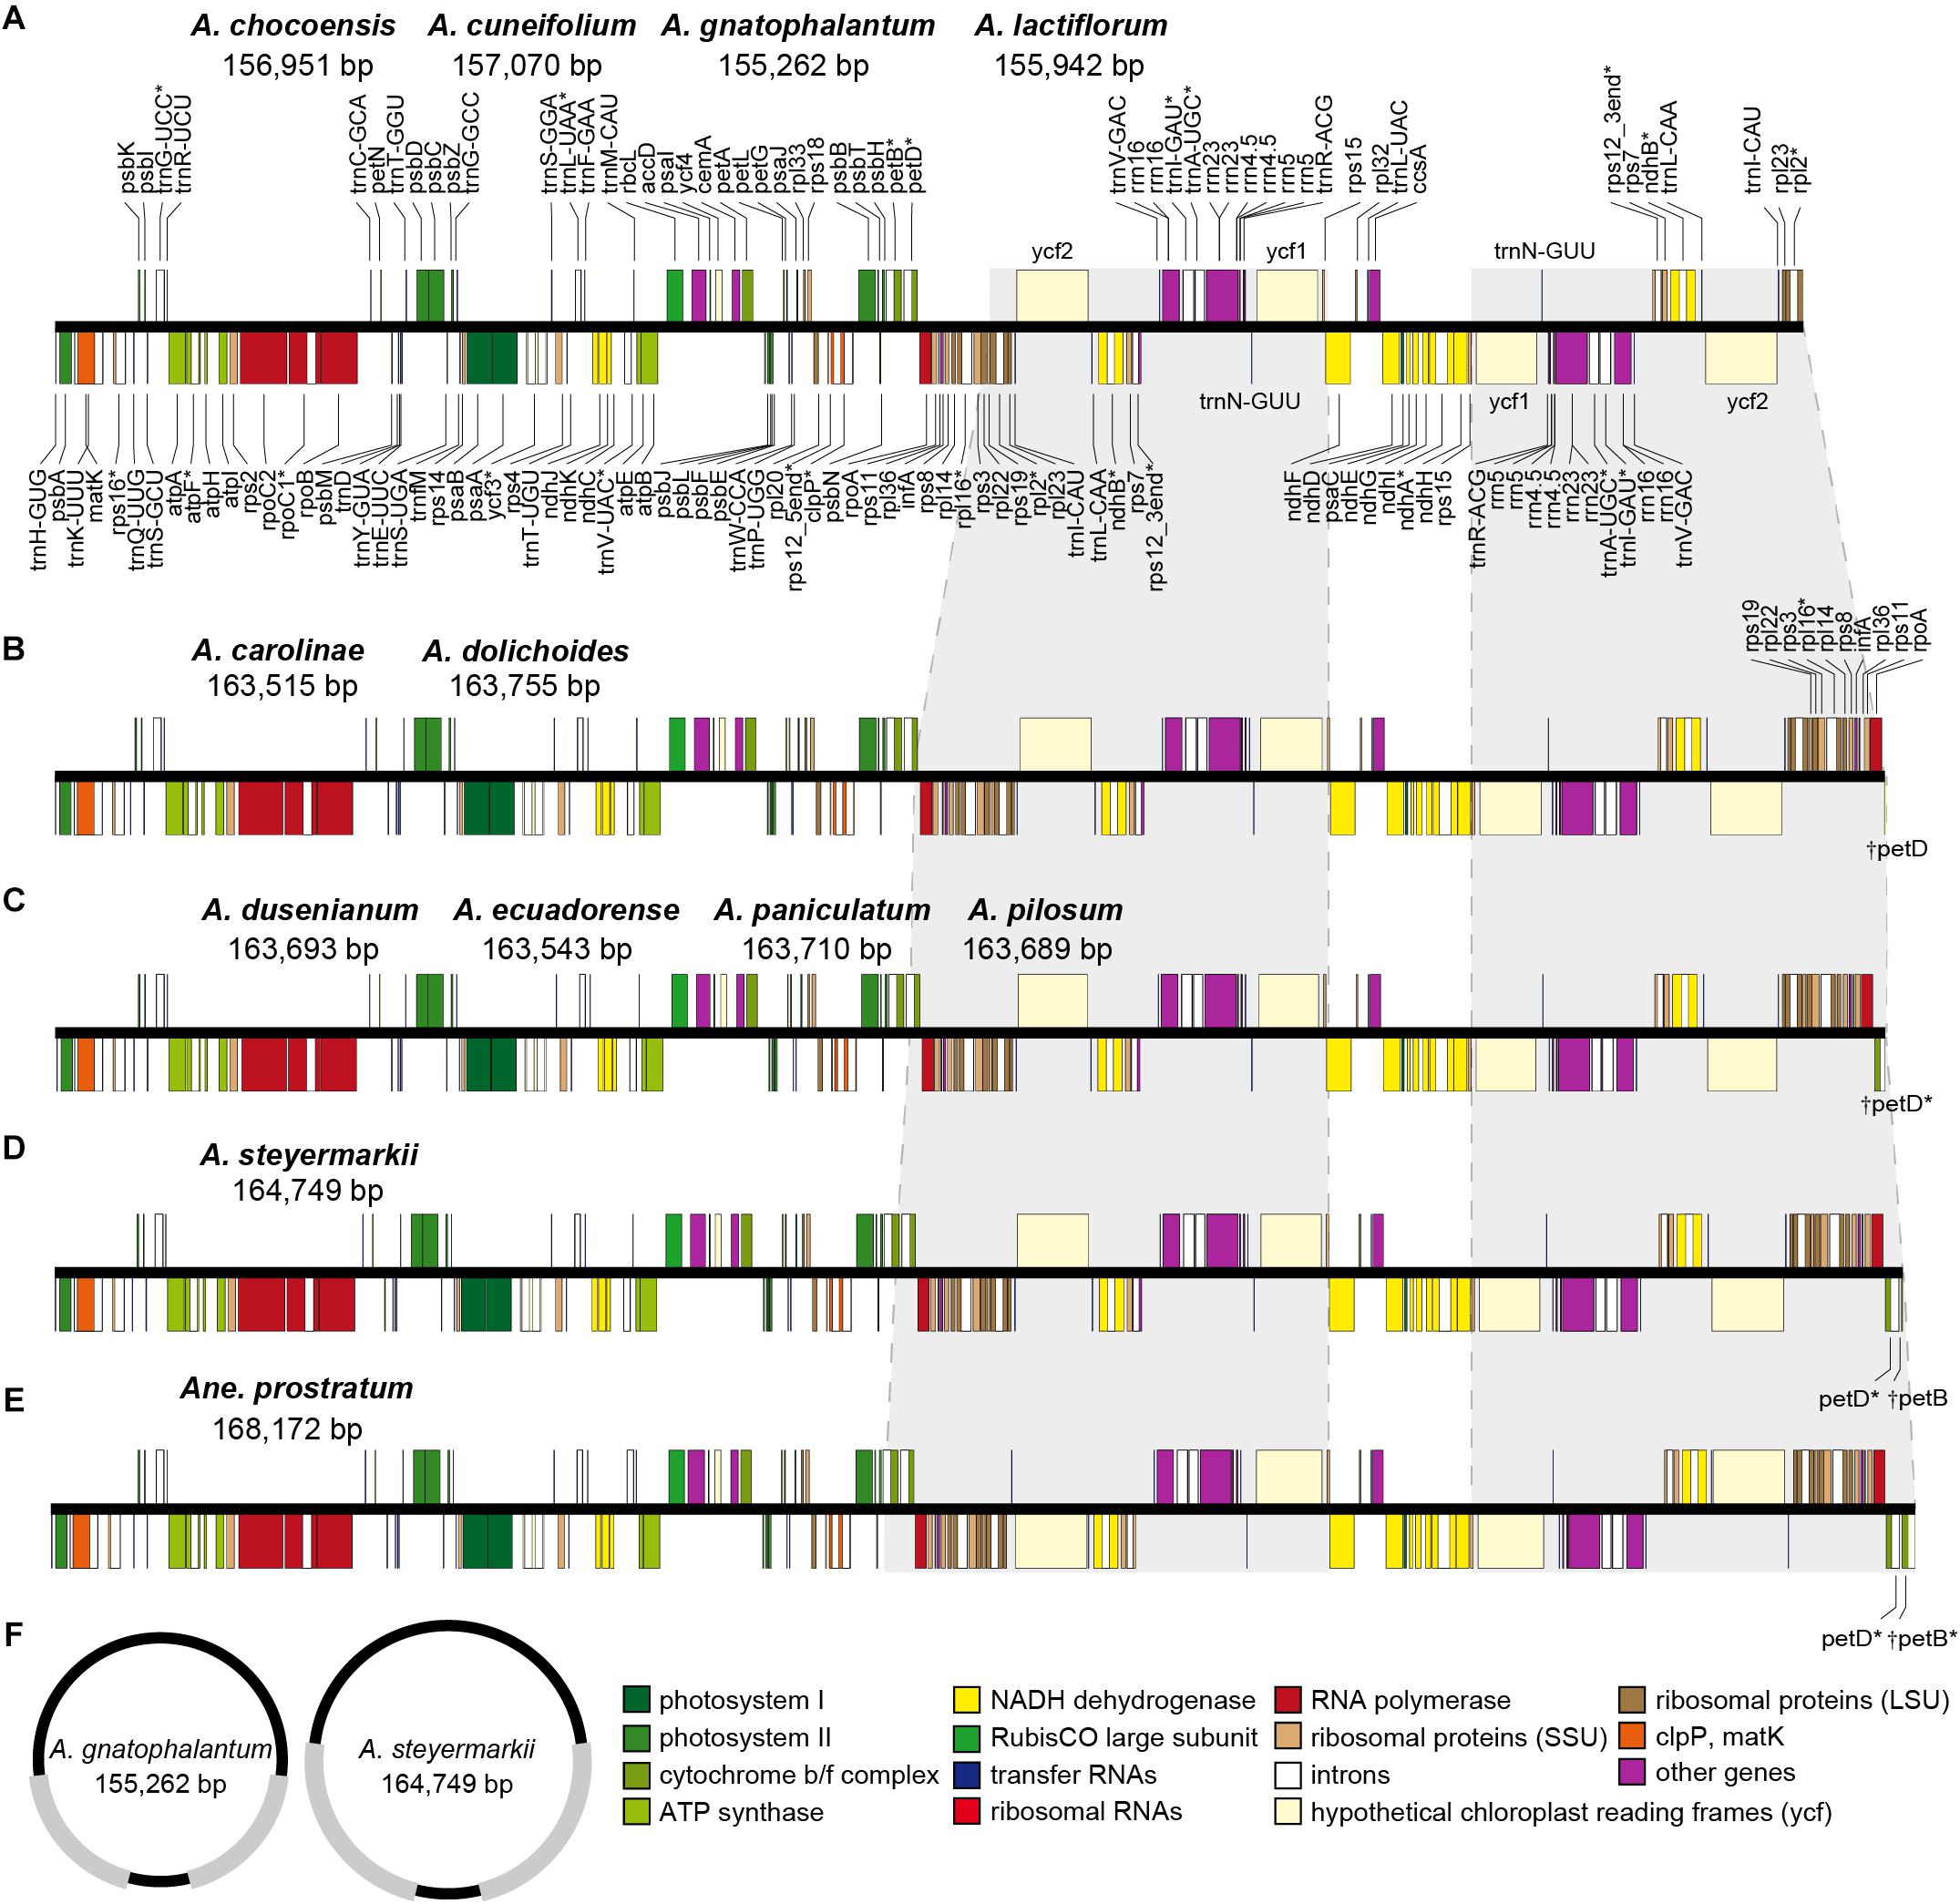
Figure 1. (A–E) Gene maps of the plastomes of the Amphilophium and Anemopaegma species assembled in this study. Gray shading highlights IR regions with IR boundary shifts. Genes drawn below the line are transcribed clockwise, and those drawn above the line are transcribed counterclockwise. Genes belonging to different functional groups are colored according to the legend. Asterisks (∗) represent intron-containing genes. (F) Representation of the smallest and largest Amphilophium plastomes studied. Gray regions correspond to the IRs.
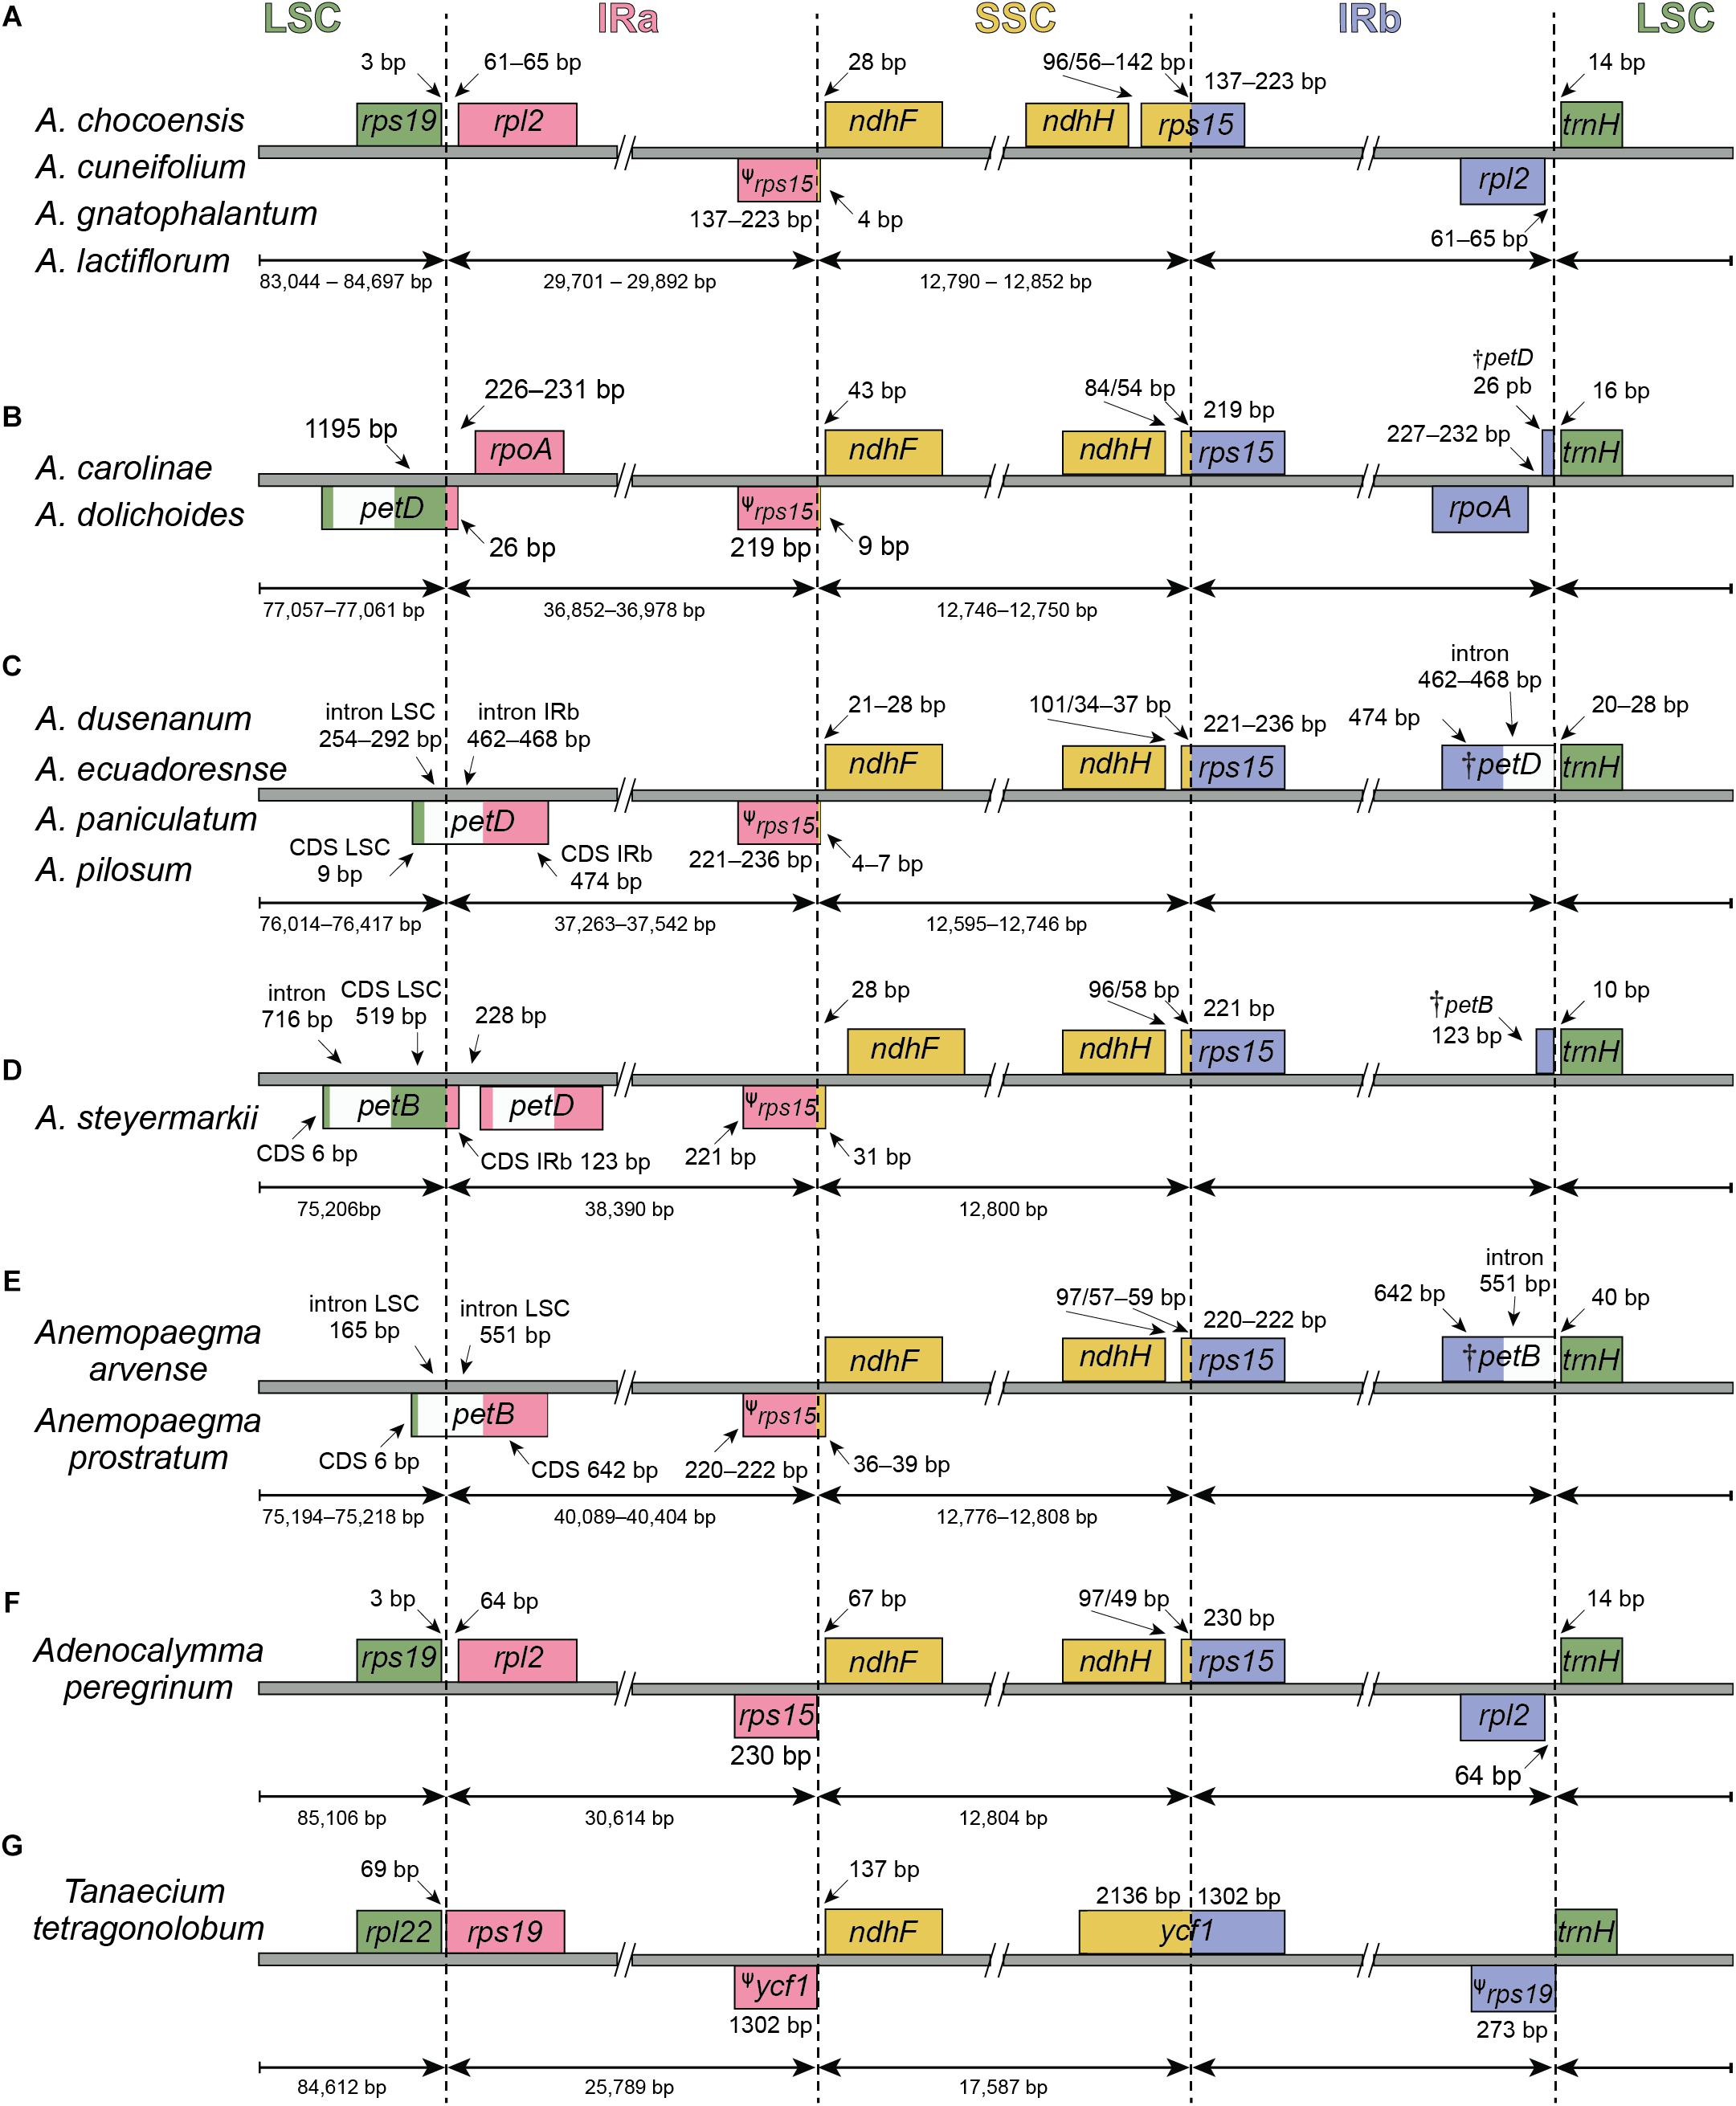
Figure 2. Comparisons of the Large Single Copy (LSC), Inverted Repeat a (IRa), Small Single Copy (SSC), and Inverted Repeat b (IRb) boundaries (A–D) within Amphilophium and (E–G) among four other Bignoniaceae plastomes. Genes shown below are transcribed reversely and those shown above the lines are transcribed forward. Minimum and maximum sizes for the regions and structures of each plastome type that compose the borders are indicated in base pairs (bp).
The 12 plastomes assembled here encode 113 unique genes, including 79 protein-coding genes (CDS), 30 tRNA genes, and four rRNA genes (Tables 2, 3 and Supplementary Table S2). The number of duplicated CDS in the IRs varies depending on the degree of IR expansion and contraction of the LSC regions. While some species show eight duplicated CDS in the IRs (i.e., ndhB, rpl2, rpl23, rps12, rps7, ycf1, ycf2, and ycf15), others show 18 (i.e., the previous eight regions plus infA, rpl14, rpl16, rpl22, rpl36, rpoA, rps11, rps19, rps3, and rps8), or 19 duplications (the previous 18 regions plus petD) (Tables 2–4 and Figure 1). All species include seven tRNA and all four rRNA genes duplicated in the IR regions. The total number of genes ranges from 132 to 143 (Tables 2, 4 and Figure 1). The plastomes assembled in this study include 18 intron-containing genes, of which 15 contain one intron (i.e., atpF, ndhA, ndhB, petB, petD, rpl2, rpl16, rpoC1, rps16, trnA-UGC, trnG-UCC, trnI-GAU, trnK-UUU, trnL-UAA, and trnV-UAC), while three genes contain two introns (i.e., cplP, rps12, ycf3) (Table 3 and Figure 1). The rps12 gene is trans-spliced, with the 5′ end located in the LSC region and the duplicated 3′ end in the IR regions.
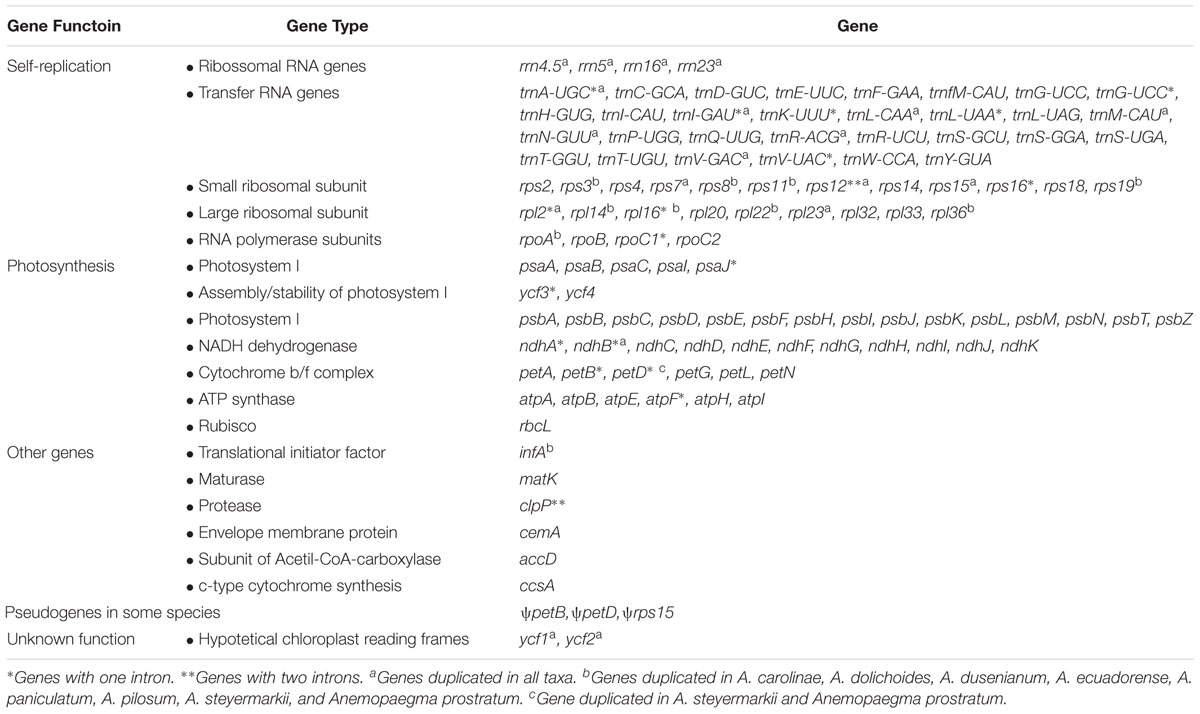
Table 3. Genes encoded by the Amphilophium species and Anemopaegma prostratum plastomes.
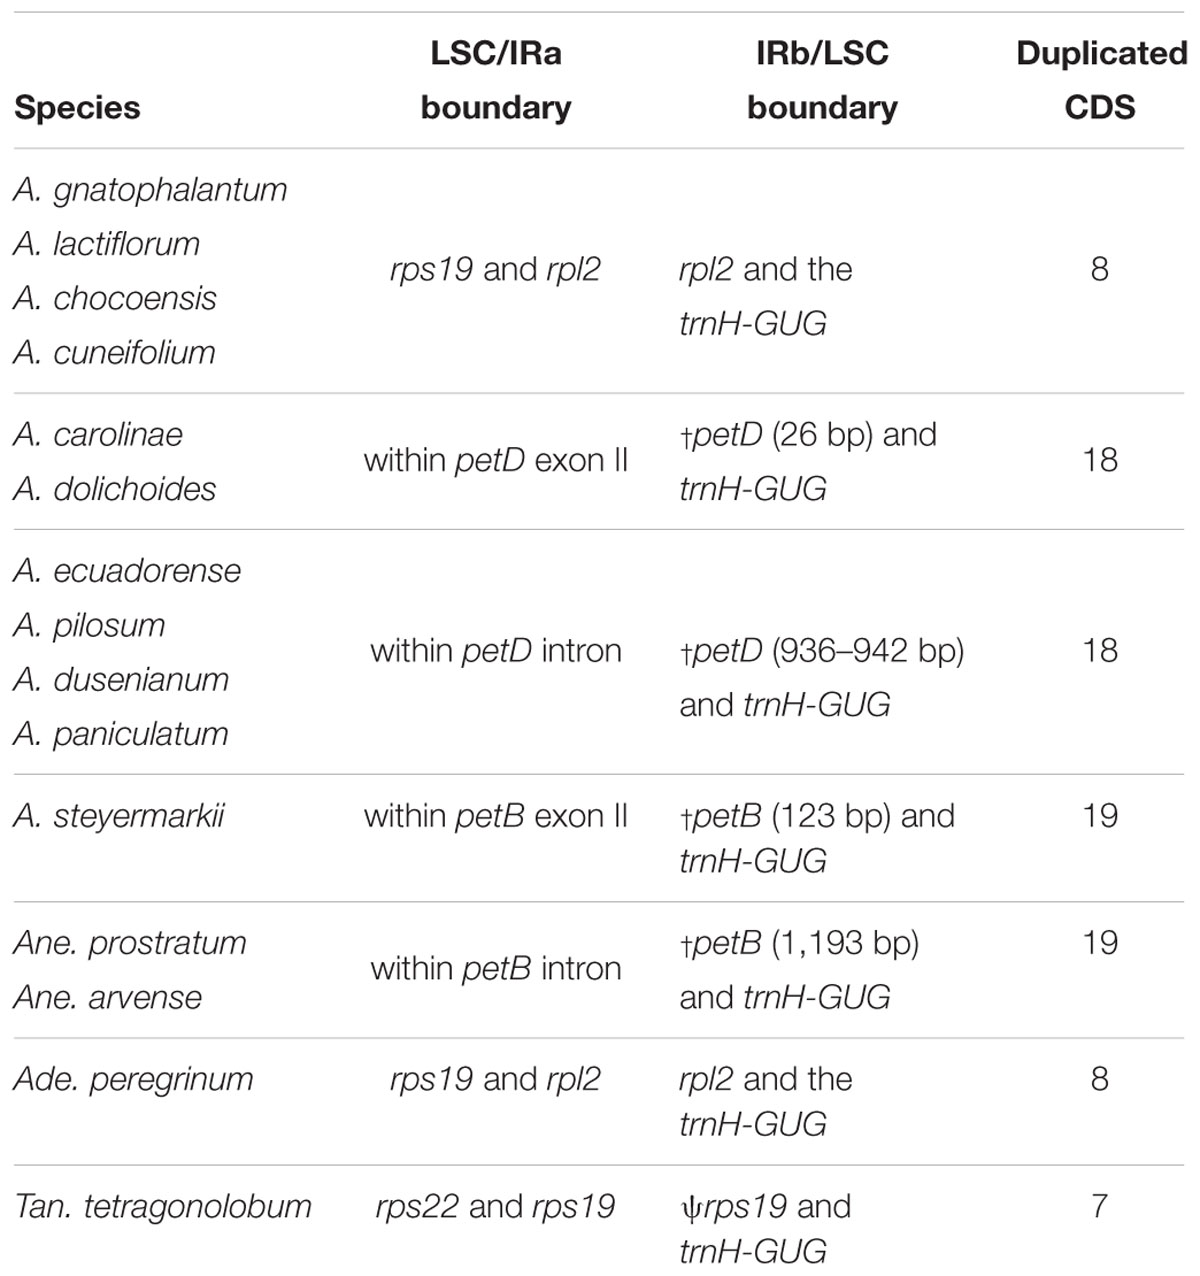
Table 4. Comparisons of the junctions between the Large Single Copy (LSC) and Inverted Repeat a (IRa) and the Inverted Repeat b (IRb) and Small Single Copy (SSC) and number of duplicated protein-coding genes (CDS) in the IRs within Amphilophium and among four other Bignoniaceae plastomes.
According to the IRs/LSC boundaries and the number of duplicated CDS in the IRs, four main plastome patterns were detected within Amphilophium (Tables 2, 4 and Figures 1, 2). The plastomes of A. chocoensis, A. cuneifolium, A. gnatophalantum, and A. lactifluorum have the LSC/IRa boundary between the rps19 and rpl2 genes with eight completely duplicated CDS in the IRs (Table 4 and Figure 2A). The plastomes of A. carolinae, A. dolichoides, A. dusenianum, A. ecuadorense, A. paniculatum, and A. pilosum have the LSC/IRa boundary within the petD gene with 18 duplicated CDS. The IR expansion includes a C-terminal portion of petD generating a truncated (†) petD fragment in IRb. These expansions result in a smaller LSC containing the N-terminal portion of petD (Table 4 and Figures 2B,C). The †petD in the IRb of A. carolinae and A. dolichoides have only 26 bp (Figure 2B), whereas in A. dusenianum, A. ecuadorense, A. paniculatum, and A. pilosum the †petD have 936–942 bp (Figure 2C). The plastomes of A. steyermarkii and Anemopaegma prostratum have the LSC/IRa boundary within the petB gene with 19 duplicated CDS. The IR expansion in these two taxa includes a C-terminal portion of petB generating a †petB fragment in IRb. The LSC in these species are the smallest among the analyzed plastomes and contain the N-terminal portion of petB. The †petB in A. steyermarkii IRb has only 123 bp (Figure 2D), whereas in Anemopaegma prostratum it has 1,193 bp (Table 4 and Figure 2E).
In all Amphilophium studied, one copy of the duplicated rps15 is a pseudogene (ψ) that is 141–240 bp long and is located within the boundary between IRa/SSC, while the functional rps15 gene is 270–279 bp long and located within the SSC/IRb border. In Anemopaegma prostratum, the ψrps15 is 261 bp long, while the rps15 gene is 279 bp (Figure 2). The IRb/LSC junction in A. chocoensis, A. cuneifolium, A. gnatophalantum, and A. lactiflorum is between rpl2 and the trnH-GUG genes (Figure 2A); in A. carolinae, A. dolichoides, A. dusenianum, A. ecuadorense, A. paniculatum, and A. pilosum it is between †petD and trnH-GUG (Figures 2B,C); and in A. steyermarkii, Anemopaegma prostratum, and Anemopaegma arvense (Firetti et al., 2017) it is between †petB and trnH-GUG (Table 4 and Figures 2D,E). The structure found in the IRa/SSC/IRb borders of the A. steyermarkii and Anemopaegma prostratum is similar to that found in Anemopaegma arvense (Firetti et al., 2017; Figures 2D,E), and in the plastomes of seven other Anemopaegma species (Firetti et al., 2017). In Adenocalymma peregrinum (Fonseca and Lohmann, 2017), all boundaries are similar to those found in A. chocoensis, A. cuneifolium, A. gnatophalantum, and A. lactiflorum (Figures 2A,F). The boundaries between all regions are different in the plastome of Tanaecium tetragonolobum (Nazareno et al., 2015; Figure 2G) when compared to those from Amphilophium, Adenocalymma, and Anemopaegma (Figure 2). In T. tetragonolobum, the LSC/IRa boundary is located between the rpl22 and rps19 genes, while the IRa/SSC border is located between ψycf1 and the ndhF gene, and the SSC/IRb border is within the ycf1 gene (Nazareno et al., 2015; Table 4 and Figure 2G). The plastomes of Amphilophium, Adenocalymma, and Anemopaegma include an entire duplication of the ycf1 gene in the IRs (Firetti et al., 2017; Fonseca and Lohmann, 2017; Figures 1, 2).
Identification of Variable Regions
The structural analysis performed in Mauve retrieve five synteny blocks (Supplementary Figure S3). Amphilophium and Adenocalymma peregrinum plastomes (Fonseca and Lohmann, 2017) show the same structure and linear order and are similar to those observed in Anemopaegma arvense (Firetti et al., 2017), Anemopaegma prostratum, and Tanaecium tetragonolobum (Nazareno et al., 2015), except for two local changes. The first is a large inversion of approximately 8 kb, located in the IR regions of both Anemopaegma plastomes, comprising the genes rpl23, trnL-CAA, ycf2, and trnI-AAU (Supplementary Figure S3: yellow block). The second is a smaller inversion (∼1,800 bp) observed within the ycf1 gene in the plastome of Tanaecium tetragonolobum (Supplementary Figure S3: blue block). No major inversions are found within the Amphilophium and Adenocalymma peregrinum plastomes (Supplementary Figure S3).
Pairwise comparison of divergent regions within the 11 Amphilophium plastomes was performed using mVISTA, with A. paniculatum as a reference (Figure 3). Overall, the alignment reveals intra-generic sequence divergence across the plastomes, suggesting that plastomes are not conserved. Noncoding regions are generally more divergent than coding regions. Ten noncoding regions show high divergence among the Amphilophium plastomes: nine intergenic spacers, trnH-GUG/psbA, trnQ-UUG/psbK, rpoB/trnC-GCA, trnF-GAA/ndhJ, psaJ/rpl33, trnI-CAU/ycf2, trnN-GUU/ycf1, ndhF/rpl32, rpl32/trnL-UAG, and clpP introns. Seven coding regions exhibit high divergence, accD, clpP, petD, rpoA, rps11, ycf2, and ycf1, among the studies plastomes (Figure 3).
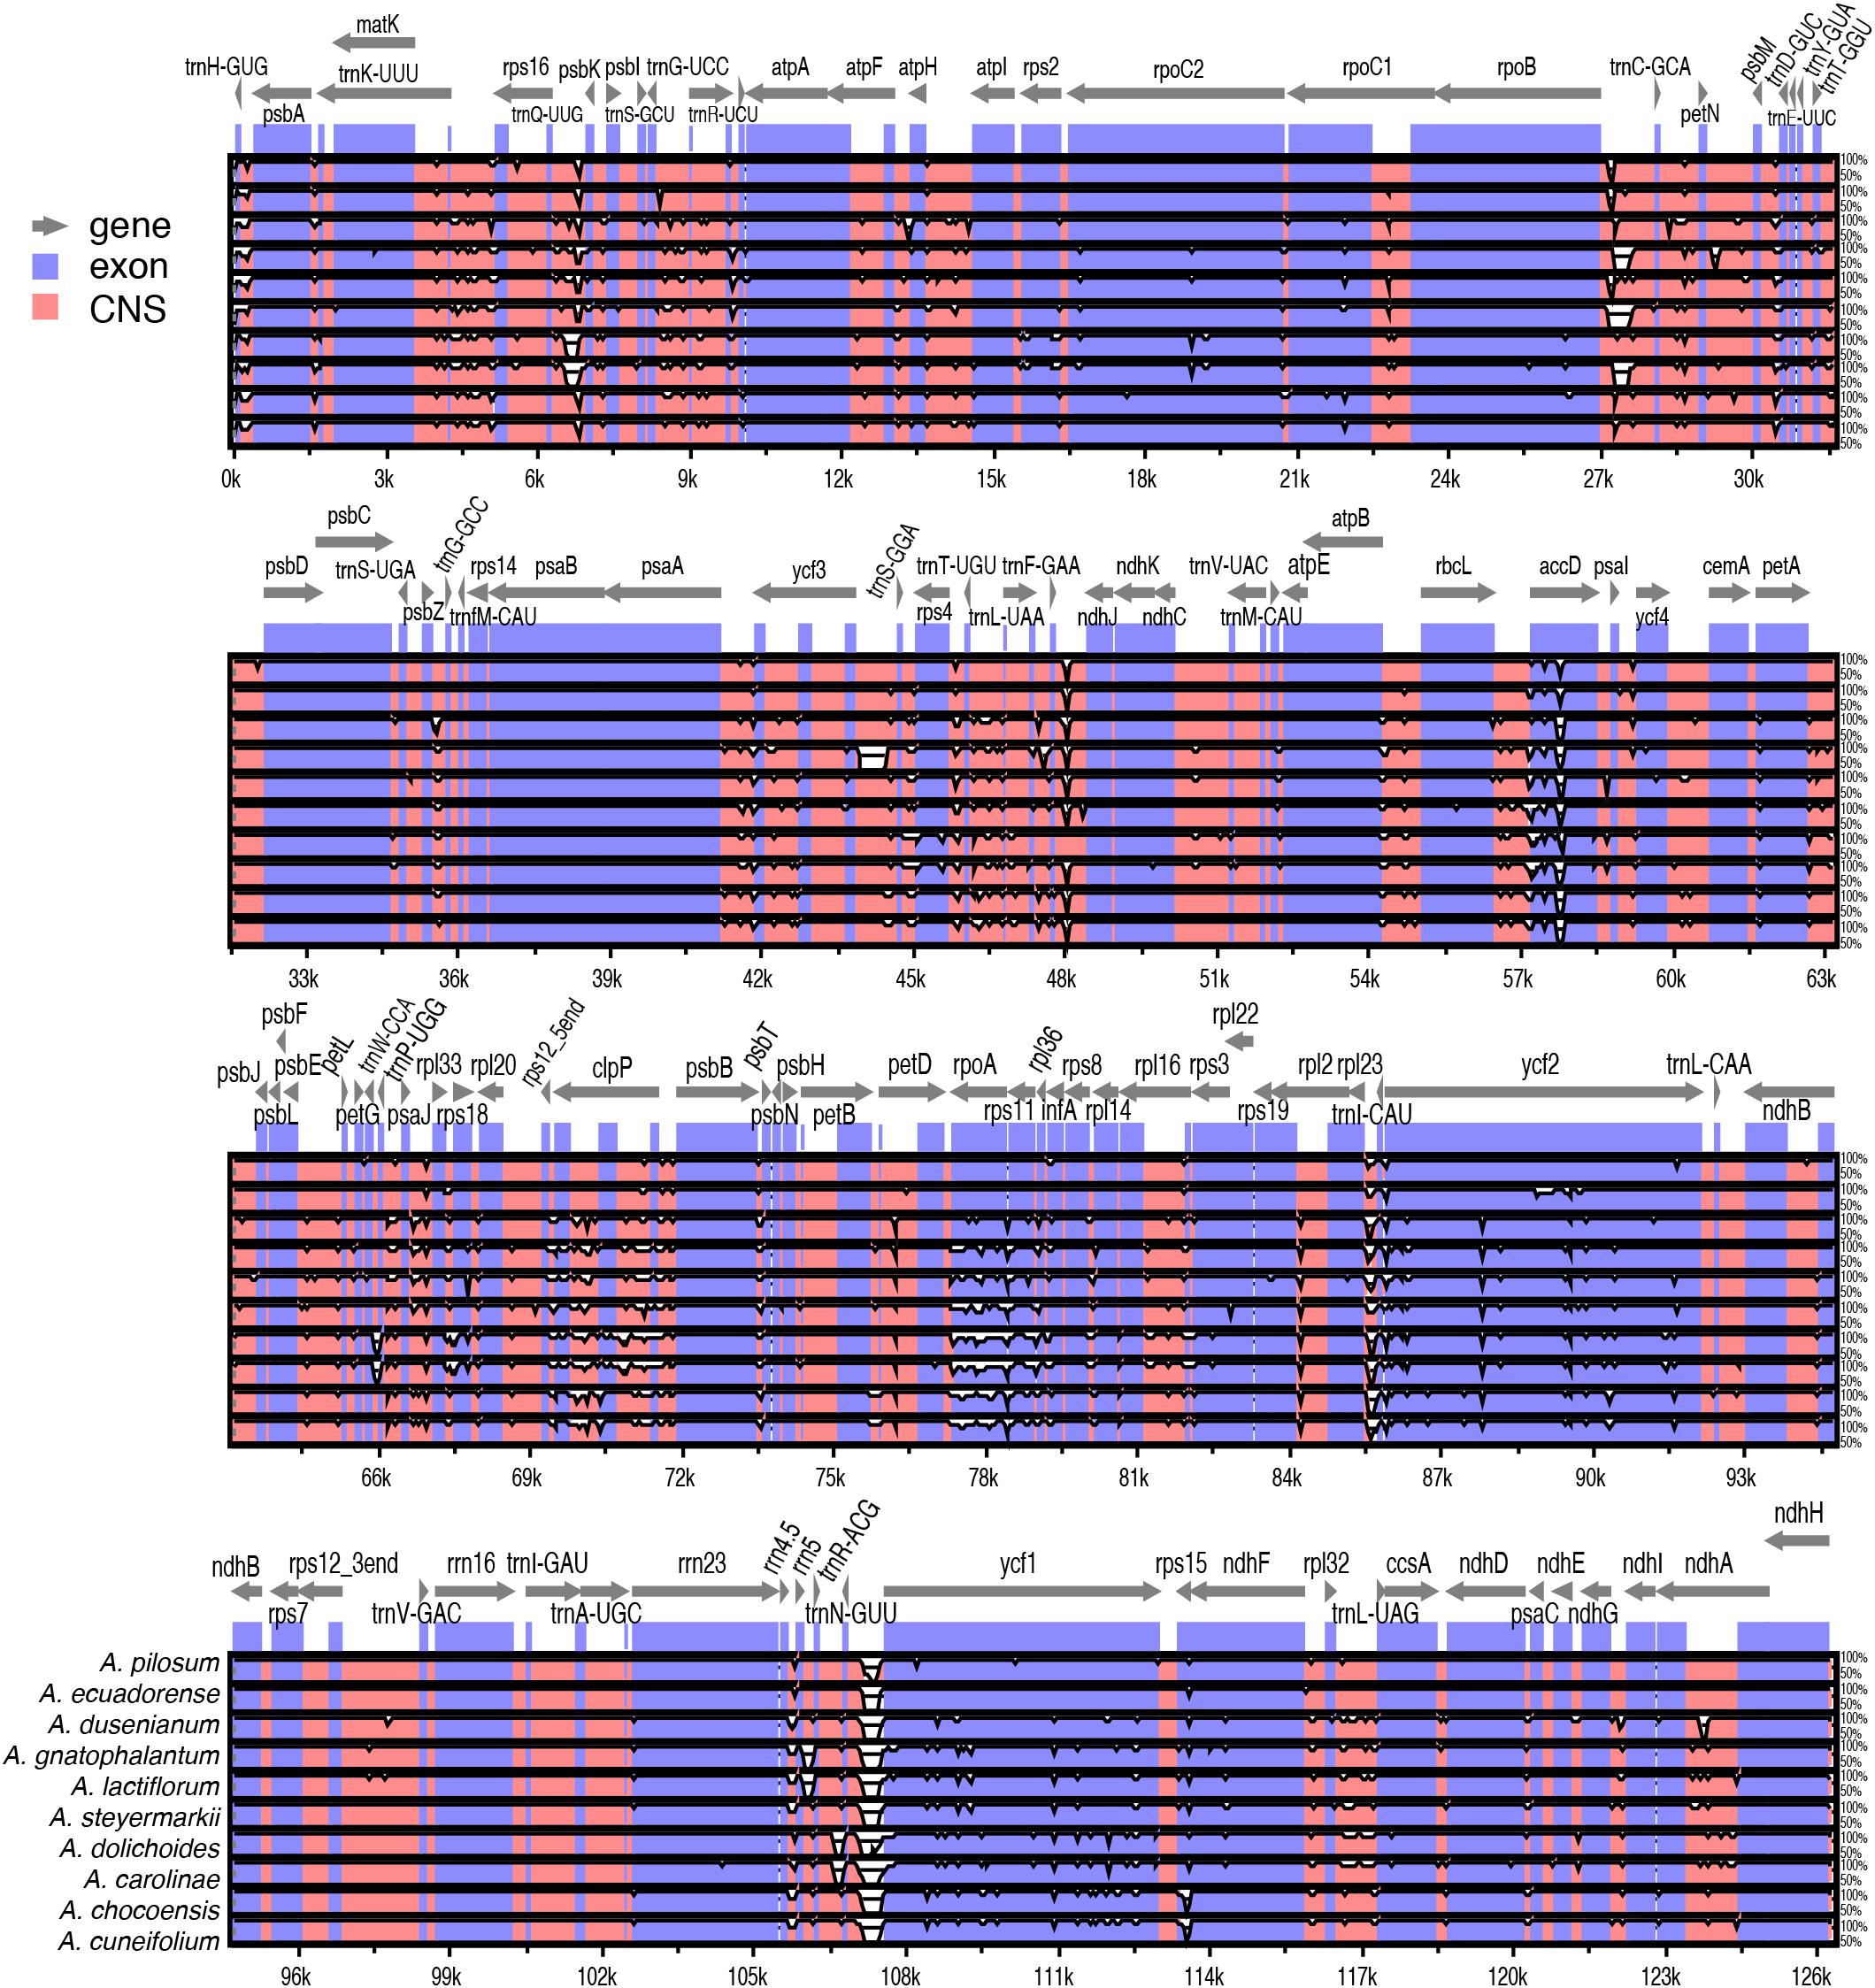
Figure 3. Comparison of the assembled Amphilophium plastomes using mVISTA. Complete plastomes of Amphilophium species are compared using A. paniculatum as reference. Blue blocks indicate conserved genes, while red blocks indicate conserved noncoding sequences (CNS). White blocks represent regions with sequence variation among the 11 Amphilophium species. Gray arrows indicate the direction of gene transcription.
To elucidate levels of diversity at the sequence level, we calculated the nucleotide variability (π) values within the 11 Amphilophium plastomes (Figure 4A). The π values within 800 bp across the plastomes range from 0 to 0.06292, with mean value of 0.01224, indicating that these sequences are highly variable. We identified three hypervariable sites with π > 0.05, which are rpoA, clpP, and rps11; five with π between 0.049 and 0.03, which are accD, rps12_5end/clpP, petD, trnN-GUU/ycf1, and rpl32/trnL-UAG; and five with π > 0.025, which are rpl36, ycf1, rps18, matK/rps16, and ycf2 (Figure 4A).
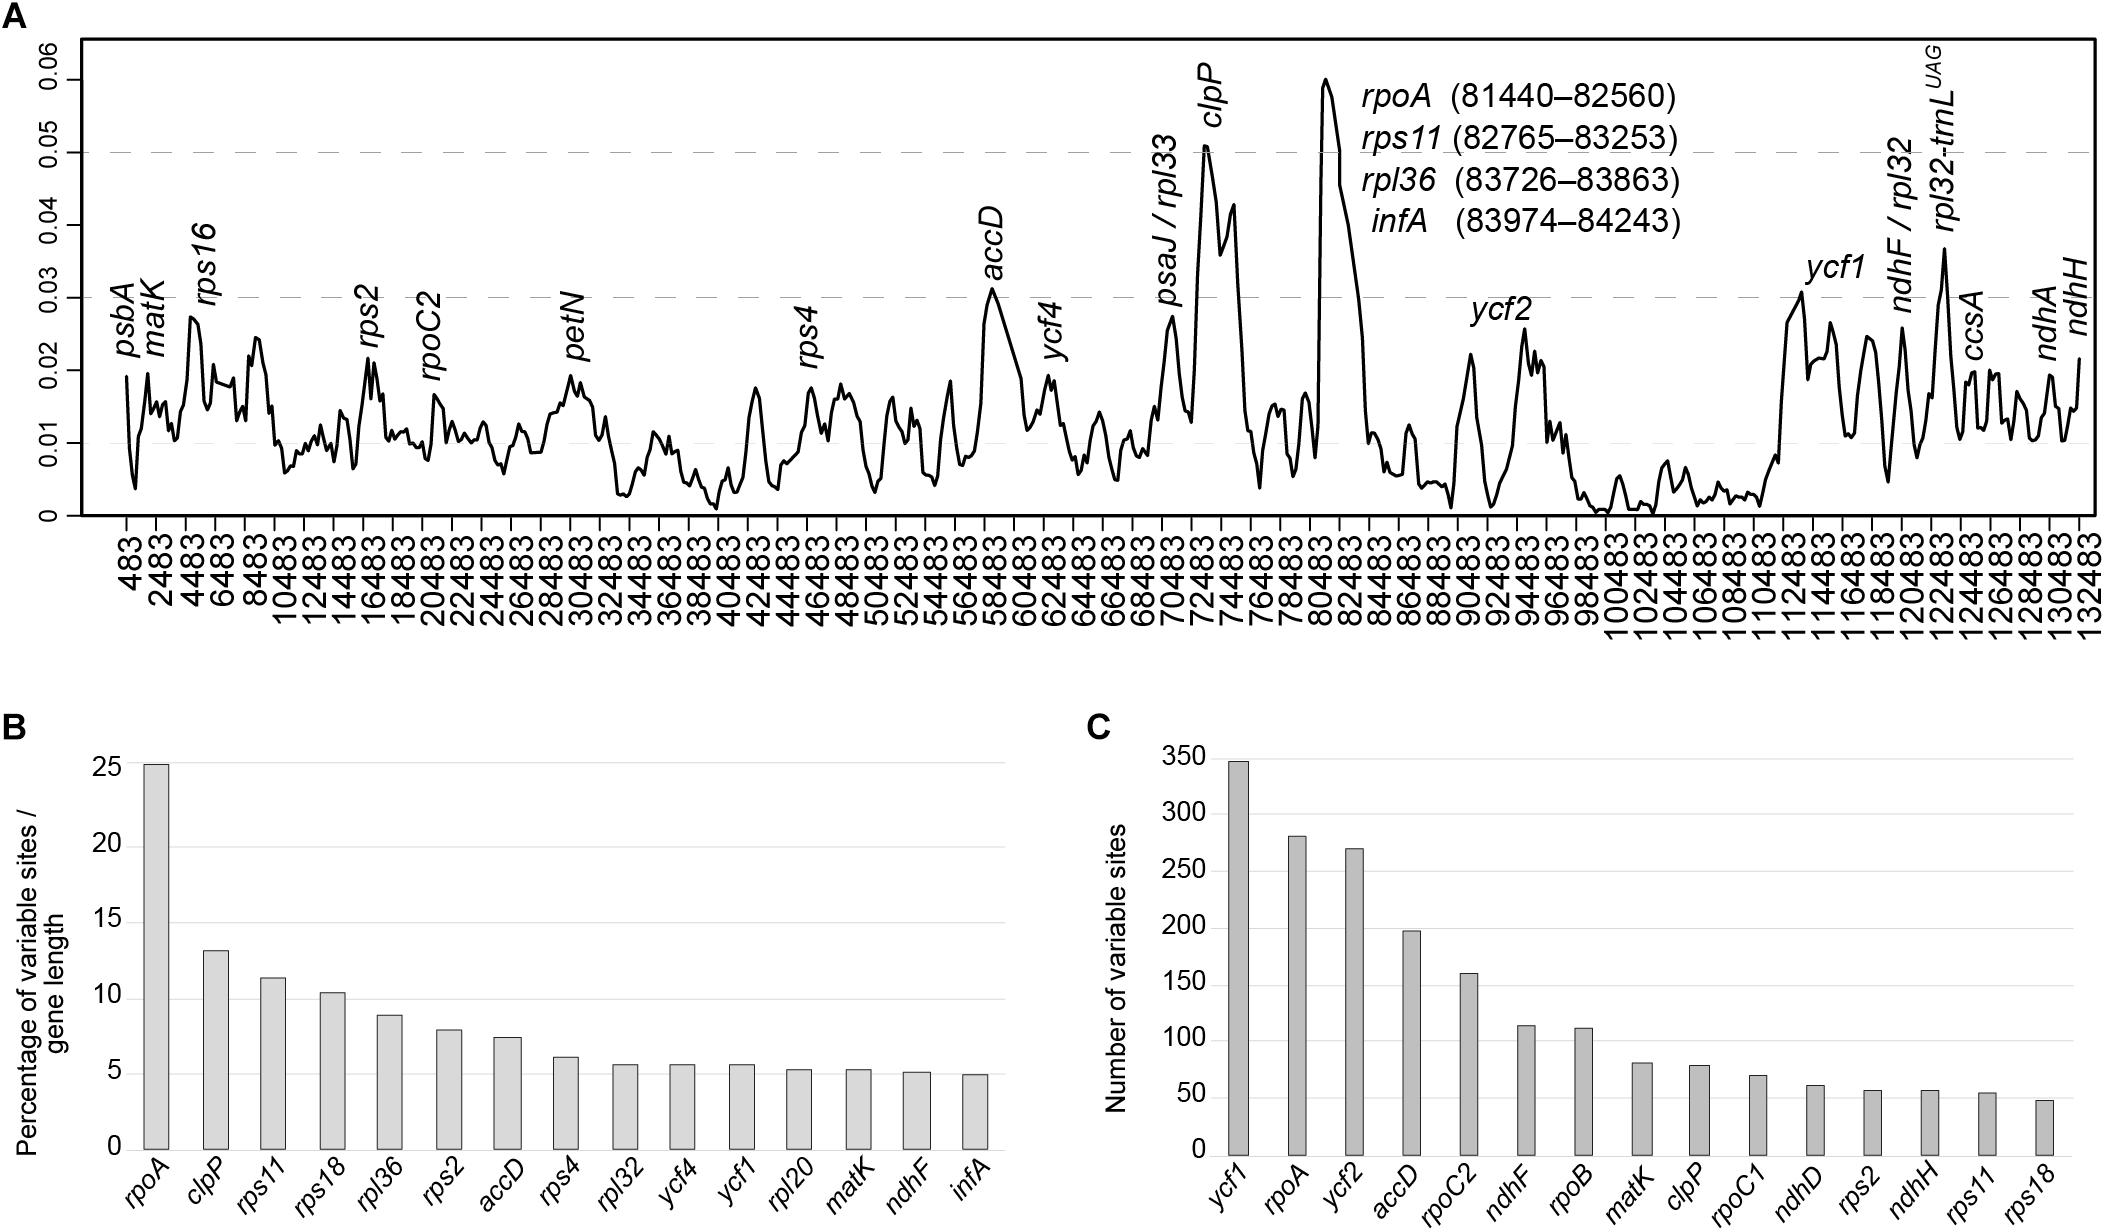
Figure 4. (A) Sliding window analysis of the complete plastomes of 11 Amphilophium species (window length: 800 bp, step size: 200 bp). X-axis, position of the midpoint of each window; Y-axis, nucleotide diversity (π) of each window. (B,C) Fifteen most variable protein-coding genes within the assembled Amphilophium plastomes. (B) Percentage of variable sites according to gene length. (C) Number of variable sites per gene.
In multiple alignments of the Amphilophium plastomes assembled here, the noncoding regions are more variable (i.e., 5.12% of the intergenic regions or 3,221 variable sites from 62,946 bp and 4.25% of the introns or 756 variable sites from 17,804 bp) than the coding regions (4.06% of the protein-coding genes or 2,868 variable sites from 70,554 bp). Among the 78 protein-coding genes, the 15 genes with the highest percentage of variable sites are: rpoA (25.9%), clpP (13%), rps11 (11.2%); rps18 (10.3%), rpl36 (8.8%), rps2 (7.8%), accD (7.4%), rps4 (6%), rpl32 (7.8%), ycf4 (5.5%), ycf1 (5.5%), rpl20 (5.3%), matK (5.2%), ndhF (5.1%), and infA (5%) (Figure 4B and Supplementary Table S2). In terms of absolute numbers, the 15 genes with the highest number of variable sites are: ycf1 (346), rpoA (334), ycf2 (270), accD (198), rpoC2 (159), ndhF (114), rpoB (112), matK (80), clpP (78), rpoC1 (70), rps2 (56), ndhH (56), rps11 (55), and rps18 (47) (Figure 4C and Supplementary Table S2).
Selection on Plastid Genes
The analyses conducted in CODEML to investigate the selection pressure on the 78 protein-coding genes within Amphilophium plastomes, indicated that 16 genes are under positive selection (adaptive selection), when ω > 1 with Pr > 0.95. These genes are: ycf1 (31 sites), ycf2 (25 sites), rpoA (15 sites), accD (12 sites), rps18 and rps7 (11 sites), ycf4 (8 sites), clpP and rbcL (5 sites each), rpoC1 and rps2 (4 sites each), rpoC2 and infA (2 sites each), atpA, rps8 and rps16 (1 site each). Out of the 23,528 codon sites (corresponding to 70,554 bp) of the 78 protein-coding genes, 138 are under positive selection (ω > 1, Pr > 0.95) (Supplementary Table S2). In other genes, sites are probably under neutrality (substitution does not lead to amino acid change, when ω = 1), or sites are under purifying selection (deleterious or constraining selection, when ω < 1).
SSR and Tandem Repeat Analyses
We screened and identified six kinds of repeat patterns using MISA. In Amphilophium plastomes, the total number of SSRs range from 44 (A. paniculatum) to 57 SSRs (A. dusenianum), while 42 SSRs are recovered in Anemopaegma prostratum (Figure 5). The most abundant SSRs are A or T mononucleotide repeats, which account for 54–69.6% of the total SSRs; G or C repeats, on the other hand, are rare (Figure 5A and Supplementary Table S3). The total number of SSR motifs in Amphilophium is as follows: 29–39 (58–74%) mono-, 2–4 (3.6–8%) di-, 3–7 (6.5–15%) tri-, 4–9 (7–17%) tetra-, 0–5 (0–9.6%) penta-, and 0–2 (0–4.8%) hexanucleotides (Figure 5A and Supplementary Table S3). Furthermore, most of the SSRs in the Amphilophium species are located in the LSC region and range between 71.2 and 86.4%. In Amphilophium, the IR regions include between 8.5 and 22% of the SSRs, while the SSC region include between 2 and 8.8% (Figure 5B and Supplementary Table S3). SSRs are found mainly in intergenic regions. The plastomes of the Amphilophium species contain between 57.4 and 82% of the SSRs in the intergenic spacers, between 14.6 and 24% in the coding regions, and between 12 and 20.8% in the introns (Figure 5C and Supplementary Table S3). In Anemopaegma prostratum, 69% of the SSRs are located in the LSC, 23.8% in the IRs, and 7.1% in the SSC region. Of the total number of SSRs found in A. prostratum, 66.7% are in the intergenic regions, 23.8% in the coding regions, and 9.5% in the exons (Figures 5B,C and Supplementary Table S3).
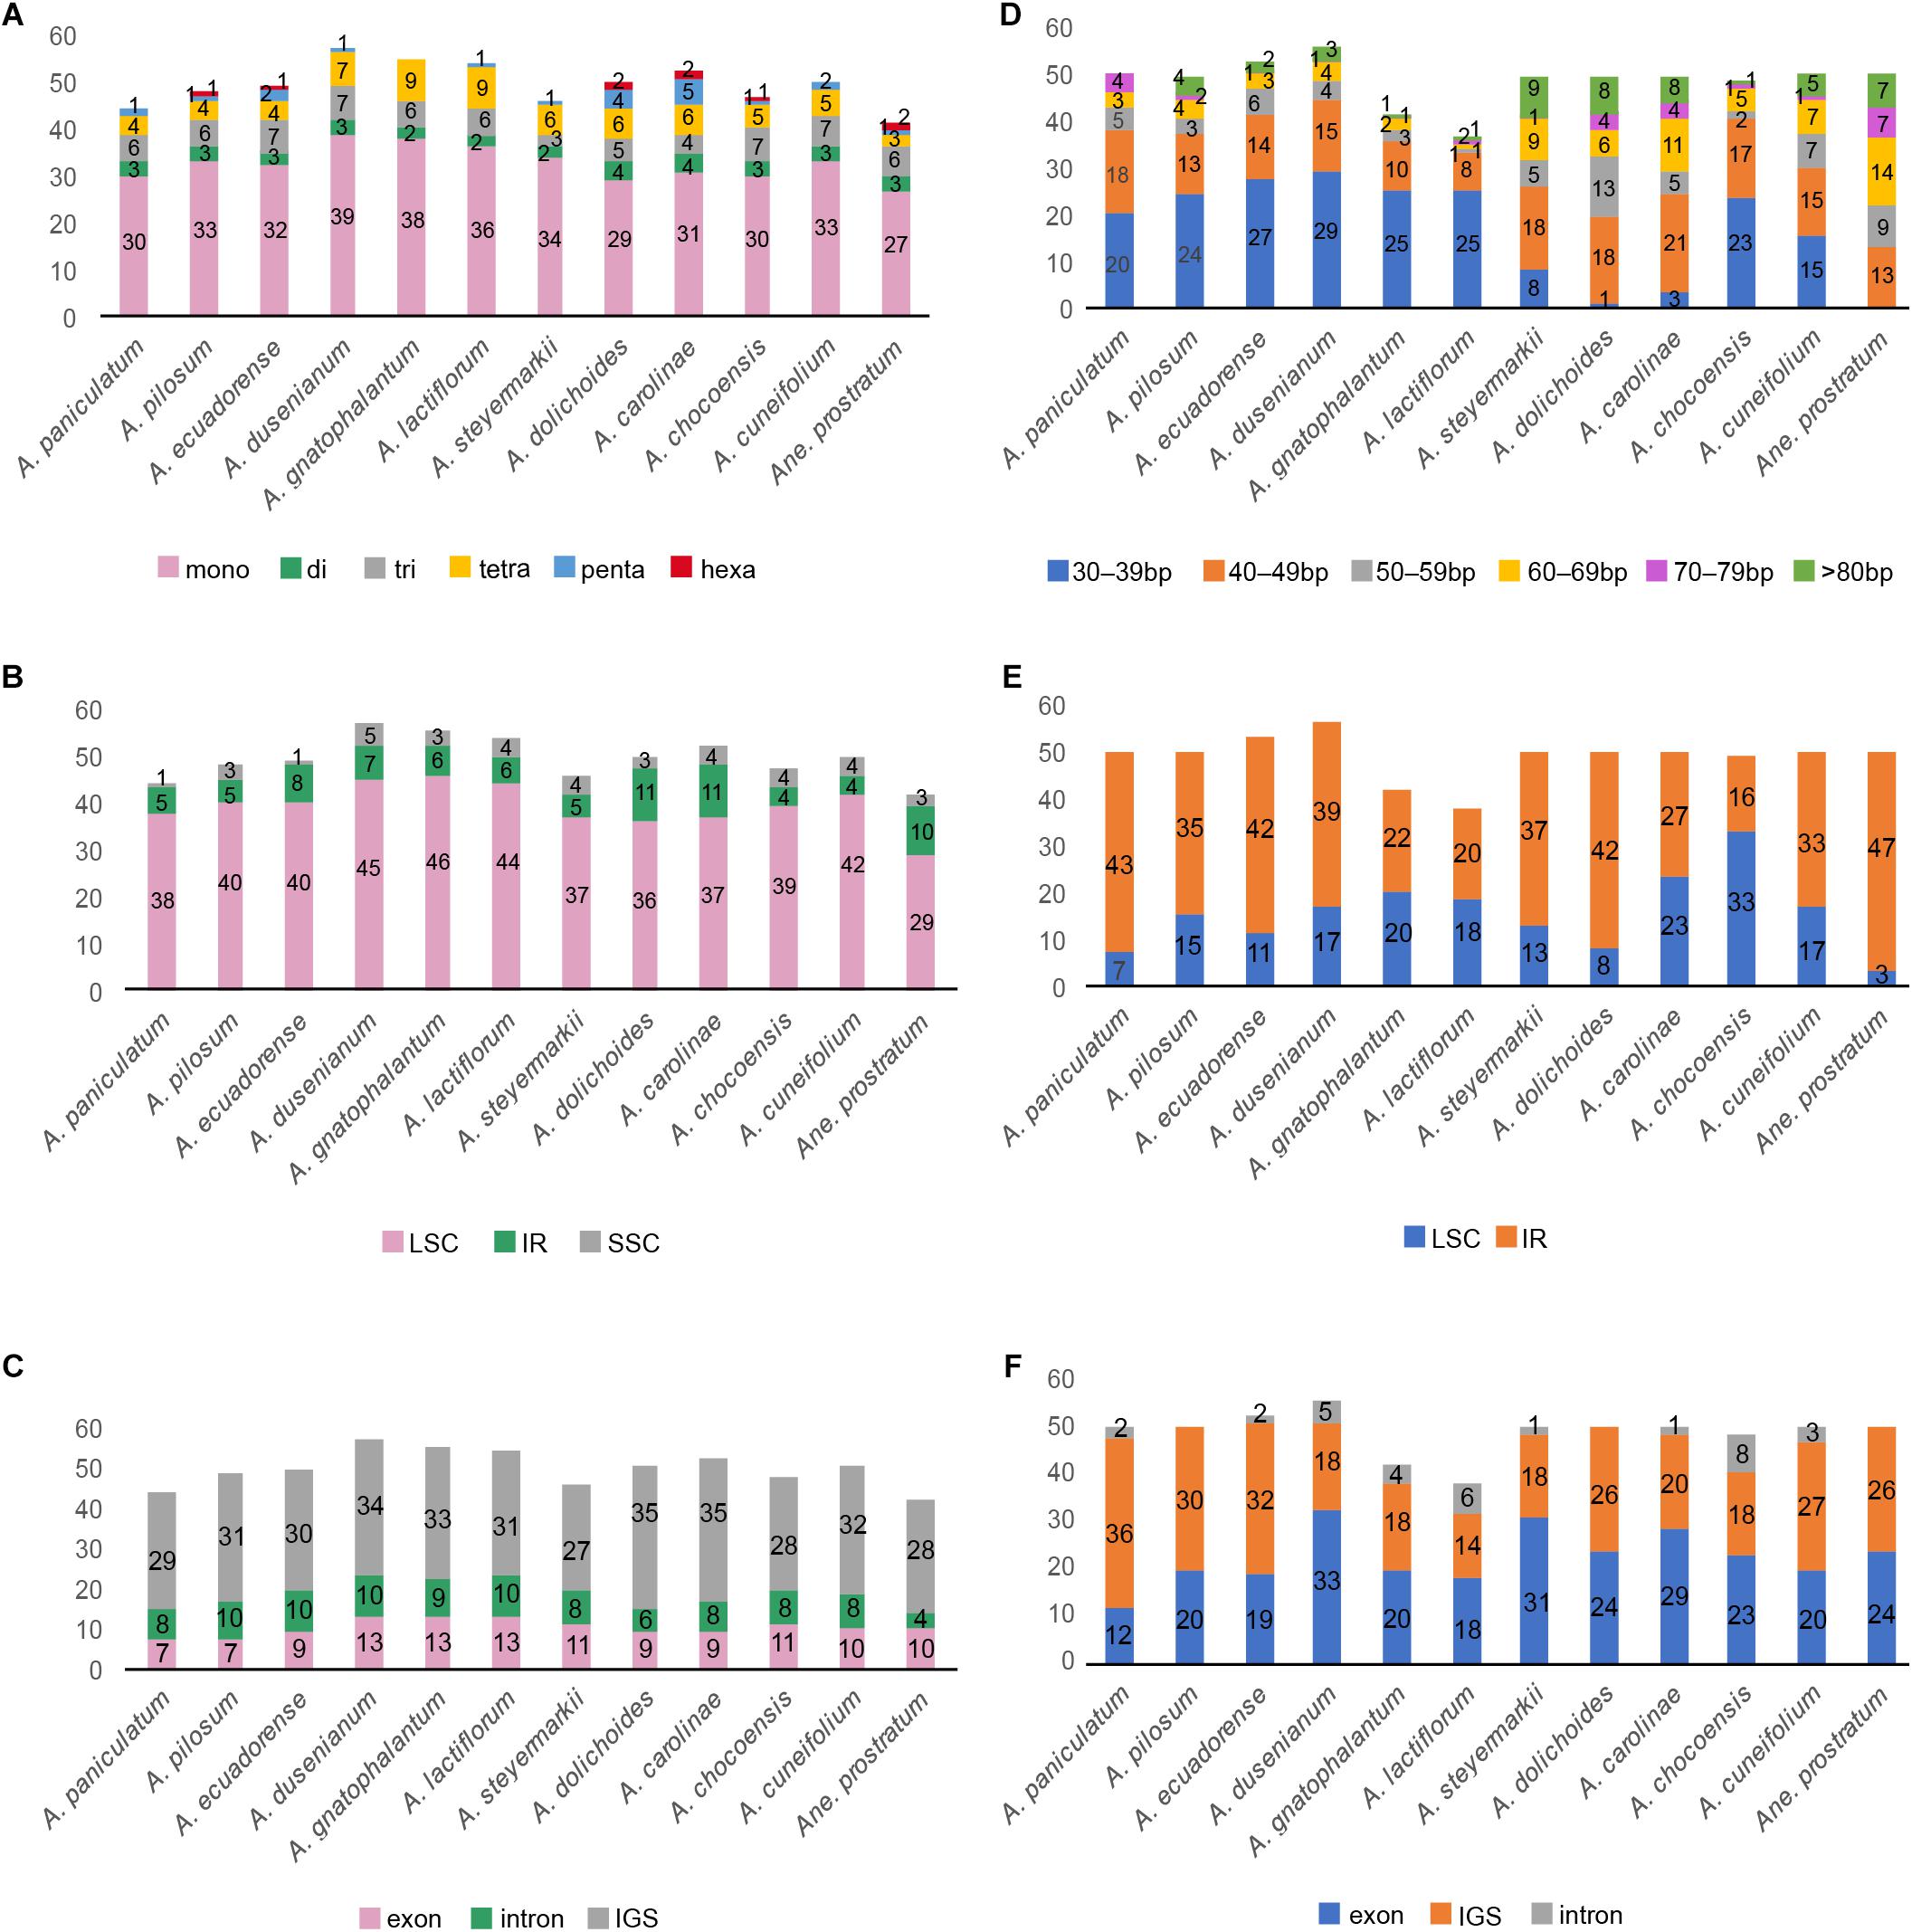
Figure 5. (A–C) Distribution of SSRs in the Amphilophium and Anemopaegma prostratum plastomes. (A) Distribution of SSR types. (B) Number of SSRs per genomic regions. (C) Distribution of SSRs in exon, intergenic spacer (IGS), and intron regions. (D–F) Analysis of tandem repeats in the Amphilophium and Anemopaegma prostratum plastomes. (D) Distribution and length of tandem repeats. (E) Distribution of tandem repeats in genomic regions. (F) Distribution of tandem repeats in exon, intergenic spacer (IGS), and intron regions.
We also used REPuter to identify the tandem repeat sequences of ≥30 bp of the Amphilophium and Anemopaegma prostratum plastomes. The total number of repeats in Amphilophium range between 38 (A. lactiflorum) and 56 (A. dusenianum), all located in the LSC and IR regions, with maximum sizes ranging from 50 to 150 bp (Figures 5D,E and Supplementary Tables S4, S5). The Amphilophium plastomes contain between 33 and 50 forward repeats, and 1 to 6 palindrome repeats, with reverse repeats being rare, ranging from 0 to 3 (Supplementary Table S4). In most Amphilophium plastomes, repeats with 30–39 bp are the most common, except in A. carolinae, A. dolichoides, and A. steyermarkii, all of which have a large number of repeats ranging from 40 to 49 bp (Figure 5D and Supplementary Table S4). These repeats are found predominantly in intergenic regions (14–36 bp) and exons (12–33 bp), with a few repeats located in the introns (0–8 bp) (Figure 5F and Supplementary Table S4). In Anemopaegma prostratum plastomes, the total number of repeats is 50, three of which are located in the LSC and 47 located in the IR regions; 24 are located in the intergenic regions and 26 in the exons; 49 are forward repeats and one palindrome with a maximum size of 165 bp. Different from the Amphilophium plastomes, most of the repeats in A. prostratum range between 60 and 69 bp (Figures 5D–F and Supplementary Tables S4, S5). The locations of the repetitive sequences vary among Amphilophium species, although some regions show repeats on all 11 species (e.g., accD, rbcL/accD, ycf1, and ycf2), while some locations show repeats on most species (e.g., rps12/trnV-GAC, trnN-GUU/ycf1, ycf3, psbT/psbN, rps11, rpl23/trnI-CAU) (Supplementary Table S5).
Discussion
Plastome Features
In this study, we assembled 11 complete plastomes of Amphilophium species and the plastome of Anemopaegma prostratum, another species from tribe Bignonieae. The organization of Amphilophium plastomes is similar among the species studied and other angiosperm plastomes. Amphilophium plastomes show expansions of the IRs and contractions on the LSC in some species. The overall genomic structure among Amphilophium plastomes is not conserved though, including differences in length, boundaries between the SC/IR regions, number of duplicated genes in the IRs, and total length (Tables 2, 4 and Figures 1–4). We detected a difference of nearly 9.5 kb between the smallest (A. gnatophalantum) and largest (A. steyermarkii) genomes, respectively (Table 2 and Figure 2F). Expansions of the IRs of ca. 8.7 kb and LSC contractions of ca. 9.5 kb are observed (Table 2, Figures 1, 2 and Supplementary Figure S1). The Anemopaegma prostratum plastome also shows an IR expansion and a LSC contraction, similar to the plastomes of eight other Anemopaegma species sequenced in a previous study (Firetti et al., 2017). Nonetheless, the IR expansion of Anemopaegma plastomes is even larger than those found in Amphilophium plastomes, with a ca. 10 kb expansion, when the IRs of A. gnatophalantum and Anemopaegma prostratum are compared. On the other hand, the LSC in the Anemopaegma prostratum plastome is ca. 9.4 kb smaller than that of A. chocoensis (Table 2). The SSC show a small variation in size within Amphilophium plastomes, with a difference of 257 bp between the smallest (A. dusenianum) and largest regions (A. chocoensis) (Table 2 and Figures 1, 2). According to the IR expansion toward the LSC, the Amphilophium plastomes exhibit different junctions between regions (i.e., between rps19 and rpl2, within petD, and within petB), as well as a different number of completely duplicated protein-coding genes (i.e., eight, 18, or 19). Besides the expansion of the IRs and differences in the boundaries of the regions within the Amphilophium plastomes, no rearrangements or major inversions are detected. An inversion of ∼8 kb that includes the genes rpl23, trnL-CAA, ycf2, and trnI-AAU is observed in Anemopaegma prostratum and in the plastomes of other eight Anemopaegma species. However, these inversions were not observed in any other Lamiales (Firetti et al., 2017; Supplementary Figure S3). The boundary positions observed in Anemopaegma prostratum were conserved among eight other Anemopaegma plastomes (Firetti et al., 2017). The Anemopaegma plastomes are the largest described to date for Lamiales, with 19 completely duplicated CDS in the IRs (Firetti et al., 2017). PCR amplifications were performed to check the boundary positions and the inversion of the ycf2 gene in Anemopaegma (Firetti et al., 2017).
The IR/SC boundaries are conserved in ten plastomes of the “Adenocalymma-Neojobertia” clade (Fonseca and Lohmann, 2017). Despite that, the genome structure is quite variable within the “Adenocalymma-Neojobertia” clade, with rearrangements in the LSC and IR regions and a complete loss of the ycf4 gene in two species (Fonseca and Lohmann, 2017). Furthermore, plastomes of the “Adenocalymma-Neojobertia” clade show eight duplicated CDS in the IRs (Fonseca and Lohmann, 2017). All the boundaries between plastome regions of Tanaecium tetragonolobum (Nazareno et al., 2015) and Crescentia cujete (Moreira et al., 2016) are located in positions that are different from those of Amphilophium, Adenocalymma, and Anemopaegma. In these two species, the LSC/IRb boundary is located between the rpl22 and rps19 genes, the IRb/SSC border is located between the ψycf1 and the ndhF gene, and the SSC/IRa border is located within the ycf1 gene (Nazareno et al., 2015; Moreira et al., 2016; Figure 2). The plastomes of these two species also show a partial duplication of the ycf1 (ψycf1) and a duplication of the complete copy of the rps15 gene. Differently, the plastomes of Amphilophium, Adenocalymma, and Anemopaegma show a complete duplication of the ycf1 gene as well as a partial duplication of the ycf15 in the IRs (Firetti et al., 2017; Fonseca and Lohmann, 2017; Figures 1, 2). Part of the ycf1 and ycf15 genes are included in the SSC region in other angiosperm groups (Dugas et al., 2015). The shift of the IRs/SSC junctions in Amphilophium, Anemopaegma, and the “Adenocalymma-Neojobertia” clade result in the expansion of the IRs and contraction of the SSC (Firetti et al., 2017; Fonseca and Lohmann, 2017). The expansion of the IRs toward the SSC has also been reported in Pelargonium (Chumley et al., 2006), members of Apiales (Downie and Jansen, 2015), in some Leguminosae genera (Dugas et al., 2015), and in Lamprocapnos spectabilis (Papaveraceae) (Park S. et al., 2018). Multiple instances of IR expansion and/or contraction occurred during land plant evolution, with movement of entire genes from the SC regions into the IR or vice-versa (Zhu et al., 2016). The terminal IR gene adjacent to the SSC region is usually more conserved across land plants, however the IR/LSC boundary has changed more dynamically during the evolution of plant lineages (Raubeson et al., 2007; Wang et al., 2008; Dong et al., 2013; Zhu et al., 2016). While most shifts are small, others have expanded or contracted the IR by several kb, resulting in gene gains or losses as a consequence of the relocation of genes into or out of the IR (Goulding et al., 1996; Chumley et al., 2006; Wang et al., 2008; Sun et al., 2013; Zhu et al., 2016; Firetti et al., 2017; Park S. et al., 2018). Notable examples of size variation in the IRs due to boundary shifts are found, for example, in Monsonia speciosa (7 kb) (Guisinger et al., 2011), Lamprocapnos spectabilis (51 kb) (Park S. et al., 2018), and Pelargonium transvaalense (88 kb) (Chumley et al., 2006), though the angiosperm IR is typically 25 kb (Park S. et al., 2018). IR expansions and contractions often result in variation of genome size among different plant groups and are important for plastome evolution (Kim and Lee, 2005; Wang et al., 2008; Asaf et al., 2016; Dong et al., 2016; Yang et al., 2016; Zhang et al., 2016; Zhu et al., 2016; Xu et al., 2017; Li and Zheng, 2018).
The different patterns observed in the Amphilophium plastomes in terms of LSC/IR and IR/SSC boundaries, number of duplicated genes, and genome sizes are mostly shared among taxa that belong to the same clade (Thode et al., 2019). Anemopaegma, used here as outgroup, showed a plastome structure that is similar to that found in A. steyermarkii (Figures 1, 2). Nonetheless, Anemopaegma is not necessarily the closest relative of Amphilophium, as the genus is sister to a clade comprising Anemopaegma Mart. ex Meisn., Bignonia L., Mansoa DC, and Pyrostegia C. Presl (Lohmann, 2006; Lohmann et al., 2013). A larger sampling within Amphilophium is necessary to further investigate the evolution of plastomes within the genus. Broader scale studies within tribe Bignonieae as a whole would certainly provide novel insights into the high diversity found in the structure, composition, and organization of plastomes in Adenocalymma (Fonseca and Lohmann, 2017), Amphilophium (this study), Anemopaegma (Firetti et al., 2017), and Tanaecium (Nazareno et al., 2015).
While the conservation of plastome structure and low levels of nucleotide diversity have been observed in several groups (Odintsova and Yurina, 2003; Wicke et al., 2011; Cai et al., 2015; Smith and Keeling, 2015; Reginato et al., 2016), our results show that plastomes may be variable within closely related lineages. Plastome rearrangements, differences in structure, size, gene content, and order were documented in many other angiosperm groups (Goulding et al., 1996; Chumley et al., 2006; Raubeson et al., 2007; Haberle et al., 2008; Wang et al., 2008; Guisinger et al., 2011; Dong et al., 2013; Weng et al., 2014; Zhu et al., 2016; Firetti et al., 2017; Fonseca and Lohmann, 2017; Park S. et al., 2018). Altogether, these results bring new insights into the evolution of plastomes, suggesting that plastomes may be highly conserved or highly variable in different plant groups. The analyses of complete Bignonieae plastomes indicate that genomes are variable at both the genus and species level within this tribe (Nazareno et al., 2015; Firetti et al., 2017; Fonseca and Lohmann, 2017).
Variable Regions
The rpoA, clpP, rps11, accD, rps12_5end/clpP, petD, trnN-GUU/ycf1, rpl32/trnL-UAG, rpl36, ycf1, rps18, matK/rps16, and ycf2 are identified as hypervariable loci at the species level within Amphilophium (Figures 3, 4). Furthermore, the rpoA gene shows the highest percentage of variable sites (25.6%) and the highest π value (0.06292) within Amphilophium plastomes. The rpoA gene does not show variability among members of Clade 5 though (i.e., A. paniculatum, A. pilosum, and A. ecuadorense), showing identical sequences in all taxa from this clade (Figure 3). Apart from encoding the subunits of one of the key chloroplast enzymes involved in tRNA and mRNA synthesis, the RNA polymerase type I (plastid-encoded polymerase, PEP), and the rpo genes (rpoA, rpoB, rpoC1, and rpoC2) are relatively rapidly evolving regions (Little and Hallick, 1988; Krawczyk and Sawicki, 2013). As a result, the rpo genes have been used in phylogeny reconstruction, with the rpoC1 and rpoB genes representing DNA barcodes for land plants (Petersen and Seberg, 1997; Chase et al., 2007; Krawczyk and Sawicki, 2013). Similarly, to other angiosperm genera (Dugas et al., 2015), the clpP gene is also hypervariable within Amphilophium plastomes. More specifically, the clpP gene includes a loss of the clpP intron1 in Inga (Leguminosae), and accelerated rates of evolution in clpP in Acacia and Inga (Leguminosae) (Dugas et al., 2015), in Sileneae (Caryophyllaceae) (Sloan et al., 2014), and Lamprocapnos spectabilis (Papaveraceae) (Park S. et al., 2018). In terms of the number of variable sites (not considering sequence length), ycf1 is the coding region with the highest number of variable sites within Amphilophium (346), followed by rpoA (281). The ycf1 gene was also shown to represent the most variable region within Anemopaegma (Firetti et al., 2017), with 25.6% of variable sites. However, the ycf1 gene shows only 5.5% of variable sites within Amphilophium. The relatively high divergence observed in the ycf1, matK, rbcL, and accD genes within Amphilophium plastomes is similar to that observed in plastomes of other angiosperms (Yukawa et al., 2006; Nie et al., 2012; Liu et al., 2013; Li and Zheng, 2018; Park S. et al., 2018; Zhao et al., 2018). Among the most divergent noncoding regions within Amphilophium plastomes, some were shown in previous studies to be highly variable and of high phylogenetic utility, i.e., trnH-GUG/psbA, ndhF/rpl32, rpl32/trnL-UAG (Shaw et al., 2005, 2007; Figures 3, 4). Three of the five introns and intergenic spacers selected as the most adequate markers for species level phylogenetics within the “Adenocalymma-Neojobertia” clade (Fonseca and Lohmann, 2017) are also variable within Amphilophium (i.e., ndhA intron, clpP intron 1, and rpl32-trnL). The remaining two markers (i.e., petN/psbM and trnG intron) selected for species-level phylogeny reconstruction within the “Adenocalymma-Neojobertia” clade (Fonseca and Lohmann, 2017), do not show significant sequence variation with Amphilophium, when compared to other regions (Figures 3, 4 and Supplementary Table S2).
Signature of Positive Selection on Plastid Genes
Our study shows that among the 78 protein-coding genes within Amphilophium, 16 are significantly under positive selection (ω > 1) (i.e., ycf1, ycf2, rpoA, accD, rps18, rps7, ycf4, clpP, rbcL, rpoC1, rps2, rpoC2, infA, atpA, rps8, and rps16). Three of these genes (namely ycf1, accD, and rbcL) have been reported to be putatively under positive selection in Brassicaceae out of 10 genes identified with ω > 1 for the family (Hu et al., 2015). Within six species of Ipomoea, the genes accD, cemA, and ycf2 were under positive selection (Park I. et al., 2018). Within eight Anemopaegma, on the other hand, four genes (i.e., atpB, ndhA, petA, and psaB) out of 70 protein-coding genes were shown to be under positive selection (Firetti et al., 2017). Positive selection on the clpP gene has been also observed in Geranium (Park et al., 2017), legume (Dugas et al., 2015), Silene (Erixon and Oxelman, 2008), and Lamprocapnos (Park S. et al., 2018) species. The chloroplast genes ndhF and matK also showed positive selection in previous studies. The matK gene is often used in phylogenetic studies (Carbonell-Caballero et al., 2015; Daniell et al., 2016) and showed to be positively selected in more than 30 plant groups, suggesting that this gene is subject to distinct ecological selective pressures (Chen and Xiao, 2010; Daniell et al., 2016). The positive selection signatures found on a high number of plastid genes within Amphilophium, suggest that these genes might be undergoing adaptative evolution in response to the environment (Kimura, 1989; Hu et al., 2015; Raman and Park, 2016; Ivanova et al., 2017). These results might be also associated with the remarkable morphological and ecological variation found among members of the genus. Amphilophium species show extremely diverse flower morphologies, occur in various environments, and show significant variation in diversification rates (Thode et al., 2019). Nonetheless, while plastid genes have been suggested to show signatures of positive selection (e.g., Erixon and Oxelman, 2008; Chen and Xiao, 2010; Carbonell-Caballero et al., 2015; Dugas et al., 2015; Hu et al., 2015; Daniell et al., 2016; Firetti et al., 2017; Park et al., 2017; Park I. et al., 2018), further studies that integrate field experiments, physiology, and molecular evolutionary biology are needed to understand this topic and the significance of adaptative evolution in plastid genes (Bock et al., 2014). Plastomes are shaped by the selective forces that act on the fundamental cellular functions that they code for and are, thus, expected to display signatures of the adaptive path undertaken by different plant species during evolution (Hu et al., 2015). Understanding the patterns of adaptation and divergence among the representatives of specific phylogenetic clades may provide important insights about the forces driving evolution (Wicke et al., 2014; Hu et al., 2015).
SSRs in Amphilophium Plastomes
Single Sequence Repeats (SSRs) are repeats of 1–6 bp frequently observed in plastomes that are important markers for evolutionary studies, population genetics, and for the study of genome polymorphisms (Avise, 1994; Ebert and Peakall, 2009; Qi et al., 2016; Yu et al., 2017). In this study, the number of SSRs found within Amphilophium plastomes ranged from 44 to 57, while 42 SSRs are documented in Anemopaegma prostratum. These results are similar to the 36–47 SSRs documented previously for Anemopaegma plastomes (Firetti et al., 2017), but significantly lower than the 347 chloroplast SSRs found for Tanaecium tetragonolobum (Nazareno et al., 2015). In these two studies (Nazareno et al., 2015; Firetti et al., 2017), the SSRs were identified with a less stringent threshold than the one used here (i.e., seven to mononucleotide repeats, four to di- and three to, tri-, tetra-, penta-, and hexa-). As in Anemopaegma and Tanaecium, mononucleotide repeats are the most common SSRs found in noncoding regions of Amphilophium plastomes. Most SSRs contain A or T motifs, contributing to the overall plastome AT richness (Qian et al., 2013; Cauz-Santos et al., 2017; Park et al., 2017; Li and Zheng, 2018). The largest amount of SSRs is located in the LSC. These SSRs will be useful for future population genetic studies involving Amphilophium (Figures 5A–C). Dispersed repeats represent a major component of plastomes and influence genome structure in terms of genome size, genome recombination and rearrangements, and gene duplication (Cavalier-Smith, 2002; Nie et al., 2012). In this study, the number of repeats in Amphilophium plastomes found by REPuter range from 38 to 56, with 50 repeats being found in Anemopaegma prostratum. This finding was similar in Tanaecium tetragonolobum, which included 47 repeats (Nazareno et al., 2015), but different to eight other Anemopaegma species studied that showed between 88 and 169 dispersed repetitive sequences, the highest number documented within Lamiales to date (Firetti et al., 2017). Most repeat sequences within Amphilophium are 30–39 bp long, except from the repeats found in A. carolinae, A. dolichoides, and A. steyermarkii (Figure 5D). These three species show multiple repeats with 40–49 bp and the largest number of repeats >80 bp. Most dispersed repetitive sequences are found in noncoding regions (Figure 5F).
Conclusion and Future Directions
The comparative analyses involving 11 Amphilophium plastomes and the plastome of Anemopaegma prostratum provided important new insights into Bignoniaceae plastome structure and evolution. Within Amphilophium, plastomes show different boundaries between the IR/SC regions, lengths, and number of duplicated genes in the IRs as well as high nucleotide variability and signature of positive selection. Our results show that plastomes may be highly variable, even at low taxonomic levels, indicating that differences in plastome structure, gene content, and nucleotide diversity vary among different plant groups. A larger sampling of taxa, including complete plastomes for a higher number of representatives of Amphilophium and other genera of tribe Bignonieae is necessary to further investigate the evolution of plastome structure in the genus and in the tribe as a whole.
Author Contributions
Both authors designed the study, defined sampling and obtained samples, interpreted the results and co-wrote the manuscript. VT conducted the molecular work, assembled Illumina sequences, annotated plastomes, and performed analyses.
Funding
This research was supported by a postdoctoral fellowship from the Fundação de Amparo à Pesquisa do Estado de São Paulo (FAPESP) to VT (2013/11706-1), a regular FAPESP research grant to LL (2011/50859-2), and a collaborative Dimensions of Biodiversity-NSF/Biota-FAPESP grant to LL (2012/50260-6). Additional funds were provided by the Conselho Nacional de Desenvolvimento Científico e Tecnológico (CNPq) through a Pq-1B grant to LL (310871/2017-4) and the Coordenação de Aperfeiçoamento de Pessoal de Nível Superior (CAPES).
Conflict of Interest Statement
The authors declare that the research was conducted in the absence of any commercial or financial relationships that could be construed as a potential conflict of interest.
Acknowledgments
We thank Michael McKain for help with the plastome assembly pipeline and CEFAP-GENIAL-USP (Universidade de São Paulo, Brazil) for computational resources.
Supplementary Material
The Supplementary Material for this article can be found online at: https://www.frontiersin.org/articles/10.3389/fpls.2019.00796/full#supplementary-material
Footnotes
- ^ http://bitbucket.org/afinit/afin/
- ^ https://irscope.shinyapps.io/irapp/
- ^ http://wolfe.gen.tcd.ie/GenomeVx
References
Alcantara, S., and Lohmann, L. G. (2010). Evolution of floral morphology and pollination system in Bignonieae (Bignoniaceae). Am. J. Bot. 97, 782–796. doi: 10.3732/ajb.0900182
Altschul, S. F., Gish, W., Miller, W., Myers, E. W., and Lipman, D. J. (1990). Basic local alignment search tool. J. Mol. Biol. 215, 403–410.
Altschul, S. F., Madden, T. L., Schäffer, A. A., Zhang, J., Zhang, Z., Miller, W., et al. (1997). Gapped BLAST and PSI-BLAST: a new generation of protein database search programs. Nucleic Acids Res. 25, 3389–3402.
Amiryousefi, A., Hyvönen, J., and Poczai, P. (2018). IRscope: an online program to visualize the junction sites of chloroplast genomes. Bioinformatics 34, 3030–3031. doi: 10.1093/bioinformatics/bty220
Asaf, S., Khan, A. L., Khan, A. R., Waqas, M., Kang, S. M., Khan, M. A., et al. (2016). Complete chloroplast genome of Nicotiana otophora and its comparison with related species. Front. Plant Sci. 7:843. doi: 10.3389/fpls.2016.00843
Beier, S., Thiel, T., Münch, T., Scholz, U., and Mascher, M. (2017). MISA-web: a web server for microsatellite prediction. Bioinformatics 33, 2583–2585. doi: 10.1093/bioinformatics/btx198
Bock, D. G., Andrew, R. L., and Rieseberg, L. H. (2014). On the adaptive value of cytoplasmic genomes in plants. Mol. Ecol. 23, 4899–4911. doi: 10.1111/mec.12920
Brudno, M., Malde, S., Poliakov, A., Do, C. B., Couronne, O., Dubchak, I., et al. (2003). Glocal alignment: finding rearrangements during alignment. Bioinformatics 19, i54–i62. doi: 10.1093/bioinformatics/btg1005
Cai, J., Ma, P. F., Li, H. T., and Li, D. Z. (2015). Complete plastid genome sequencing of four Tilia species (Malvaceae): a comparative analysis and phylogenetic implications. PLoS One 10:e0142705. doi: 10.1371/journal.pone.0142705
Carbonell-Caballero, J., Alonso, R., Ibañez, V., Terol, J., Talon, M., and Dopazo, J. (2015). A phylogenetic analysis of 34 chloroplast genomes elucidates the relationships between wild and domestic species within the genus Citrus. Mol. Biol. Evol. 32, 2015–2035. doi: 10.1093/molbev/msv082
Cauz-Santos, L. A., Munhoz, C. F., Rodde, N., Cauet, S., Santos, A. A., Penha, H. A., et al. (2017). The chloroplast genome of Passiflora edulis (Passifloraceae) assembled from long sequence reads: structural organization and phylogenomic studies in Malpighiales. Front. Plant Sci. 8:334. doi: 10.3389/fpls.2017.00334
Cavalier-Smith, T. (2002). Chloroplast evolution: secondary symbiogenesis and multiple losses. Curr. Biol. 12, R62–R64.
Chase, M. W., Cowan, R. S., Hollingsworth, P. M., van den Berg, C., Madrinìán, S., Petersen, G., et al. (2007). A proposal for a standardised protocol to barcode all land plants. Taxon 56, 295–299. doi: 10.1073/pnas.0905845106
Chen, S. L., and Xiao, P. G. (2010). Molecular evolution and positive Darwinian selection of the chloroplast maturase matK. J. Plant. Res 123, 241–247. doi: 10.1007/s10265-009-0261-265
Chumley, T. W., Palmer, J. D., Mower, J. P., Fourcade, H. M., Calie, P. J., Boore, J. L., et al. (2006). The complete chloroplast genome sequence of Pelargonium x hortorum: organization and evolution of the largest and most highly rearranged chloroplast genome of land plants. Mol. Biol. Evol. 23, 2175–2190.
Daniell, H., Lin, C. S., Yu, M., and Chang, W. J. (2016). Chloroplast genomes: diversity, evolution, and applications in genetic engineering. Genome Biol. 17, 134. doi: 10.1186/s13059-016-1004-2
Darling, A. E., Mau, B., and Perna, N. T. (2010). progressiveMauve: multiple genome alignment with gene gain, loss and rearrangement. PLoS One 5:e11147. doi: 10.1371/journal.pone.0011147
Dong, W., Xu, C., Cheng, T., and Zhou, S. (2013). Complete chloroplast genome of Sedum sarmentosum and chloroplast genome evolution in Saxifragales. PLoS One 8:e77965. doi: 10.1371/journal.pone.0077965
Dong, W. P., Xu, C., Li, D. L., Jin, X. B., Lu, Q., and Suo, Z. L. (2016). Comparative analysis of the complete chloroplast genome sequences in psammophytic Haloxylon species (Amaranthaceae). Peer J. 4:e2699. doi: 10.7717/peerj.2699
Downie, S. R., and Jansen, R. K. (2015). A comparative analysis of whole plastid genomes from the Apiales: expansion and contraction of the inverted repeat, mitochondrial to plastid transfer of DNA, and identification of highly divergent non-coding regions. Syst. Bot. 40, 336–351. doi: 10.1600/036364415X686620
Dugas, D. V., Hernadez, D., Koenen, E. J. M., Schwartz, E., Straub, S., Hughes, C. E., et al. (2015). Mimosoid legume plastome evolution: IR expansion, tandem repeat expansions, and accelerated rate of evolution in clpP. Sci. Rep. 5:16958. doi: 10.1038/srep16958
Ebert, D., and Peakall, R. (2009). Chloroplast simple sequence repeats (cpSSRs): technical resources and recommendations for expanding cpSSR discovery and applications to a wide array of plant species. Mol. Ecol. Resour. 9, 673–690. doi: 10.1111/j.1755-0998.2008.02319.x
Edgar, R. C. (2004). MUSCLE: multiple sequence alignment with high accuracy and high throughput. Nucleic Acids Res 32, 1792–1797.
Erixon, P., and Oxelman, B. (2008). Whole-gene positive selection, elevated synonymous substitution rates, duplication & indel evolution of the chloroplast clpP1 gene. PLoS One 3:e1386. doi: 10.1371/journal.pone.0001386
Firetti, F., Zuntini, A. R., Gaiarsa, J. W., Oliveira, R. S., Lohmann, L. G., and Van Sluys, M.-A. (2017). Complete chloroplast genome sequences contribute to plant species delimitation: a case study of the Anemopaegma species complex. Am. J. Bot. 104, 1493–1509. doi: 10.3732/ajb.1700302
Fonseca, L. H. M., and Lohmann, L. G. (2017). Plastome rearrangements in the “Adenocalymma-Neojobertia” Clade (Bignonieae, Bignoniaceae) and its phylogenetic implications. Front. Plant Sci. 8:1875. doi: 10.3389/fpls.2017.01875
Frazer, K. A., Pachter, L., Poliakov, A., Rubin, E. M., and Dubchak, I. (2004). VISTA: computational tools for comparative genomics. Nucleic Acids Res. 32, W273–W279.
Gentry, A. H. (1973). Flora of Panama: Family 172, Bignoniaceae. Ann. Missouri Bot. Gard. 60, 781–977.
Goulding, S. E., Olmstead, R. G., Morden, C. W., and Wolfe, K. H. (1996). Ebb and flow of the chloroplast inverted repeat. Mol. Gen. Genet. 252, 195–206.
Guisinger, M. M., Kuehl, J. V., Boore, J. L., and Jansen, R. K. (2011). Extreme reconfiguration of plastid genomes in the angiosperm family Geraniaceae: rearrangements, repeats, and codon usage. Mol. Biol. Evol. 28, 583–600. doi: 10.1093/molbev/msq229
Haberle, R. C., Fourcade, H. M., Boore, J. L., and Jansen, R. K. (2008). Extensive rearrangements in the chloroplast genome of Trachelium caeruleum are associated with repeats and tRNA genes. J. Mol. Evol. 66, 350–361. doi: 10.1007/s00239-008-9086-4
Hu, S., Sablok, G., Wang, B., Qu, D., Barbaro, E., Viola, R., et al. (2015). Plastome organization and evolution of chloroplast genes in Cardamine species adapted to contrasting habitats. BMC Genomics 16:306. doi: 10.1186/s12864-015-1498-0
Ivanova, Z., Sablok, G., Daskalova, E., Zahmanova, G., Apostolova, E., Yahubyan, G., et al. (2017). Chloroplast genome analysis of resurrection tertiary relict Haberlea rhodopensis highlights genes important for desiccation stress response. Front. Plant Sci. 8:204. doi: 10.3389/fpls.2017.00204
Jansen, R. K., and Ruhlman, T. A. (2012). “Plastid genomes of seed plants,” in Genomics of Chloroplasts and Mitochondria: Advances in Photosynthesis and Respiration (Including Bioenergy and Related Processes), Vol. 35, eds R. Bock and V. Knoop (Dordrecht: Springer).
Katoh, K., Misawa, K., Kuma, K., and Miyata, T. (2002). MAFFT: a novel method for rapid multiple sequence alignment based on fast Fourier transform. Nucleic Acids Res. 30, 3059–3066. doi: 10.1093/nar/gkf436
Katoh, K., and Standley, D. M. (2013). MAFFT multiple sequence alignment software version 7: improvements in performance and usability. Mol. Biol. Evol. 30, 772–780. doi: 10.1093/molbev/mst010
Kearse, M., Moir, R., Wilson, A., Stones-Havas, S., Cheung, M., Sturrock, S., et al. (2012). Geneious Basic: an integrated and extendable desktop software platform for the organization and analysis of sequence data. Bioinformatics 28, 1647–1649. doi: 10.1093/bioinformatics/bts199
Kim, K. J., and Lee, H. L. (2005). Wide spread occurrence of small inversions in the chloroplast genomes of land plants. Mol. Cell 19, 104–113.
Kimura, M. (1989). The neutral theory of molecular evolution and the world view of the neutralists. Genome 31, 24–31. doi: 10.1139/g89-009
Krawczyk, K., and Sawicki, J. (2013). The uneven rate of the molecular evolution of gene sequences of DNA-dependent RNA polymerase I of the genus Lamium L. Int. J. Mol. Sci. 14, 11376–11391. doi: 10.3390/ijms140611376
Kumar, S., Stecher, G., and Tamura, K. (2016). MEGA7: Molecular evolutionary genetics analysis version 7.0 for bigger datasets. Mol. Biol. Evol. 33, 1870–1874. doi: 10.1093/molbev/msw054
Kurtz, S., Choudhuri, J. V., Ohlebusch, E., Schleiermacher, C., Stoye, J., and Giegerich, R. (2001). REPuter: the manifold applications of repeat analysis on a genomic scale. Nucleic Acids Res. 29, 4633–4642. doi: 10.1093/nar/29.22.4633
Larkin, M. A., Blackshields, G., Brown, N. P., Chenna, R., McGettigan, P. A., McWilliam, H., et al. (2007). Clustal W and Clustal X Version 2.0. Bioinformatics 23, 2947–2948. doi: 10.1093/bioinformatics/btm404
Li, B., and Zheng, Y. (2018). Dynamic evolution and phylogenomic analysis of the chloroplast genome in Schisandraceae. Sci. Rep. 8:9285. doi: 10.1038/s41598-018-27453-7
Little, M. C., and Hallick, R. B. (1988). Chloroplast rpoA, rpoB, and rpoC genes specify at least three components of a chloroplast DNA-dependent RNA polymerase active in tRNA and mRNA transcription. J. Biol. Chem. 263, 14302–14307.
Liu, Y., Huo, N., Dong, L., Wang, Y., Zhang, S., Young, H. A., et al. (2013). Complete chloroplast genome sequences of Mongolia medicine Artemisia frigida and phylogenetic relationships with other plants. PLoS One 8:e57533. doi: 10.1371/journal.pone.0057533
Lohmann, L. G. (2006). Untangling the phylogeny of Neotropical lianas (Bignonieae, Bignoniaceae). Am. J. Bot. 93, 304–318. doi: 10.3732/ajb.93.2.304
Lohmann, L. G., Bell, C., Calió, M. F., and Winkworth, R. C. (2013). Pattern and timing of biogeographical history in the neotropical tribe Bignonieae (Bignoniaceae). Bot. J. Linn. Soc. 171, 154–170.
Lohmann, L. G., and Taylor, C. M. (2014). A new generic classification of tribe Bignonieae (Bignoniaceae). Ann. Missouri Bot. Gard. 99, 348–489. doi: 10.3417/2003187
Lohse, M., Drechsel, O., Kahlau, S., and Bock, R. (2013). OrganellarGenomeDRAW–a suite of tools for generating physical maps of plastid and mitochondrial genomes and visualizing expression data sets. Nucleic Acids Res. 41, W575–W581. doi: 10.1093/nar/gkt289
Moreira, P. A., Mariac, C., Scarcelli, N., Couderc, M., Rodrigues, D. P., Clement, C. R., et al. (2016). Chloroplast sequence of treegourd (Crescentia cujete, Bignoniaceae) to study phylogeography and domestication. Appl. Plant Sci. 4:1600048. doi: 10.3732/apps.1600048
Nazareno, A. G., Carlsen, M., and Lohmann, L. G. (2015). Complete chloroplast genome of Tanaecium tetragonolobum: the first Bignoniaceae plastome. PLoS One 10:e0129930. doi: 10.1371/journal.pone.0129930
Nie, X., Lv, S., Zhang, Y., Du, X., Wang, L., Biradar, S. S., et al. (2012). Complete chloroplast genome sequence of a major invasive species, crofton weed (Ageratina adenophora). PLoS One 7:e36869. doi: 10.1371/journal.pone.0036869
Nielsen, R., and Yang, Z. (1998). Likelihood models for detecting positively selected amino acid sites and applications to the HIV-1 envelope gene. Genetics 148, 929–993.
Odintsova, M. S., and Yurina, N. P. (2003). Plastid genomes of higher plants and algae: structure and function. Mol. Biol. 37, 649–662. doi: 10.1023/A:1026020623631
Olmstead, R. G., Zjhra, M. L., Lohmann, L. G., Grose, S. O., and Eckert, A. J. (2009). A molecular phylogeny and classification of the Bignoniaceae. Am. J. Bot. 96, 1731–1743. doi: 10.3732/ajb.0900004
Palmer, J. D. (1985). Comparative organization of chloroplast genomes. Annu. Rev. Genet. 19, 325–354. doi: 10.1146/annurev.ge.19.120185.001545
Paradis, E., and Schliep, K. (2018). ape 5.0: an environment for modern phylogenetics and evolutionary analyses in R. Bioinformatics 35, 526–528. doi: 10.1093/bioinformatics/bty633
Park, I., Yang, S., Kim, W. J., Noh, P., Lee, H. O., and Moon, B. C. (2018). The complete chloroplast genomes of six Ipomoea species and indel marker development for the discrimination of authentic Pharbitidis semen (seeds of I. nil or I. purpurea). Front. Plant Sci. 9:965. doi: 10.3389/fpls.2018.00965
Park, S., An, B., and Park, S. (2018). Reconfiguration of the plastid genome in Lamprocapnos spectabilis: IR boundary shifting, inversion & intraspecific variation. Sci. Rep. 8:13568. doi: 10.1038/s41598-018-31938-w
Park, S., Ruhlman, T. A., Weng, M. L., Hajrah, N. H., Sabir, J. S. M., Jansen, R. K., et al. (2017). Contrasting patterns of nucleotide substitution rates provide insight into dynamic evolution of plastid and mitochondrial genomes of Geranium. Genome Biol. Evol. 9, 1766–1780. doi: 10.1093/gbe/evx124
Petersen, G., and Seberg, O. (1997). Phylogenetic analysis of the Triticaceae (Poaceae) based on rpoA sequence data. Mol. Phyl. Evol. 7, 217–230.
Pool, A. (2007a). A review of the genus Distictis (Bignoniaceae). Ann. Missouri Bot. Gard. 94, 791–820. doi: 10.3417/0026-6493
Pool, A. (2007b). A revision of the genus Pithecoctenium (Bignoniaceae). Ann. Missouri Bot. Gard. 94, 622–642. doi: 10.3417/0026-6493
Pool, A. (2009). A revision of the genus Distictella (Bignoniaceae). Ann. Missouri Bot. Gard. 96, 286–323. doi: 10.3417/2006156
Qi, W., Lin, F., Liu, Y., Huang, B., Cheng, J., Zang, W., et al. (2016). High-throughput development of simple sequence repeat markers for genetic diversity research in Crambe abyssinica. BMC Plant Biol. 16:139. doi: 10.1186/s12870-016-0828-y
Qian, J., Song, J., Gao, H., Zhu, Y., Xu, J., Pang, X., et al. (2013). The complete chloroplast genome sequence of the medicinal plant Salvia miltiorrhiza. PLoS One 8:e57607. doi: 10.1371/journal.pone.0057607
R Development Core Team (2017). R: A Language and Environment for Statistical Computing. ISBN 3-900051-07-0. Available at: http://www.r-project.org (accessed December 2, 2018).
Raman, G., and Park, S. (2016). The complete chloroplast genome sequence of Ampelopsis: gene organization, comparative analysis, and phylogenetic relationships to other angiosperms. Front. Plant Sci. 7:341. doi: 10.3389/fpls.2016.00341
Raubeson, L. A., Peery, R., Chumley, T. W., Dziubek, C., Fourcade, H. M., Boore, J. L., et al. (2007). Comparative chloroplast genomics: analyses including new sequences from the angiosperms Nuphar advena and Ranunculus macranthus. BMC Genomics 8:174. doi: 10.1186/1471-2164-8-174
Reginato, M., Neubig, K. M., Majure, L. C., and Michelangeli, F. (2016). The first complete plastid genomes of Melastomataceae are highly structurally conserved. Peer J. 4:e2715. doi: 10.7717/peerj.2715
Rozas, J., Ferrer-Mata, A., Sánchez-Delbarrio, J. C., Guirao-Rico, S., Librado, P., Ramos-Onsins, S. E., et al. (2017). DnaSP v6: DNA sequence polymorphism analysis of large datasets. Mol. Biol. Evol. 34, 3299–3302. doi: 10.1093/molbev/msx248
Shaw, J., Lickey, E. B., Beck, J. T., Farmer, S. B., Liu, W., Miller, J., et al. (2005). The tortoise and the hare II: relative utility of 21 noncoding chloroplast DNA sequences for phylogenetic analysis. Am. J. Bot. 92, 142–166. doi: 10.3732/ajb.92.1.142
Shaw, J., Lickey, E. B., Schilling, E. E., and Small, R. L. (2007). Comparison of whole chloroplast genome sequences to choose noncoding regions for phylogenetic studies in angiosperms: the tortoise and the hare III. Am. J. Bot. 94, 275–288. doi: 10.3732/ajb.94.3.275
Sloan, D. B., Triant, D. A., Forrester, N. J., Bergner, L. M., Wu, M., and Taylor, D. R. (2014). A recurring syndrome of accelerated plastid genome evolution in the angiosperm tribe Sileneae (Caryophyllaceae). Mol. Phylogen. Evol. 72, 82–89. doi: 10.1016/j.ympev.2013.12.004
Smith, D. R., and Keeling, P. J. (2015). Mitochondrial and plastid genome architecture: reoccurring themes, but significant differences at the extremes. Proc. Natl. Acad. Sci. U.S.A. 112, 10177–10184. doi: 10.1073/pnas.1422049112
Sun, Y. X., Moore, M. J., Meng, A. P., Soltis, P. S., Soltis, D. E., Li, J. Q., et al. (2013). Complete plastid genome sequencing of Trochodendraceae reveals a significant expansion of the inverted repeat and suggests a paleogene divergence between the two extant species. PLoS One 8:e60429. doi: 10.1371/journal.pone.0060429
Thode, V. A., Sanmartín, I., and Lohmann, L. G. (2019). Contrasting patterns of diversification between Amazonian and Atlantic forest clades of Neotropical lianas (Amphilophium, Bignonieae) inferred from plastid genomic data. Mol. Phylogenet. Evol. 133, 92–106. doi: 10.1016/j.ympev.2018.12.021
Wang, R. J., Cheng, C. L., Chang, C. C., Wu, C. L., Su, T. M., and Chaw, S. M. (2008). Dynamics and evolution of the inverted repeat-large single copy junctions in the chloroplast genomes of monocots. BMC Evol. Biol. 8:36. doi: 10.1186/1471-2148-8-36
Weng, M. L., Blazier, J. C., Govindu, M., and Jansen, R. K. (2014). Reconstruction of the ancestral plastid genome in Geraniaceae reveals a correlation between genome rearrangements, repeats, and nucleotide substitution rates. Mol. Biol. Evol. 31, 645–659. doi: 10.1093/molbev/mst257
Wicke, S., Schäferhoff, B., Depamphilis, C. W., and Müller, K. F. (2014). Disproportional plastome-wide increase of substitution rates and relaxed purifying selection in genes of carnivorous Lentibulariaceae. Mol. Biol. Evol 31, 529–545. doi: 10.1093/molbev/mst261
Wicke, S., Schneeweiss, G. M., de Pamphilis, C. W., Müller, K. F., and Quandt, D. (2011). The evolution of the plastid chromosome in land plants: gene content, gene order, gene function. Plant Mol. Bio 76, 273–297. doi: 10.1007/s11103-011-9762-4
Wyman, S. K., Jansen, R. K., and Boore, J. L. (2004). Automatic annotation of organellar genomes with DOGMA. Bioinformatics 20, 3252–3255. doi: 10.1093/bioinformatics/bth352
Xu, C., Dong, W., Li, W., Lu, Y., Xie, X., Jin, X., et al. (2017). Comparative analysis of six Lagerstroemia complete chloroplast genomes. Front. Plant Sci. 8:15. doi: 10.3389/fpls.2017.00015
Yang, Y., Zhou, T., Duan, D., Yang, J., Feng, L., and Zhao, G. (2016). Comparative analysis of the complete chloroplast genomes of five Quercus species. Front. Plant Sci. 7:959. doi: 10.3389/fpls.2016.00959
Yang, Z. (2007). PAML 4: phylogenetic analysis by maximum likelihood. Mol. Biol. Evol. 24, 1586–1591. doi: 10.1093/molbev/msm088
Yu, J., Dossa, K., Wang, L., Zhang, Y., Wei, X., Liao, B., et al. (2017). PMDBase: a database for studying microsatellite DNA and marker development in plants. Nucleic Acids Res. 45, D1046–D1053. doi: 10.1093/nar/gkw906
Yukawa, M., Tsudzuki, T., and Sugiura, M. (2006). The chloroplast genome of Nicotiana sylvestris and Nicotiana tomentosiformis: complete sequencing confirms that the Nicotiana sylvestris progenitor is the maternal genome donor of Nicotiana tabacum. Mol. Genet. Genomics 275, 367–373. doi: 10.1007/s00438-005-0092-6
Zhang, Y., Du, L., Liu, A., Chen, J., Wu, L., Hu, W., et al. (2016). The complete chloroplast genome sequences of five Epimedium species: lights into phylogenetic and taxonomic analyses. Front. Plant Sci. 7:306. doi: 10.3389/fpls.2016.00306
Zhao, M.-L., Song, Y., Ni, J., Yao, X., Tan, Y.-H., and Xu, Z.-F. (2018). Comparative chloroplast genomics and phylogenetics of nine Lindera species (Lauraceae). Sci. Rep. 8:8844. doi: 10.1038/s41598-018-27090-0
Zhao, Y., Yin, J., Guo, H., Zhang, Y., Xiao, W., Sun, C., et al. (2015). The complete chloroplast genome provides insight into the evolution and polymorphism of Panax ginseng. Front. Plant Sci. 5:696. doi: 10.3389/fpls.2014.00696
Keywords: chloroplast genome, comparative genomics, neotropical lianas, NGS, plastome, species-level plastome evolution
Citation: Thode VA and Lohmann LG (2019) Comparative Chloroplast Genomics at Low Taxonomic Levels: A Case Study Using Amphilophium (Bignonieae, Bignoniaceae). Front. Plant Sci. 10:796. doi: 10.3389/fpls.2019.00796
Received: 07 February 2019; Accepted: 03 June 2019;
Published: 19 June 2019.
Edited by:
Thomas L. P. Couvreur, IRD UMR232 Diversité, Adaptation, Développement des Plantes (DIADE), FranceReviewed by:
Jan Hackel, Royal Botanic Gardens, United KingdomPaul G. Wolf, Utah State University, United States
Copyright © 2019 Thode and Lohmann. This is an open-access article distributed under the terms of the Creative Commons Attribution License (CC BY). The use, distribution or reproduction in other forums is permitted, provided the original author(s) and the copyright owner(s) are credited and that the original publication in this journal is cited, in accordance with accepted academic practice. No use, distribution or reproduction is permitted which does not comply with these terms.
*Correspondence: Verônica A. Thode, dmVyb25pY2F0aG9kZUBob3RtYWlsLmNvbQ==; Lúcia G. Lohmann, bGxvaG1hbm5AdXNwLmJy