 Yuan Liu1
 Evan Salsman1
 Jason D. Fiedler2Justin B. Hegstad1
 Andrew Green1
 Mohamed Mergoum3
 Shaobin Zhong4*
 Xuehui Li1*
- 1Department of Plant Sciences, North Dakota State University, Fargo, ND, United States
- 2Biosciences Research Laboratory, USDA-ARS Genotyping Laboratory, Fargo, ND, United States
- 3Department of Crop and Soil Sciences, University of Georgia, Griffin, GA, United States
- 4Department of Plant Pathology, North Dakota State University, Fargo, ND, United States
Fusarium head blight (FHB) is one of the most destructive diseases in wheat worldwide. Breeding for FHB resistance is hampered by its complex genetic architecture, large genotype by environment interaction, and high cost of phenotype screening. Genomic selection (GS) is a powerful tool to enhance improvement of complex traits such as FHB resistance. The objectives of this study were to (1) investigate the genetic architecture of FHB resistance in a North Dakota State University (NDSU) hard red spring wheat breeding population, (2) test if the major QTL Fhb1 and Fhb5 play an important role in this breeding population; and (3) assess the potential of GS to enhance breeding efficiency of FHB resistance. A total of 439 elite spring wheat breeding lines from six breeding cycles were genotyped using genotyping-by-sequencing (GBS) and 102,147 SNP markers were obtained. Evaluation of FHB severity was conducted in 10 unbalanced field trials across multiple years and locations. One QTL for FHB resistance was identified and located on chromosome arm 1AL, explaining 5.3% of total phenotypic variation. The major type II resistance QTL Fhb1 only explained 3.1% of total phenotypic variation and the QTL Fhb5 was not significantly associated with FHB resistance in this breeding population. Our results suggest that integration of many genes with medium/minor effects in this breeding population should provide stable FHB resistance. Genomic prediction accuracies of 0.22–0.44 were obtained when predicting over breeding cycles in this study, indicating the potential of GS to enhance the improvement of FHB resistance.
Introduction
Fusarium head blight (FHB) is one of the most destructive diseases of wheat worldwide. The disease is caused by Fusarium species and can lead to severe grain yield and quality loss. HRSW is a major class of wheat and is used for the finest baked goods owing to its high protein content and superior gluten quality. In the United States, HRSW is annually planted on over 13 million acres, primarily in the Northern Great Plains. FHB epidemics in HRSW producing areas of the US in the early 1990s resulted in devastating economic losses (Wilcoxson et al., 1992; McMullen et al., 1997) and the disease still frequently threatens wheat production in this region. Controlling FHB through agronomic practices such as crop rotation is challenging due to the wide host range of the Fusarium species. Fungicidal control is effective only in a narrow operative window. Therefore, developing FHB resistant cultivars is crucial to prevent the destruction caused by this disease.
Fusarium head blight resistance exhibits quantitative variation, suggesting complex genetic architecture. Most public wheat breeding programs in the US rely on phenotypic selection for FHB resistance using field nurseries to evaluate breeding materials. However, disease infection and development is highly dependent on environmental conditions at flowering and early kernel development stages, making effective phenotypic evaluation and selection difficult. In addition, phenotypic evaluation of FHB resistance is time-consuming and demands extensive labor and resources in multiple environment trials, limiting the number of breeding lines that can be evaluated in each breeding cycle. MAS of major QTL could enhance selection efficiency for FHB resistance (Anderson, 2007; Buerstmayr et al., 2009). From previous bi-parental QTL mapping studies, hundreds of QTL for FHB resistance have been identified on all 21 wheat chromosomes (Buerstmayr et al., 2009; Löffler et al., 2009). In previous studies, few QTL were identified for type I resistance (against initial infection of the pathogen) as most previous studies focused on type II resistance (against spread of the pathogen) (Buerstmayr et al., 2009). Many QTL were commonly identified from multiple populations (Liu et al., 2009; Löffler et al., 2009), of which major QTL like Fhb1 (Bai et al., 1999; Waldron et al., 1999; Anderson et al., 2001; Liu et al., 2006; Rawat et al., 2016; Su et al., 2018), Fhb2 (Cuthbert et al., 2007; Jia et al., 2018), Fhb4 (Xue et al., 2010; Jia et al., 2018), and Fhb5 (Xue et al., 2011; Jia et al., 2018) were finely mapped and/or characterized. The most stable type II resistance QTL Fhb1 can reduce disease severity by 20–25% on average, depending on the genetic background (Pumphrey et al., 2007), and has been widely integrated into wheat breeding populations through MAS (Anderson, 2007; Buerstmayr et al., 2009; Steiner et al., 2017). However, utilization of other QTL for MAS in wheat breeding has been scarce, due to lack of diagnostic markers or pending validation.
Genome wide association studies (GWAS) enable genetic mapping to be performed in a breeding population, and the identified markers can be used for MAS directly (Pozniak et al., 2012; Wang et al., 2012). Advances in genome sequencing and high-throughput genotyping have facilitated GWAS in wheat, a polyploid species of large genome size (Poland et al., 2012; Wang et al., 2014; Allen et al., 2017; International Wheat Genome Sequencing Consortium [IWGSC], 2018). Numerous GWAS have been conducted for FHB resistance in wheat and confirm its complex genetic architecture (Mirdita et al., 2015b; Arruda et al., 2016a; Wang et al., 2017). Arruda et al. (2016a) performed GWAS for FHB resistance using 273 winter wheat breeding lines from the Midwest and Eastern US, and found that Fhb1 explained only 8% of phenotypic variation. GWAS using a large panel of elite inbred lines from central European winter wheat found no QTL with large effect, despite broad genetic variation (Mirdita et al., 2015b). Taken together, these observations confirm that many genes with medium or small effects contribute to FHB resistance along with the few well-characterized major QTL.
A simulation study suggested that GS was more efficient for the improvement of complex traits compared to MAS (Meuwissen et al., 2001). In GS, genome wide markers are used to predict breeding values, which are consequently used for selection. Empirical experiments found that prediction ability of FHB resistance using genome wide markers was better than using statistically significant markers only (Jiang et al., 2015; Mirdita et al., 2015a; Arruda et al., 2016b). Several GS studies suggested that GS is promising to enhance FHB resistance improvement in wheat (Rutkoski et al., 2012; Mirdita et al., 2015a; Jiang et al., 2017; Herter et al., 2019a,b).
Diverse resistance donors like Sumai 3, Frontana, etc. have been used for the improvement of FHB resistance in wheat breeding programs including the NDSU HRSW breeding program. Well-characterized major QTL like Fhb1 and Fhb5 have been integrated into the breeding pools. The objectives of this study are to (1) investigate genetic architecture of FHB resistance in this breeding population; (2) test if the major QTL Fhb1 and Fhb5 play an important role in this population; and (3) assess potential of GS for FHB resistance enhancement in the NDSU HRSW breeding program.
Materials and Methods
Plant Materials and Evaluation of FHB Severity
In total, 427 F9 breeding lines from 2011-16 advanced yield trials (AYTs) of the NDSU HRSW breeding program, representing six breeding cycles, and 15 check cultivars were evaluated for FHB resistance from 2011 to 2016 (Supplementary Table S1). Each year, a subset of breeding lines from one breeding cycle was evaluated at two locations, Langdon and Prosper, ND. However, the trials from 2013 Prosper and 2016 Langdon were not used because of poor quality of the phenotypic data. Therefore, the 427 breeding lines were actually tested in an unbalanced experiment including 10 trials across 6 years (Supplementary Table S1). The 15 check cultivars were ND2398, ND2710, Barlow, Bolles, Elgin-ND, Faller, Glenn, Howard, ND817, Prosper, RB07, Steele-ND, SY Soren, and Velva. The checks ND2398, ND2710, Barlow, Faller, Glenn, and Prosper were evaluated at all 10 trials at the two locations from 2011 to 2016. In each trial, the experimental design was a randomized complete block design with two replicates. In the field experiment, each line was planted in a hill plot with 15 seeds. Spawn corn kernels were prepared as inoculum. To prepare inoculum, autoclaved corn kernels were infected with a mixture of spores produced separately from 20 F. graminearum strains, including ten 3ADON (3-acetyl deoxynivalenol) producers and ten 15ADON (15-acetyl deoxynivalenol) producers, collected from fields in North Dakota (Puri and Zhong, 2010), according to the procedure described by Zhang et al. (2008). The spawn corn kernels were applied to the FHB nurseries at a rate of approximately 0.20 kg/m2 starting at the boot stage, and repeated every 2 weeks until all wheat accessions completed anthesis. The nurseries were overhead misted for 5 min in 15-min intervals for 12 h daily (4:00 p.m. to 4:00 a.m.), until 14 days after anthesis of the latest lines. Eight to twenty spikes from each hill plot were visually scored at 21 days post anthesis using a visual scale (0, 7, 14, 21, 33, 50, 66, 75, 90, and 100, all in percentage) (Stack and McMullen, 1995). Disease severity was calculated as the average percentage of infected spikelets.
Molecular Marker Genotyping
The 427 elite breeding lines and 12 of the 15 check cultivars were genotyped using GBS. DNA was isolated with the Wizard Genomic DNA Purification Kit (A1125; Promega) per the manufacturer’s instructions and quantified with a Quant-iT PicoGreen dsDNA assay kit (P7589; Thermo Fisher Scientific). GBS libraries were constructed based on the protocol of Poland et al. (2012) with minor modifications. Briefly, 200 ng of DNA for each line was digested with PstI and MseI, and then ligated to a common adapter and a barcoded adapter unique to each sample. Equal volumes of the ligated products were pooled and purified with the QIAquick PCR purification kit (28104; QIAGEN) for PCR amplification. For the PCR amplification, 50 ng of template DNA was mixed with NEB 2X Taq Master Mix and two primers (5 nmol each) in 200 μL total reaction volume and PCR amplified for 18 cycles with 10 s of denaturation at 98°C, followed by 30 s of annealing at 65°C, and finally 30 s extension at 72°C. The PCR product was cleaned using a QIAquick PCR purification kit. The library was sequenced on an Illumina HiSeq 2500 to generate single-end, 100-bp reads at the Genomic Sequencing and Analysis Facility at the University of Texas Southwestern Medical Center at Dallas, Texas. All sequences were submitted to the National Center for Biotechnology Information Short Read Archive (experiment #SRP144046). SNP discovery and genotype calling was performed using the TASSEL-GBS pipeline (Glaubitz et al., 2014) with the Triticum aestivum IWGSC RefSeq v1.0 as the reference genome (International Wheat Genome Sequencing Consortium [IWGSC], 2018). SNP markers were filtered with an individual read depth greater than 1, MAF greater than 0.05, and missing data less than 50%. Filtering SNPs yielded 102,147 SNP markers (Supplementary Table S1). Missing values were imputed with LD-KNNi method (Money et al., 2015) implemented in TASSEL v.5 (Bradbury et al., 2007).
Additionally, one SNP marker (IFA-FM227, Schweiger et al., 2016) linked to the major QTL Fhb1 and one SNP marker (barc186-80018, unpublished) linked to the major QTL Fhb5 were genotyped for the spring wheat breeding lines and check cultivars. Primer sequences for IFA-FM227 were as follows: FAM: GGCGTCGGCGATCCTGCTTA; HEX: GGCGTCGGCGATCCTGCTTAT; Common: CGTCGT CGGCCGCGGGTT. Primer sequences for barc186-80018 were as follows: FAM: GTAGTGATCCAAAGAAATAAAGGAGAT; HEX: GTAGTGATCCAAAGAAATAAAGGAGAG; Common: GTGACAAGTTATAGGTAAGGTCTCCAT. Each SNP was assayed using the KBiosciences Competitive Allele-Specific PCR genotyping system (KASP). Briefly, genotyping reactions were performed in 384-well plates on a Procycle thermocycler (Life) in 4 μL reactions containing two allele-specific primers, one common reverse primer, 1 x KASPaR v4.0 SNP Mastermix (LGC Genomics), and 36 ng of gDNA. After an initial denaturation step of 15 min at 94°C, PCR amplification reactions consisted of 10 cycles of 20 s denaturation at 94°C, followed by 60 s at a touchdown annealing/elongation at 65-57°C (decreasing 0.8°C each cycle), then 29 cycles at 20 s denaturation at 94°C, followed by annealing/elongation 60 s at 57°C. Fluorescence of PCR products was measured on a Roche Light Cycler® 480 and accompanying software (v 1.51) was used to distinguish clusters and call genotypes.
Phenotypic Data Analysis
The number of breeding lines per trial ranged from 31 to 112 (Supplementary Table S1). Two-stage analysis of phenotypic data was performed. In the first stage, best linear unbiased estimators (BLUEs) were estimated for all breeding lines within each individual trial using R package lme4 (Bates et al., 2014; R Development Core Team, 2018). The model was
where y is the vector of unadjusted phenotypes, μ is the overall mean, gi is the fixed effect of the ith genotype and rj is the random effect of the jth block. To identify outlier trial, we estimated broad-sense heritability (H2) for each individual trial. All factors were considered as random. The variance components of error (σ2) and genotype (σ2g) were estimated. The broad-sense heritability was estimated as σ2/(σ2 + σ2g) and was used to eliminate trials with a H2 score < 0.1.
In the second analysis stage, we estimated BLUEs of breeding lines across all 10 trials using the R package lme4 (Bates et al., 2014). The model was
where y* represents the estimated BLUEs of breeding lines within each individual trial calculated in the first stage, μ is the overall mean, gi is the random effect of the ith genotype and tj is the random effect of the jth trial. The estimated BLUEs were further used in GWAS to identify major QTL and in genomic prediction analysis.
A relationship matrix was calculated using the 102,147 SNP markers with the R package rrBLUP (Endelman, 2011). Then, additive variance components (Va) and error variance component (Ve) were calculated with the mixed.solve function in the package rrBLUP (Endelman, 2011). Genomic heritability (h2) was calculated as Va/(Va + Ve).
Marker-Trait Association Analysis
Principal component analysis (PCA) was conducted with the 102,147 SNPs to assess population structure using TASSEL v.5 (Bradbury et al., 2007). SNP-based GWAS was performed using TASSEL v.5 (Bradbury et al., 2007). Based on the Scree plot (Supplementary Figure S1), the first three PCs were chosen as covariates to capture population structure in association analysis. A centered kinship (K) matrix was calculated based on the 102,147 SNPs using TASSEL. A linear mixed model including population structure and kinship matrix was used to test marker-trait association. False discovery rate (FDR) was calculated from p-values using the R function p.adjust (method = fdr) (Benjamini and Hochberg, 1995). Significance of marker-trait association is defined by FDR as a q value smaller than 0.1.
Development and Validation of Genomic Prediction Models
Genomic prediction was evaluated with the statistical model rrBLUP. The rrBLUP model was constructed using R package rrBLUP (Endelman, 2011). Prediction accuracies were first validated using five-fold cross-validation, in which 80% of individuals were randomly selected as the training population and the remaining 20% of individuals were used to validate the genomic prediction accuracy. Genomic prediction accuracy was estimated as the Pearson correlation (r) between genomic estimated breeding values (GEBVs) and BLUPs of phenotypic values. Random sampling of training and validation sets was repeated 100 times and the mean of r divided by the square root of the estimated heritability was defined as the genomic prediction accuracy.
To test prediction accuracy across breeding cycles, we developed prediction models using a training population that includes five breeding cycles to predict breeding lines from the remaining breeding cycles, e.g., to predict 2012 breeding lines, the five breeding cycles tested in the other 5 years (2011, 2013–2016) were used as training population.
Because genetic relationship between training population and validation population can affect prediction accuracy, we calculated genetic relationships between training population and validation population based on identity-by-state similarity (proportion of shared alleles) between all individuals using R package “snpRelate” (Zheng et al., 2012).
To evaluate the effect of marker number on prediction accuracy, we randomly sampled 100, 500, 1000, 1500, 2000, 2500, 3000, 3500, 4000, 4500, and 5000 markers to develop prediction models and validate their prediction accuracies. Random sampling for each subset was repeated 500 times and the mean of the Pearson correlations between GEBVs and BLUPs was defined as the genomic prediction accuracy.
Results
Genetic Diversity of the Elite Spring Wheat Lines and Their Reaction to FHB
Broad-sense heritability was estimated for each individual trial and ranged from 0.21 to 0.67. No outlier trials were identified at threshold of H2 < 0.1. BLUEs of FHB severity were estimated for the 427 elite spring wheat lines and 15 check cultivars using the unbalanced phenotypic data collected from all 10 field trials at two locations across 6 years. Among the 15 checks, the resistant check variety ND2710 showed the lowest FHB severity (15.9%) while the susceptible check variety ND2398 had the highest disease severity (75.8%). Among the 427 breeding lines, FHB severity ranged from 6.0% to 83.1% and broad variation was found in all six breeding cycles (Table 1). In total, 102,147 markers were obtained with missing values less than 50%. MAF of the 102,147 markers averaged 0.19, ranging from 0.05 to 0.5 (Supplementary Figure S2). PCA was performed and the PC1 and PC2 explained 6.9 and 6.0% of total variation, respectively. Scatter plots of PC1 against PC2 for the 427 lines indicated there was no clear population structure and breeding lines from different breeding cycles were intermixed (Supplementary Figure S3).
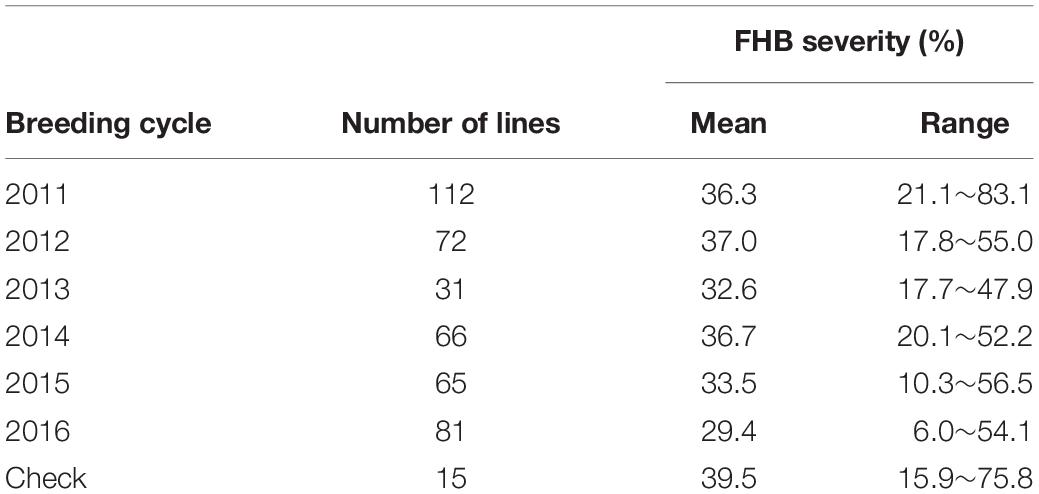
Table 1. Means and ranges of FHB severity for the breeding lines from six breeding cycles and 15 checks.
Marker-Trait Association
Marker-trait association was conducted with a linear mixed model including population structure and kinship matrix. Significant marker-trait association was determined by FDR as a q value smaller than 0.1. The Manhattan plot is shown in Figure 1. In total, six SNPs significantly associated with FHB resistance were identified on chromosome arms 1AL (Figure 1 and Table 2). The most significant markers (S1A_477852878 and S1A_477852881) explained 5.3% of the total phenotypic variation (Table 2). Over 81% of the 439 tested lines had the favorable allele for the two most significant markers at this locus (Table 2). The favorable allele alone could reduce 7.5% of FHB severity (Table 2).
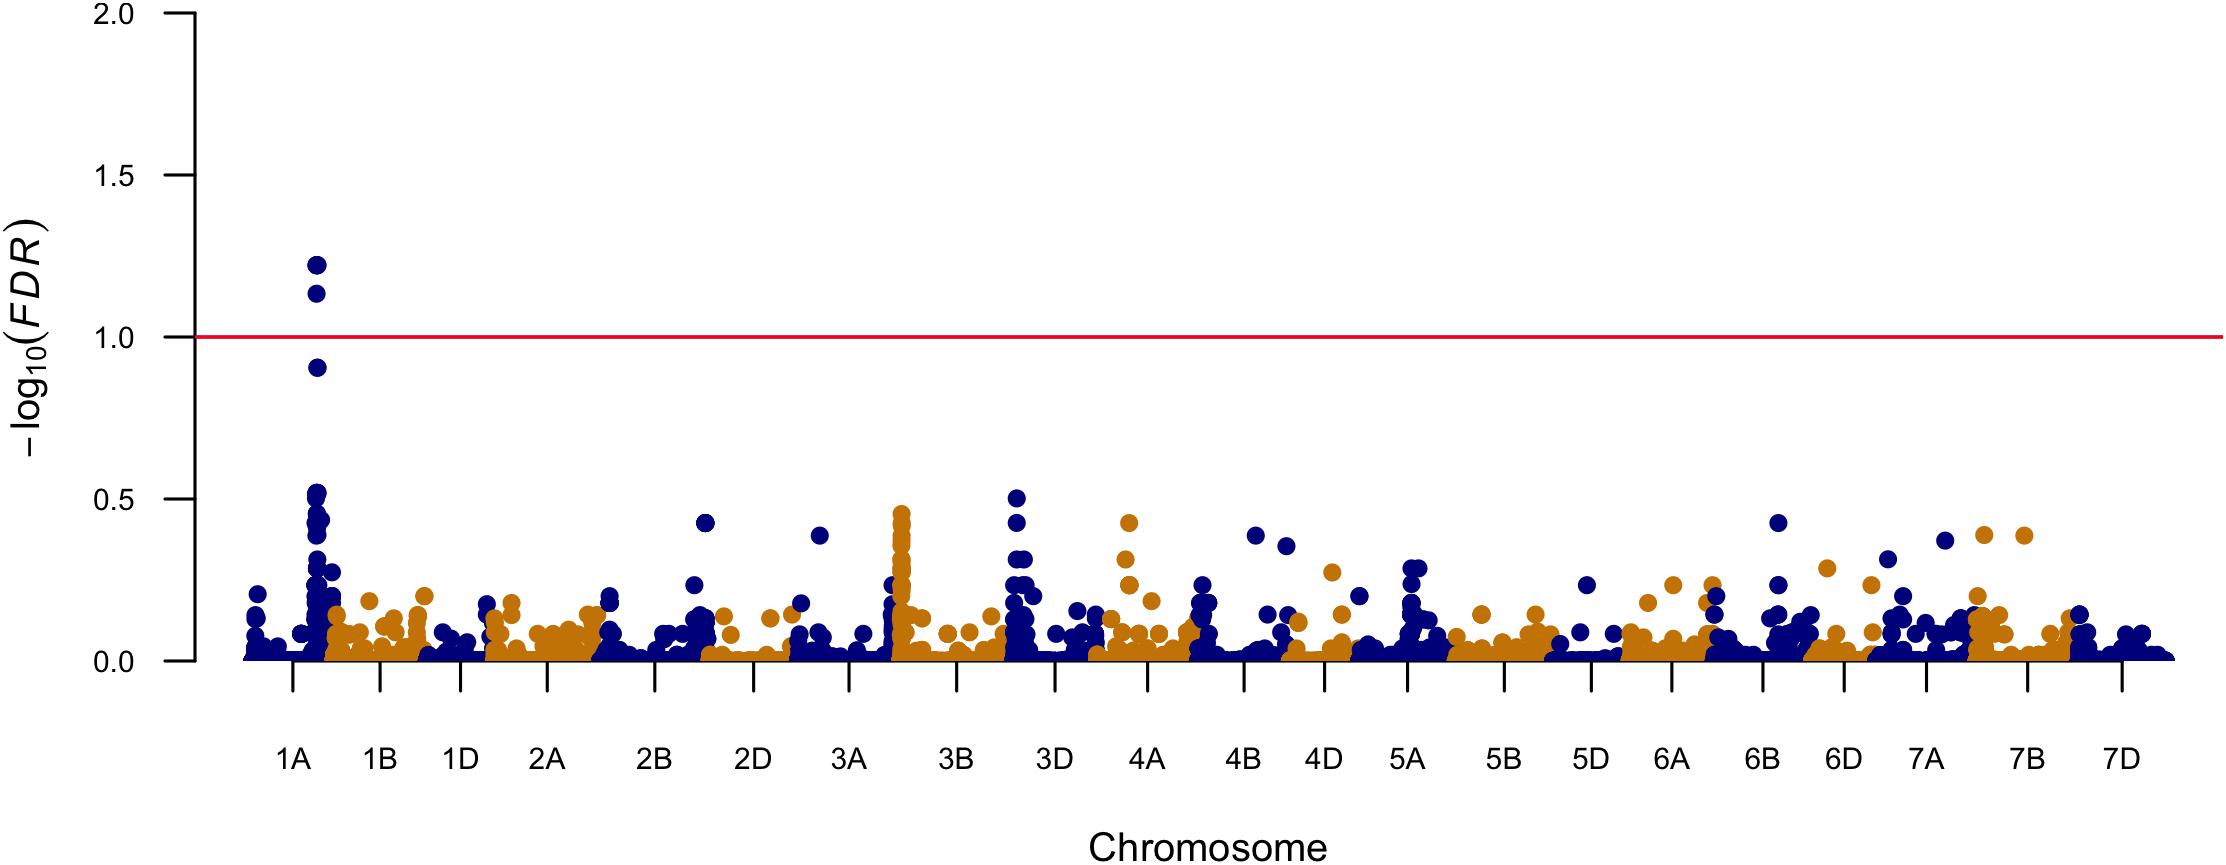
Figure 1. Manhattan plot that displays genomic regions associated with FHB severity.
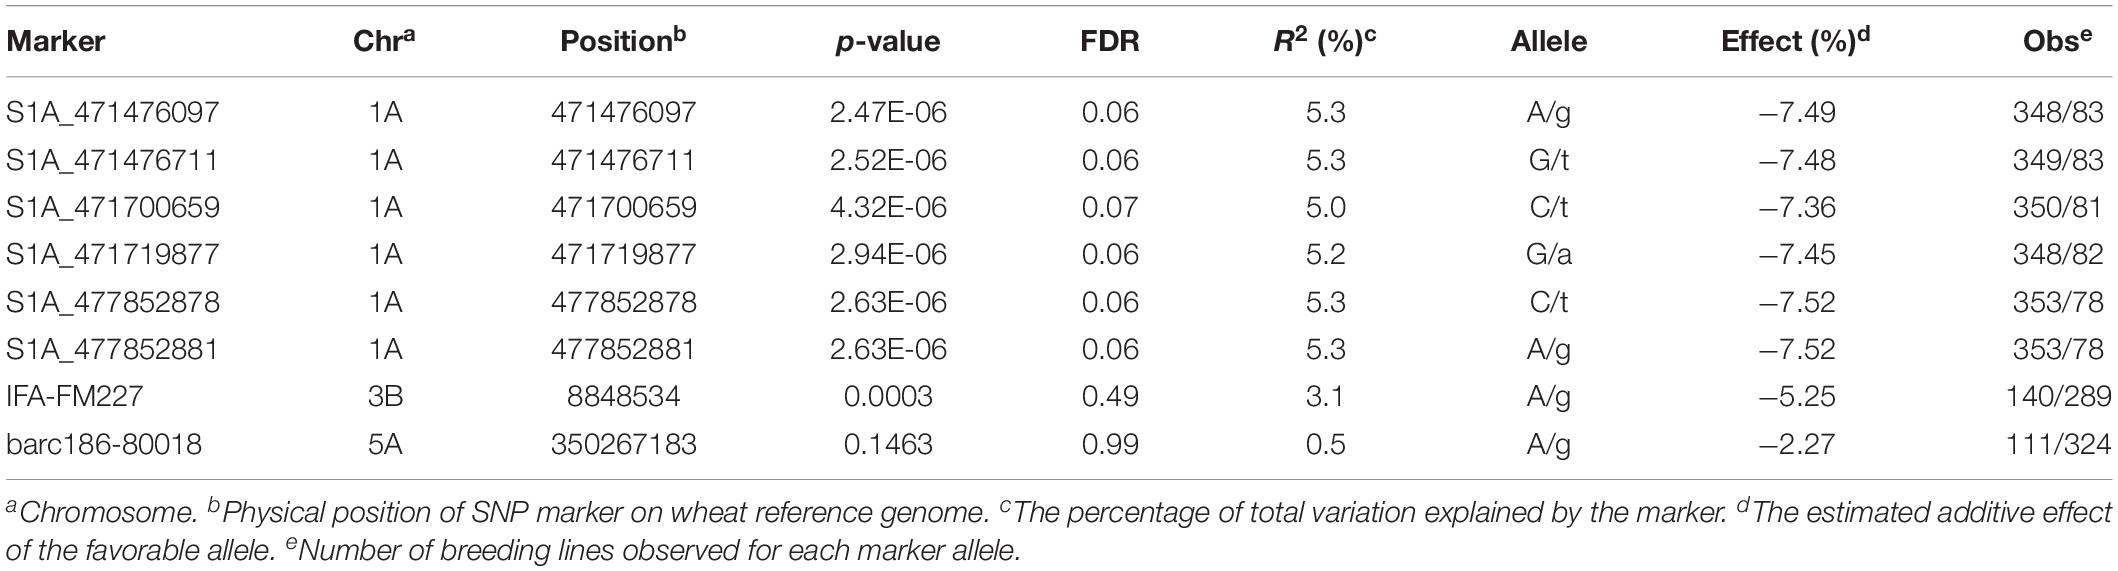
Table 2. Information of the SNP markers significantly associated with FHB severity and the SNP markers linked to the major QTL Fhb1 and Fhb5.
Frequencies and Effects of the Molecular Markers Linked to Fhb1 and Fhb5
We genotyped one SNP marker linked to the major QTL Fhb1 and one SNP marker linked to the major QTL Fhb5. The marker linked to Fhb1, IFA-FM227, was significantly associated with FHB severity at p-value less than 0.001 and explained 3.1% of total phenotypic variation (Table 2). In total, 140 (33%) of the 429 lines contained the favorable allele of the major QTL Fhb1. The marker linked to Fhb5, barc186-80018, was segregated in this population with the favorable allele frequency at 26% (Table 2). However, this marker was not significantly associated with FHB severity at p value smaller than 0.05 (Table 2).
Genomic Prediction
Based on the marker and phenotypic data, genomic heritability (h2) for the FHB severity was estimated to be 0.43 in this HRSW breeding population. We evaluated genomic prediction for FHB severity with statistical model rrBLUP. Prediction accuracy using fivefold cross validation was 0.35.
One potential application of GS is to predict breeding lines from a new breeding cycle and perform pre-selection. To test such prediction ability, we used breeding lines from five of the six breeding cycles as training population to predict breeding lines from the remaining breeding cycle. The prediction accuracies ranged from 0.22 when predicting 2012 breeding lines to 0.44 for predicting 2015 breeding lines (Figure 2). The identity-by-state similarity between all pairs of breeding lines were calculated using the 102,147 markers. The genetic relationships between one breeding cycle and other breeding cycles were calculated based on the identity-by-state similarities between pairs of breeding lines. We found that the genetic relationships between the breeding cycles were similar to the average genetic relationship of all pairs of breeding lines (Supplementary Figure S4) and pairs of breeding lines within a breeding cycle (data not shown). Therefore, genetic relationships between training and validation population did not impact the prediction accuracies, which varied between different breeding cycles. We also evaluated effect of marker number on prediction accuracy. The prediction accuracies increased from 100 markers to 1000 markers but attained a plateau after 1000 markers (Figure 2).
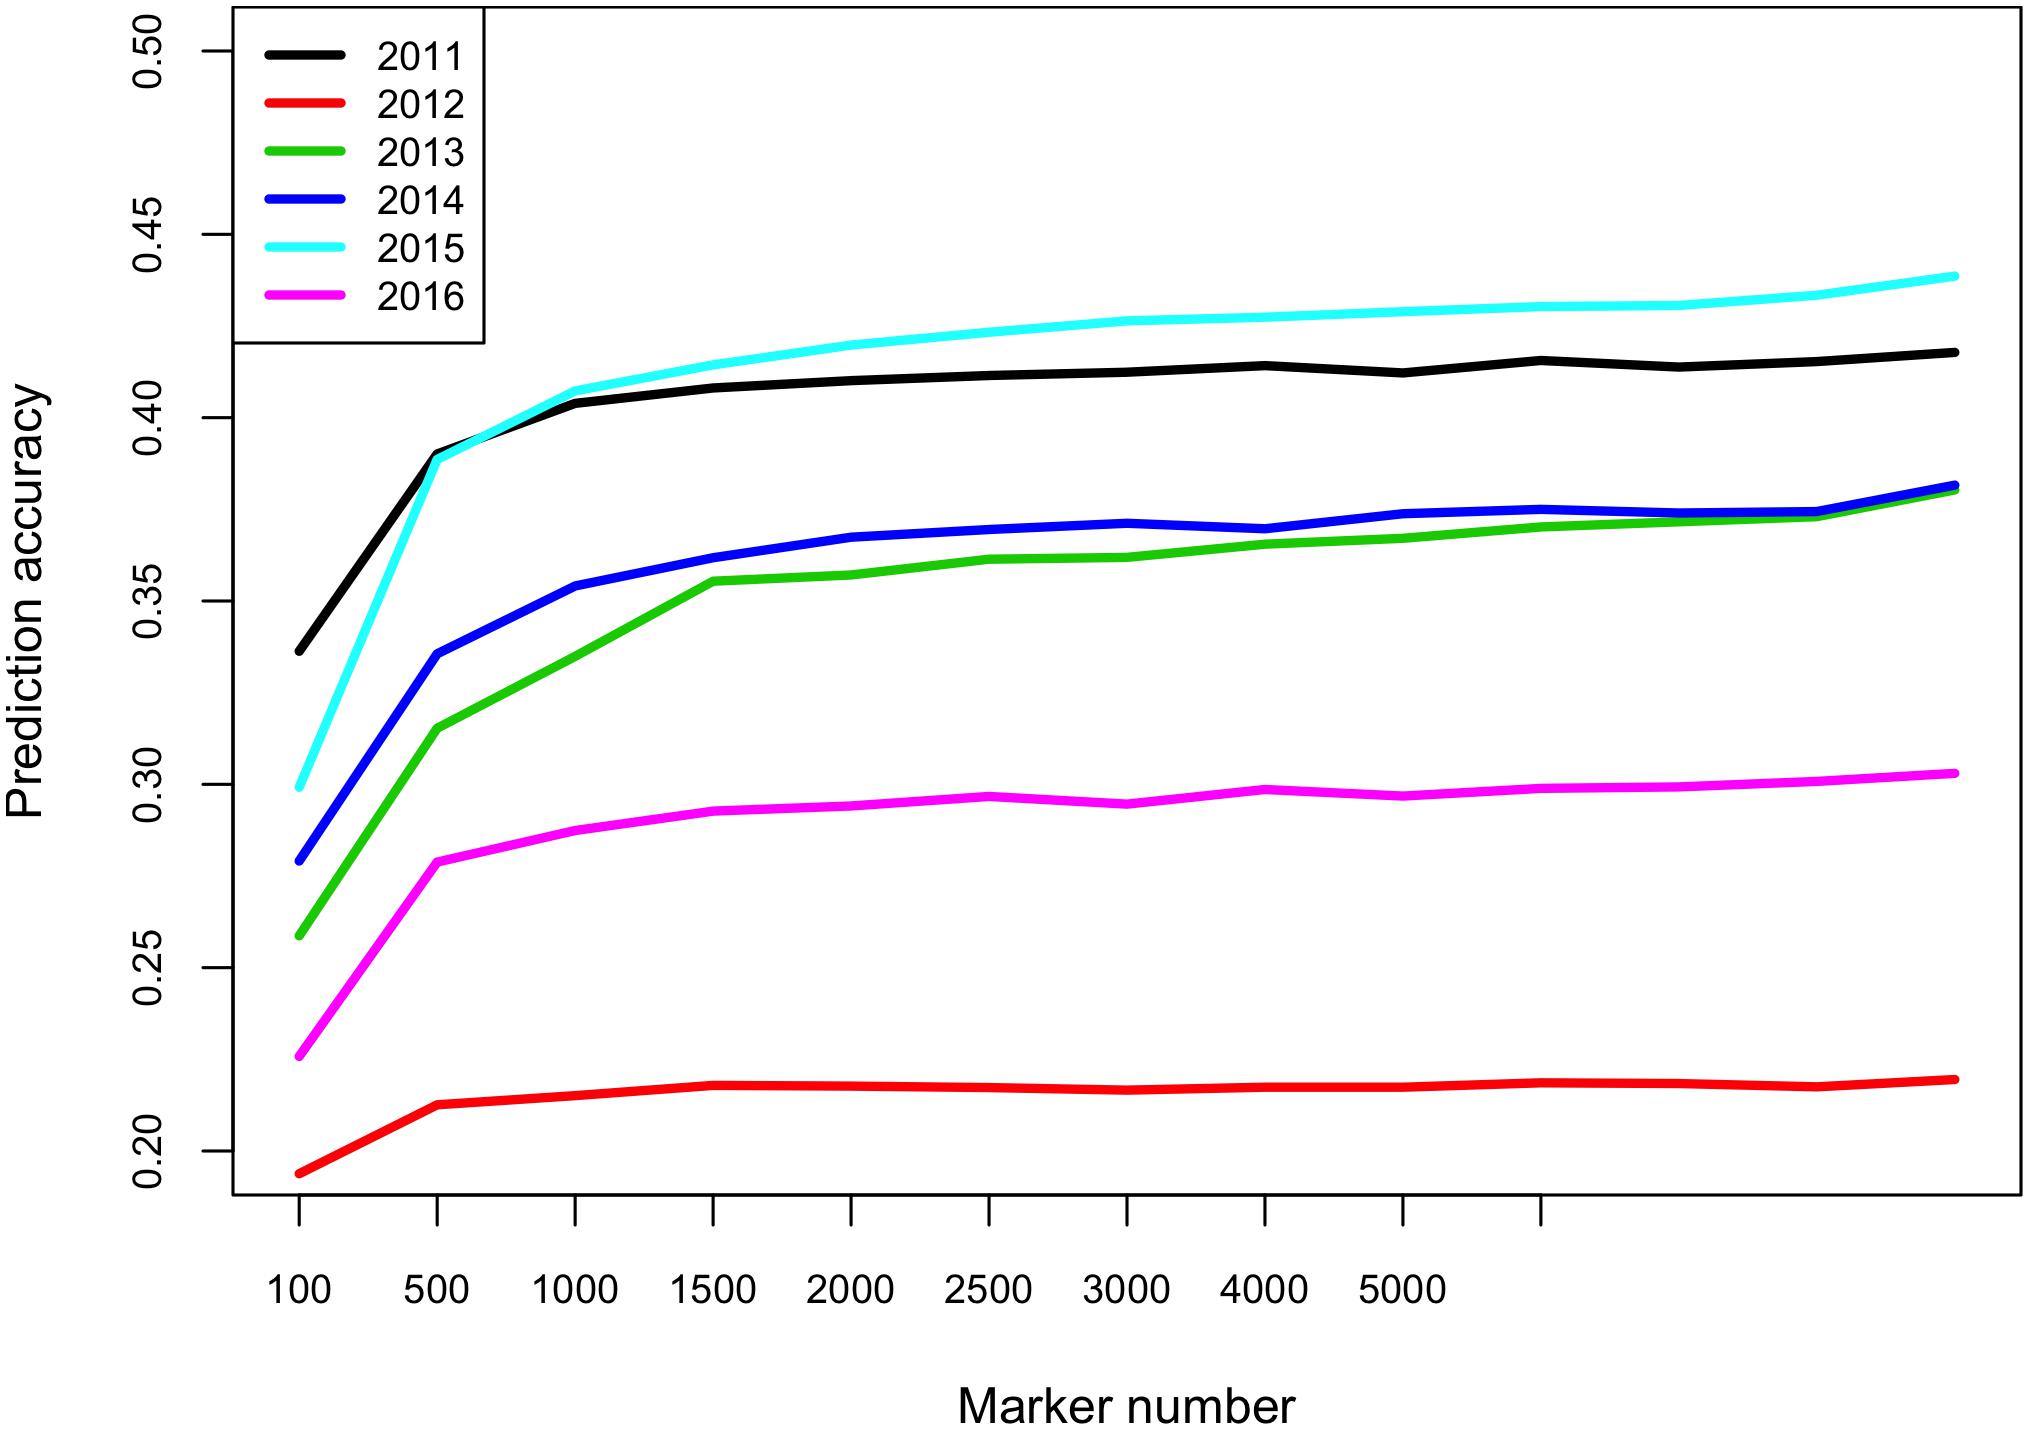
Figure 2. Prediction accuracies for FHB severity across different breeding cycles using varied number of markers. E.g., to predict 2012 breeding lines, the breeding lines evaluated in the other five breeding cycles (2011, 2013–2016) were used as training population. The x-axis shows the number of markers in each subset (100, 500, 1000, 1500, 2000, 2500, 3000, 4000, 5000, and 102147 markers).
Discussion
Genetic Architecture of FHB Resistance in the NDSU HRSW Population
The major QTL Fhb1 is the most stable type II resistant QTL identified, with a large genetic effect consistently presented in previous bi-parental mapping studies (Anderson et al., 2001; Pumphrey et al., 2007; Buerstmayr et al., 2009; Zhao et al., 2018b). In this study, we evaluated FHB reactions of 427 breeding lines from the NDSU HRSW breeding program, but the marker linked to Fhb1 showed a relatively small effect, explaining approximately 3.1% of the total phenotypic variation. The varied effects of Fhb1 have to do with differences in genetic background, tested environments, and/or resistance types evaluated. For example, Bokore et al. (2017) evaluated Sumai 3-derived North American spring wheat breeding lines at two field nurseries in Canada and found that Fhb1 was more effective at one location than the other and that Fhb1 was more effective in some families than others. In this study, FHB resistance – measured as severity – was conducted in field nurseries, where FHB resistance assessment is confounded by natural infection in addition to manual inoculation. Different from single-spikelet inoculation, high levels of natural Fusarium inoculum can increase infection incidences, mitigating the effectiveness of Fhb1 and the type II resistance it confers. Zhao et al. (2018b) studied type II FHB resistance using a population derived from a cross between ND2710 and Bobwhite with single-spikelet inoculation, and detected Fhb1 as major QTL in both greenhouse and field evaluations in North Dakota, however, with Fhb1 explaining much less phenotypic variation under field conditions. Failing to detect the QTL Fhb1 for FHB severity under field inoculation was also reported in winter wheat (Herter et al., 2019b). Some studies found that the QTL Fhb5, providing type I resistance, was of higher effect than Fhb1 under field inoculation (Von der Ohe et al., 2010; Miedaner et al., 2019). However, the QTL Fhb5 was not significantly associated with FHB severity in this study. The discrepancy between this study and the other two studies (Von der Ohe et al., 2010; Miedaner et al., 2019) remains unclear.
We identified one QTL on chromosome arm 1AL in this breeding population through association mapping. A few previous mapping studies also detected FHB resistance QTL on chromosome arms 1AL (Lin et al., 2004; Petersen et al., 2017; Yi et al., 2018). Petersen et al. (2017) identified a QTL related to Type I resistance between 90K-SNP markers IWB29758 and IWB73950 on chromosome arm 1AL using a double haploid population derived from two US soft red winter wheat cultivars. The physical locations of the two markers were 539895992–541895688 bp, determined by BLASTn searches of the primer sequences against the Triticum aestivum IWGSC RefSeq v1.0 (International Wheat Genome Sequencing Consortium [IWGSC], 2018). Yi et al. (2018) found a QTL related to FHB severity on chromosome arm 1AL, where the closest 90K-SNP markers were RAC875_c6338_1887 under single-spikelet inoculation and wsnp_CAP12_c2438_1180601 under spay inoculation, respectively. The two markers were located at 350007881 and 39649561 bp on chromosome arm 1AL. The QTL found from our study are distant from those identified from previous studies, suggesting it is a possible novel locus for FHB resistance.
Glenn is a HRSW cultivar with good grain yield and high protein content (Mergoum et al., 2006). Glenn showed high resistance to FHB despite of lacking the favorable allele of Fhb1 (Mergoum et al., 2006; Bokore et al., 2017); our results confirmed this observation (data not shown). The cultivar Glenn and its derived lines have been widely used as parents in the NDSU HRSW breeding program. A Chinese landrace Haiyanzhong has shown high level of resistance to FHB, and a mapping study using a population derived from Haiyanzhong found that it carried Fhb2, Fhb4, Fhb5, and four other minor QTL (Cai et al., 2016). The accumulation of QTL with medium/minor effects conferring high FHB resistance have been identified in other wheat lines such as PI277012 (Chu et al., 2011; Zhao et al., 2018a), Wanshuibai (Lin et al., 2006), and Frontana (Steiner et al., 2004). Therefore, the high level of FHB resistance observed in Glenn and other breeding lines in this HRSW breeding population is likely a result of numerous genes. The identified QTL explained 5.3% of total phenotypic variation and the genomic heritability estimated with genome wide markers was 0.43, suggesting that there are unidentified genes with small additive effects that also contribute to the FHB resistance. Integrating QTL with major, medium, and minor effects for both type I and type II resistance seems crucial to developing stable FHB resistance under field conditions.
GS for FHB Resistance Improvement
MAS of major QTL like Fhb1 has contributed to the development of FHB resistant cultivars in several wheat breeding programs (Anderson, 2007; Steiner et al., 2017). However, phenotypic selection is still routinely utilized in wheat breeding programs due to the complex genetic architecture of FHB resistance. Phenotypic selection of FHB resistance is generally conducted in later generations with replicates because of strong genotype by environment interactions (Anderson, 2007). The 427 breeding lines used in this study were F9 breeding lines from 2011 to 2016 AYTs, which is a 3-year experiment. Most of the breeding lines had been evaluated for FHB resistance in at least two prior years using F7 or F8 generations. Some breeding lines with good grain yield and/or quality traits could have been selected into AYTs even if possessing only moderate FHB resistance. Additionally, it is likely that many F5 or F6 breeding lines with good FHB resistance and grain yield potential were missed during generational selection due to limited resources for FHB and grain yield evaluation.
In GS, selection is based on the predicted breeding values from genome wide markers. One potential application of GS is to select promising lines from a large number of newly developed early generation breeding lines (i.e., F5 or F6) into expensive yield trials and therefore improve selection efficiency. For example, GS pre-selection of end-use quality traits in wheat has successfully reduced the number of poor performing lines advanced to expensive yield trials (Guzman et al., 2016). In this study, we found medium prediction accuracy of 0.35 using cross-validation within population. Higher prediction accuracies were observed for FHB resistance from some previous studies (Mirdita et al., 2015a; Arruda et al., 2016b; Galiano-Carneiro et al., 2019). In most of the previous studies, balanced phenotypic data was used where all lines were phenotyped at same set of environments. In this study, phenotypic data for the 439 breeding lines collected from different years and locations were unbalanced, and the estimated BLUEs were adjusted by common checks. Because genotype by environment interaction could not be integrated in the statistics models, bias of the estimated BLUEs was inevitable, which could further lower the prediction accuracy in this study. Large training population and/or high heritability of FHB resistance derived from multiple locations’ phenotypic evaluation could also contribute to the high prediction accuracy observed from previous studies (Mirdita et al., 2015a).
Prediction accuracy of between-crosses or families is generally low because of distant relationship between training population and validation population (Crossa et al., 2014; Herter et al., 2019b). In this study, we found that accuracies of 0.22–0.44 for predicting FHB severity over breeding cycles was not dramatically decreased compared to cross-validation. This could be thanks to the high level of genetic relationships between different breeding cycles, where some elite cultivars and their derived lines were commonly used as parents for crossing blocks. This study aimed to develop an initial prediction model, and will frequently update it by adding newly phenotyped and genotyped breeding lines. In the NDSU HRSW breeding program during the period of this study, over 1,300 inbred breeding lines were evaluated for FHB resistance each year in the FHB field nurseries at two locations in hill plots. This includes around 750 F7 lines being tested for the first time, 350 second year F8 lines, 150 F9 advanced lines, and 75 F10 elite lines. Yield tests, quality screening, and selection for other economically important diseases were conducted in each generation. It was reported that genomic assisted selection by combining phenotypic data and predicted values from GS model provided higher selection accuracy than phenotypic selection alone for grain yield and protein content at preliminary yield trial, where phenotypic data is collected from few environments with few or no replications (Michel et al., 2017). We plan to perform genomic assisted selection for FHB resistance at F7 generation, where FHB severity will be estimated using both phenotypic data and predicted values from the initial GS model. GS model will be updated by adding the F7 lines in the training population. Implementing GS pre-selection of FHB resistance on untested early generation lines like F6 lines can be carried out once high prediction accuracy is obtained from the updated prediction model.
One limiting factor to utilize GS in pre-selection of promising lines is high genotyping cost for a large number of selection lines. Similar to other GS studies in wheat breeding populations (Jiang et al., 2015; Haile et al., 2018), we also found that a relatively small number of markers (e.g., 1000 markers) can achieve high prediction accuracy, owing to the high level of linkage disequilibrium. Simulation and empirical studies proved that a panel of low-density markers (50 to 100s of markers) genotyped for inbred progenies and imputed to high-density markers could maintain high prediction accuracies (Hickey et al., 2015; Jacobson et al., 2015; Gorjanc et al., 2017). Such a panel of low-density markers could be genotyped with a SNP array or amplicon GBS at a low cost, potentially enabling the utility of GS on larger populations (Campbell et al., 2015; Pembleton et al., 2016). Together with advances in low-cost genotyping and imputation methods, the high prediction accuracy found in this work pave the way to implement GS for FHB resistance in the NDSU HRSW breeding program.
The 427 breeding lines from the NDSU HRSW breeding program represent the current breeding pool. Few of the new breeding lines showed better FHB resistance than ND2710, one of the first experimental lines released by the NDSU HRSW breeding program from efforts to introduce FHB resistance from Sumai 3 into elite wheat lines adapted to the Northern Great Plains (Frohberg et al., 2004). Multiple target traits including grain yield, end-use quality traits, disease resistance, etc. are selected simultaneously in the NDSU HRSW breeding program, which can partially explain the relatively static FHB resistance development observed in these new breeding lines. The potential to utilize GS pre-selection for multiple traits like FHB resistance, grain yield, and other end-use quality traits at early generations further enhances the advantage conferred by GS compared to traditional phenotypic selection in HRSW variety development.
Data Availability
All datasets for this study are included in the manuscript and the Supplementary Files.
Author Contributions
SZ and XL conceived and designed the study. YL, ES, JF, JH, AG, MM, SZ, and XL generated and analyzed the data. All authors wrote and approved the manuscript.
Funding
This work was supported by the NDSU Agricultural Experiment Station FHB funding to XL (FARG003502) and the US Wheat and Barley Scab Initiative to SZ (Agreement No. 59-0200-3-004).
Conflict of Interest Statement
The authors declare that the research was conducted in the absence of any commercial or financial relationships that could be construed as a potential conflict of interest.
Acknowledgments
The authors would like to thank Joe Mullins and Yueqiang Leng for their contributions to the field plot maintenance and phenotypic evaluation. The authors would also like to thank Shiaoman Chao for the genotyping of candidate gene markers IFA-FM227 and barc186-80018.
Supplementary Material
The Supplementary Material for this article can be found online at: https://www.frontiersin.org/articles/10.3389/fpls.2019.01007/full#supplementary-material
FIGURE S1 | Scree plot of the first 30 PCs derived from a principle component analysis.
FIGURE S2 | Distribution of the minor allele frequency of the 102,147 SNP markers genotyped for the 439 spring wheat lines.
FIGURE S3 | Scatter plot of PC1 and PC2 derived from a principle component analysis for the 439 spring wheat lines.
FIGURE S4 | Box plot of identity-by-state similarity among all pairs of breeding lines and pairs of breeding lines between breeding cycles.
TABLE S1 | Description of the NDSU hard red spring wheat trials used in this study.
Abbreviations
BLUP, best linear unbiased predictor; FHB, Fusarium head blight; GBS, genotyping-by-sequencing; GS, genomic selection; GWAS, genomic wide association study; HRSW, hard red spring wheat; MAF, minor allele frequency; MAS, marker-assisted selection; NDSU, North Dakota State University; PCA, principle component analysis; rrBLUP, ridge regression best linear unbiased prediction; SNP, single nucleotide polymorphism.
References
Allen, A. M., Winfield, M. O., Burridge, A. J., Downie, R. C., Benbow, H. R., Barker, G. L., et al. (2017). Characterization of a wheat breeders’ array suitable for high-throughput snp genotyping of global accessions of hexaploid bread wheat (Triticum aestivum). Plant Biotechnol. J. 15, 390–401. doi: 10.1111/pbi.12635
Anderson, J. A. (2007). Marker-assisted selection for fusarium head blight resistance in wheat. Int. J. Food Microbiol. 119, 51–53. doi: 10.1016/j.ijfoodmicro.2007.07.025
Anderson, J. A., Stack, R. W., Liu, S., Waldron, B. L., Fjeld, A. D., Coyne, C., et al. (2001). DNA markers for Fusarium head blight resistance QTLs in two wheat populations. Theor. Appl. Genet. 102, 1164–1168. doi: 10.1007/s001220000509
Arruda, M. P., Brown, P., Brown-Guedira, G., Krill, A. M., Thurber, C., Merrill, K. R., et al. (2016a). Genome-wide association mapping of Fusarium head blight resistance in wheat using genotyping-by-sequencing. Plant Genome 9:1. doi: 10.3835/plantgenome2015.04.0028
Arruda, M. P., Lipka, A. E., Brown, P. J., Krill, A. M., Thurber, C., Brown-Guedira, G., et al. (2016b). Comparing genomic selection and marker-assisted selection for Fusarium head blight resistance in wheat (Triticum aestivum L.). Mol. Breed. 36:84. doi: 10.1007/s11032-016-0508-5
Bai, G., Kolb, F. L., Shaner, G., and Domier, L. L. (1999). Amplified fragment length polymorphism markers linked to a major quantitative trait locus controlling scab resistance in wheat. Phytopathology 89, 343–348. doi: 10.1094/PHYTO.1999.89.4.343
Bates, D., Maechler, M., Bolker, B., and Walker, S. (2014). Lme4: Linear Mixed-Effects Models Using Eigen and S4. Available at: http://CRAN.R-project.org/package=lme4 (accessed July 24, 2019).
Benjamini, Y., and Hochberg, Y. (1995). Controlling the false discovery rate: a practical and powerful approach to multiple testing. J. R. Stat. Soc. B Methods 57, 289–300. doi: 10.1111/j.2517-6161.1995.tb02031.x
Bokore, F. E., Knox, R. E., DePauw, R. M., Clarke, F., Cuthbert, R. D., Campbell, H. L., et al. (2017). Validation of molecular markers for use with adapted sources of Fusarium head blight resistance in wheat. Plant Dis. 101, 1292–1299. doi: 10.1094/PDIS-10-16-1421-RE
Bradbury, P. J., Zhang, Z., Kroon, D. E., Casstevens, T. M., Ramdoss, Y., and Buckler, E. S. (2007). TASSEL: software for association mapping of complex traits in diverse samples. Bioinformatics 23, 2633–2635. doi: 10.1093/bioinformatics/btm308
Buerstmayr, H., Ban, T., and Anderson, J. A. (2009). QTL mapping and marker-assisted selection for Fusarium head blight resistance in wheat: a review. Plant Breed. 128, 1–26. doi: 10.1111/j.1439-0523.2008.01550.x
Cai, J., Wang, S., Li, T., Zhang, G., and Bai, G. (2016). Multiple minor QTLs are responsible for Fusarium head blight resistance in Chinese wheat landrace Haiyanzhong. PLoS One 11:e0163292. doi: 10.1371/journal.pone.0163292
Campbell, N. R., Harmon, S. A., and Narum, S. R. (2015). Genotyping-in-thousands by sequencing (GT-seq): a cost effective SNP genotyping method based on custom amplicon sequencing. Mol. Ecol. Resour. 15, 855–867. doi: 10.1111/1755-0998.12357
Chu, C., Niu, Z., Zhong, S., Chao, S., Friesen, T. L., Halley, S., et al. (2011). Identification and molecular mapping of two QTL with major effects for resistance to Fusarium head blight in wheat. Theor. Appl. Genet. 123, 1107–1119. doi: 10.1007/s00122-011-1652-2
Crossa, J., Perez, P., Hickey, J., Burgueno, J., Ornella, L., Cerón-Rojas, J., et al. (2014). Genomic prediction in CIMMYT maize and wheat breeding programs. Heredity 112:48. doi: 10.1038/hdy.2013.16
Cuthbert, P. A., Somers, D. J., and Brule-Babel, A. (2007). Mapping of Fhb2 on chromosome 6BS: a gene controlling Fusarium head blight field resistance in bread wheat (Triticum aestivum L.). Theor. Appl. Genet. 114, 429–437. doi: 10.1007/s00122-006-0439-3
Endelman, J. B. (2011). Ridge regression and other kernels for genomic selection with R package rrBLUP. Plant Genome 4, 250–255. doi: 10.3835/plantgenome2011.08.0024
Frohberg, R. C., Stack, R. W., and Mergoum, M. (2004). Registration of spring wheat germplasm ND2710 resistant to Fusarium head blight. Crop Sci. 44, 1498–1499.
Galiano-Carneiro, A. L., Boeven, P. H., Maurer, H. P., Würschum, T., and Miedaner, T. (2019). Genome-wide association study for an efficient selection of Fusarium head blight resistance in winter triticale. Euphytica 215, 4.
Glaubitz, J. C., Casstevens, T. M., Lu, F., Harriman, J., Elshire, R. J., Sun, Q., et al. (2014). TASSEL-GBS: a high capacity genotyping by sequencing analysis pipeline. PLoS One 9:e90346. doi: 10.1371/journal.pone.0090346
Gorjanc, G., Battagin, M., Dumasy, J. F., Antolin, R., Gaynor, R. C., and Hickey, J. M. (2017). Prospects for cost-effective genomic selection via accurate within-family imputation. Crop Sci. 57, 216–228. doi: 10.2135/cropsci2016.06.0526
Guzman, C., Peña, R. J., Singh, R., Autrique, E., Dreisigacker, S., Crossa, J., et al. (2016). Wheat quality improvement at CIMMYT and the use of genomic selection on it. Appl. Transl. Genom. 11, 3–8. doi: 10.1016/j.atg.2016.10.004
Haile, J. K., N’Diaye, A., Clarke, F., Clarke, J., Knox, R., Rutkoski, J., et al. (2018). Genomic selection for grain yield and quality traits in durum wheat. Mol. Breed. 38:75. doi: 10.1007/s11032-018-0818-x
Herter, C. P., Ebmeyer, E., Kollers, S., Korzun, V., Würschum, T., and Miedaner, T. (2019b). Accuracy of within-and among-family genomic prediction for Fusarium head blight and Septoria tritici blotch in winter wheat. Theor. Appl. Genet. 132, 1121–1135. doi: 10.1007/s00122-018-3264-6
Herter, C. P., Ebmeyer, E., Kollers, S., Korzun, V., and Miedaner, T. (2019a). An experimental approach for estimating the genomic selection advantage for Fusarium head blight and Septoria tritici blotch in winter wheat. Theor. Appl. Genet. 132, 2425–2437. doi: 10.1007/s00122-019-03364-7
Hickey, J. M., Gorjanc, G., Varshney, R. K., and Nettelblad, C. (2015). Imputation of single nucleotide polymorphism genotypes in biparental, backcross, and topcross populations with a hidden Markov model. Crop Sci. 55, 1–3. doi: 10.2135/cropsci2014.09.0648
International Wheat Genome Sequencing Consortium [IWGSC] (2018). Shifting the limits in wheat research, and breeding using a. (fully)annotated reference genome. Science 361:6403. doi: 10.1126/science.aar7191
Jacobson, A., Lian, L., Zhong, S., and Bernardo, R. (2015). Marker imputation before genomewide selection in biparental maize populations. Plant Genome 8:2. doi: 10.3835/plantgenome2014.10.0078
Jia, H., Zhou, J., Xue, S., Li, G., Yan, H., Ran, C., et al. (2018). A journey to understand wheat Fusarium head blight resistance in the Chinese wheat landrace Wangshuibai. Crop J. 6, 48–59. doi: 10.1016/j.cj.2017.09.006
Jiang, Y., Schulthess, A. W., Rodemann, B., Ling, J., Plieske, J., Kollers, S., et al. (2017). Validating the prediction accuracies of marker-assisted and genomic selection of Fusarium head blight resistance in wheat using an independent sample. Theor. Appl. Genet. 130, 471–482. doi: 10.1007/s00122-016-2827-7
Jiang, Y., Zhao, Y., Rodemann, B., Plieske, J., Kollers, S., Korzun, V., et al. (2015). Potential and limits to unravel the genetic architecture and predict the variation of Fusarium head blight resistance in European winter wheat (Triticum aestivum L.). Heredity 114, 318–326. doi: 10.1038/hdy.2014.104
Lin, F., Kong, Z. X., Zhu, H. L., Xue, S. L., Wu, J. Z., Tian, D. G., et al. (2004). Mapping QTL associated with resistance to Fusarium head blight in the Nanda2419 × Wangshuibai population. I. Type II resistance. Theor. Appl. Genet. 109, 1504–1511. doi: 10.1007/s00122-004-1772-z
Lin, F., Xue, S. L., Zhang, Z. Z., Zhang, C. Q., Kong, Z. X., Yao, G. Q., et al. (2006). Mapping QTL associated with resistance to Fusarium head blight in the Nanda2419 × Wangshuibai population. II: type I resistance. Theor. Appl. Genet. 112, 528–535. doi: 10.1007/s00122-005-0156-3
Liu, S., Hall, M. D., Griffey, C. A., and McKendry, A. L. (2009). Meta-analysis of QTL associated with Fusarium head blight resistance in wheat. Crop Sci. 49, 1955–1968. doi: 10.2135/cropsci2009.03.0115
Liu, S., Zhang, X., Pumphrey, M. O., Stack, R. W., Gill, B. S., and Anderson, J. A. (2006). Complex microcolinearity among wheat, rice, and barley revealed by fine mapping of the genomic region harboring a major QTL for resistance to Fusarium head blight in wheat. Funct. Integr. Genomics 6, 83–89. doi: 10.1007/s10142-005-0007-y
Löffler, M., Schön, C. C., and Miedaner, T. (2009). Revealing the genetic architecture of FHB resistance in hexaploid wheat (Triticum aestivum L.) by QTL meta-analysis. Mol. Breed. 23, 473–488. doi: 10.1007/s11032-008-9250-y
McMullen, M., Jones, R., and Gallenberg, D. (1997). Scab of wheat and barley: a re-emerging disease of devastating impact. Plant Dis. 81, 1340–1348. doi: 10.1094/PDIS.1997.81.12.1340
Mergoum, M., Frohberg, R. C., Stack, R. W., Olson, T., Friesen, T. L., and Rasmussen, J. B. (2006). Registration of ‘glenn’ wheat. Crop Sci. 46, 473–475.
Meuwissen, T. H. E., Hayes, B. J., and Goddard, M. E. (2001). Prediction of total genetic value using genome-wide dense marker maps. Genetics 157, 1819–1829.
Michel, S., Ametz, C., Gungor, H., Akgöl, B., Epure, D., Grausgruber, H., et al. (2017). Genomic assisted selection for enhancing line breeding: merging genomic and phenotypic selection in winter wheat breeding programs with preliminary yield trials. Theor. Appl. Genet. 130, 363–376. doi: 10.1007/s00122-016-2818-8
Miedaner, T., Herter, C. P., Ebmeyer, E., Kollers, S., and Korzun, V. (2019). Use of non-adapted quantitative trait loci for increasing Fusarium head blight resistance for breeding semi-dwarf wheat. Plant Breed. 138, 140–147. doi: 10.1111/pbr.12683
Mirdita, V., Liu, G., Zhao, Y., Miedaner, T., Longin, C. F. H., Gowda, M., et al. (2015b). Genetic architecture is more complex for resistance to Septoria tritici blotch than to Fusarium head blight in Central European winter wheat. BMC genomics 16:430. doi: 10.1186/s12864-015-1628-8
Mirdita, V., He, S., Zhao, Y., Korzun, V., Bothe, R., Ebmeyer, E., et al. (2015a). Potential and limits of whole genome prediction of resistance to Fusarium head blight and Septoria tritici blotch in a vast central european elite winter wheat population. Theor. Appl. Genet. 128, 2471–2481. doi: 10.1007/s00122-015-2602-1
Money, D., Gardner, K., Migicovsky, Z., Schwaninger, H., Zhong, G., and Myles, S. (2015). LinkImpute: fast and accurate genotype imputation for nonmodel organisms. G3 5, 2383–2390. doi: 10.1534/g3.115.021667
Pembleton, L. W., Drayton, M. C., Bain, M., Baillie, R. C., Inch, C., Spangenberg, G. C., et al. (2016). Targeted genotyping-by-sequencing permits cost-effective identification and discrimination of pasture grass species and cultivars. Theor. Appl. Genet. 129, 991–1005. doi: 10.1007/s00122-016-2678-2
Petersen, S., Lyerly, J. H., Mckendry, A. L., Islam, M. S., Brown-Guedira, G., Cowger, C., et al. (2017). Validation of fusarium head blight resistance QTL in US winter wheat. Crop Sci. 57, 1–12. doi: 10.2135/cropsci2015.07.0415
Poland, J. A., Brown, P. J., Sorrells, M. E., and Jannink, J. L. (2012). Development of high-density genetic maps for barley and wheat using a novel two-enzyme genotyping-by-sequencing approach. PLoS One 7:e32253. doi: 10.1371/journal.pone.0032253
Pozniak, C. J., Clarke, J. M., and Clarke, F. R. (2012). Potential for detection of marker–trait associations in durum wheat using unbalanced, historical phenotypic datasets. Mol. Breed. 30, 1537–1550. doi: 10.1007/s11032-012-9737-4
Pumphrey, M. O., Bernardo, R., and Anderson, J. A. (2007). Validating the Fhb1 QTL for Fusarium head blight resistance in near-isogenic wheat lines developed from breeding populations. Crop Sci. 47, 200–206. doi: 10.2135/cropsci2006.03.0206
Puri, K. D., and Zhong, S. (2010). The 3ADON population of Fusarium graminearum found in north dakota is more aggressive and produces a higher level of DON than the prevalent 15ADON population in spring wheat. Phytopathology 100, 1007–1014. doi: 10.1094/PHYTO-12-09-0332
R Development Core Team (2018). R: a Language and Environment for Statistical Computing. Available at: http://www.r-project.org (accessed February 6, 2018).
Rawat, N., Pumphrey, M. O., Liu, S., Zhang, X., Tiwari, V. K., Ando, K., et al. (2016). Wheat Fhb1 encodes a chimeric lectin with agglutinin domains and a pore-forming toxin-like domain conferring resistance to Fusarium head blight. Nat. Genet. 48, 1576–1580. doi: 10.1038/ng.3706
Rutkoski, J., Benson, J., Jia, Y., Brown-Guedira, G., Jannink, J. L., and Sorrells, M. (2012). Evaluation of genomic prediction methods for Fusarium head blight resistance in wheat. Plant Genome 5, 51–61. doi: 10.3835/plantgenome2012.02.0001
Schweiger, W., Steiner, B., Vautrin, S., Nussbaumer, T., Siegwart, G., Zamini, M., et al. (2016). Suppressed recombination and unique candidate genes in the divergent haplotype encoding Fhb1, a major Fusarium head blight resistance locus in wheat. Theor. Appl. Genet. 129, 1607–1623. doi: 10.1007/s00122-016-2727-x
Stack, R. W., and McMullen, M. P. (1995). A visual scale to estimate severity of Fusarium head blight in wheat. ND State Univ. Ext. Serv. Bull. 1095.
Steiner, B., Buerstmayr, M., Michel, S., Schweiger, W., Lemmens, M., and Buerstmayr, H. (2017). Breeding strategies and advances in line selection for Fusarium head blight resistance in wheat. Trop. Plant Pathol. 42, 165–174. doi: 10.1007/s40858-017-0127-7
Steiner, B., Lemmens, M., Griesser, M., Scholz, U., Schondelmaier, J., and Buerstmayr, H. (2004). Molecular mapping of resistance to Fusarium head blight in the spring wheat cultivar Frontana. Theor. Appl. Genet. 109, 215–224. doi: 10.1007/s00122-004-1620-1
Su, Z., Jin, S., Zhang, D., and Bai, G. (2018). Development and validation of diagnostic markers for Fhb1 region, a major QTL for Fusarium head blight resistance in wheat. Theor. Appl. Genet. 131, 2371–2380. doi: 10.1007/s00122-018-3159-6
Von der Ohe, C., Ebmeyer, E., Korzun, V., and Miedaner, T. (2010). Agronomic and quality performance of winter wheat backcross populations carrying non-adapted Fusarium head blight resistance QTL. Crop Sci. 50, 2283–2290. doi: 10.2135/cropsci2010.03.0135
Waldron, B. L., Moreno-Sevilla, B., Anderson, J. A., Stack, R. W., and Frohberg, R. C. (1999). RFLP mapping of QTL for fusarium head blight resistance in wheat. Crop Sci. 39, 805–811. doi: 10.2135/cropsci1999.0011183X003900030032x
Wang, H., Smith, K. P., Combs, E., Blake, T., Horsley, R. D., and Muehlbauer, G. J. (2012). Effect of population size and unbalanced data sets on QTL detection using genome-wide association mapping in barley breeding germplasm. Theor. Appl. Genet. 124, 111–124. doi: 10.1007/s00122-011-1691-8
Wang, R., Chen, J., Anderson, J. A., Zhang, J., Zhao, W., Wheeler, J., et al. (2017). Genome-wide association mapping of Fusarium head blight resistance in spring wheat lines developed in the pacific northwest and CIMMYT. Phytopathology 107, 1486–1495. doi: 10.1094/PHYTO-02-17-0073-R
Wang, S., Wong, D., Forrest, K., Allen, A., Chao, S., Huang, B. E., et al. (2014). Characterization of polyploid wheat genomic diversity using a high-density 90000 single nucleotide polymorphism array. Plant Biotechnol. J. 12, 787–796. doi: 10.1111/pbi.12183
Wilcoxson, R. D., Busch, R. H., and Ozmon, E. A. (1992). Fusarium head blight resistance in spring wheat cultivars. Plant Dis. 76, 658–661.
Xue, S., Li, G., Jia, H., Xu, F., Lin, F., Tang, M., et al. (2010). Fine mapping Fhb4. a major QTL conditioning resistance to Fusarium infection in bread wheat (Triticum aestivum L.). Theor. Appl. Genet. 121, 147–156. doi: 10.1007/s00122-010-1298-5
Xue, S., Xu, F., Tang, M., Zhou, Y., Li, G., An, X., et al. (2011). Precise mapping Fhb5, a major QTL conditioning resistance to Fusarium infection in bread wheat (Triticum aestivum L.). Theor. Appl. Genet. 123, 1055–1063. doi: 10.1007/s00122-011-1647-z
Yi, X., Cheng, J., Jiang, Z., Hu, W., Bie, T., Gao, D., et al. (2018). Genetic analysis of Fusarium head blight resistance in CIMMYT bread wheat line C615 using traditional and conditional QTL mapping. Front. Plant Sci. 9:573. doi: 10.3389/fpls.2018.00573
Zhang, J. X., Jin, Y., Rudd, J. C., and Bockelman, H. E. (2008). New Fusarium head blight resistant spring wheat germplasm identified in the USDA National Small Grains Collection. Crop Sci. 48, 223–235. doi: 10.2135/cropsci2007.02.0116
Zhao, M., Leng, Y., Chao, S., Xu, S., and Zhong, S. (2018a). Molecular mapping of QTL for Fusarium head blight resistance introgressed into durum wheat. Theor. Appl. Genet. 131:1939. doi: 10.1007/s00122-018-3124-4
Zhao, M., Wang, G., Leng, Y., Wanjugi, H., Xi, P., Grosz, M. D., et al. (2018b). Molecular mapping of Fusarium head blight resistance in the spring wheat line ND2710. Phytopathology 108, 972–979. doi: 10.1094/PHYTO-12-17-0392-R
Keywords: hard red spring wheat, Fusarium head blight, genome wide association study, marker-assisted selection, genomic selection
Citation: Liu Y, Salsman E, Fiedler JD, Hegstad JB, Green A, Mergoum M, Zhong S and Li X (2019) Genetic Mapping and Prediction Analysis of FHB Resistance in a Hard Red Spring Wheat Breeding Population. Front. Plant Sci. 10:1007. doi: 10.3389/fpls.2019.01007
Received: 11 April 2019; Accepted: 18 July 2019;
Published: 06 August 2019.
Edited by:
Agata Gadaleta, University of Bari Aldo Moro, ItalyReviewed by:
Thomas Miedaner, University of Hohenheim, GermanyKarl D. Glover, South Dakota State University, United States
Copyright © 2019 Liu, Salsman, Fiedler, Hegstad, Green, Mergoum, Zhong and Li. This is an open-access article distributed under the terms of the Creative Commons Attribution License (CC BY). The use, distribution or reproduction in other forums is permitted, provided the original author(s) and the copyright owner(s) are credited and that the original publication in this journal is cited, in accordance with accepted academic practice. No use, distribution or reproduction is permitted which does not comply with these terms.
*Correspondence: Shaobin Zhong, c2hhb2Jpbi56aG9uZ0BuZHN1LmVkdQ==; Xuehui Li, eHVlaHVpLmxpQG5kc3UuZWR1