 Kusum Rana1
 Chhaya Atri2
 Javed Akhatar2
 Rimaljeet Kaur2
 Anna Goyal2
 Mohini Prabha Singh2
 Nitin Kumar2
 Anju Sharma2
 Prabhjodh S. Sandhu2
 Gurpreet Kaur2
 Martin J. Barbetti3
 Surinder S. Banga2*
- 1School of Agricultural Biotechnology, Punjab Agricultural University, Ludhiana, India
- 2Department of Plant Breeding and Genetics, Punjab Agricultural University, Ludhiana, India
- 3School of Agriculture and Environment and the UWA Institute of Agriculture, The University of Western Australia, Crawley, WA, Australia
A set of 96 Brassica juncea–Erucastrum cardaminoides introgression lines (ILs) were developed with genomic regions associated with Sclerotinia stem rot (Sclerotinia sclerotiorum) resistance from a wild Brassicaceous species E. cardaminoides. ILs were assessed for their resistance responses to stem inoculation with S. sclerotiorum, over three crop seasons (season I, 2011/2012; II, 2014/2015; III, 2016–2017). Initially, ILs were genotyped with transferable SSR markers and subsequently through genotyping by sequencing. SSR based association mapping identified six marker loci associated to resistance in both A and B genomes. Subsequent genome-wide association analysis (GWAS) of 84 ILs recognized a large number of SNPs associated to resistance, in chromosomes A03, A06, and B03. Chromosomes A03 and A06 harbored the maximum number of resistance related SNPs. Annotation of linked genomic regions highlighted an array of resistance mechanisms in terms of signal transduction pathways, hypersensitive responses and production of anti-fungal proteins and metabolites. Of major importance was the clustering of SNPs, encoding multiple resistance genes on small regions spanning approximately 885 kb region on chromosome A03 and 74 kb on B03. Five SNPs on chromosome A03 (6,390,210-381) were associated with LRR-RLK (receptor like kinases) genes that encode LRR-protein kinase family proteins. Genetic factors associated with pathogen-associated molecular patterns (PAMPs) and effector-triggered immunity (ETI) were predicted on chromosome A03, exhibiting 11 SNPs (6,274,763-994). These belonged to three R-Genes encoding TIR-NBS-LRR proteins. Marker trait associations (MTAs) identified will facilitate marker assisted introgression of these critical resistances, into new cultivars of B. juncea initially and, subsequently, into other crop Brassica species.
Introduction
Brassica juncea (2n = 36; AABB) or Indian mustard, is a premier oilseed crop of India, contributing nearly 28% of total edible oil supplies (Kumar, 2012). It is also a crop of considerable significance in China (Li et al., 2009; Yang et al., 2016), Canada (Woods et al., 1991) and more recently in Australia (Oram et al., 2005). It is an allotetraploid that arose through multiple independent hybridization events between wild forms of Brassica rapa and Brassica nigra (Burkill, 1930; Olsson, 1960; Vaughan et al., 1963; Axelsson et al., 2000; Prakash et al., 2009; Kaur et al., 2014). Traditional breeding approaches have helped to enhance crop productivity by exploiting within the species variation. However, these approaches have failed to address inherent susceptibilities of the species to the major biotic stresses. Absence of genetically characterized sources of resistance in the primary gene pool has been a major bottleneck. Of the diseases occurring on mustard, Sclerotinia sclerotiorum, the causal agent of Sclerotinia stem rot, is particularly damaging (Purdy, 1979; Bolton et al., 2006; Saharan and Mehta, 2008). It causes extensive yield losses world-wide including India (Shivpuri et al., 2000; Ghasolia et al., 2004), Australia (Kirkegaard et al., 2006), Germany (Horning, 1983), Canada (Morrall et al., 1976), United Kingdom (Hims, 1979; Rawlinson and Muthyala, 1979), and China (Li et al., 1999). While available cultural and chemical controls can reduce the severity of Sclerotinia stem rot, management practices are often inconsistent and do not provide effective and reliable control of Sclerotinia stem rot (Barbetti et al., 2014, 2015). Host resistance offers the only economic and sustainable method for managing this disease.
Partial resistance against this pathogen has been observed in certain germplasm lines of sunflower (Godoy et al., 2005), beans (Gilmore et al., 2002), peas (Porter et al., 2009), peanut (Cruickshank et al., 2002), and soybean (Hartman et al., 2000). Incomplete resistance was also identified in some Brassica napus and, to a lesser extent in B. juncea, genotypes from China (Li et al., 1999, 2006, 2009; Zhao et al., 2004; You et al., 2016), Australia (Li et al., 2006, 2009; You et al., 2016), and India (Singh et al., 2008, 2010; Goyal et al., 2011; Uloth et al., 2013; You et al., 2016). Resistance was generally quantitative and intermediate in its expression. Genetic investigations involving bi-parental populations and germplasm assemblages have helped to identify minor quantitative trait loci (QTL) with small effects, but these explained only a fraction of available variation. Significant involvement of homoeologous duplicated regions in the genetic control of quantitative resistance against Sclerotinia stem rot has been reported in B. napus (Fomeju et al., 2014; Gyawali et al., 2016; Behla et al., 2017). Other studies included attempts to understand defensive responses of the host; for example, those of B. napus to Sclerotinia infection by performing transcriptome (Zhao et al., 2009; Wei et al., 2016) or microarray (Zhao et al., 2007) analysis. Transcriptomics suggested activation of the plant immune system, and a possible role for sulfur metabolism and/or glucosinolates in the response to S. sclerotiorum attack. Genes specific to the resistant genotype, especially those relating to one or more specific defense responses (Anderson et al., 2018), the jasmonic acid pathway, lignin biosynthesis, signal transduction or encoding transcription factors, are known to be up-regulated (Zhao et al., 2007; Wei et al., 2016).
Identifying sources of resistance in Brassica is challenging as there is considerable variation in plant host responses from even small changes in environmental conditions, from using different disease screening techniques, and also as a result of the variation in aggressiveness across Sclerotinia sclerotiorum isolates (Li et al., 2007; Ge et al., 2012). There is a broad convergence of opinion for the need to enhance the level of genetic diversity present within Brassica crops to manage this pathogen (Barbetti et al., 2011, 2012; Uloth et al., 2013). Therefore, attempts have been made by our group to exploit alternate alleles from the related species in the family Brassicaceae (Banga and Banga, 2016). For the current studies, we selected a wild species, Erucastrum cardaminoides, that grows wild under the conditions of environmental stress in the Micronesian region (Warwick et al., 2000). Its history of evolution makes it a likely source of gene(s) against many biotic stresses, including Sclerotinia stem rot. In addition, this species is genetically close to Brassica (Gomez-Campo et al., 1999) as was confirmed by the cytogenetic analysis of intergeneric hybrids between E. cardaminoides with B. rapa and with B. nigra (Chandra et al., 2004). The synthetic alloploids between E. cardaminoides and B. rapa also showed higher degree of resistance to many biotic stresses, when compared with mustard checks. This encouraged us to transfer E. cardaminoides resistances to B. juncea by developing B. juncea–E. cardaminoides introgression lines (ILs) (Chandra et al., 2004; Garg et al., 2010). To facilitate that, we first developed a synthetic allotetraploid (2n = 38; AAEE) by hybridizing E. cardaminoides and B. rapa, followed by chromosome doubling. Strategy of using synthetic allotetraploid as a bridging species was followed as we had previously failed to produce a fertile hybrid between E. cardaminoides (2n = 18; EE) and B. juncea (2n = 36; AABB). The allotetraploid (2n = 38; AAEE) could be hybridized with B. juncea (2n = 36; AABB) to develop a F1 hybrid (2n = 37; AABE). Resultant plants were partially fertile and could be backcrossed with B. juncea to produce BC1 progeny, with {AAB (8)B(1–8) E (1–9)} as the likely chromosome configuration. Partially fertile BC1 plants were then bud pollinated to generate over 350 BC1S1 plants. These plants varied for pollen grain fertilities (45–89%) and chromosome numbers. Genome size analysis through flow cytometry and meiotic analysis of BC1S1 plants allowed us to identify segregants with apparent genome size equivalence with B. juncea and meiotic configuration of 18II + 1-4I. Of these, 18II may suggest a complete recovery of B. juncea with addition of 1–4 univalent from E. cardaminoides. Such a scenario is theoretically possible because chromosomes in monosomic dose are known to move asymmetrically toward opposite poles during meiotic anaphase. In extreme cases, all the univalent of a genome can end up at the same pole. Production of unreduced gametes is fairly common in Brassica aneuploids. Over 150 BC1S1 plants were then selfed, following single seed descent method. Three cycles of selfing, selection for high pollen grain fertility and cytogenetic analysis helped us to select about 100 plants with euploid chromosome number (2n = 36) in BC1S4 generation. We avoided second cycle of backcrossing with B. juncea to prevent expedited elimination of E genome chromosomes. Retention of such monosomic addition chromosomes over more cycles of selfing may help to improve chances of recombination between crop (A/B) and wild (E) genomes. Strict selection regime followed resulted in the availability of a relatively smaller number (<100) of stable B. juncea–E. cardaminoides ILs with higher fertility and euploid chromosome number for genotyping in BC1S6. Smaller sample size of ILs is always a limitation in wide hybridization programs.
Although association mapping is now considered a method of choice to resolve quantitative variation (Risch and Merikangas, 1996; Nordborg and Tavare, 2002), it is rarely used to understand the introgressed variation as attempted in the current study. ILs, in the present context, are fully fertile with euploid chromosome number and have stabilized in form of translocation homozygotes. Size of introgressed segment was possibly the defining factor in ILs and physical linkage strongly influenced linkage disequilibrium (LD) between molecular marker(s) and causative polymorphisms. This provided the genetic basis for association mapping of genes underlying resistance responses. The extent of LD of linked markers in the entire ILs set, was significantly higher than that of unlinked markers. This manuscript documents outcomes from screening B. juncea–E. cardaminoides ILs against a virulent isolate of S. sclerotiorum and subsequent genome wide association mapping to identify the genomic regions that are responsible for this resistance. Identified marker candidates will allow rapid introgression of these critical resistances, into new cultivars of B. juncea initially and, subsequently, into the many other crop and horticultural Brassica species.
Materials and Methods
Plant Materials
A total of 96 B. juncea–E. cardaminoides ILs were developed previously through wide hybridization between B. juncea and E. cardaminoides as described earlier.
Chromosome Preparation and in situ Hybridization
We followed the method for preparation of chromosome spreads as described in Rana et al. (2017). To prepare species specific genomic in situ hybridization (GISH) probes, purified DNA of B. cardaminoides and, B. nigra and B. juncea were extracted using the DNeasy plant mini kit (Qiagen) as per manufacturer’s specifications. Genomic DNA of E. cardaminoides was labeled with rhodamine-5-dUTP dye (red color). DNA of B. nigra was labeled with fluorescein-12-dUTP dye (green) using a nick translation kit (Roche, Germany). We followed a two-step hybridization to perform GISH as described earlier (Rana et al., 2017). Visualization was carried out with Zeiss fluorescent microscope (ImagerZ2 AX10). Digital images were captured using Isis® software. Images were cropped and optimized with Image J using only functions affecting the whole image.
Screening of ILs for Resistance Responses to S. sclerotiorum Inoculation
For field evaluations, ILs were planted in a randomized complete block design, with 20 plants in paired rows of 2 m length with inter-row spacing 30 cm. The phenotypic screening was carried out in two replications. Foggers (with one fogger per 9 m2) were used to maintain high humidity for disease development, operating 2–3 times a day for 15 min each. Phenotyping of ILs for their resistance responses was carried out during 2011–2012 (Season I), 2014–1015 (Season II), and 2016–2017 (Season III). Stem inoculations were carried out by using isolate PAU-4, an aggressive and virulent strain of S. sclerotiorum collected from infested Brassica fields at Punjab Agricultural University, Ludhiana, India. PAU-4 is a known highly virulent isolate on B. juncea (Rana et al., 2017). A sclerotium was first surface sterilized, cultured and sub-cultured using standard procedures (Clarkson et al., 2003; Li et al., 2006). The parents, viz. the recipient (B. juncea cv. RLC-1) as well as the donor (E. cardaminoides), were used as susceptible and resistant checks, respectively. The stem inoculation method (Buchwaldt et al., 2005; Bradley et al., 2006) was used for disease inoculation. The ILs was evaluated for disease incidence and development at 4–5 weeks post-inoculation. Ten plants per genotype per replication were scored for disease incidence by measuring stem lesion lengths according to the method described by Li et al. (2006, 2007). The resistance responses of ILs were categorized into five classes, based on stem lesion length viz., highly resistant (HR); (0 < 2.5 cm), resistant (R); (2.5 < 5.0 cm), moderately resistant (MR); (5.0 < 7.5 cm), susceptible (S); (7.5 < 10.0 cm), and highly susceptible (HS); (>10.0 cm) as categorized earlier by Garg et al. (2010). Analysis of variance (ANOVA) was undertaken and standard deviation and standard errors estimated using SAS software (SAS Institute Inc. [SAS], 2013).
DNA Extraction
A total of 96 ILs comprising all five disease expression categories (HR, R, MR, S and HS) were used for molecular profiling. DNA was harvested from young leaves with minor modifications of CTAB (Cetyltrimethylammonium Bromide) standard procedure (Doyle and Doyle, 1990). Isolated DNA was further digested with RNase at 37°C for 1 h. DNA was quantified by NanoDrop® 2000 spectrophotometer (Thermo ScientificTM, Wilmington, DE, United States) and for purity by assessing the OD260/OD280 ratio and Qubit® 2.0 flurometer (Thermo ScientificTM, Wilmington, DE, United States) quantitation to measure DNA concentration. DNA samples with OD260/OD280 ratio of 1.8–2.0 and total amount >1.5 ug were qualified for library construction.
SSR Genotyping
A total of 96 ILs, along with resistant and susceptible parents, were first genotyped by using 100 polymorphic SSR markers. These markers were identified as transferable based on studies involving over 650 A and B genome specific markers (Kim et al., 2009; Lowe et al., 2004). Sequences of 48 B-genome specific SSRs were obtained under MTA from Isobel Parkin (Agriculture and Agri-Food, Canada). PCR reactions were performed in a 384-well Applied Biosystems thermocycler (Model EN61328). Amplified DNA product was fractioned using an automated high-throughput electrophoresis system (Caliper Lab Chip GX version 3.0.618.0, Caliper Life Science, United States). Allelic polymorphism of all markers was recorded and mapping positions were inferred from published data (Lowe et al., 2002, 2004; Kim et al., 2009).
Genotyping by Sequencing
A smaller set of 84 ILs was genotyped by sequencing (GBS) (Elshire et al., 2011). Genomic services were outsourced (Novogene, Hong Kong). For this, high quality DNA of each sample was digested with appropriate combination of restriction enzymes based on in silico evaluation. This step was followed by several rounds of PCR amplification. Samples were then individually pooled and size-selected for the required fragments to complete the library construction. High quality libraries with appropriate insert sizes were then used for pair-end sequencing on Illumina® HiSeq platform, with the read length of 150 bp at each end. The sequences and corresponding sequencing quality information were stored in a FASTQ file. The adapter sequences were removed from raw reads using the software Cutadapt (Martin, 2011). The available genome sequence of B. juncea v1.51 (Yang et al., 2016) was used for reference based alignments of whole genome sequences (25×) from the four most prominent ILs (>25×), using software bowtie2 (Langmead and Salzberg, 2012). Initially, one introgression line was aligned into the reference genome and SNP called using the NGSEP-GBS pipeline (Duitama et al., 2014). Total SNPs were replaced in genome reference using a perl script, pseudomaker.pl implemented in SEG-Map (Zhao et al., 2010) to construct the first step mock-up pseudomolecules, which were then used as a reference for next ILs. This process was repeated four times to construct final mock-up reference for alignment of sequence tags. Identification of SNPs was carried out by using NGSEP-GBS pipeline (Duitama et al., 2014) after aligning the paired end reads of 84 introgressed lines on final mock-up reference genome. The resulting marker dataset comprised 30,863,034 SNPs. These were then filtered to include only quality SNPs for further analysis. Filtering parameters were: minimum mapping quality (30), minor allele frequency (0.1), only bi-allelic SNPs, minimum number of samples genotyped (65), maximum observed heterozygosity (30) and maximum missing calls (30%) were used for finding putative SNPs. After filtering, 78,578 SNPs were identified and imputed using fcgene and Beagle (Browning and Browning, 2016) software.
Association Mapping Based on SSR Genotyping
The normalization of phenotypic data was done by using PBTools software2 in R-Package version 1.5 (R Core Team, 2013). The marker trait associations (MTAs) were identified by using two models executed in TASSEL version 2.1 (Bradbury et al., 20073). GLM (generalized linear model) and MLM (mixed linear model) models were used. Bayesian model-based software, STRUCTURE version 2.2 (Pritchard et al., 2000), was used to determine the population structure by using multi-locus (SSR) genotypic data. Resultant Q-matrix was used as a covariate during association mapping analysis to reduce the bias from population structure. Association mapping was implemented in TASSEL software version 2.1 (Bradbury et al., 2007), measuring the non-random association between marker alleles from different loci (Zhu et al., 2008). Squared correlation coefficients between marker-trait data (R2 values) and associated probabilities were calculated and converted into –log10(P) values. The associated values are calculated with a false discovery rate (FDR) of 0.09 (Storey and Tibshirani, 2003) to reduce the false marker-trait associations. LD, also known as gametic phase disequilibrium, was established between markers (Flint-Garcia et al., 2003). Annotation, or gene prediction study, of significant markers was carried out using MEGANTE software (Numa and Itoh, 2014)4.
Genome-Wide Association Analysis (GWAS) Based on SNP Genotyping
For genome-wide association analysis (GWAS), resistance responses (in terms of lesion length) were first converted into rank data and then transformed to log(x) for three crop seasons. These were also pooled over seasons. A principal component analysis (PCA) was performed across the introgressed lines to identify population stratification by MVP-GWAS tool. We used the imputed dataset of 78,578 SNP markers to calculate the PCs. First three components showed maximum variance. MVP tool5 was used for marker trait association with two different models, MLM and Farm CPU. GWAS were performed using MLM association accounting for kinship, and GLM and Farm CPU were selected with PCs as covariate in MVP tool. R software package “adegenet”6 was used for applying discriminant analysis of principal components (DAPC) in the association analysis. After DAPC correction, first three discriminant function was used as covariate in GLM model and kinship for MLM model for association analysis by software TASSELv5.2 (Bradbury et al., 2007). Manhattan plots were generated with multi-model plotting using MVP tools.
SNP Validation
Six peak SNPs associated with trait variation were identified for validation. Primers were designed from flanking region of SNP using Primer 3 software and their thermodynamic properties were confirmed by Vector NTI. We selected eight ILs that differed for resistance responses. Genomic DNA from these test genotypes were amplified using designed primers. The PCR products were then purified and used for Sanger sequencing.
In silico Prediction of Candidate Genes
We used 25 kb flanking regions on each side of resistance associated peak SNP found to predict candidate genes using B. juncea pseudomolecules as a reference. The predicted genes and their orthologous sequences were then annotated by BLAST run against the A. thaliana database using Blast2GO v5.2.5 tool (Götz et al., 2008). Arabidopsis protein database was used for gene finding as well as blast search. Protein IDs generated allowed annotation against all flowering plant databases (NCBI). These were further enriched by the biological functions inferred from the putative Arabidopsis orthologs. We used the gene ontologies of Arabidopsis orthologs for all analysis because they are far better curated than for B. juncea. Positions of the predicted candidate genes w.r.t. the SNPs, were detected by blast searching sequences from the predicted genes against B. juncea mock-up pseudomolecules. Functions of the predicted candidate genes were verified from literature to determine their relevance for the trait in question.
Results
Introgression lines were morphologically similar to the natural B. juncea cv. RLC1, except for a delayed flowering (7–10 days) and thicker main stem (Figure 1). Pollen grain stainability was used as an index of pollen grain fertility. It ranged from 75 to 95% (Figure 1), with majority of ILs clustering around 85%. IL-43, IL-45, IL-55, IL-56, IL-63, IL-92, IL-98, IL-110, IL-111, IL-124, IL-130, IL-202, etc. had very high pollen grain fertility. Normal seed set was obtained following bag selfing. All the ILs used for the present studies were first confirmed for chromosome number expected for B. juncea (2n = 36), with 18II during meiotic metaphase. GISH studies with mitotic spreads confirmed the presence of all chromosomes of both the genomes (20A + 16B). As an example, we demonstrated large introgressions for two A genome chromosomes and one B genome chromosome in two ILs using GISH (Figure 2). The ILs and their parent genotypes were assayed for their resistance responses following stem inoculation with S. sclerotiorum. These varied across genotypes and crop seasons. Resistant ILs showed hypersensitive response or formed a very small sized lesion (Figures 3A–C). Mean lesion length in susceptible genotype, RLC1 ranged from 7.5 to 25 cm with complete stem breakage (Figures 3D–F). E. cardaminoides appeared completely resistant. Analysis of variation (Table 1) showed highly significant differences among ILs for their resistance responses. Variation across years and year × genotype interactions were also significant. Replication effects were non-significant but replication × genotype effects were significant (P < 0.05). Mean stem lesion lengths (cm) for seasons I, II and III were: 6.42 ± 0.422, 5.35 ± 0.360, and 4.12 ± 0.375, respectively. The frequency distributions were mostly normal (Figure 4), with marginal bias toward resistant class during season III. Sixty four out of 96 ILs expressed significant resistance responses in season I, 71 in season II and 39 in season III. Of 64 resistant ILs identified during season I, 8 (IL-65, IL-83, IL-155, IL-204, IL-210, IL-215, IL-413, and IL-447) showed HR with stem lesion length <2.5 cm. Twenty three ILs showed resistance with stem lesion lengths varying between 2.5 and 5.0 cm.15 ILs expressed hypersensitive response during season II. Notable among these were (IL-17, IL-27, IL-43, IL-55, IL-83, IL-92, IL-95, IL-204, IL-210, IL-229, IL-310, IL-315, IL-413, IL-421, and IL-447). During season III, IL-65, IL-83, IL-92, IL-204, IL-215, IL-900, and IL-913 showed the best responses. Overall, IL-65, IL-83, IL-IL-204, IL-215, IL447, IL-899, IL899, IL900, IL-901, IL-902, and IL-903 were consistent in their resistant reactions over three crop seasons.
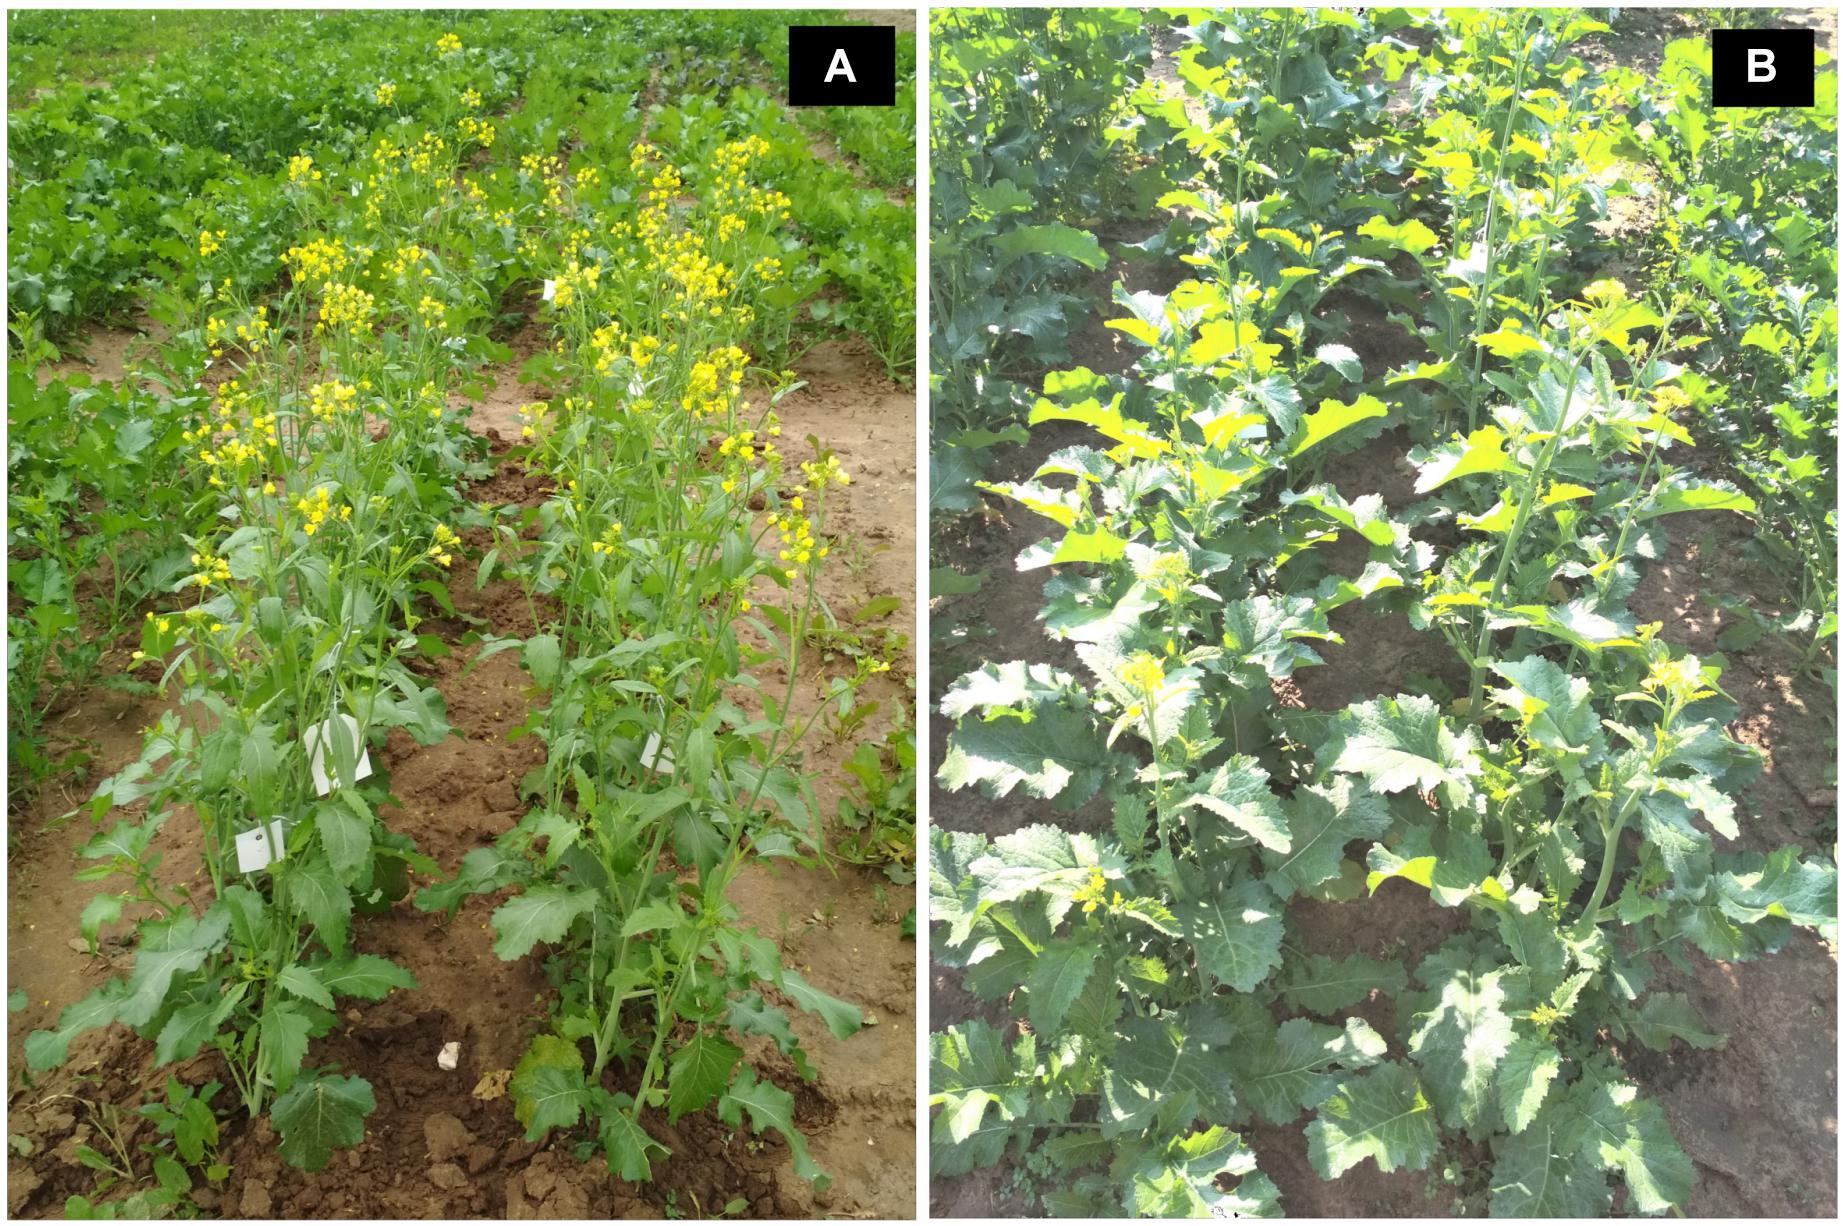
Figure 1. Field photographs showing plant morphology of (A) natural Brassica juncea as compared to (B) B. juncea–E. cardaminoides introgression line.
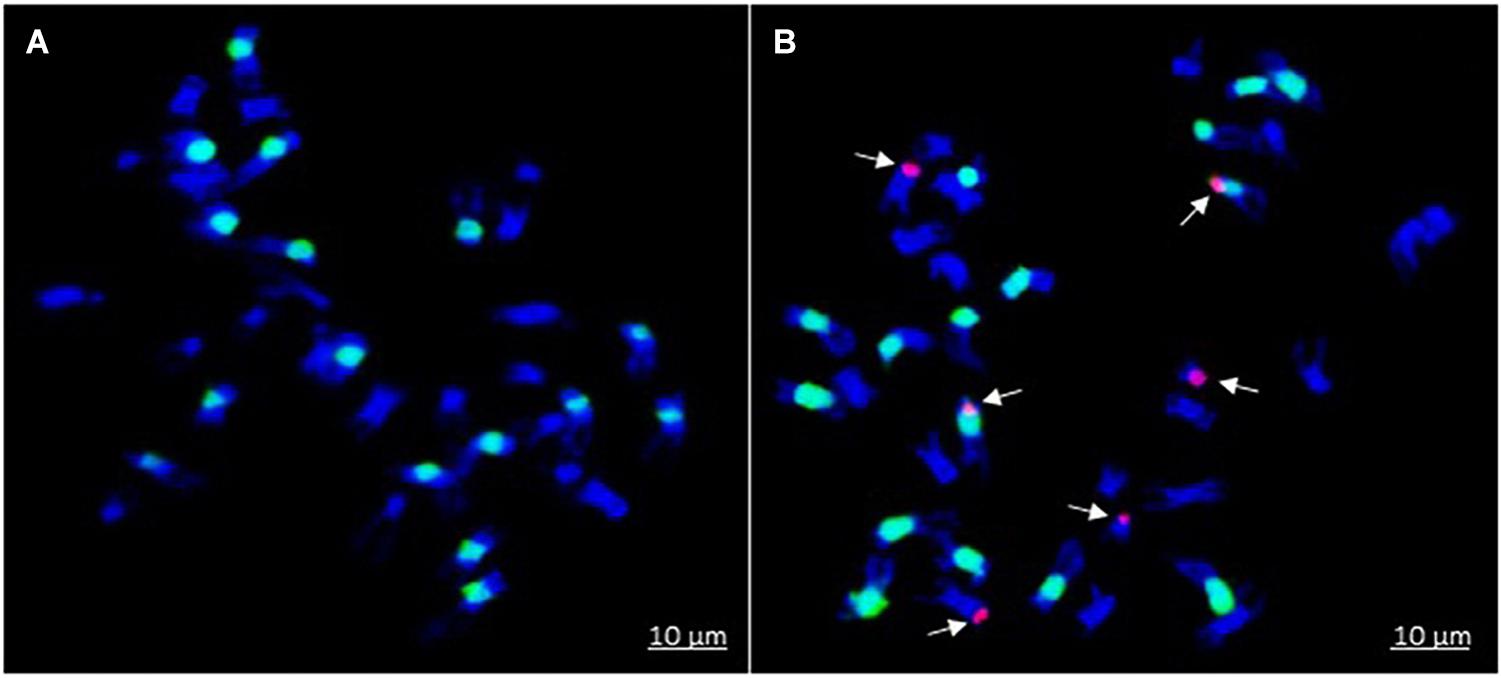
Figure 2. Genomic in situ hybridization on mitotic spreads of B. juncea–E. cardaminoides introgression lines (ILs). B. nigra B genome is painted in green (labeled with fluorescein-12-dUTP dye) while E. cardaminoides introgressions are shown in red color (labeled with rhodamine-5-dUTP dye): (A) B. juncea with no introgression; and (B) IL with segment substitutions in two chromosome pairs of A-genome and one chromosome pair of B genome.
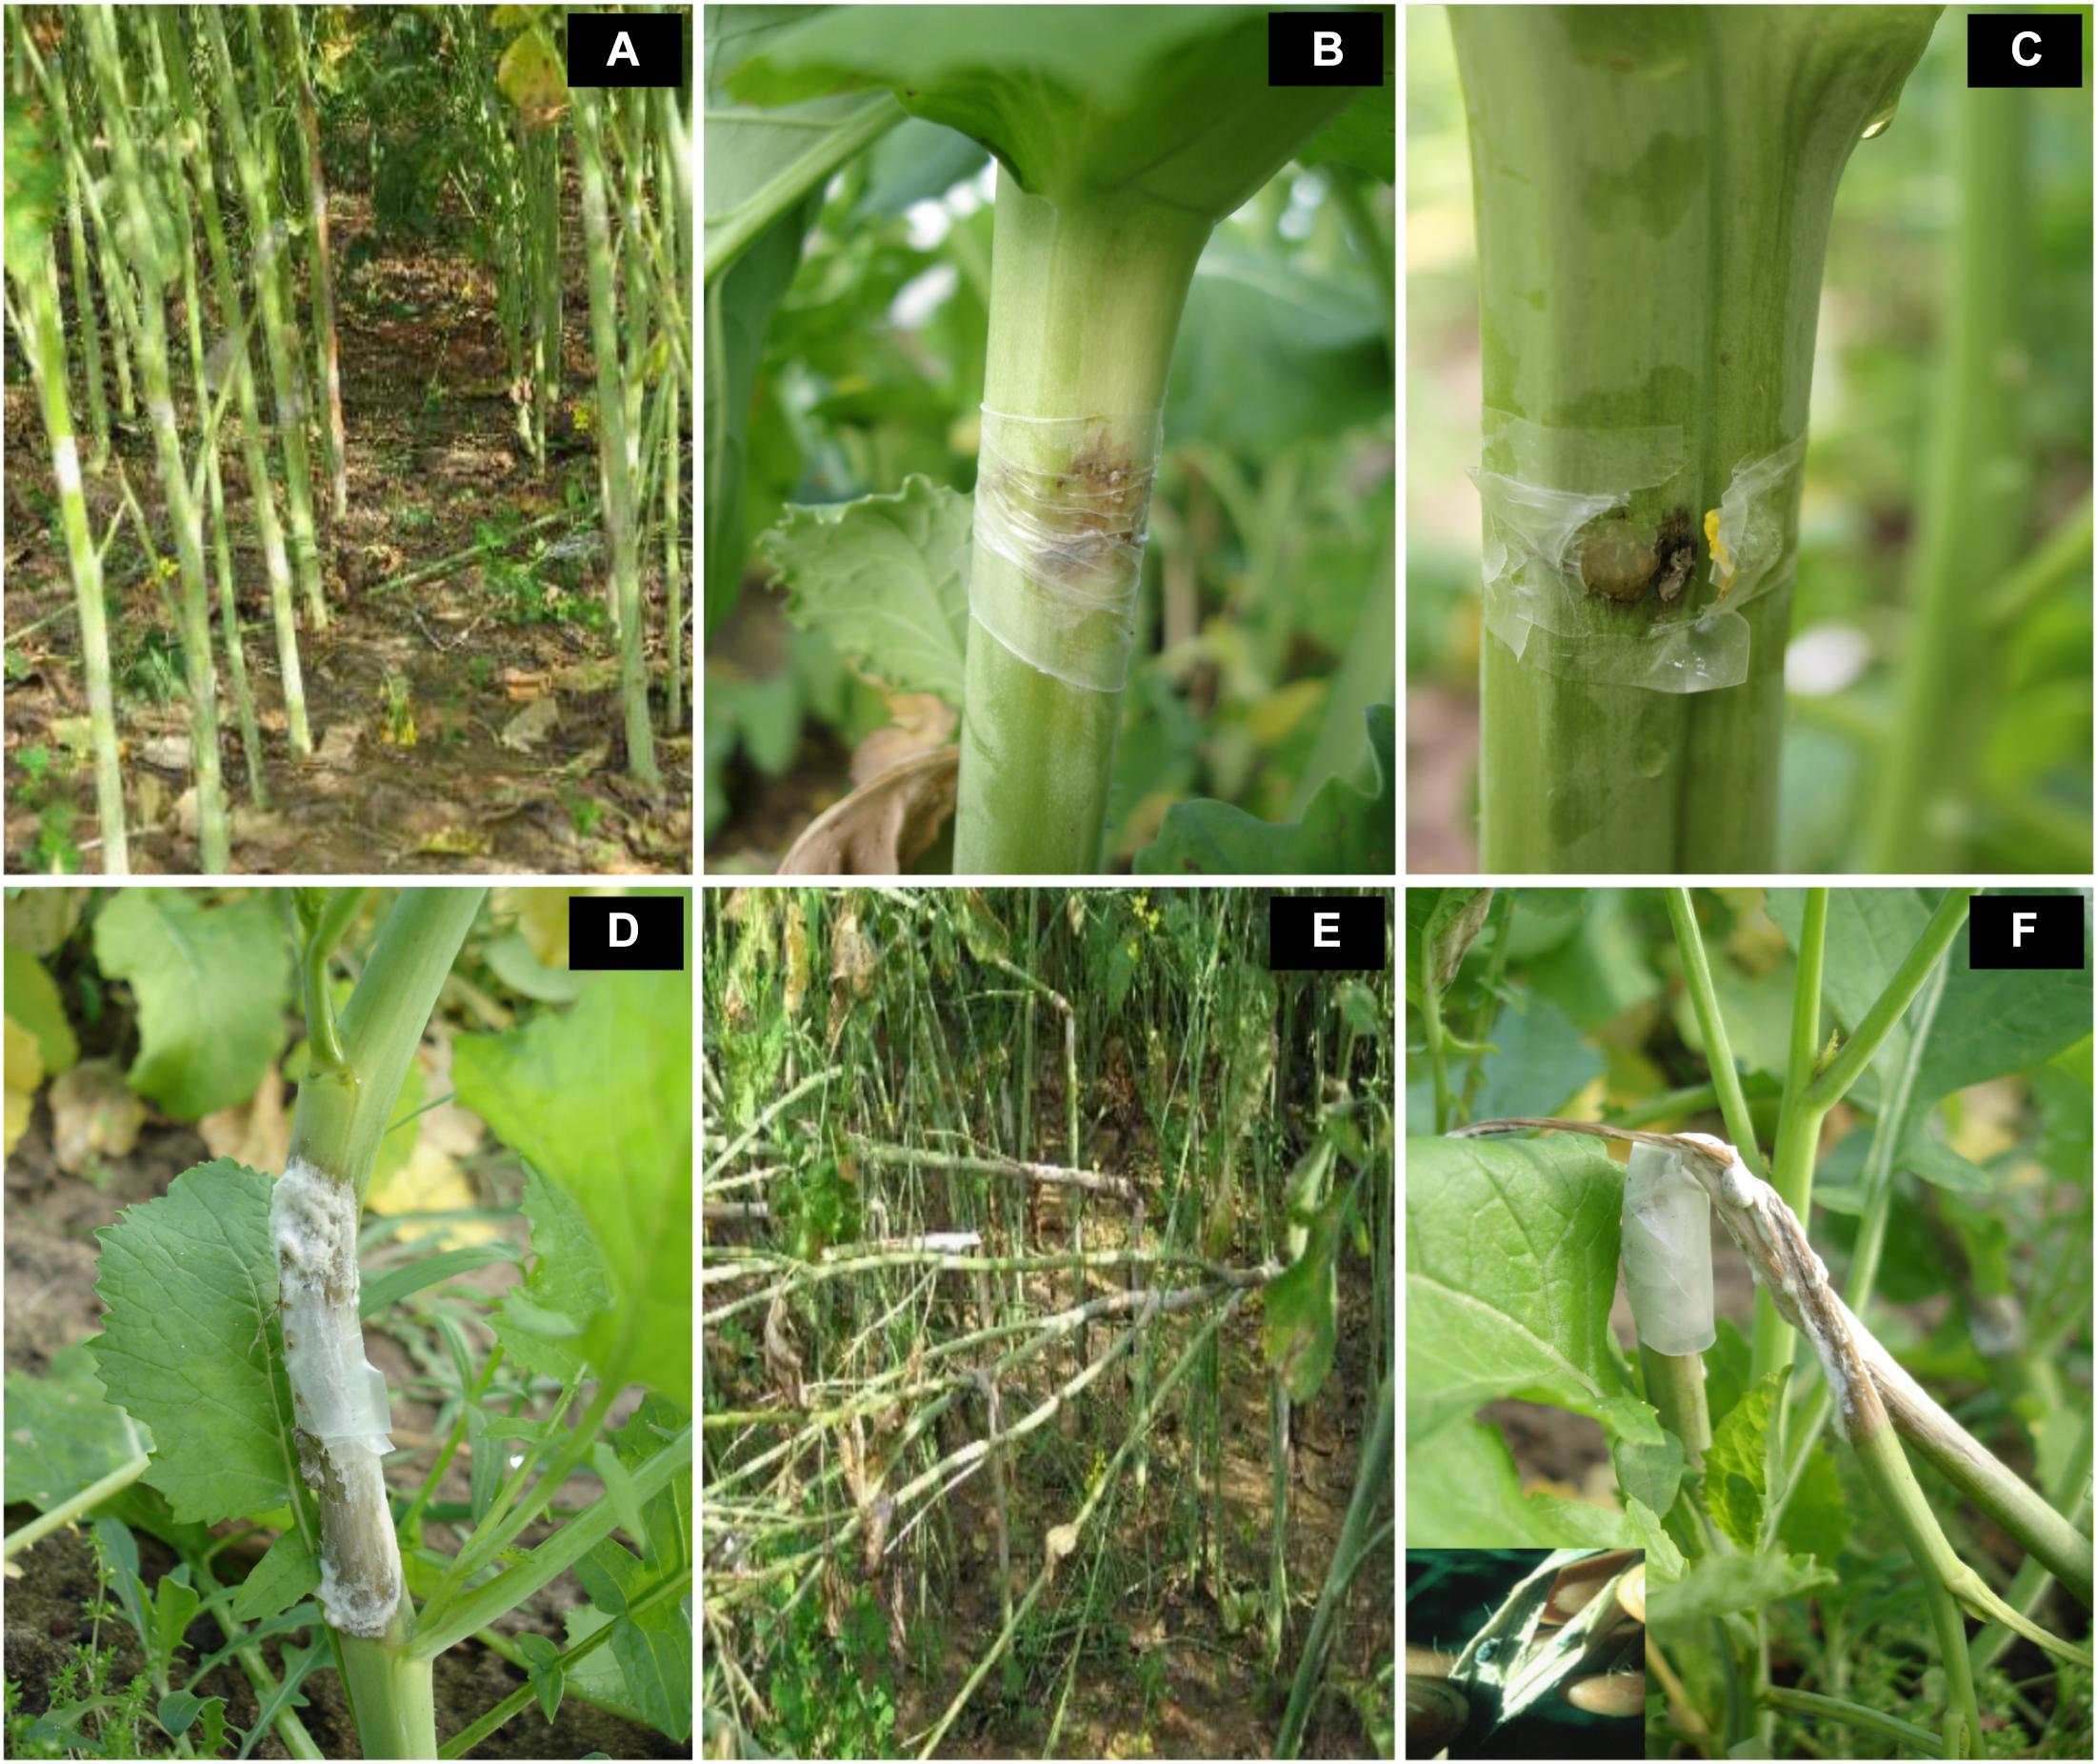
Figure 3. Variation in resistance responses of B. juncea–E. cardaminoides introgression lines, three weeks after stem inoculation with Sclerotinia sclerotiorum. (A–C) reflect highly resistant reaction. Susceptibility of recipient parent and some introgression lines was indicated by a soft watery lesion (D) or stem breakages due to very long lesions that girdled the stem (E,F).
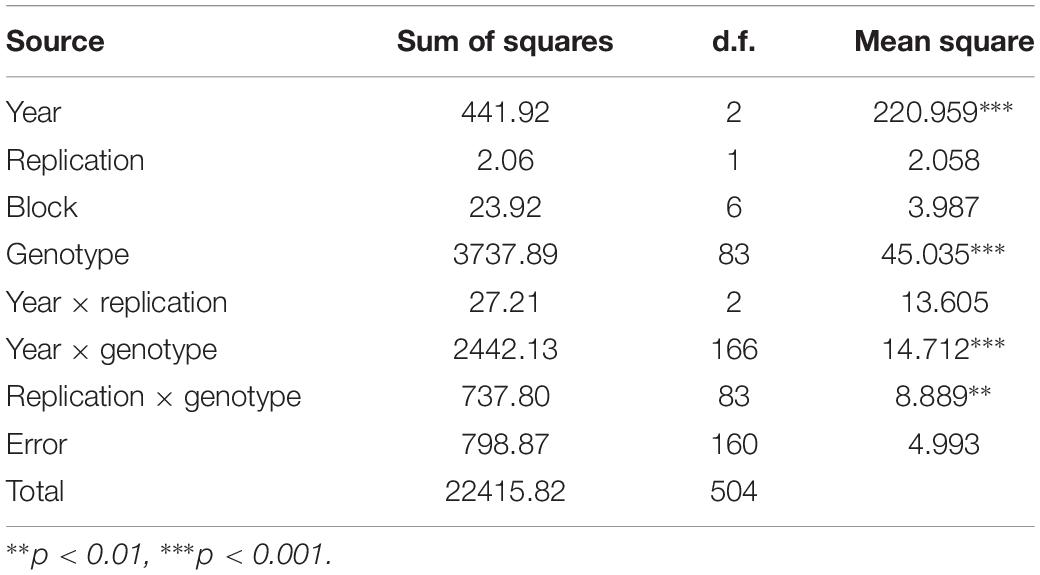
Table 1. Analysis of variance for trait stems lesion length (cm) in Brassica juncea–Erucastrum cardaminoides introgression lines.
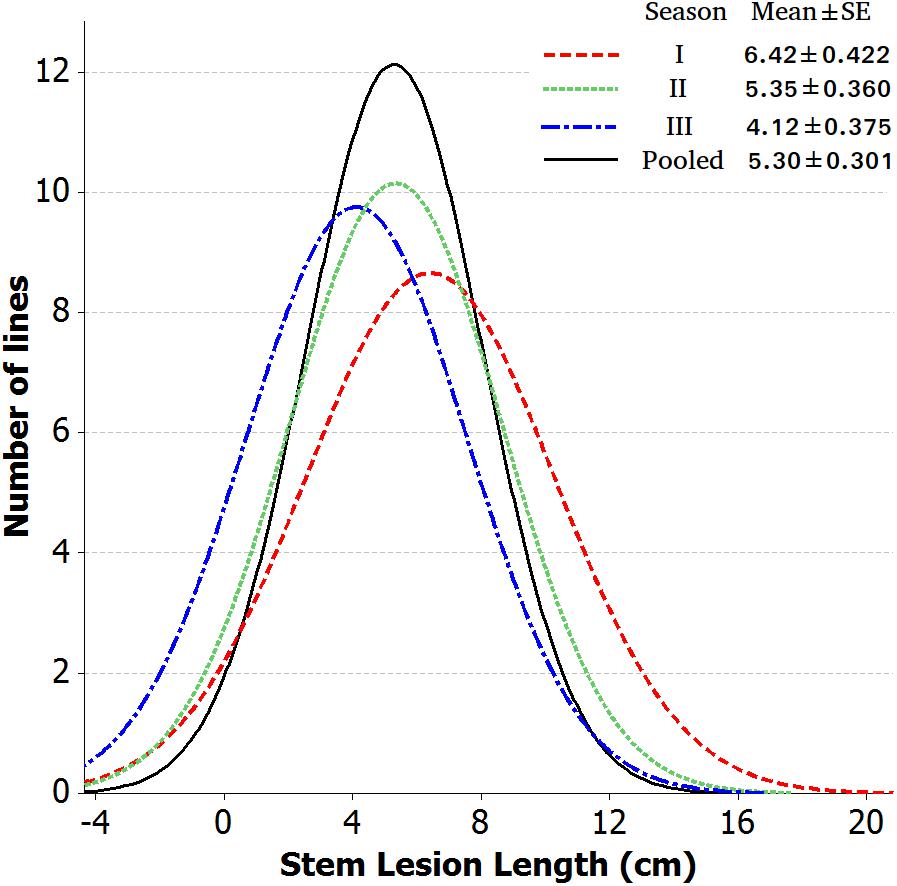
Figure 4. Frequency distribution of stem lesion length data of 84 B. juncea–E. cardaminoides introgression lines across each year and pooled.
Association Mapping Based on SSR Genotyping
This analysis was carried on the basis of resistance responses for first 2 years. Population structure was established on the basis of SSR markers. Δk was 3, suggesting the division of ILs into three groups (Supplementary Figure S1). Group I comprised of 20 ILs, whereas groups II and III included 41 and 33 ILs each, respectively. Group I mostly comprised HR or resistant (R) ILs. In contrast, groups II and III carried a mixture of MR, S, and HS ILs.
Associations between 342 marker loci and resistance against S. sclerotiorum were determined by MLM method as it was the best fitted model for the study. The markers with threshold −log10 (P) value > 2.5 were considered to be significantly associated with resistance to S. sclerotiorum. Primer sequences for significant SSRs are included as Supplementary Table S1. The Manhattan plot was constructed (Supplementary Figure S2). Significant markers associated with disease resistance were identified in the two environments (seasons I and II). A total of 14 marker loci appeared to be significantly associated (P < 0.05) with resistance to S. sclerotiorum in at least one season. These included 6 and 8 markers involving A and B genomes (Table 2). For A genome, six marker loci were detected in season I and five in season II. Four associations were detected when data were pooled over both seasons. Of these, three significant associations were common across both seasons as well as when data were pooled. In the case of the B genome, six associations were observed during season I, five in season II and 5 when data were pooled over both seasons. The range of phenotypic variation explained by marker loci in the B genome varied from 12.64 to 48.64% in season I and from 1.36 to 31.26% during season II. Further, for the gene/genome annotations study, the BAC sequences carrying significant marker loci were fed as queries into software MEGANTE7. Of the associations, involving the A genome markers, cnu_m292, cnu_m276, cnu_m418 and nia_m050 indicated association with known resistance genes. Of the associations, involving the B genome markers, Ni3H07, SB2131A, SB3751, and SJ4933 showed biological relevance.
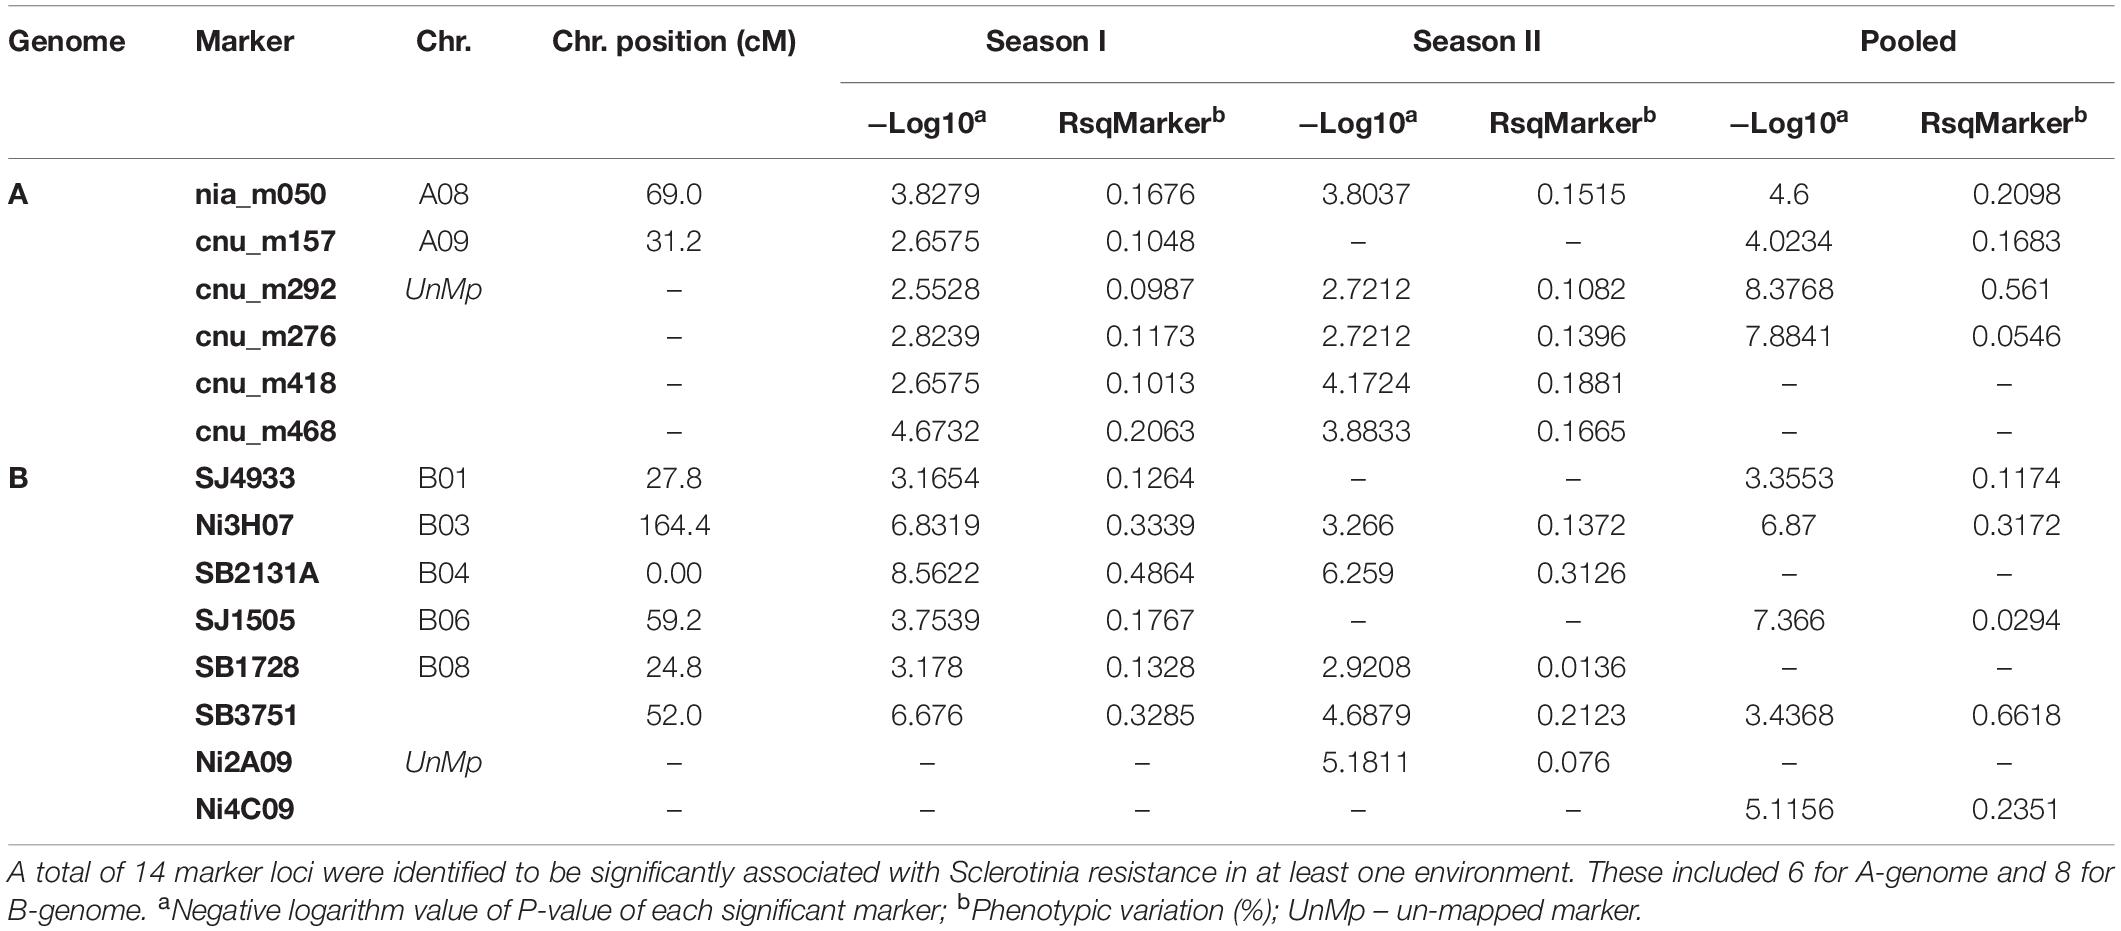
Table 2. Significant MTAs of SSR molecular markers identified against Sclerotinia stem rot.
GWAS Based on SNP Genotyping
Genome-wide association analysis was carried out by using transformed resistance rank values of 84 genotypes and 78,578 SNPs (MAF > 0.10). These markers were spread across all 18 chromosomes of B. juncea (Supplementary Figure S3). Kinship matrix and covariates (PCA) data was generated through “MVP.Data” function of the software MVP.r8. This was used to adjust for the confounding effects of population structure and kinship. Horizontal lines on top of heat map show hierarchical clustering of ILs (Figure 5A). There were three broad groups, of which first group seemed most diverse and ILs included in this group showed consistently superior resistance responses. This is shown in the heat map of resistance responses of ILs in terms of lesion length (cm) following stem inoculation with S. sclerotioum over three seasons (Figure 5B). Heat map of kinship matrix showing genetic relatedness among 84 ILs is available in Figure 5C. DAPC was implemented in R software package “Adegenet.” It also showed three clear groups (Figure 6). These broadly confirmed inferences drawn from SSR data. PC and DAPC were used as covariates in different GWAS analysis algorithms to reduce false positives by minimizing the effects of population stratification.
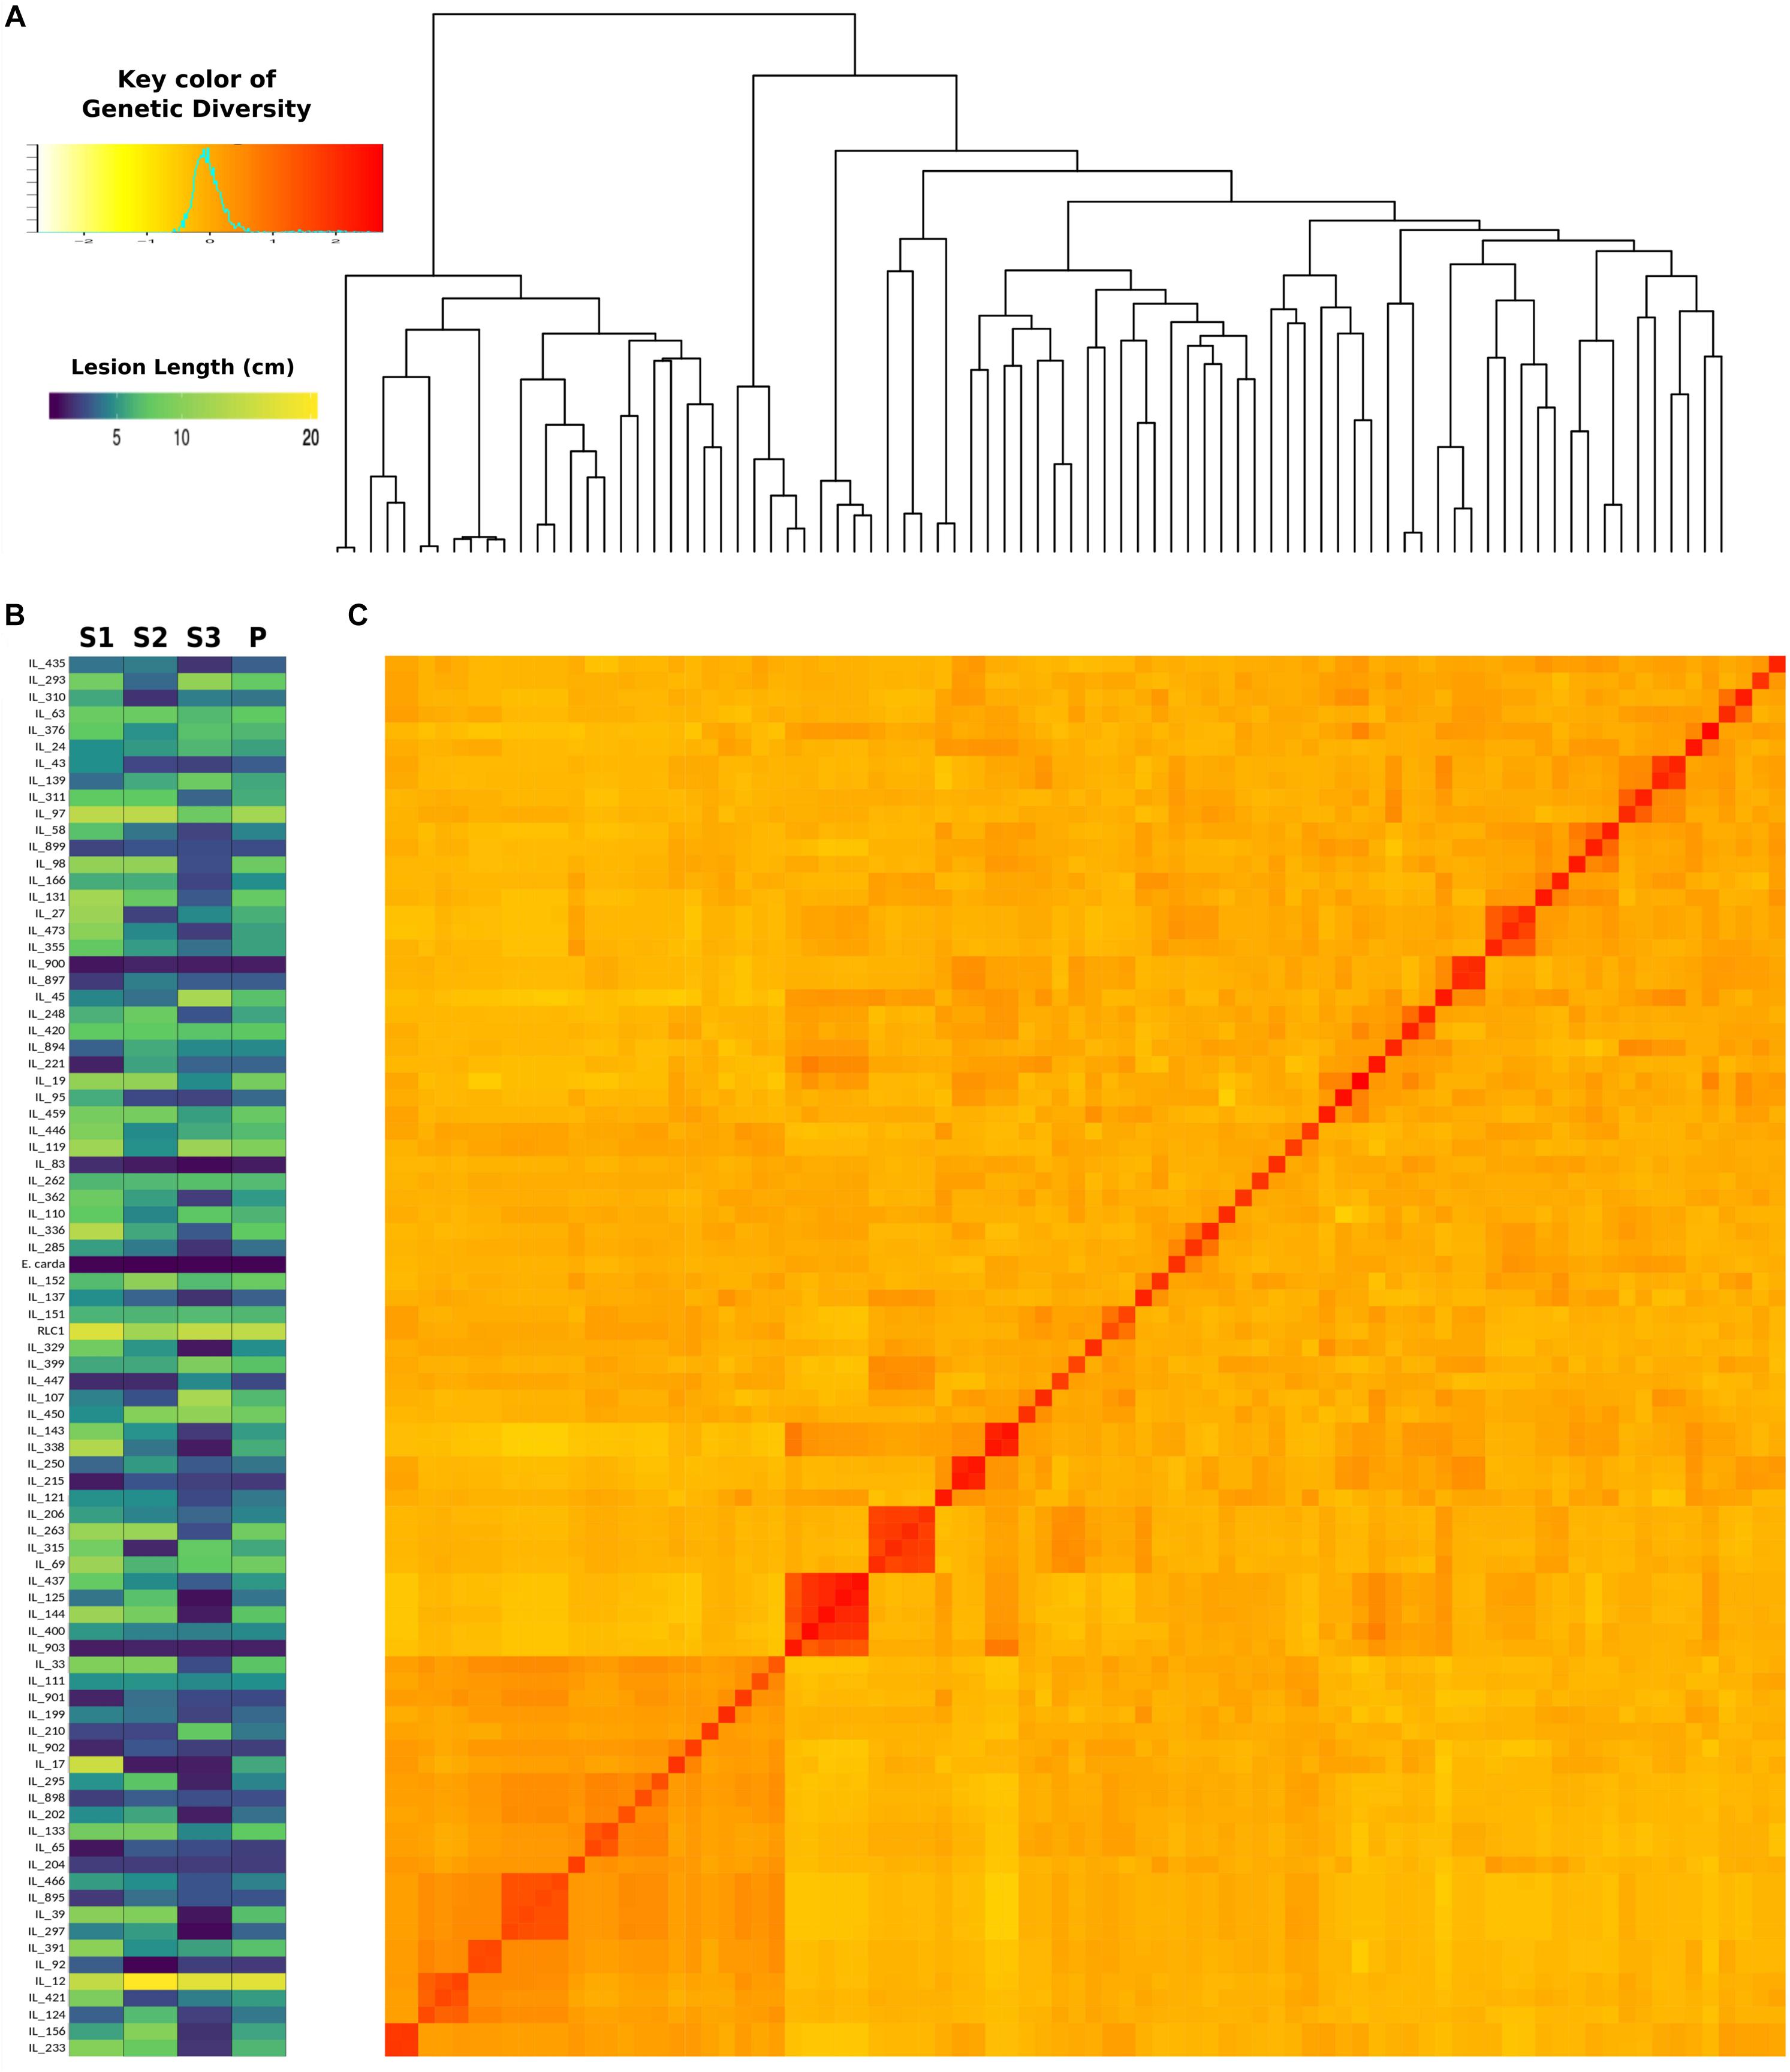
Figure 5. Heatmap showing resistance responses of 84 B. juncea–E. cardaminoides ILs, susceptible parent (RLC1) and resistance donor species E. cardaminoides over three crop seasons (A), Hierarchical clustering of ILs based on their SNP genotypes (B), kinship heatmap based on genetic distance between ILs (C).
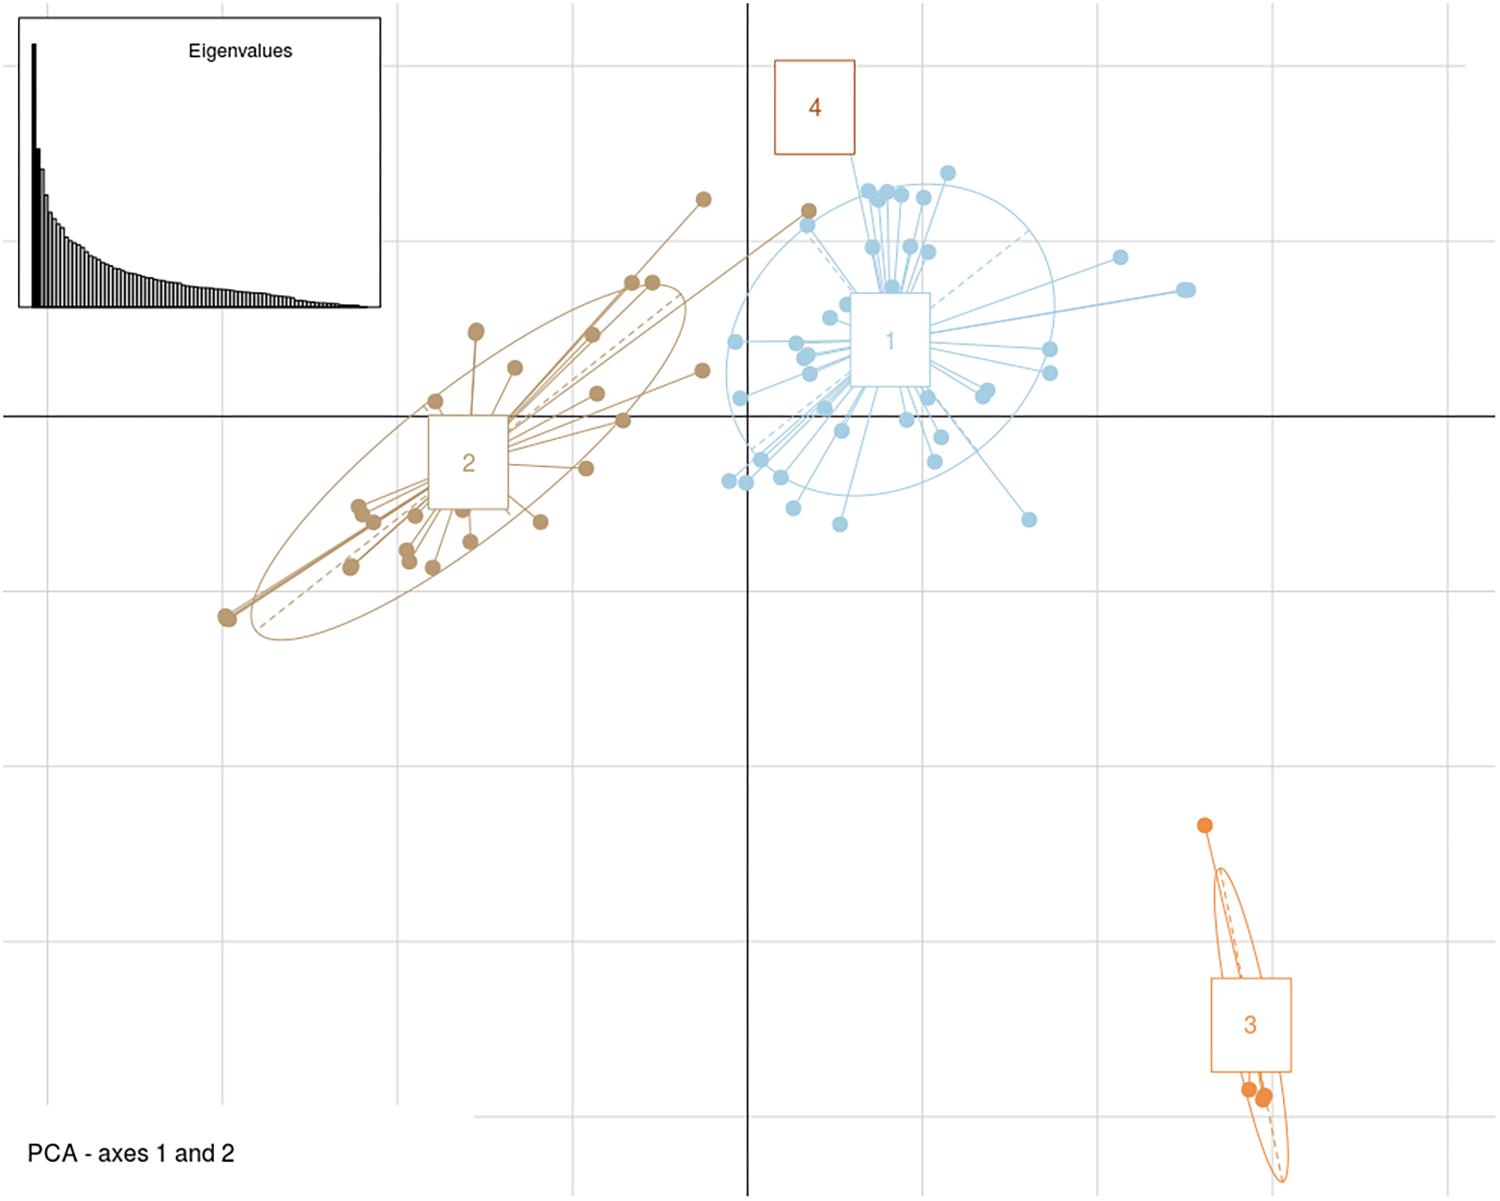
Figure 6. Genetic structure patterns of 84 B. juncea–E. cardaminoides introgression lines distributed into 4 groups after correction for discriminant analysis of principal components (DAPC).
GLM, MLM, and FarmCPU methods were implemented in the software MVP.r. Software default settings were primarily used to identify MTAs. Analysis yielded a large number of significant findings. These were subsequently confirmed using alternate algorithms as implemented in tassel and adegenet. We considered only those MTAs-that were consistent across at least two algorithms. Marker positions were same in primary GWAS software, the validating algorithm and the season. Also included were markers consistently detected over at least two seasons (Table 3 and Figure 7). Blast2GO Pro was used for annotating 50 kb regions (25 kb each on both side of identified SNP). In total, 55 SNPs were significantly (P < 0.001) associated with resistance to Sclerotinia stem rot. MTAs were mainly located on chromosomes A03, A06, B03 and B04.
Table 3. The list of significant SNPs identified in consensus over seasons and different algorithms along with SNPs rich annotation information.
Figure 7. Manhattan plots after GWAS analysis based on 78,578 SNPs for trait stem lesion length at threshold level [–log10(P) > 3.0]. SNPs in black rectangles depicted strong MTAs over the seasons.
Two SNPs (A03_6235895 and A03_6236020), present on chromosome A03 explained 17% of trait variation. The closest genes (SBT4.4; SBT4.12, and SBT4.9) encode proteins belonging to the subtilase family. Another group of eleven SNPs were identified in a small genomic region on the same chromosome (6,274,763-994 comprising 231 bp). Genes closest to this genomic region were At1g65850, At3g04220, and At5g11250. These encode disease resistance proteins of class TIR-NBS-LRR. Also located closely on the same chromosome were GSTT2 and GSTT3. These encode glutathione S-transferase THETA 3. Chromosome A03 also harbored a group of five SNPs (A03_6390210, A03_6390240, A03_6390303, A03_6390342, and A03_6390381). Annotation in the region was suggestive of the leucine rich repeat protein kinase family protein. At5g16590 was indicated in close genomic proximity. Twenty SNPs were identified on the chromosome A06. Of these 10 were within a genomic interval of 102 bp (14,196,946-7,052). Annotation indicated involvement of BSK4, 6, 7 and 8 and kinase with tetratricopeptide repeats domain protein. Five SNPs were identified between intervals of 26,227,171-7,735, close to allene oxide cyclase (AOC1-4). Another group of five SNPs (A06_27175971, A06_27176024, A06_27176029, A06_27176035, and A06_27176193), were present near protease inhibitor 2 (LCR71, 73, 76; PDF 2.1, 2.3, 2.5). Thirteen SNPs were localized on two genomic regions on chromosome B03. Of these, four SNPs were present in the genomic interval between 924,478-5,003. Annotation indicated the presence of gene SBT3, 3, encoding subtilase family protein. Nine SNPs (998,752-898) were positioned close to PBL7, encoding protein kinase superfamily protein. One SNP (1,922,364) situated on chromosome B04, appeared to be present close to ARM repeat superfamily protein (PUB4, 10, 11). The identified SNPs explained 12–16% of the phenotypic variation. Flanking sequences of candidate SNPs extracted from mock-up pseudomolecules reference are included in Supplementary Table S2.
SNP Validation
Six peak SNPs, significantly associated with resistance responses were chosen for validation using sanger sequencing. PCR products were amplified from eight ILs, varying for their resistance responses. Sanger sequencing and sequence alignment validated five SNPs out of the six sampled (Table 4).
Table 4. Validation of trait associated peak SNPs.
Intersection of MTAs Identified Using SSR and SNP Genotyping
Linkage disequilibrium (D′ value) matrices were plotted for chromosome regions (A03, B03) showing multiple SNPs (Figure 8). Strong LD blocks were indicated by the occurrence of adjacent loci in LD. Regions of strong LD of SNPs and SSR maker sites were recorded. Major LD blocks co-localized with the regions showing strong MTAs in chromosome A03 and B03, respectively. SSR markers, namely cnu-468 and nia-50, showing association with resistance responses (Table 2), were in strong LD with SNPs showing MTAs in chromosomes A03 and B03.
Figure 8. Chromosome wise Manhattan plots (top) for stem lesion length trait. Vertical bar below Manhattan plot areas shows SNPs hotspot for trait identified by association mapping. Linkage disequilibrium (D′ value) matrices (bottom) are plotted for regions denoted by anchoring lines. Regions of strong LD of SNPs site (blue) and SSR maker site (green) are shown in red. Significant association markers are denoted plotted above the threshold (doted redlines). ∼0.8 Mb (A) and ∼97 kb (B) regions show strong MTAs on chromosome A03 and B03, respectively.
Discussion
Introgression of alien genomic fragments bearing the genes of interest from wild Brassicaceae species is a major tool to broaden the genetic base in crop Brassicas. In spite of its potential applications, this method of germplasm enhancement is rarely used, possibly due to the difficulties involved in initial steps of inter-specific or generic hybridizations and time required to stabilize introgressions in the host genome(s). Linkage drag associated with the introgressed variation is another limitation as the size of random introgressions can be highly variable with uneven distribution (Curtis and Lukaszewski, 1993). The drag can be reduced by inducing recombinations between alien and crop genomes. Physical disruption of introgressed alien chromosome fragments through heavy irradiation and then identifying plants with reduced size of introgressed genomic fragment through low pass sequencing is now a feasible option. A major prerequisite to such an approach is the information regarding the chromosome fragments responsible for the trait variation and their location on the chromosome(s). Toward that end, we report our success in mapping genomic regions responsible for the stem resistance to S. sclerotiorum in B. juncea–E. cardaminoides ILs.
Introgression lines showed varied resistance responses with a near normal distribution, implying a quantitative inheritance. Kinship and population structure analysis of ILs identified three distinct clusters. HR genotypes grouped with the resistance donor species E. cardaminoides. Association mapping using SSR genotypes allowed identification of six marker loci on A and B genomes. This information was reinforced though GWAS based on genotyping by sequencing. Multiple MTAs, occurring in a very close proximity, and/or adjacent regions, were repeatedly identified on chromosomes A03, A06, B03 and B04. Chromosomes A03 and A06 harbored the maximum number of resistances associated SNPs in present investigations. It is likely that a greater homology between A and EC genomes (Chandra et al., 2004) allowed preferential introgression of resistance bearing chromosome fragments from E. cardaminoides, on the A genome of B. juncea. As explained earlier, we confirmed three large E. cardaminoides segment substitutions in two ILs through GISH. Two introgressions were located on A genome chromosomes and one on B genome chromosome. GISH can only detect large translocation/alien chromosome segment substitutions. However, many smaller genomic exchanges must have occurred between A/B and E genomes due to homoeologies that exist between three genomes (Chandra et al., 2004). ILs are also likely to vary for number and type of alien introgressions. The introgressions are generally dependent on homologous regions for recombination or random translocations. Annotation of associated genomic regions in our studies highlighted an array of resistance mechanisms in terms of signal transduction pathways, hypersensitive responses, oxidative burst and production of anti-fungal proteins and metabolites. Up regulation of many of these genes have been reported following Sclerotinia infestation in B. napus (Rimmer et al., 2007). There is no previous report for QTL mapping for Sclerotinia stem rot resistance in Brassica crops. However, mapping in euploid B. napus has shown resistance associated QTLs on chromosomes A06 and A08 (Zhao et al., 2006; Li et al., 2015; Wei et al., 2016). Wei et al. (2016) elucidated resistance genes and pathogenesis related genes through GWAS of 347 accessions of B. napus. They could identify 17 significant associations for stem resistance on chromosomes A8 and C6. In line with the previous reports, our studies also highlighted the genetic complexity of resistance responses to S. sclerotiorum.
Eleven SNPs (A03_6274763-994) were identified close to three R-genes, encoding TIR-NBS-LRR proteins, at a distance of 23.29–24.24 kb. This protein family constitutes a second line of defense and is involved in the detection of specific pathogen signals such as avirulence (Avr) factors; mediating physical association between resistance proteins and pathogen effector molecules; activation of signal transduction pathways and as a consequence up regulation of many defensive proteins and compounds. SSR marker Cnu_m276 was also associated with leucine-rich repeats (LRR) disease resistance proteins (Chen et al., 1998; Pilet, 1999). LRR proteins include tyrosine kinase receptors, cell-adhesion molecules, virulence factors and extracellular matrix-binding glycol-proteins. The most studied plant signaling RLK is LRR-RLK Brassinosteroid. Insensitive 1(BRI1) mediates signaling which includes phosphorylation of various members of brassinosteroid signaling kinases (BSKs) with tetracopeptide repeat domain by BRI1 (Gruszka, 2013). In the present study, 10 SNPs (14,196,946-7,052, explaining 13.66% variation) may be associated with three BSKs genes on chromosome A06. Brassinosteroid signaling is involved in many cellular processes; like increased accumulation of reactive oxygen species (ROS) known as oxidative burst (Kim et al., 2012), triggering enhanced production of defensive proteins and metabolites, including peroxidases, protease inhibitors, and AOC. MTAs (9SNPs) involving protein kinase superfamily protein were identified on chromosome B03. Members of this family are involved in defensive responses to abiotic stress and pathogen invasion (Cheng et al., 2002). Another defensive protein was recognized through five SNPs, present very closely (at a distance of 110–250 bp) to four candidates encoding functional AOC polypeptides (AOC1-4) on chromosome A06. AOC catalyzes the essential steps in biosynthesis of jasmonic acid (Stenzel et al., 2012), a mainstay of signaling pathways during plant stress responses. Mutants defective in these genes were vulnerable to pathogen invasion (Park et al., 2002; Von Malek et al., 2002; Browse, 2009). Chromosome A06 also harbored five SNPs within a small genomic interval (27,175,971-6,193). Candidate genes closest (3.6 kb) to SNPs encode protease inhibitor II, an anti pest metabolite (Juge and BirteSvensson, 2006) which inhibits pathogen proteases and deters their invasion. Glutathione S-transferase THETA3 (GSTT3) (A03) – predominantly catalyzes reduction of organic hydroperoxides formed during oxidative (Dixon et al., 2002). Multiple SNPs located in a small genomic region(s) on a given chromosome can be construed as constituents of major QTLs.
Marker trait associations involving two SNPs (A03_6235895 and A03_6236020) on A03 and four SNPs (B03_924478-5003) seemed important to explain E. cardaminoides resistance. The closest candidates (SBT 3.3, SBT4.4, SBT4.12, and SBT4.9) encode subtilase family proteins, which are critical for signaling cascades during pathogen recognition, immune priming and petal and stamen development (Figueiredo et al., 2014). SBT 3.3 is a regulator of primed immunity (Ramírez et al., 2013). It is possibly a plasma membrane receptor, activating downstream immune signaling processes. Some subgroups of plant subtilisin-like proteases, may play a role, similar to caspases in animal programmed cell death (PCD) (Chichkova et al., 2010; Vartapetian et al., 2011). Pathogen recognition results in growth inhibition, which may trigger a hypersensitive reaction, a form of localized PCD. This is central to innate immune responses (Vartapetian et al., 2011). A positive feedback loop circuit likely maintains the SBT3.3 expression, after initiation of signaling process and maintenance of expression threshold levels may be important to keep cells in a sensitized mode (Ramírez et al., 2013). Three SNPs (A03_6337002-047) appeared linked with GSTT3 belonging to RING/U-box super family protein is in a close genomic proximity. SSR marker locus cnu_m418 was also associated with F-box related proteins (Kipreos and Pagano, 2000; Jain et al., 2006). They serve as positive regulators of ETI responses, which are required for full plant resistance to avirulent pathogens (Marino et al., 2012). Occurrence of SNPs or group of SNPs encoding multiple resistance genes in a region spanning approximately 885 kb are on chromosome A03 and 74 kb on B03 was particularly significant as these confirmed the past arguments suggesting clustering of resistance genes in the genome (Graham et al., 2002).
Summarizing, we demonstrate the successful introgression of chromosome fragments from E. cardaminoides. Given the quantitative nature of cardaminoides resistance, it is likely that some of the identified MTAs may involve small effect resistance genes already present in B. juncea. However, significantly higher level of resistance in ILs suggests that bulk of these must come from wild donor species. Linking of identified MTAs unequivocally to E. cardaminoides should await comparison of its genome sequence with those of ILs. We are also developing E. cardaminoides specific oligo probes to cytogenetically map all ILs for introgression sites. For future research, we are planning to undertake RNA-Seq data analysis to study transcriptomic responses to pathogen infestation in B. juncea, E. cardaminoides and selected B. juncea–E. cardaminoides ILs. These are expected to help in identifying key genes that define cardaminoides resistance to Sclerotinia stem rot. Host resistance is the only avenue for long-term, cost-effective management of this devastating, worldwide pathogen of Brassicas. Our research has clearly opened the way for deployment of the introgressed gene(s) into a wide range of high-yielding cultivars, of B. juncea initially and, subsequently, into other crop and horticultural Brassica species.
Data Availability
All critical data, like flanking sequences of peak SNPs, is included in the manuscript or the Supplementary Files. Genotyping and phenotyping data supporting the conclusions of this manuscript will be made available by the authors, without undue reservation, to any qualified researcher.
Author Contributions
SB and MB designed the research. SB and CA constructed the introgression lines. KR, AG, and PS performed the stem inoculations and recorded the disease score. CA, RK, AS, and MS maintained the germplasm and isolated the DNA. JA and NK conducted the bioinformatic analysis. KR and SB interpreted the data and wrote the manuscript. GK validated the SNPs. MB edited the manuscript. SB supervised the whole study. All authors read and approved final version of the manuscript.
Conflict of Interest Statement
The authors declare that the research was conducted in the absence of any commercial or financial relationships that could be construed as a potential conflict of interest.
Funding
This study was supported by the Department of Biotechnology, Government of India in the form of Centre of Excellence and Innovation in Biotechnology “Germplasm Enhancement for Crop Architecture and Defensive Traits in Brassica juncea (L.) Czern. and Coss” and the Indian Council of Agricultural Research under ICAR National Professor Project “Broadening the Genetic Base of Indian Mustard (Brassica juncea) Through Alien Introgressions and Germplasm Enhancement.”
Acknowledgments
KR was thankful to the Department of Science and Technology (DST) for financial assistance in form of an INSPIRE fellowship. Help of Dr. Mehak Gupta in conducting Genomic in situ hybridization was acknowledged. We thank the reviewers for many helpful suggestions.
Supplementary Material
The Supplementary Material for this article can be found online at: https://www.frontiersin.org/articles/10.3389/fpls.2019.01015/full#supplementary-material
FIGURE S1 | Structure Analysis of introgression lines. Δk = 3 thus the division of introgression lines in 3 groups.
FIGURE S2 | Manhattan plots in Season I, II and Pooled over seasons.
FIGURE S3 | Genome-wide association reveals markers distribution in all 18 chromosomes of B. juncea.
TABLE S1 | Primer sequences of significant SSR markers used in the studies.
TABLE S2 | Flanking sequences of candidate SNPs extracted from mock-up pseudomolecules reference (SNP base denoted by bold and underline character).
Footnotes
- ^ http://brassicadb.org/brad/datasets/pub/Genomes/Brassica_juncea/V1.5/
- ^ http://bbi.irri.org/products
- ^ http://www.maizegenetics.net
- ^ https://megante.dna.affrc.go.jp/
- ^ https://rdrr.io/github/XiaoleiLiuBio/MVP/
- ^ http://adegenet.r-forge.r-project.org/
- ^ https://megante.dna.affrc.go.jp/
- ^ https://github.com/XiaoleiLiuBio/MVP
References
Anderson, E. J., Ali, S., Byamukama, E., Yen, Y., and Nepal, M. P. (2018). Disease resistance mechanisms in plants. Genes 9:339.
Axelsson, T., Bowman, C. M., Sharpe, A. G., Lydiate, D. J., and Lagercrantz, U. (2000). Amphidiploids of Brassica juncea contain conserved progenitor genomes. Genome 43, 679–688. doi: 10.1139/gen-43-4-679
Banga, S. S., and Banga, S. (2016). “Genetic diversity and germplasm patterns in Brassica juncea,” in Gene Pool Diversity and Crop Improvement, eds V. R. Rajpal, S. Rama Rao, and S. N. Raina, (Berlin: Springer), 163–186. doi: 10.1007/978-3-319-27096-8_5
Barbetti, M. J., Banga, S. K., Fu, T. D., Li, Y. C., Singh, D., Liu, S. Y., et al. (2014). Comparative genotype reactions to Sclerotinia sclerotiorum within breeding populations of Brassica napus and B. juncea from India and China. Euphytica 197, 47–59. doi: 10.1007/s10681-013-1049-1
Barbetti, M. J., Banga, S. S., and Salisbury, P. A. (2012). Challenges for crop production and management from pathogen biodiversity and diseases under current and future climate scenarios – case study with oilseed Brassicas. Field Crops Res. 127, 225–240. doi: 10.1016/j.fcr.2011.11.021
Barbetti, M. J., Li, C. X., Banga, S. S., Banga, S. K., Singh, D., Singh, P. S., et al. (2015). New host resistances in Brassica napus and B. juncea from Australia, China and India: key to managing Sclerotinia stem rot (Sclerotinia sclerotiorum) without fungicides. Crop Protect. 78, 127–130. doi: 10.1016/j.cropro.2015.09.004
Barbetti, M. J., Li, C. X., Garg, H., Li, H., Banga, S. K., Banga, S. S., et al. (2011). “Host resistance in oilseed Brassicas against Sclerotinia- renewed hope for managing a recalcitrant pathogen,” in Proceedings of the 13th Internatonal Rapeseed Congress, (Prague), 713–715.
Behla, R., Hirani, A. H., Zelmer, C. D., Yu, F., Fernando, W. G. D., Vetty, P. M., et al. (2017). Identification of common QTL for resistance to Sclerotinia sclerotiorum in three doubled haploid populations of Brassica napus (L.). Euphytica 213:260. doi: 10.1007/s10681-017-2047-5
Bolton, M. D., Thomma, B. P., and Nelson, B. D. (2006). Sclerotinia sclerotiorum (Lib.) de Bary: biology and molecular traits of a cosmopolitan pathogen. Mol. Plant Pathol. 7, 1–16. doi: 10.1111/j.1364-3703.2005.00316.x
Bradbury, P. J., Zhang, Z., Kroon, D. E., Casstevens, T. M., Ramdoss, Y., and Buckler, E. S. (2007). Software for association mapping of complex traits in diverse samples. Bioinformatics 23, 2633–2635. doi: 10.1093/bioinformatics/btm308
Bradley, C. A., Henson, R. A., Porter, P. M., Le Gare, D. G., and Khot, S. D. (2006). Response of canola cultivars to Sclerotinia sclerotiorum in controlled and field environments. Plant Dis. 90, 215–219. doi: 10.1094/PD-90-0215
Browning, B. L., and Browning, S. R. (2016). Genotype imputation with millions of reference samples. Am. J. Hum. Genet. 98, 116–126. doi: 10.1016/j.ajhg.2015.11.020
Browse, J. (2009). Jasmonate passes muster: a receptor and targets for the defense hormone. Ann. Rev. Plant Biol. 60, 183–205. doi: 10.1146/annurev.arplant.043008.092007
Buchwaldt, L., Li, R., Hegedus, D. D., and Rimmer, S. (2005). “Pathogenesis of Sclerotinia sclerotiorum in relation to screening for resistance,” in Proceedings of the 13th International Sclerotinia Workshop, (Monterey, CA), 22.
Chandra, A., Gupta, M. L., Ahuja, I., Kaur, G., and Banga, S. S. (2004). Intergeneric hybridization between Erucastrum cardaminoides and two diploid crop Brassica species. Theor. Appl. Genet. 108, 1620–1626. doi: 10.1007/s00122-004-1592-1
Chen, X., Line, R. F., and Leung, H. (1998). “Resistance gene analogs associated with a barley locus for resistance to stripe rust,” in International Conference on the Status of Plant and Animal Genome Research VI, ed. S. R. Heller, (San Diego, CA: Abstracts).
Cheng, S. H., Willmann, M. R., Chen, H.-C., and Sheen, J. (2002). Calcium signaling through protein kinases.the Arabidopsis calcium-dependent kinase gene family. Plant Physiol. 129, 469–485. doi: 10.1104/pp.005645
Chichkova, N. V., Shaw, J., Galiullina, R. A., Drury, G. E., Tuzhikov, A. I, Kim, S. H., et al. (2010). Phytaspase, a relocalisable cell death promoting plant protease with caspase specificity. EMBO J. 29, 1149–1161. doi: 10.1038/emboj.2010.1
Clarkson, J. P., Staveley, J., Phelps, K., Young, C. S., and Whipps, J. M. (2003). Ascospore release and survival in Sclerotinia sclerotiorum. Mycol. Res. 107, 213–222. doi: 10.1017/s0953756203007159
Cruickshank, A. W., Cooper, M., and Ryley, M. J. (2002). Peanut resistance to Sclerotinia minor and S. sclerotiorum. Aust. J. Agric. Res. 53, 1105–1110.
Curtis, C. A., and Lukaszewski, A. J. (1993). Physical distribution of recombination in B-genome chromosomes of tetraploid wheat. Theor. Appl. Genet. 86, 121–127. doi: 10.1007/BF00223816
Dixon, D. P., Lapthorn, A., and Edwards, R. (2002). Plant glutathione transferases. Genome Biol. 3, 3004.1–3004.10.
Duitama, J., Quintero, J. C., Cruz, D. F., Quintero, C., Hubmann, G., Foulquie-Moreno, M. R., et al. (2014). An integrated framework for discovery and genotyping of genomic variants from high-throughput sequencing experiments. Nucleic Acids Res. 42:e44. doi: 10.1093/nar/gkt1381
Elshire, R. J., Glaubitz, J. C., Sun, Q., Poland, J. A., Kawamoto, K., Buckler, E. S., et al. (2011). A Robust, simple genotyping-by-sequencing (GBS) approach for high diversity species. PLoS One 6:e19379. doi: 10.1371/journal.pone.0019379
Figueiredo, A., Monteiro, F., and Sebastiana, M. (2014). Subtilisin-like proteases in plant–pathogen recognition and immune priming: a perspective. Front. Plant Sci. 5:739. doi: 10.3389/fpls.2014.00739
Flint-Garcia, S. A., Thornsberry, J. M., and Buckler, E. S. (2003). Structure of linkage disequilibrium in plants. Ann. Rev. Plant Biol. 54, 357–374.
Fomeju, B. F., Falentin, C., Lassalle, G., Manzanares-Dauleux, M. J., and Delourme, R. (2014). Homoeologous duplicated regions are involved in quantitative resistance of Brassica napus to stem canker. BMC Genomics 15:498. doi: 10.1186/1471-2164-15-498
Garg, H., Atri, C., Sandhu, P. S., Kaur, B., Renton, M., Banga, S. K., et al. (2010). High level of resistance to Sclerotinia sclerotiorum in introgression lines derived from hybridization between wild crucifers and the crop Brassica species Brassica napus and B. juncea. Field Crops Res. 117, 51–58. doi: 10.1016/j.fcr.2010.01.013
Ge, X., Li, Y., Wan, Z., You, M. P., Finnegan, P. M., Banga, S. S., et al. (2012). Delineation of Sclerotinia sclerotiorum pathotypes using differential resistance responses on Brassica napus and B. juncea genotypes enables identification of resistance to prevailing pathotypes. Field Crops Res. 127, 248–258. doi: 10.1016/j.fcr.2011.11.022
Ghasolia, R. P., Shivpuri, A., and Bhargava, A. K. (2004). Sclerotinia rot of Indian mustard (Brassica juncea) in Rajasthan. Indian Phytopathol. 57, 76–79.
Gilmore, B., Myers, J. R., and Kean, D. (2002). Completion of testing of Phaseolus coccineus plant introductions for white mold Sclerotinia sclerotiorum resistance. Ann. Rept. Bean Improv. Coop. 45, 64–65.
Godoy, M., Castano, F., Re, J., and Rodriguez, R. (2005). Sclerotinia resistance in sunflower genotypic variations of hybrids in three environment of Argentina. Euphytica 145, 147–154. doi: 10.1007/s10681-005-0627-2
Gomez-Campo, C., Tortosa, M. E., Tewari, I., and Tewari, J. P. (1999). Epicuticular wax columns in cultivated Brassica species and in their close wild relatives. Ann. Bot. 83, 515–519. doi: 10.1006/anbo.1999.0849
Götz, S., García-Gómez, J. M., Terol, J., Williams, T. D., Nagaraj, S. H., Nueda, M. J., et al. (2008). High–throughput functional annotation and data mining with the Blast2GO suite. Nucleic Acids Res. 36, 3420–3435. doi: 10.1093/nar/gkn176
Goyal, P., Chahar, M., Barbetti, M. J., Liu, S. Y., and Chattopadhyay, C. (2011). Resistance to Sclerotinia rot caused by Sclerotinia sclerotiorum in Brassica juncea and B. napus germplasm. Indi. J. Plant Protect. 39, 60–64. doi: 10.1094/PDIS-06-13-0612-RE
Graham, M. A., Marek, L. F., Randy, C., and Shoemaker, R. C. (2002). Organization, expression and evolution of a disease resistance gene cluster in soybean. Genetics 162, 1961–1977.
Gruszka, D. (2013). The brassinosteroid signaling pathway-new key players and interconnections with other signaling networks crucial for plant development and stress tolerance. Int. J. Mol. Sci. 14, 8740–8774. doi: 10.3390/ijms14058740
Gyawali, S., Harrington, M., Durkin, J., Horner, K., Parkin, I. A. P., Hegedus, D. D., et al. (2016). Microsatellite markers used for genome-wide association mapping of partial resistance to Sclerotinia sclerotiorum in a world collection of Brassica napus. Mol. Breed. 36:72. doi: 10.1007/s11032-016-0496-5
Hartman, G. L., Gardner, M. E., Hymowitz, T., and Naidoo, G. C. (2000). Evaluation of perennial Glycine species for resistance to soybean fungal pathogens that cause Sclerotinia stem rot and sudden death syndrome. Crop Sci. 40, 545–549.
Hims, M. J. (1979). Damping off of Brassica napus (mustard and cress) by Sclerotinia sclerotorium. Pl. Pathol. (UK) 28, 201–202. doi: 10.1111/j.1365-3059.1979.tb01130.x
Horning, H. (1983). Zur epidemiology und bekafungder weibstenge like it (Sclerotinia sclerotiorum). Raps 1, 32–34.
Jain, M., Tyagi, A. K., and Khurana, J. P. (2006). Genome-wide analysis, evolutionary expansion, and expression of early auxin-responsive SAUR gene family in rice (Oryza sativa). Genomics 88, 360–371. doi: 10.1016/j.ygeno.2006.04.008
Juge, N., and BirteSvensson, B. (2006). Proteinaceous inhibitors of carbohydrate-active enzymes in cereals: implication in agriculture, cereal processing and nutrition. J. Sci. Food Agri. 86, 1573–1586. doi: 10.1002/jsfa.2454
Kaur, P., Banga, S. K., Kumar, N., Gupta, S., Akhatar, J., and Banga, S. S. (2014). Polyphyletic origin of Brassica juncea with B. rapa and B. nigra (Brassicaceae) participating as cytoplasm donor parents in independent hybridization events. Amer. J. Bot. 101, 1157–1166. doi: 10.3732/ajb.1400232
Kim, B. H., Kim, S. Y., and Nam, K. H. (2012). Genes encoding plant-specific class III peroxidases are responsible for increased cold tolerance of the brassinosteroid-insensitive 1 mutant. Mol. Cells 34, 539–548. doi: 10.1007/s10059-012-0230-z
Kim, H., Choi, S. R., and Bae, J. (2009). Sequenced BAC anchored reference genetic map that reconciles the ten individual chromosomes of Brassica rapa. BMC Genomics 10:432. doi: 10.1186/1471-2164-10-432
Kipreos, E. T., and Pagano, M. (2000). The F-box protein family. Genome Biol. 1, 1–7. doi: 10.1186/gb-2000-1-5-reviews3002
Kirkegaard, J. A., Robertson, M. J., Hamblin, P., and Sprague, S. J. (2006). Effects of blackleg and Sclerotinia stem rot on canola yield in the high rainfall zone of southern New South Wales, Australia. Aust. J. Agric. Res. 57, 201–212.
Kumar, A. (2012). Production barriers and technological options for sustainable production of rapeseed-mustard in India. J. Oilseed Brassica 3, 67–77.
Langmead, B., and Salzberg, S. (2012). Fst gapped-read alignment with Bowtie 2. Nat. Methods 9, 357–359. doi: 10.1038/nmeth.1923
Li, C. X., Li, H., Siddique, A. B., Sivasithamparam, K., Salisbury, P., Banga, S. S., et al. (2007). The importance of the type and time of inoculation and assessment in the determination of resistance in Brassica napus and B juncea to Sclerotinia sclerotiorum. Aust. J. Agric. Res. 58, 1198–1203.
Li, C. X., Li, H., Sivasithamparam, K., Fu, T. D., Li, C., Liu, S. Y., et al. (2006). Expression of field resistance under Western Australian conditions to Sclerotinia sclerotiorum in Chinese and Australian Brassica napus and Brassica juncea germplasm and its relation with stem diameter. Aust. J. Agric. Res. 57, 1131–1135.
Li, C. X., Liu, S. Y., Sivasithamparam, K., and Barbetti, M. J. (2009). New sources of resistance to Sclerotinia stem rot caused by Sclerotinia sclerotiorum in Chinese and Australian Brassica napus and Brassica juncea germplasm screened under Western Australian conditions. Australas. Plant Pathol. 38, 149–152.
Li, J., Zhao, Z., Hayward, A., Cheng, H., and Fu, D. (2015). Integration analysis of quantitative trait loci for resistance to Sclerotinia sclerotiorum in Brassica napus. Euphytica 205, 483–489. doi: 10.1007/s10681-015-1417-0
Li, Y., Chen, J., Bennett, R., Kiddle, G., Wallsgrove, R., Huang, Y. J., et al. (1999). “Breeding, inheritance, and biochemical studies onBrassica napus cv. Zhongyou 821: tolerance to Sclerotinia sclerotiorum (stem rot),” in Proceedings of the 10th Internationa Rapeseed Congress, 1999, Chap. Canberra, ACT.
Lowe, A., Moule, C., Trick, M., and Edwards, K. (2004). Efficient large scale development of microsatellites for marker and mapping applications in Brassica crop species. Theor. Appl. Genet. 108, 1103–1112. doi: 10.1007/s00122-003-1522-7
Lowe, A. J., Jones, A. E., Raybould, A. F., Trick, M., Moule, C. J., and Edwards, K. J. (2002). Transferability and genome specificity of a new set of microsatellite primers among Brassica species of the U triangle. Mol. Ecol. Notes 2, 7–11. doi: 10.1046/j.1471-8286.2002.00126.x
Marino, D., Peeters, N., and Rivas, S. (2012). Ubiquitination during plant immune signaling. Plant Physiol. 160, 15–27. doi: 10.1104/pp.112.199281
Martin, M. (2011). Cutadapt removes adapter sequences from high-throughput sequencing reads. EMBnet. J. 17, 10–12.
Morrall, R. A. A., Duczek, J., Mckenzie, D. L., and McGee, D. C. (1976). Some aspects of S. sclerotiorum in Saskatchewan during 1970-75. Can. Plant Dis. Surv. 56, 56–62.
Nordborg, M., and Tavare, S. (2002). Linkage disequilibrium: what history has to tell us. Trends Genet. 18, 83–90. doi: 10.1016/s0168-9525(02)02557-x
Numa, H., and Itoh, T. (2014). MEGANTE: a Web-based system for integrated plant genome annotation. Plant Cell Physiol. 55:e2. doi: 10.1093/pcp/pct157
Olsson, G. (1960). Species crosses within the genus Brassica. I. Artificial Brassica juncea Coss. & Czern. Hereditas 4, 171–222.
Oram, R. N., Kirk, J. T. O., Veness, P. E., Hurlston, C. J., Edlington, J. P., and Halsall, D. M. (2005). Breeding Indian mustard [Brassica juncea (L) Czern] for cold-pressed edible oil production – a review. Aust. J. of Agric. Res. 56, 581–596.
Park, J. H., Halitschke, R., Kim, H. B., Baldwin, I. T., Feldmann, K. A., and Feyereisen, R. (2002). A knock-out mutation in allene oxide synthase results in male sterility and defective wound signal transduction in Arabidopsis due to a block in jasmonic acid biosynthesis. Plant J. 31, 1–12. doi: 10.1046/j.1365-313x.2002.01328.x
Pilet, M. L. (1999). Analyse Génétique de la Résistance du Colza à la Nécrose du Collet et à la Cylindrosporiose à L’aide des Marqueursmoléculaires. Paris: Institute National Agronomique Paris-Grignon.
Porter, L. D., Hoheisel, G., and Coffman, V. A. (2009). Resistance of peas to Sclerotinia sclerotiorum in the Pisum core collection. Plant Pathol. 58, 52–60. doi: 10.1111/j.1365-3059.2008.01937.x
Prakash, S., Bhat, S. R., Quiros, C. R., Kirti, P. B., and Chopra, V. L. (2009). Brassica and its close allies: cytogenetics and evolution. Plant Breed. Rev. 31, 121–161.
Pritchard, J. K., Stephens, M., and Donnelly, P. (2000). Inference of population structure using multilocus genotype data. Genetics 155, 945–959.
Purdy, L. H. (1979). Sclerotinia sclerotiorum: history, diseases and symptomatology, host range, geographic distribution and impact. Phytopathology 69, 887–890.
R Core Team, (2013). R: A language and Environment for Statistical Computing. Vienna: R foundation for statistical computing.
Ramírez, V., López, A., Mauch-Mani, B., Gil, M. J., and Vera, P. (2013). An extracellular subtilase switch for immune priming in Arabidopsis. PLoS Path. 9:e1003445. doi: 10.1371/journal.ppat.1003445
Rana, K., Atri, C., Gupta, M., Akhatar, J., Sandhu, P., Kumar, N., et al. (2017). Mapping resistance to sclerotina infestation in introgression lines of Brassica juncea carring genomic segments from wild Brassicaceae B. fruticulosa. Sci. Rep. 7:5904. doi: 10.1038/s41598-017-05992-9
Rawlinson, C. J., and Muthyala, G. (1979). Diseases of winter oilseed rape: occurrences, effects and control. J. Agric. Sci. 93, 593–606.
Rimmer, S. R., Zhao, J., Buchwaldt, L., and Hegedus, D. D. (2007). “Defining the mechanisms underlying resistance to stem rot disease (S. sclerotiorum) in Brassica napus,” in Proceedings of the 12th International Rapeseed Congress, (Wuhan), 51–54.
Risch, N., and Merikangas, K. (1996). The future of genetic studies of complex human diseases. Science 273, 1516–1517. doi: 10.1126/science.273.5281.1516
Saharan, G. S., and Mehta, N. (2008). Sclerotinia diseases of crop plants biology, ecology and disease management. Berlin: Springer Science Business Media.
Shivpuri, A., Sharma, K. B., and Chippa, H. P. (2000). Some studies on the stem rot diseases Sclerotinia sclerotiorum of rapeseed/mustard in Rajasthan India. J. Mycol. Plant Pathol. 27, 29–31.
Singh, R., Singh, D., Salisbury, P., and Barbetti, M. J. (2010). Field evaluation of Indian and exotic oilseed Brassica napus and B. juncea germplasm against Sclerotinia stem rot. Indi. J. Agric. Sci. 80, 1067–1071.
Singh, R., Singh, D., Sivasithamparam, S. K., Yadav, N., Salisbury, P., and Barbetti, M. J. (2008). Management of Sclerotinia rot of oilseed Brassicas: a focus on India. Brassica 10, 1–27.
Stenzel, I., Otto, M., Delker, C., Kirmse, N., Schmidt, D., Miersch, O., et al. (2012). Allene oxide cyclase (AOC) gene family members of Arabidopsis thaliana: tissue and organ-specific promoter activities and in vivo heteromerization.J. Exp. Bot. 63, 6125–6138. doi: 10.1093/jxb/ers261
Storey, J. D., and Tibshirani, R. (2003). R: statistical significance for genome-wide experiments. Proc. Nat. Acad. Sci. U.S.A. 100, 9440–9445.
Uloth, M., You, M. P., Finnegan, P. M., Banga, S. S., Banga, S. K., Yi, H., et al. (2013). New sources of resistance to Sclerotinia sclerotiorum for crucifer crops. Field Crops Res. 154, 40–52. doi: 10.1016/j.fcr.2013.07.013
Vartapetian, A. B., Tuzhikov, A. I., Chichkova, N. V., Taliansky, M., and Wolpert, T. J. (2011). A plant alternative to animal caspases: subtilisin-like proteases. Cell Death Differ. 18, 1289–1297. doi: 10.1038/cdd.2011.49
Vaughan, J. G., Hemingway, J. S., and Schofield, H. J. (1963). Contributions to a study of variation in Brassica juncea Coss. & Czern. Bot. J. Linn. Soc. 58, 435–447. doi: 10.1111/j.1095-8339.1963.tb00913.x
Von Malek, B., Van der, G. E., Schneitz, K., and Keller, B. (2002). The Arabidopsis male-sterile mutant dde2-2 is defective in the allene oxide synthase gene encoding one of the key enzymes of the jasmonic acid biosynthesis pathway. Planta 216, 187–192. doi: 10.1007/s00425-002-0906-2
Warwick, S. I., Francis, A., and La Fleche, J. (2000). Guide to Wild Germplasm of Brassica and Allied Crops (tribe Brassiceae, Brassicaceae). Ottawa, ON: AAFC.
Wei, L., Jian, H., Lu, K., Filardo, F., Yin, N., Liu, L., et al. (2016). Genome-wide association analysis and differential expression analysis of resistance to Sclerotinia stem rot in Brassica napus. Plant Biotech. J. 14, 1368–1380. doi: 10.1111/pbi.12501
Woods, D. L., Capcara, J. J., and Downey, R. K. (1991). The potential of mustard (Brassica juncea (L) Coss) as an edible oil crop on the Canadian prairies. Can. J. Plant Sci. 71, 195–198. doi: 10.4141/cjps91-025
Yang, J. H., Liu, D. Y., Wang, X. W., Ji, C. M., Cheng, F., Liu, B. N., et al. (2016). The genome sequence of allopolyploid Brassica juncea and analysis of differential homoeolog gene expression influencing selection. Nat. Genet. 48, 1225–1232. doi: 10.1038/ng.3657
You, M. P., Uloth, M. B., Xi, X., Banga, S. S., Banga, S. K., and Barbetti, M. J. (2016). Valuable new resistances ensure improved management of Sclerotinia stem rot (Sclerotinia sclerotiorum) in horticultural and oilseed Brassica species. J. Phytopathol. 164, 291–299. doi: 10.1111/jph.12456
Zhao, J., Buchwaldt, L., Rimmer, R., Sharpe, A., McGregor, L., Bekkaoui, D., et al. (2009). Patterns of differential gene expression in Brassica napus cultivars infected with Sclerotinia sclerotiorum. Mol. Plant Pathol. 10, 635–649. doi: 10.1111/j.1364-3703.2009.00558.x
Zhao, J., Peltier, A. J., Meng, J., Osborn, T. C., and Grau, C. R. (2004). Evaluation of Sclerotinia stem rot resistance in oilseed Brassica napus using a petiole inoculation technique under greenhouse conditions. Plant Dis. 88, 1033–1039. doi: 10.1094/PDIS.2004.88.9.1033
Zhao, J., Udall, J. A., Quijada, P. A., Grau, C. R., Meng, J., and Osborn, T. C. (2006). Quantitative trait loci for resistance to Sclerotinia sclerotiorum and its association with a homeologous non-reciprocal transposition in Brassica napus L. Theor. Appl. Genet. 112, 509–516. doi: 10.1007/s00122-005-0154-5
Zhao, J., Wang, J., An, L., Doerge, R. W., Chen, Z. J., Grau, C. R., et al. (2007). Analysis of gene expression profiles in response to Sclerotinia sclerotiorum in Brassica napus. Planta 227, 13–24. doi: 10.1007/s00425-007-0586-z
Zhao, Q., Huang, X., Lin, Z., and Han, B. (2010). SEG-Map: a novel software for genotype calling and genetic map construction from next-generation sequencing. Rice 3, 98–102. doi: 10.1007/s12284-010-9051-x
Keywords: Indian mustard, alien introgression, Erucastrum cardaminoides, genotyping by sequencing, quantitative trait loci, Genomic in situ hybridization
Citation: Rana K, Atri C, Akhatar J, Kaur R, Goyal A, Singh MP, Kumar N, Sharma A, Sandhu PS, Kaur G, Barbetti MJ and Banga SS (2019) Detection of First Marker Trait Associations for Resistance Against Sclerotinia sclerotiorum in Brassica juncea–Erucastrum cardaminoides Introgression Lines. Front. Plant Sci. 10:1015. doi: 10.3389/fpls.2019.01015
Received: 17 December 2018; Accepted: 19 July 2019;
Published: 06 August 2019.
Edited by:
Jaime Prohens, Polytechnic University of Valencia, SpainReviewed by:
Honghao Lv, Chinese Academy of Agricultural Sciences, ChinaPilar Soengas, Biological Mission of Galicia (MBG), Spain
Igor Falak, Corteva Agriscience, United States
Copyright © 2019 Rana, Atri, Akhatar, Kaur, Goyal, Singh, Kumar, Sharma, Sandhu, Kaur, Barbetti and Banga. This is an open-access article distributed under the terms of the Creative Commons Attribution License (CC BY). The use, distribution or reproduction in other forums is permitted, provided the original author(s) and the copyright owner(s) are credited and that the original publication in this journal is cited, in accordance with accepted academic practice. No use, distribution or reproduction is permitted which does not comply with these terms.
*Correspondence: Surinder S. Banga, bnBwYmdAcGF1LmVkdQ==