Abstract
Branching density (or the reciprocal: inter-branch distance) is an important trait which contributes to defining the number of roots in individual plants. The environmental and local variations in inter-branch distance have often been stressed, and simulations models have been put forward to take them into account within the dynamics of root system architecture (RSA). However, little is known about the interspecific and intra-plant variations of inter-branch distance. In this paper, we present an analysis which draws on 40 samples of plants belonging to 36 species collected in homogeneous soils, to address how the variations in inter-branch distance are structured within individual plants, and how this structure varies from one species to another. Using measurements of inter-branch distance on various roots of the same species and our knowledge of the branching process, we defined a simple and generic model dedicated to the simulation of the observed variations. This model distinguishes between two sub-processes: i) the longitudinal location of potential branching sites and ii) the effective emergence of lateral roots at these sites. Thus, it represents the variations in distance between the potential sites (with two parameters), and the probability of emergence of a lateral root at each site (one parameter). We show the ability of this model to account for the main variations in inter-branch distances with a limited number of parameters, and we estimated them for the different species. These parameters can be considered as promising traits to characterize—in a comprehensive and simple way—the genetic and environmental variations in the whole branching process at plant level. Based on the results, we make recommendations for carrying out comparable measurements of the branching density in developed plants. Moreover, we suggest the integration of this new model as a module in future RSA simulators, to improve their capacity to account for this important and highly variable characteristic of plant species.
Introduction
The linear branching density for a given root can be defined as the number of lateral branches per length unit along this root. It can be characterized by the reciprocal variable, the inter-branch distance (IBD), and is often measured on the branching parts of roots, i.e., excluding the distal end where laterals have not emerged yet (Dubrovsky and Forde, 2012).
It is a very important trait at the root system level, because it largely contributes to defining the total number of roots in the whole plant. Since the root system is usually ramified up to several branching orders, typically between 3 and 5, the effect of inter-branch distance on the total number of roots is potentially raised to the power of the number of branching orders. However, note that some species, among the Amaryllidaceae, for example, have roots which are not branched, but they seem to constitute exceptions.
Several authors have quantified IBD (or branching density) in certain species (e.g., banana: Riopel, 1966; Charlton, 1982; Lecompte and Pagès, 2006; maize: Varney et al., 1991; Pagès and Pellerin, 1994; Wu et al., 2016; pea: Hinchee and Rost, 1992; tomato: Barlow and Adam, 1988) and stressed the importance of this morphological trait to characterize the root system architecture of the studied species. Others have compared several species and shown that IBD varies among species and genotypes within species (Mallory et al., 1970; Kong et al., 2014; Bui et al., 2015; Pagès, 2016; Pagès and Kervella, 2018). For example, in a recent paper based on a large range of species, Pagès (2016) observed considerable variations of IBD, with a 10-fold factor between the extreme average values. Within a given species, the variations among genotypes are usually lower, but they were significant for several Solanaceae species (e.g., Bui et al., 2015). Intra-plant variations have received much less attention. Physiologists usually characterize branching density based on the young radicle (Dubrovsky et al., 2006; Lavenus et al., 2013), whereas ecologists propose global average evaluations on mature plants (Kong et al., 2014). Wu et al. (2016) observed intra-plant structured variations, with a dependence of branching density on the diameter of the parent root in field-grown maize plants.
Beyond all these interspecific and intraspecific constitutive variations, the environmental and local plasticity of inter-branch distance have often been stressed, as a key process to cope with heterogeneous soil and locate numerous roots at favorable sites and fewer at unfavorable sites (Drew, 1975; Robinson, 1994; Malamy, 2005; Hodge, 2009; Orman-Ligeza et al., 2018). Several environmental factors were shown to be able to trigger these root responses, such as nutrient (Drew, 1975; Drew and Saker, 1975) or water availability (Orman-Ligeza et al., 2018). The inter-species variations of these plastic responses have not been studied.
Inter-branch distance is a common input parameter in models that simulate the dynamics of the root system architecture, especially in former models (Diggle, 1988; Pagès and Aries, 1988) in which a fixed average value of inter-branch distance was given to each branching order. In other and more recent models (Dunbabin et al., 2013; Henke et al., 2014), inter-branch distance was assumed to be a function which depends on environmental conditions in the vicinity of the root tip. However, the processes included in these latter models were not precisely evaluated against data, because data are lacking concerning both plant response and diversity of root responses. Additional investigations are required to be able to simulate both the variations in IBD within the root system and the plasticity to local conditions.
To inspire this new generation of simulation models, it is interesting to use the outcome of recent physiological works. The processes leading to the construction of branching density have been thoroughly investigated in recent years, usually along the seminal roots of plantlets, mainly in the Arabidopsis model (e.g., Dubrovsky et al., 2006; Moreno-Risueno et al., 2010; Dubrovsky et al., 2011; Lavenus et al., 2013). From these studies, it appears that the process of lateral root branching can be valuably divided into several sub processes which occur successively: priming and specification of founder cells in the proximal vicinity of the parent root meristem; initiation of a primordium from these founder cells; development of the primordium, leading to the formation of the apical meristem of the lateral root; emergence of the lateral root from the parent root. Defining these steps allows for a better understanding of the clue signals that operate successively throughout the whole process. For example, a given initial step may define the potential location for branching, whereas a further step may confirm (or not) the branching in that particular place.
Another complementary approach to the topic is to take a macroscopic view of the emergent result of these sequences leading to patterns of inter-branch distances, and to quantify expression variations within the whole root system, taking into account several roots from the same plants and looking at variations among species. In this paper, we present such an analysis based on 40 different samples (36 species) observed in homogeneous soils to investigate how inter-branch distance varies within individual plants and from one species to another. Using this analysis and knowledge of mechanisms, we put forward a new generic and quantitative model to depict and simulate the observed variations.
Materials and Methods
Sampling Species
The data used in this paper come from a large data set of plants sampled since spring 2013 either In Natura or in pot cultures (Table 1). The growing environments were described in several preceding papers (Pagès, 2014; Pagès and Picon-Cochard, 2014; Pagès, 2016; Pagès and Kervella, 2018). Plants observed In Natura were obtained in two different French regions that have homogeneous, light, and deep soils. For obtaining these samples, cylindrical soil monoliths (diameter, 25 cm; depth, 30 cm) were extracted around the sampled plants, inserted into a mesh bag, immersed in a large bucket of water, and gently cleaned. Pot-grown plants were cultivated in greenhouses using long PVC tubes (between 50 and 150 cm long, 10 to 15 cm in diameter) filled with either sieved soil or a mixture of sandy soil and sieved compost. Each species was sampled from two to five well-developed plants, usually before flowering. Sampled trees were young, between 2 and 4 years old.
Table 1
| Species | Family | Site | Abbreviation |
|---|---|---|---|
| Acanthus mollis | Acanthaceae | Thouzon | AcMoT |
| Agrostis capillaris | Poaceae | Nozeyrolles | AgCaN |
| Agrostis vinealis | Poaceae | Nozeyrolles | AgViN |
| Ajuga reptans | Lamiaceae | Nozeyrolles | AjReN |
| Alliaria petiolata | Brassicaceae | Nozeyrolles | AlPeN |
| Amaranthus retroflexus | Amaranthaceae | Thouzon | AmReT |
| Anthoxanthum odoratum | Poaceae | Pot Clermont-Ferrand | AnOdPC |
| Anthoxanthum odoratum | Poaceae | Nozeyrolles | AnOdN |
| Antirrhinum majus | Plantaginaceae | Thouzon | AnMaT |
| Arabidopsis thaliana | Brassicaceae | Nozeyrolles | ArThN |
| Arrhenatherum elatius | Poaceae | Pot Clermont-Ferrand | ArElPC |
| Cirsium vulgare | Asteraceae | Thouzon | CiVuT |
| Dactylis glomerata | Poaceae | Nozeyrolles | DaGlN |
| Geranium molle | Geraniaceae | Nozeyrolles | GeMoN |
| Lactuca sativa | Asteraceae | Thouzon | LaSaT |
| Lolium perenne | Poaceae | Thouzon | LoPeT |
| Mentha suaveolens | Lamiaceae | Thouzon | MeSuT |
| Mercurialis annua | Euphorbiaceae | Thouzon | MeAnT |
| Misopates orontium | Plantaginaceae | Nozeyrolles | MiOrN |
| Panicum capillare | Poaceae | Thouzon | PaCaT |
| Panicum miliaceum | Poaceae | Thouzon | PaMiT |
| Papaver rhoeas | Papaveraceae | Nozeyrolles | PaRhN |
| Plantago lanceolata | Plantaginaceae | Nozeyrolles | PlLaN |
| Poa pratensis | Poaceae | Pot Clermont-Ferrand | PoPrPC |
| Poa trivialis | Poaceae | Pot Clermont-Ferrand | PoTrPC |
| Poa trivialis | Poaceae | Thouzon | PoTrT |
| Prunus domestica | Rosaceae | Thouzon | PrDoT |
| Pseudotsuga menziesii | Pinaceae | Nozeyrolles | PsMeN |
| Rubus ulmifolius | Rosaceae | Nozeyrolles | RuUlN |
| Rubus ulmifolius | Rosaceae | Thouzon | RuUlT |
| Silene vulgaris | Caryophyllaceae | Thouzon | SiVuT |
| Solanum laciniatum | Solanaceae | Thouzon | SoLaT |
| Sorghum halepense | Poaceae | Thouzon | SoHaT |
| Urtica dioica | Urticaceae | Thouzon | UrDiT |
| Verbascum nigrum | Scrophulariaceae | Nozeyrolles | VeNiN |
| Vinca minor | Apocynaceae | Nozeyrolles | ViMiN |
| Vinca minor | Apocynaceae | Thouzon | ViMiT |
| Viola odorata | Violaceae | Nozeyrolles | ViOdN |
| Vulpia myuros | Poaceae | Thouzon | VuMyT |
| Zea Mays | Poaceae | Pot Avignon | ZeMaPC |
From our initial data set, containing more than 200 samples (i.e., a species observed at a given site), we selected only those which had at least 150 branch roots that were measured on parent roots with a sufficient range of diameters to study the effect of this factor. Thus, we kept 40 samples belonging to 36 different species (listed in Table 1) that met these conditions for the present study.
Imaging the Roots
Once the soil had been carefully cleaned, the sampled parts of root systems were spread out in a layer of water contained in a transparent plastic tray. During this operation, lateral roots were carefully spread out on either side of their parent root to facilitate the subsequent measurements. The densest root systems were cut into several pieces to avoid root overlap in the tray. They were then scanned using flatbed scanners equipped with light in the cover (EPSON perfection V700 and V850) at a resolution of 2,400 to 3,200 dots per inch, using the transparent mode. The resolution was adjusted for each species so as to get at least 10 pixels transversally for the finest roots to measure them with sufficient accuracy. Images were stored in jpeg format.
Measuring the Inter-Branch Distance and Diameter of the Parent Root
Measurements were made on the computer screen by mouse clicking on the displayed images using the measuring tools (i.e., length of straight line and segmented line) provided by the ImageJ software (http://rsbweb.nih.gov/ij/). We measured the diameter of the parent root and the distance along the parent root from each lateral to its proximal closest neighbor (from axis to axis). We quantified branching density based on the inter-branch distance (the reciprocal value), because this variable could be measured for each lateral root. Measurements were done in the young branching zone, where laterals had reached at least 2 mm, to discard the very distal zone where emergence was taking place and where lateral roots might be not visible. Let us note that some lateral roots were broken during washing and imaging, but their trace was clearly visible because of the relative transparency of the parent root cortex.
Analyzing Data and Modeling
All calculations, plots, and modeling were done using the R software (R Core team, 2013). We made Student t tests and analyses of variance using linear models (using the “lm” and “anova” functions), as well as analyses of distributions using several functions of the “moments” package of R (functions: skewness, agostino.test, shapiro.test). We represented the distributions of inter-branch distances graphically using boxplots (Figure 1) or using the “density” function that calculates a probability density from the observed or simulated frequencies of inter-branch distances (Figures 2 and 6).
Figure 1

Box plots presenting the distributions of inter-branch distances for each sample. They are sorted from left to right according to the increasing values of the medians. The abbreviations are given in Table 1.
Figure 2
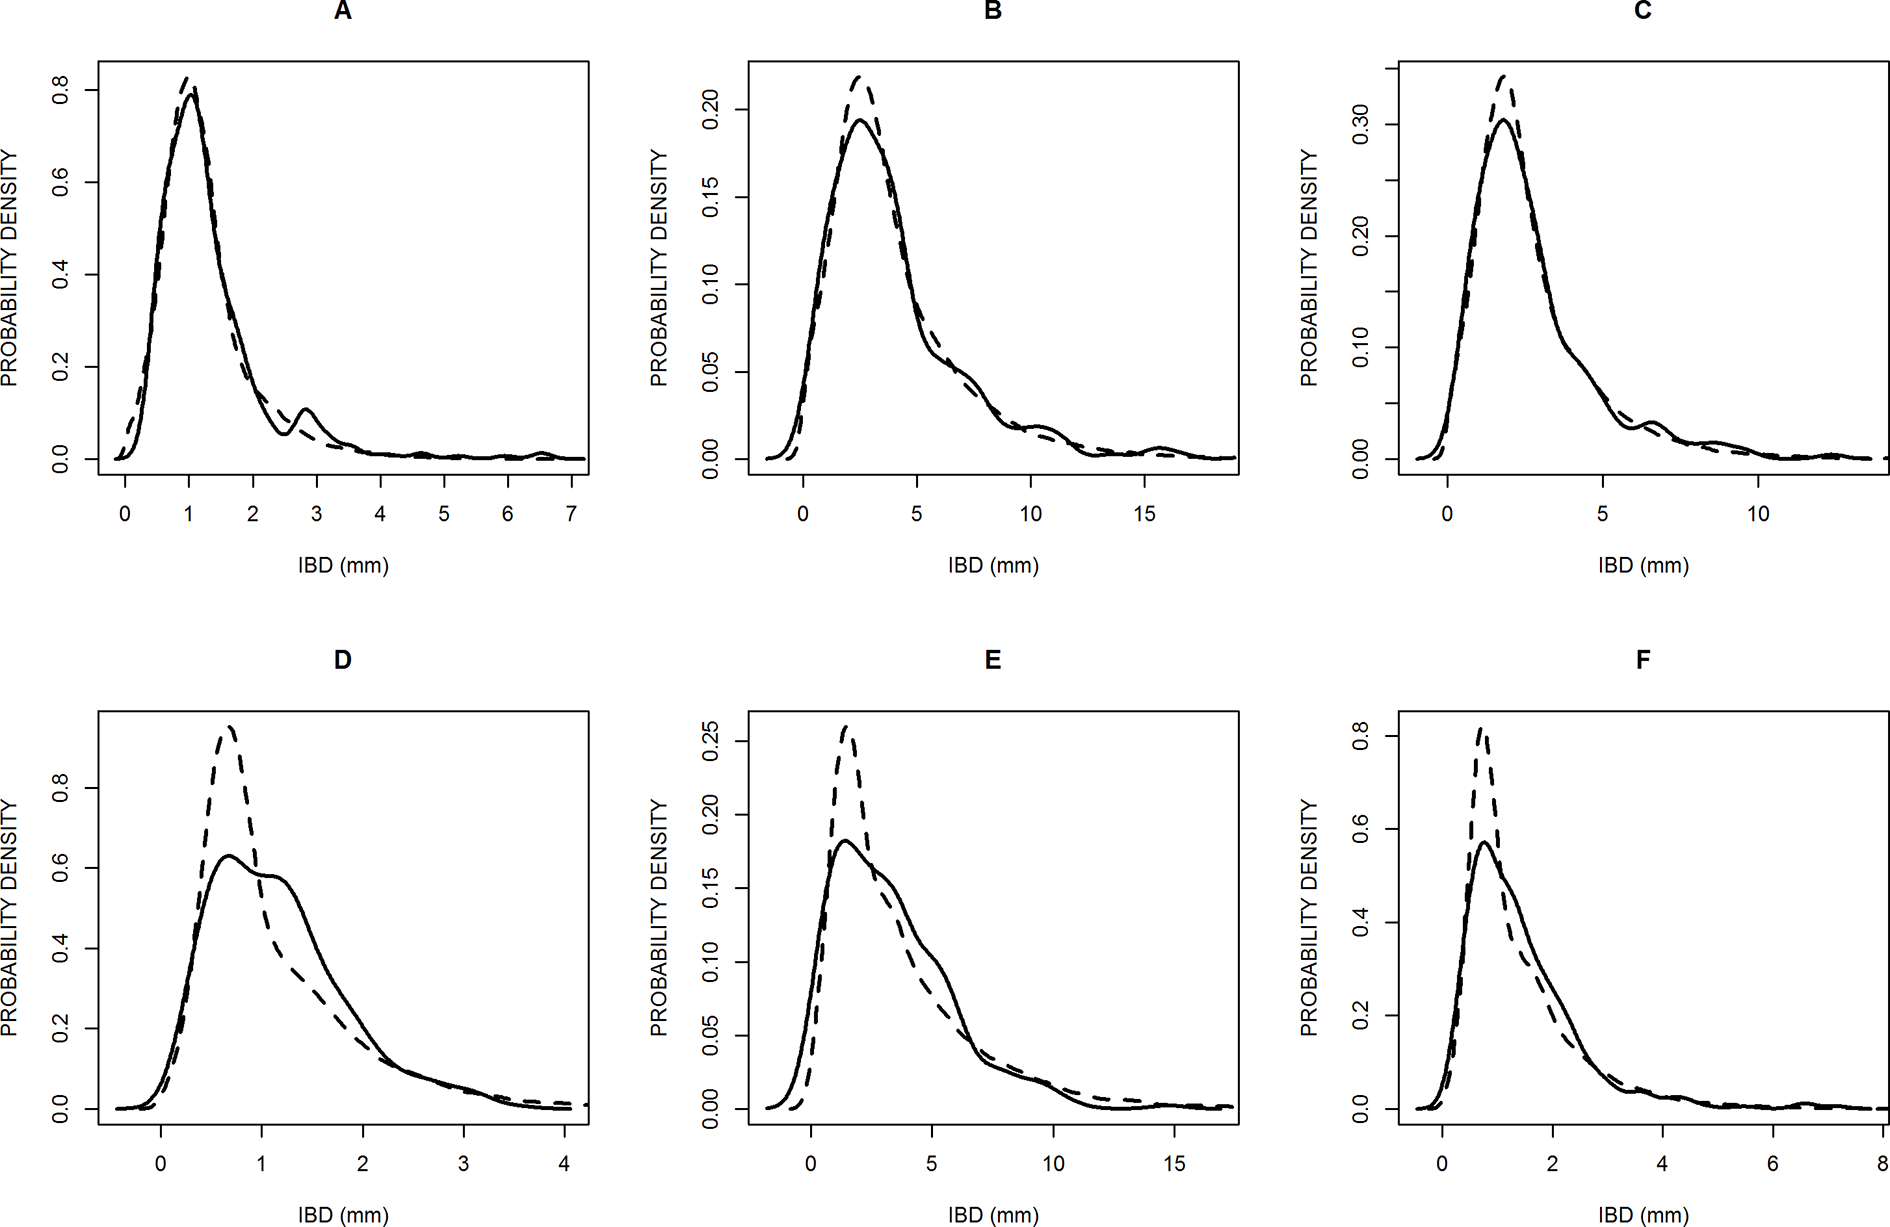
Probability density distributions of six samples to illustrate the best model fittings (A, B, C) and the worst (D, E, F), according to the chi square criterion. The solid lines are the observed distributions and the dashed lines are the simulated distributions. The samples are: Poa trivialis in Clermont (A), Solanum laciniatum in Thouzon (B), Vulpia myuros in Thouzon (C), Lolium perenne in Thouzon (D), Rubus ulmifolius in Thouzon (E), and Sorghum halepense in Thouzon (F).
Then, we wrote a specific R function (given in Supplementary Material) to simulate a model that considers branching as a two-step process. First, potential branching sites are defined along the root, each potential branching site being separated from the previous one (its proximal neighbor) from a distance whose distribution is assumed to be normal. The mean of the distances between potential branching sites is noted ISD (inter-site distance), and its coefficient of variation is CVD. This is the first step that gives a distribution of potential branching sites along the virtual parent root. Second, it is assumed that each potential branching site may actually give rise to an emerged lateral root (i.e., branching success) with a given probability Pem, or it may remain unbranched (branching failure), because one of the following steps could not be accomplished, with a probability of (1-Pem). This is the second step that simulates the positions of the emerged lateral roots along the parent root and allows calculating the distribution of inter-branch distances that can be compared with the observed ones. This simple model does not distinguish between reasons of failure. It could occur during the inception or later development of the primordium or during the emergence as a lateral root. We did not specify the radial angle that defines the orientation of the laterals around the parent root. The proposed model has three parameters: average distance between the potential sites (ISD), coefficient of variation of this distance (CVD), and probability (Pem) of success of the whole branching process. These parameters, which quantify the two sub-processes, had to be estimated on the whole, using the observed IBD distributions. The calibrations and tests were done on the whole root population for each species first, and then the model was used to analyze the effects of the diameter of the parent root.
Results
Distribution of Inter-Branch Distances
Figure 1 presents box-plots for the empirical distributions of inter-branch distances (IBD) of all species. Large variations are observed, both within and among species. Within species, the coefficients of variation in IBD varied between 0.5 and 0.8. The median values among species also varied in a large range (9-fold factor) between 0.62 mm (Poa trivialis at Thouzon) and 5.63 mm (Acanthus mollis at Thouzon). When several samples exist for the same species (Anthoxanthum odoratum, Poa trivialis, Rubus ulmifolius, Vinca minor), these samples are rather close to each other.
The IBD distributions were neither normal nor symmetrical. The Shapiro–Wilk normality test rejected the normality hypothesis for all species. The values of skewness and the Agostino test also showed a clear asymmetry for almost all species, with a systematic right-hand tail of the distributions, i.e., an excess of high values above the last quartile, as we can see in Figure 1 with outliers for high values of IBD. This skewness is reinforced by the fact that we cannot measure negative values of IBD.
When faced with such distributions, it is common to make a logarithmic transformation (e.g., Pagès, 2014; Landl et al., 2018) to obtain a quasi-normal distribution of the response variable [log(IBD)] and to carry out ANOVA on this transformed variable. Using this transformation, we effectively corrected the initial skewness but we obtained an opposite skewness (left tail) for a number of cases (15 of 40 cases according to the Agostino test; normality is accepted in 23 cases according to the Shapiro–Wilk test). As expected, the ANOVA made on this new response variable confirmed a clear species effect (P < 0.001).
We also explored the effect of the diameter of the parent root on IBD using correlation tests. Among the 40 samples, the correlation between the diameter of the parent root and IBD was not significant in 12 cases, significant and positive in 5 cases, and significant and negative in 23 cases. Thus, for a majority of species, the laterals tend to be more spaced out on the fine parent roots, but the inverse phenomenon also occurs, although less frequently.
Fitting and Evaluation of the Branching Model on All Roots
Since the proposed branching model is a numerical and stochastic simulation model, the fitting is not straightforward. To adjust it to the empirical (measured) distributions of IBD, we used a set of intermediate indicators that we constructed first based on simulated distributions and that met three conditions: i) simplicity to estimate these indicators based on the empirical distributions; ii) tight correlations between these indicators and input parameters (ISD, CVD, Pem); iii) low correlations between these indicators. For the construction, we made 8,000 simulations of distributions with 60,000 laterals for each of them, combining parameter values distributed within the plausible ranges for each parameter (20 regularly spaced values for each of the three parameters), and we calculated a number of common characteristics for each simulated distribution of IBD: mean, standard deviation, mode, quantiles at probability levels of 0.10, 0.20, 0.30, …, 0.90, 1.0. Based on this preliminary work (not shown), we retained three indicators that fulfilled the three conditions relatively well. They are: the mode of the IBD distribution, which was tightly correlated to the parameter ISD; the ratio: quantile 0.10/mode, tightly correlated to CVD; the ratio quantile 0.80/mode, tightly correlated to Pem. Then, we estimated the three model parameters independently using these three indicators via the linear interpolation of the relationships between average parameter values and indicator values that we obtained from preliminary simulations.
We calculated chi square values for each sample to evaluate the quality of the fitting. These values were significant and rejected the hypothesis of identical simulated and empirical distributions in only 3 of the 40 cases (for Lolium perenne, Rubus ulmifolius, and Sorghum Halepense at Thouzon). Figure 2 shows the three best (Figures 2A–C) and three worst (Figures 2D–F) fittings obtained. The model distributions are very close to the empirical ones, and the general shape and skewness are very well rendered. A majority of them, but not all, slightly overestimated the probability density of the modal value.
The distributions of parameters are presented in Figure 3. In our population, we obtained very large variations in ISD, between 0.40 and 4.6 mm (12-fold factor), confirming the importance of the species effect on this trait. Other parameters were less variable: CVD varied between 0.28 and 0.69 (2.5-fold factor), and Pem varied between 0.37 and 0.98 (2.6-fold factor). We also obtained positive and significant correlations between estimates of the three parameters, but the R2 values were below 0.3.
Figure 3
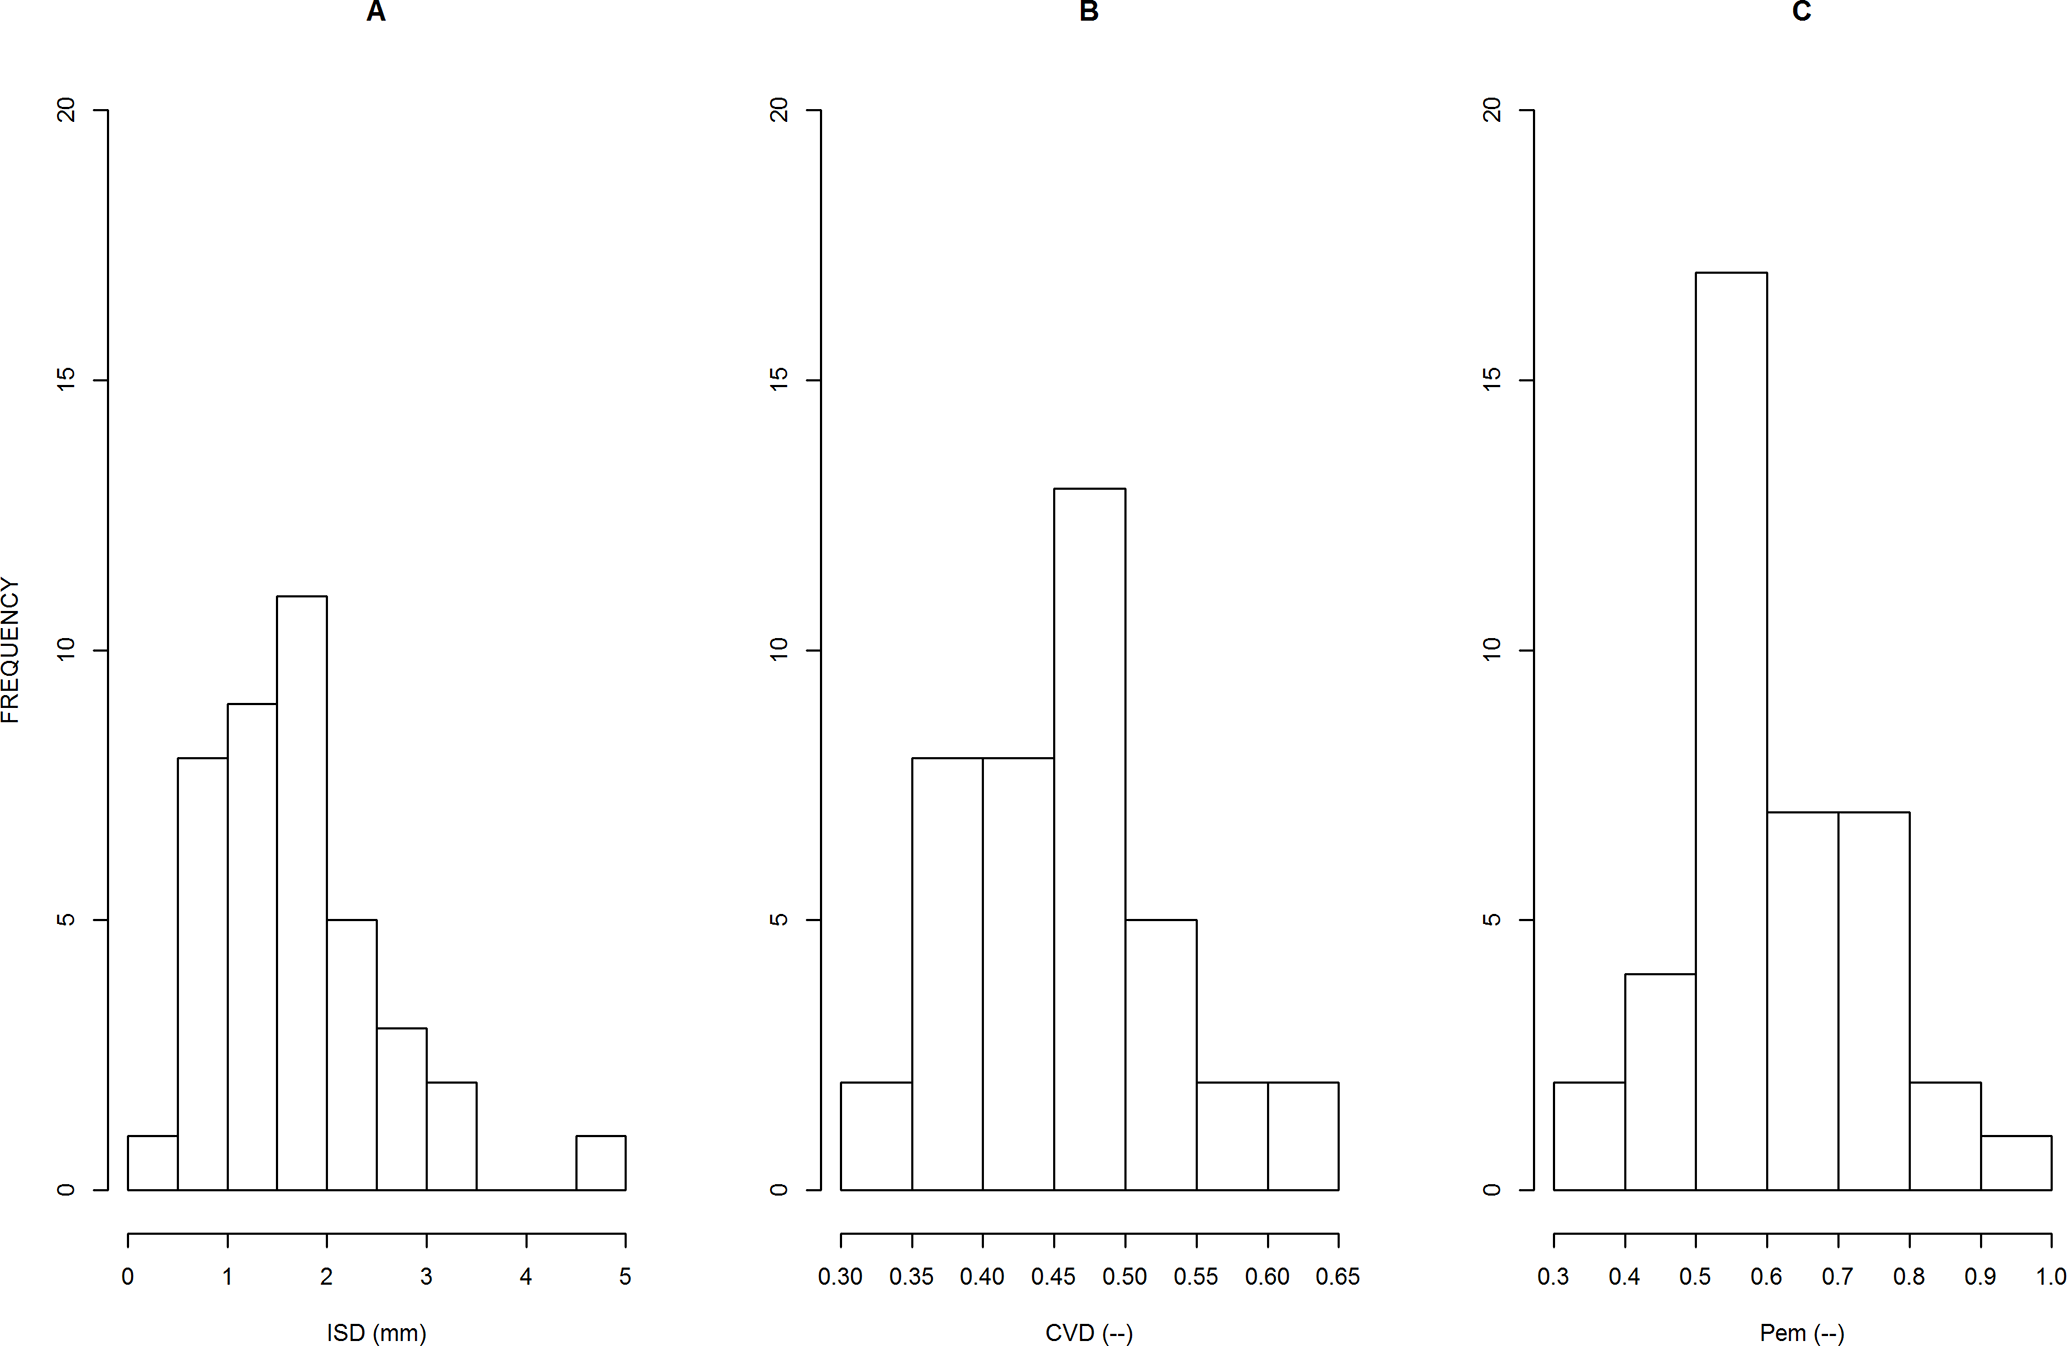
Distributions of the 40 parameter values, as estimated for each sample, for parameter ISD (A), CVD(B) and Pem(C). The meanings of these parameters are explained in the text.
Analysis of the Effect of Parent Root Diameter
For each sample, we divided the population of lateral roots into two sub-populations: those roots originating from parent roots that are finer than the central value of the diameter [0.5*(minimal diameter + maximal diameter)] and those on parent roots with a diameter above this central value. We calibrated the model separately for each sub-population.
Figure 4 shows the relationship between the ISD parameter values as estimated for the two populations. We observed a highly significant correlation between both sets, and we tested that the regression line was not significantly different from the bisecting line (shown in Figure 4). A Student t test confirmed that there was no global difference between the two sub-populations regarding the ISD parameter. For the two other parameters (CVD and Pem) on the contrary, we did not observe correlations between the two estimates. Again, the Student t test did not reveal differences between the two sub-populations. However, the values of Pem tended to be slightly higher for thick roots in a number of species, confirming a tendency for these species to have a heavier right tail in their IBD distribution for the finer roots.
Figure 4
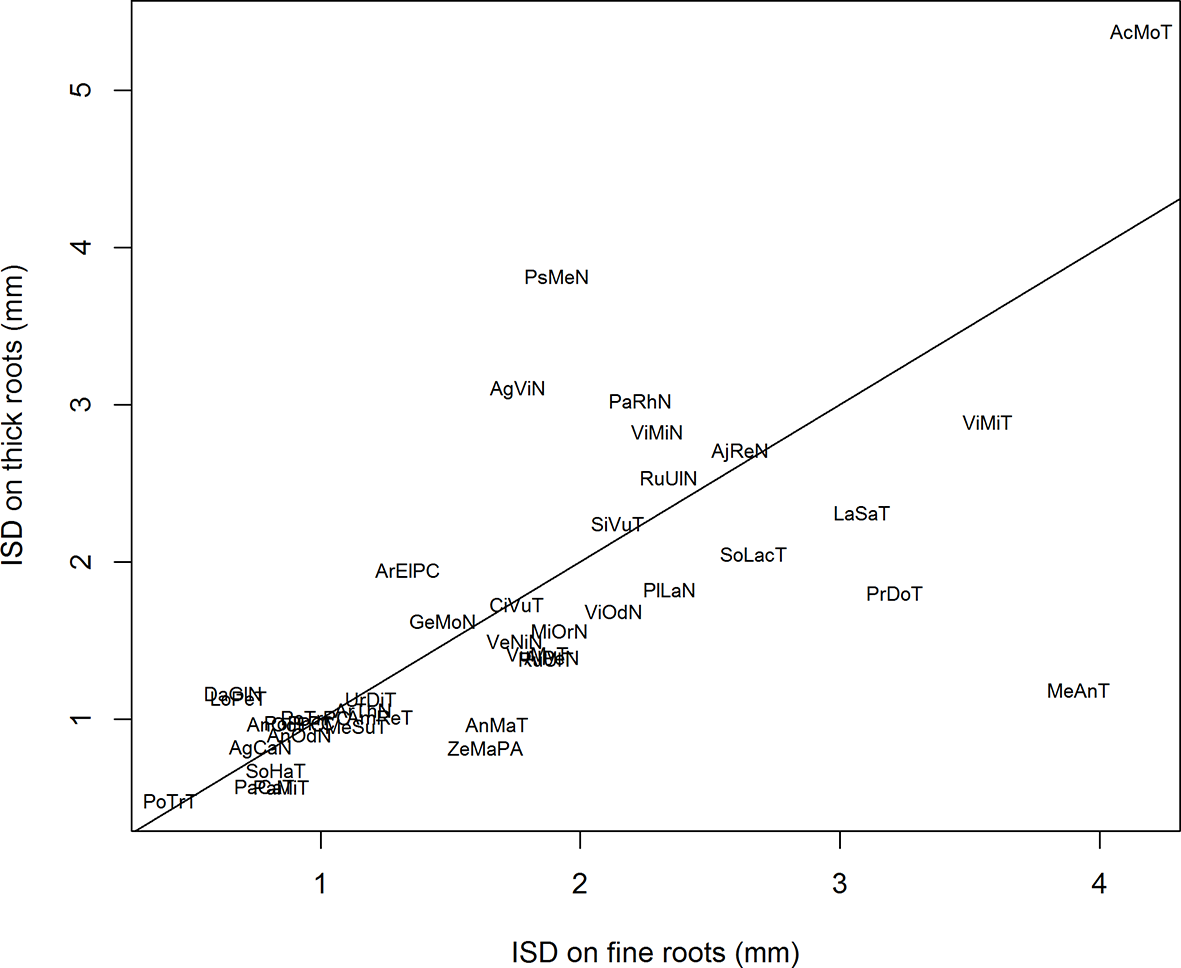
Relationship between the values of ISD estimated on thick parent roots versus the values of ISD estimated on fine parent roots. The line is the bisecting line. The abbreviations are given in Table 1.
We also observed that the relative differences of estimated ISD were correlated to the relative differences of Pem, as shown in Figure 5. This highly significant correlation means that when the potential branching sites are more spaced out in one of the two sub-populations, this is compensated by a higher probability of emergence of laterals on these potential branching sites, and vice-versa. Most species are close to the center of this graph, which shows that they have similar branching parameters for thick and fine roots, but several species exhibited the compensation between the spacing of branching sites and the probability of emergence. This was the case for Merculialis annua observed in Thouzon and Pseudotsuga menziesii observed in Nozeyrolles, whose IBD distributions are represented in Figure 6. These species showed extreme behaviors regarding distributions: for Mercurialis annua, the lateral roots on fine roots were more spaced out, whereas Pseudotsuga menziesii showed higher densities on its fine roots.
Figure 5
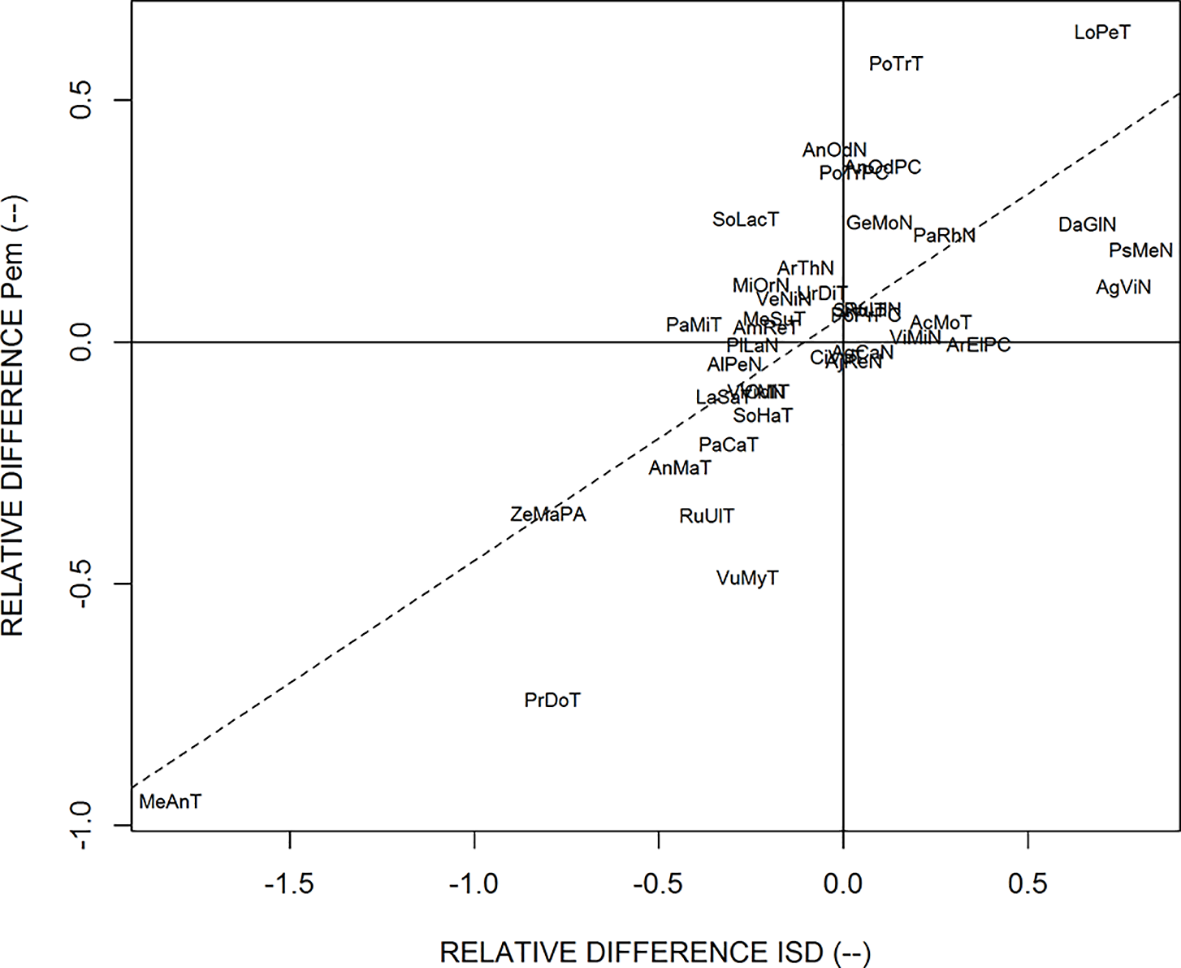
Relationship for the relative difference between the estimates of ISD and Pem, when estimated on thick parent roots and fine parent roots separately. The dotted line is the regression line. The abbreviations are given in Table 1.
Figure 6
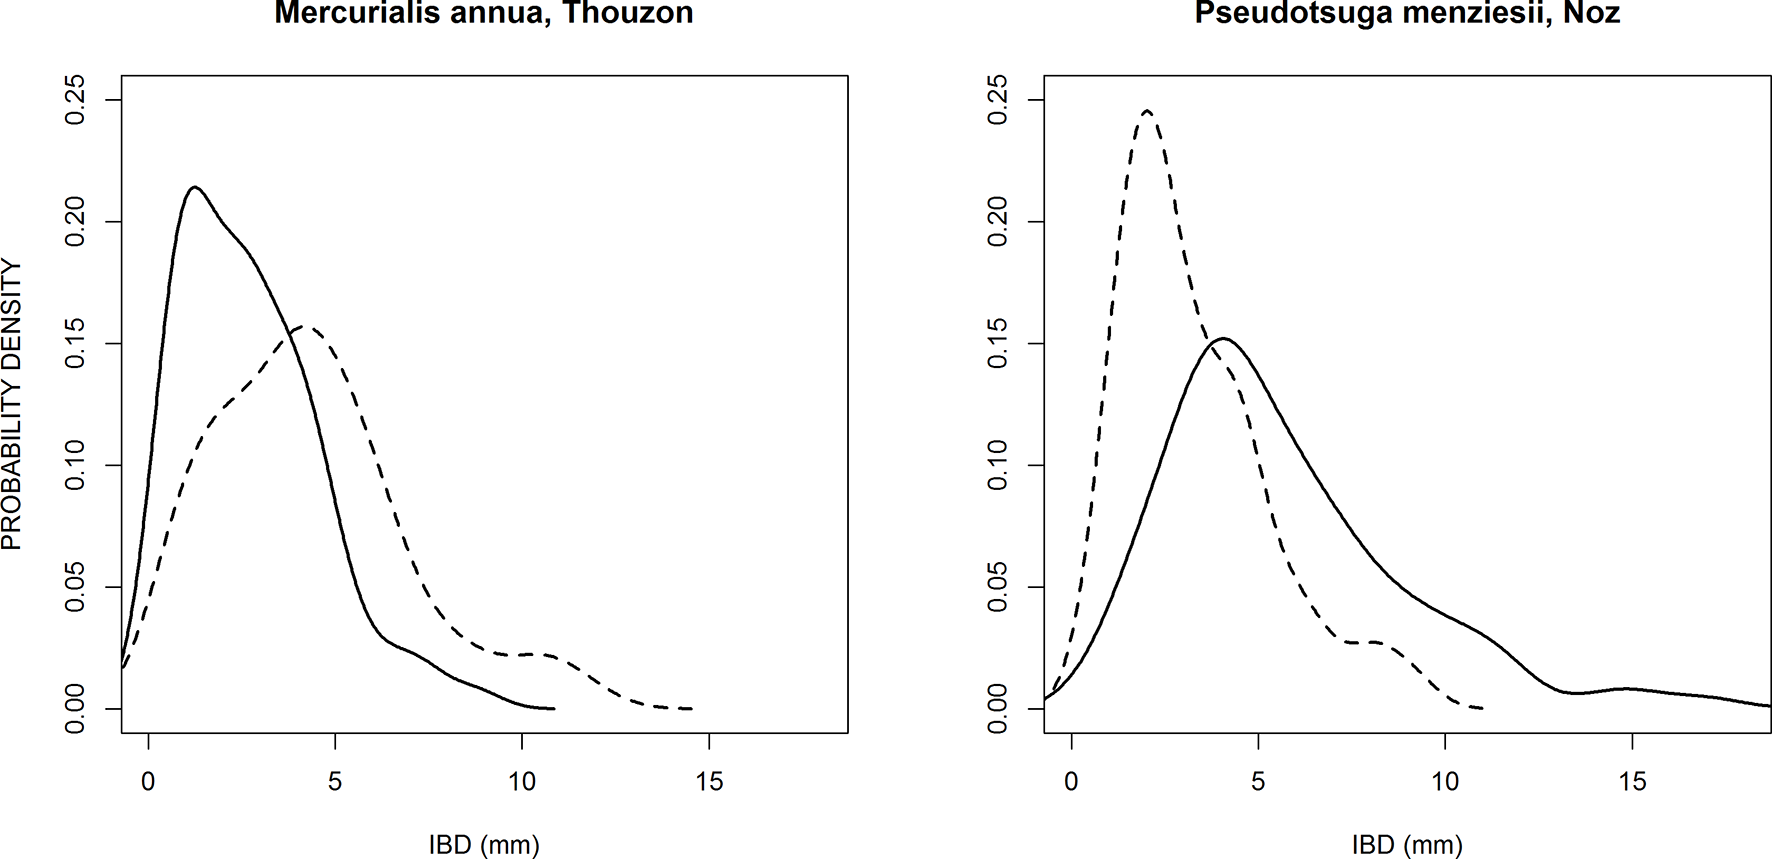
Probability density distributions of two species that exhibited large and opposite differences between the branching patterns of thick parent roots (solid line) and fine parent roots (dashed line).
Discussion
Main Characteristics of the Distributions of IBD
In this study, we confirm that IBD exhibits large variations in each of the 40 species samples, both within the species and between species, as reported for example by Mallory et al., (1970); Kong et al., (2014); Bui et al., (2015); Landl et al., (2018), or Pagès and Kervella (2018). In most works, however, intra-species variations were not studied and were dismissed as noise. These variations are often smoothed over using other measure variables, such as branching density, evaluated by various counting protocols relying on root segments, whole roots, or even whole root systems. The problem is that such estimates of branching density are hardly comparable from one study to another because the obtained values are more or less buffered, and they depend on the developmental stage of the root or root system. The point was thoroughly discussed by Dubrovsky and Forde (2012). Following their main recommendations, we measured this IBD trait in young, although fully branched, parts of individual roots, because such measurements are more suitable to reflect the underlying developmental process of acropetal branching, even though highly variable measurements are obtained when following this method. The point is even more important when the objective of the study is to link the branching process to local environmental variables, such as water and nutrient availability. In our study, we did not consider the radial pattern of emergence that is usually influenced by the internal vascular structure. It would have been difficult because the number of vascular poles varies from one root to the other, and it may even vary along the roots (personal observations).
Despite the large intra-plant variations of IBD, the inter-species variability was so high (nine-fold factor in our study) that the species effect was significant. Because of the large intra-plant and intra-root variations, testing a species or genotype effect requires a sufficient number of measurements for each one of them as well as measurements made in very comparable situations for all. In this study, we had at least 150 measurements per sample combined with 40 different samples. The species effect was not specifically the subject of the present study, but it was demonstrated earlier by Pagès and Kervella (2018) using a dedicated sampling design for the purpose. Our large sampling numbers were also justified because in addition, we intended to evaluate the intra-sample variations associated to the diameter of the parent roots.
Interest of Modeling
This model is the first attempt to simultaneously represent several aspects of the longitudinal branch distribution that have been observed by a number of authors, but on a very limited number of species, using either detailed morphological descriptions (e.g., Riopel, 1966; Riopel, 1969; Charlton, 1975; Charlton, 1982; Charlton, 1983; Varney et al., 1991; Hinchee and Rost, 1992; Newson et al., 1993; Charlton, 1996; Draye, 2002; Landl et al., 2018) or physiologically oriented studies (Dubrovsky et al., 2006; Moreno-Risueno et al., 2010; De Smet, 2012). The main aspects that were reported by several of these authors are that regular longitudinal spacing between laterals tends to be maintained along the parent roots, and that the distributions of IBD are usually skewed with a tail toward the large values (Pagès, 2014; Landl et al., 2018). Using our simple model with three input parameters, these aspects, as well as the general shape of the IBD distributions, can be rendered and quantified in a comprehensive and parsimonious way. This study, which relies on a large number of species, is a way of validating the model and asserting its robustness. Thus, the modeling approach opens the possibility of linking highly focused studies that investigate underlying mechanisms with global and macroscopic observations that aim at simply characterizing the emergent branching pattern, because of its important functional significance. This link helps quantify simply and separately several sub-processes: the creation of the archetypal distance (model parameter ISD), its variations (model parameter CVD), and the probability of accomplishing the whole branching process until lateral emergence takes place on each branching site (summarized by the Pem parameter). These different sub-processes are worth separating because they occur successively, involve various molecular mechanisms, and respond to different environmental stimuli (Dubrovsky et al., 2006; De Smet, 2012).
This model can be integrated as a component (or module) in larger models of the root system architecture (Dunbabin et al., 2013). Branching density is a central process in such models, having the prime role in defining the number of roots and eventually the total root length of the whole root system. Several models of the root system architecture use an average IBD input parameter calibrated for each category of roots, defined by their branching order or other typology. Our results suggest that there are differences between roots regarding their branching distribution, but they are not independent, since the ISD parameter estimates were significantly correlated for fine and thick roots. Therefore, we suggest using a common ISD parameter for all roots and adapting the other important parameter (Pem) to the parent root diameter and possibly to the root position in the surrounding soil. This method would lead to a reduced number of parameters with a more clear and biological meaning.
Use in a Phenotyping Perspective
The parameters of the present model may also be used as interesting traits for root phenotyping approaches. Among the three parameters, we can guess that ISD is rather genetically controlled, whereas Pem may be more sensitive to local conditions and would reflect plasticity. These speculations based on the present results are worth verifying using suitable experimental designs that cross genotypes and environmental conditions. We have seen that ISD can easily be estimated based on the mode of the empirical distribution of IBD, which represents the most frequent inter-branch distance. This value seems relatively easy to obtain, and could be estimated on a reduced number of lateral roots, several tens for instance. The probability parameter Pem has a very different impact on distribution. Its value modifies the right tail of the distribution, so that it can be conveniently estimated via the high-probability quantiles of the distribution. We used the 0.8 level in the present study. According to our model, a Gaussian distribution is obtained as the limit distribution when Pem = 1, i.e., when all branching sites give rise to an emerged lateral root. The importance of the right tail increases with decreasing values of Pem. Therefore, ISD would summarize a genetic potential for the plant regarding branching density, and Pem would summarize the accomplishment of this branching density in the given environmental conditions. The impact of the third parameter (CVD) on the global distribution is lower, and its estimation is more difficult. Thus, its interest from a phenotyping perspective is much lower.
Exploration of Intra-Plant Variations
Thanks to our original data set which relies on many different species and well-developed and highly branched root systems, we could study the inter-branch distance on main roots as well as lateral roots, and chose to study the effects of the diameter of the parent root. We showed that in most species, the ISD values were not impacted by the parent root diameter. Thus, for all these species, the fineness of roots did not modify this archetypal distance. On the other hand, the diameter of the parent root had a higher -although unpredictable- impact on the probability of accomplishing the branching process (Pem parameter). For a majority of species, this probability decreases with decreasing diameters, but it is not a generally observed phenomenon. We also observed opposite cases, where it seems that failure is more probable for thick roots than fine roots.
Since the differences observed for the values of ISD and Pem in the sub-populations of parent roots (thick versus fine) were not independent, we can suspect that it might reflect different plant strategies regarding the positioning of their laterals. Some species had higher densities on their main thick roots, whereas others favored higher densities on their fine roots. Both strategies can make sense and participate in the development of a diversity of branching patterns, in coordination with other developmental processes, as described by Pagès (2014) and Pagès (2016).
It would be very interesting to use this diversity to further explore the molecular mechanisms explaining that laterals have a higher chance to emerge on thick or fine roots within the same genotype.
Conclusion
Therefore, studying simultaneously intra-plant and inter-species variations and using well-developed root systems is an interesting means of raising new questions regarding both the diversity in the foraging strategies of plants and regarding the physiological mechanisms underlying this diversity. The construction and use of such a simple and generic model is a prime way of allowing the quantitative exploration of this diversity.
Statements
Data availability statement
The datasets generated for this study are available on request to the corresponding author.
Author contributions
LP made the conception, data acquisition and analysis, and wrote the paper.
Conflict of interest
The author declares that the research was conducted in the absence of any commercial or financial relationships that could be construed as a potential conflict of interest.
Supplementary material
The Supplementary Material for this article can be found online at: https://www.frontiersin.org/articles/10.3389/fpls.2019.01020/full#supplementary-material
References
1
BarlowP. W.AdamJ. S. (1988). The position and growth of lateral roots on cultured root axes of tomato, Lycopersicon esculentum (Solanaceae). Plant Syst. Evol.158, 141–154. doi: 10.1007/BF00936340
2
BuiH. H.SerraV.PagèsL. (2015). Root system development and architecture in various genotypes of the Solanaceae family. Botany93, 465–474. doi: 10.1139/cjb-2015-0008
3
CharltonW. A. (1975). Distribution of lateral roots and pattern of lateral initiation in Pontederia cordata L. Bot. Gaz.36, 225–235. doi: 10.1086/336808
4
CharltonW. A. (1982). Distribution of lateral root primordia in root tips of Musa acuminata Colla. Ann. Bot.49, 509–520. doi: 10.1093/oxfordjournals.aob.a086276
5
CharltonW. A. (1983). Patterns of distribution of lateral root primordia. Ann. Bot.51, 417–427. doi: 10.1093/oxfordjournals.aob.a086486
6
CharltonW. A. (1996). “Lateral root initiation,” in Plant roots: hidden half. Eds. WaiselY.EshelA.KafkafU. (New York: Marcel Dekker), 149–173.
7
De SmetI. (2012). Lateral root initiation: one step at a time. New Phytol.193, 867–873. doi: 10.1111/j.1469-8137.2011.03996.x
8
DiggleA. J. (1988). Rootmap—a model in 3-dimensional coordinates of the growth and structure of fibrous root systems. Plant Soil105, 169–178. doi: 10.1007/BF02376780
9
DrayeX. (2002). Consequences of root growth kinetics and vascular structure on the distribution of lateral roots. Plant Cell Environ.25, 1463–1474. doi: 10.1046/j.0016-8025.2002.00924.x
10
DrewM. C. (1975). Comparison of effects of localized supply of nitrate, phosphate, ammonium and potassium on growth of seminal root system of Barley. New Phytol.75, 479–490. doi: 10.1111/j.1469-8137.1975.tb01409.x
11
DrewM. C.SakerL. R. (1975). Nutrient supply and growth of seminal root system in Barley. 2. Localized, compensatory increases in lateral root growth and rates of nitrate uptake when nitrate supply is restricted to only part of root system. J. Exp. Bot.26, 79–90. doi: 10.1093/jxb/26.1.79
12
DubrovskyJ. G.FordeB. G. (2012). Quantitative analysis of lateral root development: pitfalls and how to avoid them. Plant Cell24, 4–14. doi: 10.1105/tpc.111.089698
13
DubrovskyJ. G.GambettaG. A.Hernandez-BarreraA.ShishkovaS.GonzalezI. (2006). Lateral root initiation in Arabidopsis: developmental window, spatial patterning, density and predictability. Ann. Bot.97, 903–915. doi: 10.1093/aob/mcj604
14
DubrovskyJ. G.Napsucialy-MendivilS.DuclercqJ.ChengY.ShishkovaS.IvanchenkoM. G.et al. (2011). Auxin minimum defines a developmental window for lateral root initiation. New Phytol.191, 970–983. doi: 10.1111/j.1469-8137.2011.03757.x
15
DunbabinV. M.PostmaJ.SchnepfA.PagèsL.JavauxM.WuL.et al. (2013). Modelling root–soil interactions using three-dimensional models of root growth, architecture and function. Plant Soil372, 93–124. doi: 10.1007/s11104-013-1769-y
16
HenkeM.SarlikiotiV.Buck-SorlinG.KurthW.PagèsL. (2014). Exploring root developmental plasticity to nitrogen with a three-dimensional architectural model. Plant Soil385, 49–62. doi: 10.1007/s11104-014-2221-7
17
HincheeM. A. W.RostT. L. (1992). The control of lateral root development in cultured pea seedlings. III. Spacing intervals. Bot. Acta105, 127–131. doi: 10.1111/j.1438-8677.1992.tb00277.x
18
HodgeA. (2009). Root decisions. Plant Cell Environ.32, 628–640. doi: 10.1111/j.1365-3040.2008.01891.x
19
KongD.MaC.ZhangQ.LiL.ChenX.ZengH.et al. (2014). Leading dimensions in absorptive root trait variation across 96 subtropical forest species. New Phytol.203, 863–872. doi: 10.1111/nph.12842
20
LandlM.SchnepfA.VanderborghtJ.BengoughA. G.BaukeS. L.LobetG.et al. (2018). Measuring root system traits of wheat in 2D images to parameterize 3D root architecture models. Plant Soil425, 457–477. doi: 10.1007/s11104-018-3595-8
21
LavenusJ.GohT.RobertsI.Guyomarc’hS.LucasM.De SmetI.et al. (2013). Lateral root development in Arabidopsis: fifty shades of auxin. Trends in Plant Sci.18, 450–458. doi: 10.1016/j.tplants.2013.04.006
22
LecompteF.PagèsL. (2006). Apical diameter and branching density affect lateral root growth in banana. Environ. Exp. Bot.59, 243–251. doi: 10.1016/j.envexpbot.2006.01.002
23
MalamyJ. E. (2005). Intrinsic and environmental response pathways that regulate root system architecture. Plant Cell Environ.28, 67–77. doi: 10.1111/j.1365-3040.2005.01306.x
24
MalloryT. E.ChiangS.CutterE. G.GiffordE. M. (1970). Sequence and pattern of lateral root formation in five selected species. Am. J. Bot.57, 800–809. doi: 10.1002/j.1537-2197.1970.tb09875.x
25
Moreno-RisuenoM. A.Van NormanJ. M.MorenoA.ZhangJ.AhnertS. E.BenfeyP. N. (2010). Oscillating gene expression determines competence for periodic Arabidopsis root branching. Science329, 1306–1311. doi: 10.1126/science.1191937
26
NewsonR. B.ParkerJ. S.BarlowP. W. (1993). Are lateral roots of tomato spaced by multiples of a fundamental distance. Ann. Bot.71, 549–557. doi: 10.1006/anbo.1993.1071
27
Orman-LigezaB.MorrisE. C.ParizotB.BennetM. J.BeeckmanT.DrayeX. (2018). The xerobranching response represses lateral root formation when roots are not in contact with water. Curr. Biol.28, 3165–3173. doi: 10.1016/j.cub.2018.07.074
28
PagèsL. (2014). Branching patterns of root systems: quantitative analysis of the diversity among dicotyledonous species. Ann. Bot.114, 591–598. doi: 10.1093/aob/mcu145
29
PagèsL. (2016). Branching patterns of root systems: comparison of monocotyledonous and dicotyledonous species. Ann. Bot.118, 1337–1346. doi: 10.1093/aob/mcw185
30
PagèsL.AriesF. (1988). SARAH: modèle de simulation de la croissance, du développement, et de l’architecture des systèmes racinaires. Agronomie8, 889–896. doi: 10.1051/agro:19881008
31
PagèsL.KervellaJ. (2018). Seeking stable traits to characterize the root system architecture. Study on 60 species located at 2 sites in natura. Ann. Bot.122, 107–115. doi: 10.1093/aob/mcy061
32
PagèsL.PellerinS. (1994). Evaluation of parameters describing the root system architecture of field grown maize plants (Zea mays L.). II. Density, length, and branching of first-order lateral roots. Plant Soil164, 169–176. doi: 10.1007/BF00010068
33
PagèsL.Picon-CochardC. (2014). Modelling the root system architecture of Poaceae. Can we simulate integrated traits from morphological parameters of growth and branching? New Phytol.204, 149–158. doi: 10.1111/nph.12904
34
R Core Team. (2013). R: A language and environment for statistical computing. Vienna, Austria: R Foundation for Statistical Computing. URL http://www.R-project.org/
35
RiopelJ. L. (1966). The distribution of lateral roots in Musa acuminata‘Gros Michel’. Am. J. Bot.53, 403–406. doi: 10.1002/j.1537-2197.1966.tb07352.x
36
RiopelJ. L. (1969). Regulation of lateral root positions. Bot. Gaz.130, 80–83. doi: 10.1086/336472
37
RobinsonD. (1994). The responses of plants to nonuniform supplies of nutrients. New Phytol.127, 635–674. doi: 10.1111/j.1469-8137.1994.tb02969.x
38
VarneyG. T.CannyM. J.WangX. L.McCullyM. E. (1991). The branch roots of Zea. 1. 1st order branches, their number, sizes and division into classes. Ann. Bot.67, 357–364. doi: 10.1093/oxfordjournals.aob.a088203
39
WuQ.PagèsL.WuJ. (2016). Relationships between root diameter, root length and root branching along lateral roots in adult, field-grown maize. Ann. Bot.117, 379–390. doi: 10.1093/aob/mcv185
Summary
Keywords
root branching, branching density, inter-branch distance, model, root system architecture, interspecific diversity, phenotype
Citation
Pagès L (2019) Analysis and Modeling of the Variations of Root Branching Density Within Individual Plants and Among Species. Front. Plant Sci. 10:1020. doi: 10.3389/fpls.2019.01020
Received
04 April 2019
Accepted
22 July 2019
Published
08 August 2019
Volume
10 - 2019
Edited by
Laurent Laplaze, Institut de recherche pour le développement (IRD), France
Reviewed by
Peng Yu, University of Bonn, Germany; Joseph G. Dubrovsky, National Autonomous University of Mexico, Mexico; Larry Matthew York, Noble Research Institute, LLC, United States
Updates
Copyright
© 2019 Pagès.
This is an open-access article distributed under the terms of the Creative Commons Attribution License (CC BY). The use, distribution or reproduction in other forums is permitted, provided the original author(s) and the copyright owner(s) are credited and that the original publication in this journal is cited, in accordance with accepted academic practice. No use, distribution or reproduction is permitted which does not comply with these terms.
*Correspondence: Loïc Pagès, Loic.Pages@inra.fr
This article was submitted to Plant Development and EvoDevo, a section of the journal Frontiers in Plant Science
Disclaimer
All claims expressed in this article are solely those of the authors and do not necessarily represent those of their affiliated organizations, or those of the publisher, the editors and the reviewers. Any product that may be evaluated in this article or claim that may be made by its manufacturer is not guaranteed or endorsed by the publisher.