 Richard Oteng-Frimpong
 Felix D. Dakora
- 1Department of Crop Sciences, Tshwane University of Technology, Pretoria, South Africa
- 2Department of Crop Improvement, CSIR-Savanna Agricultural Research Institute, Tamale, Ghana
- 3Chemistry Department, Tshwane University of Technology, Pretoria, South Africa
Groundnut production constitutes an integral part of the livelihoods of the people in the Guinea savanna of West Africa. This region accounts for over 70% of the total groundnut production in Ghana, 90% in Nigeria, and 100% in Mali and Burkina Faso. However, harsh environmental conditions often result in drastic yield reductions. In this study, we identified groundnut genotypes with superior symbiotic efficiency, greater pod yield, and plant water-use efficiency from 21 advanced groundnut breeding lines from ICRISAT after testing them at three locations in the Guinea savanna of Ghana over two consecutive years. Average N contribution by the groundnut genotypes ranged from 48 to 108 kg N ha−1, and mean pod yield from 580 to 2,100 kg ha−1. Genotype 17 (ICGV-IS 08837) produced about 2.5-fold more pods than genotype 1 (Chinese), which was the most widely cultivated variety by farmers. Of the 21 genotypes studied, genotype 16 (ICGV 99247) recorded the highest shoot δ13C value and was superior in water-use efficiency, which was consistent with stability estimates and mean performance. We also measured the effects of G × E on pod yield, N2 fixation, shoot δ13C, and mega-environments for testing groundnut in the Guinea savanna, and these were all significant, although the effect was minimal on shoot δ13C values. Of the locations studied, Nyankpala and Damongo were more discriminating, and each constituted a mega-environment for conducting future groundnut trials in the Guinea savanna. Genotype 3 (ICG 6222) emerged as the best cultivar for the Damongo mega-environment, while genotype 17 was the best genotype for the Nyankpala mega-environment. The genotypes exhibiting the highest sensitivity of N2 fixation in the environment included genotype 3 (ICG 6222), genotype 4 (ICGV 00068), and genotype 10 (ICGV 03315) (bi > 1.3), while Pi estimates ranked genotypes 3, 10, and 17 as the best groundnut cultivars in terms of symbiotic N contribution. Based on the results of this study, genotype 17 (ICGV-IS 08837), genotype 3 (ICG 6222), genotype 10 (ICGV 03315), and genotype 4 (ICGV 00068), which were the most outstanding in terms of the overall pod yield, shoot biomass production, and amount of N-fixed, were the most suitable candidates to recommend for use in developing new varieties for the Guinea savanna of Ghana. Genotype 17 (ICGV-IS 08837) has already been released as a commercial variety for the Guinea savanna of Ghana since October 2018.
Introduction
Groundnut (Arachis hypogaea L.) is an important food security crop cultivated throughout Ghana, with the Guinea savanna accounting for over 70% of total production (MoFA-SRID, 2014). About 90% of farming households in Ghana are involved in groundnut production (Tsigbey et al., 2003). In Africa, groundnut is the most important oilseed crop, usually grown for its edible oil (44 to 56%) and grain protein (22 to 30%), while the haulms also serve as a high protein fodder for livestock (Blümmel et al., 2012), especially in the Sahelian zones of Africa. In Ghana, groundnut is a major source of dietary protein for rural households, with sale of the grain also being a source of cash income (Martey et al., 2015).
Nodulated groundnut is reported to derive about 33–67% of its N nutrition from symbiosis and can contribute between 58 and 171 kg N ha−1 in South Africa (Mokgehle et al., 2014) and up to 101 kg N ha−1 in Northern Ghana (Dakora et al., 1987). The crop, therefore, has the potential to increase the N economy of soils in cropping systems.
However, grain yield on farmers’ fields is very low in the Guinea savanna, ranging from 0.8 to 1.2 t ha−1, which is less than the 3 t ha−1 obtained in China and the USA (FAO, 2014; MoFA-SRID, 2014). This yield gap has been attributed mainly to biotic stresses such as early and late leaf spot diseases caused by Cercosporaarachidicola S. Hori and Cercosporidiumpersonatum Berk. and Curt., respectively, as groundnut rosette disease (Nutsugah et al., 2007; Naab et al., 2009). Low soil fertility and intermittent drought together constitute the major abiotic stress (Hamidou et al., 2012; Vadez et al., 2012; Rademacher-Schulz et al., 2014).
Furthermore, climate change is predicted to result in reduced availability of arable land due to increased water scarcity and rise in temperature (Araus et al., 2014). Therefore, crop production per unit land area must be doubled to meet the food requirements of an ever-increasing population (Vadez et al., 2012; Araus et al., 2014). However, more importantly, crop genotypes that combine high tolerance to abiotic stress with yield stability are deemed to be more desirable by farmers.
Intermittent and terminal drought is experienced on farmers’ field due to the erratic distribution of rainfall in the Guinea savanna of Ghana. Therefore, genotypes that show tolerance to low moisture levels are more desirable for this region. Tolerance to low moisture availability has been studied using yield (pod/biomass) performance under stressed conditions. However, these traits are highly influenced by the environmental conditions and give inconsistent results (Nageswara Rao et al., 2001). The carbon isotope ratio (δ13C), which is a physiological trait, is less influenced by the environment and has been found to be a suitable surrogate for assessing water-use efficiency in groundnut (Wright and Nageswara Rao, 1993; Nageswara Rao and Wright, 1994; Wright et al., 1994). During photosynthesis, plants discriminate against 13C due to its heavier weight and slow diffusion to leaf surface. In effect, 12C is preferentially taken up by plants, resulting in less 13C in plants than in the atmospheric CO2 (O’Leary, 1988; Farquhar et al., 1989). The isotopic fractionation associated with the discrimination against 13CO2 (δ13C) during this process is a reliable indicator of the long-term water-use efficiency in C3 plants (Farquhar and Richards, 1984; Makoi et al., 2010; Mohale et al., 2014). The δ13C has been used to select groundnut genotypes for water-use efficiency under both field and glasshouse conditions (Nageswara Rao and Wright, 1994; Wright et al., 1994; Nageswara Rao et al., 1995; Sheshshayee et al., 2006; Rowland et al., 2012).
Cultivar development based on the assessment of the phenotypic values of different genotypes under varying environmental conditions is needed to select high-yielding and stable varieties (Marfo and Padi, 1999). However, genotypes tested in different locations or years often produce significant varying results in performance due to differences in response to factors such as soil fertility and/or presence of pathogens (Padi, 2007; Padi, 2008). This differential performance referred to as genotype × environment (G × E) interaction can complicate a genotype’s ability to demonstrate superior performance across environments (Fox et al., 1997; Romagosa et al., 2009). This is often manifested by a change in the performance ranking of genotypes or in the magnitude of differences between genotypes across environments (Romagosa et al., 2009). A significant G × E interaction is usually an indication that the effect of a genotype and an environment on a phenotype is not additive, thus resulting in inconsistent performance of genotypes across test sites (Anniccchiarico et al., 2005; Padi, 2008; Malosetti et al., 2013). Thus, the G × E interaction can result in low correlation between phenotypic and genotypic values, leading to a bias in heritability estimates and a slowdown in selection progress (Romagosa et al., 2009). In essence, the G × E interaction usually determines the optimum breeding strategy to adopt (Anniccchiarico et al., 2005; Romagosa et al., 2009).
Several methods can be used to examine G × E interaction (Becker and Leon, 1988; Fox et al., 1997; Malosetti et al., 2013), and these include components of variance analysis, stability analysis, as well as qualitative and multivariate analysis (Becker and Leon, 1988). However, the additive main effects and multiplicative interaction (AMMI) method is one of the most widely used (Romagosa et al., 2009; Malosetti et al., 2013), as it combines the analysis of variance of genotypes and the environment main effects with principal component analysis of the G × E interaction into one model (Gauch et al., 2008; Romagosa et al., 2009; Malosetti et al., 2013). The results of AMMI analysis are thus easily visualized in an interpretable and informative biplot that shows both main effects and G × E interaction (Malosetti et al., 2013). The genotype main effects plus G × E interaction (GGE) model is also effective in measuring and explaining G × E interaction (Gauch et al., 2008; Romagosa et al., 2009; Malosetti et al., 2013). As a tool, the GGE model with biplot display of the first two principal components is more popular among plant breeders (Yan, 2001; Malosetti et al., 2013), as it permits visualization of the data from different perspectives. The effect of G × E interaction on the performance of genotypes can be minimized by grouping fairly homogeneous locations into mega-environments in order to take advantage of specific adaptations (Gauch and Zobel, 1997). There is, however, no consensus on the use of the two models (AMMI and GGE), as they both have known limitations that are inherent to fixed effects models, including difficulty in treating variance heterogeneity and missing data.
The stability of agronomic traits and their contribution to plant growth and grain yield are important for cultivar recommendation (Becker and Leon, 1988), given that genotypes with high genetic potential are usually associated with low yield stability (Padi, 2004), a point that makes the goal of achieving high and stable yields elusive. The stability of genotypes can be measured using the coefficient of variability (CVi), genotypic variance (Si2), linear regression coefficient (bi), mean square deviation from the regression (S2di), stability variance (σi2), ecovalence statistic (Wi), and cultivar superiority estimate (Pi) (Yates and Cochran, 1938; Finlay and Wilkinson, 1963; Eberhart and Russell, 1966; Shukla, 1972; Francis and Kannenberg, 1978; Lin et al., 1986; Lin and Binns, 1988). The bi estimate is considered as a type of dynamic stability where stable genotypes have no deviation from the general response to the environment. Genotypes with a bi value <0.7 are considered unresponsive to the environment, between 0.7 and 1.3 have average stability, and >1.3 are considered to have good response to the environment (Lin et al., 1986; Sudaric et al., 2006). The Pi estimate is defined as the distance mean square between the cultivar’s response and the maximum response averaged over all locations, and a small mean square generally indicates superiority of the test cultivar (Lin and Binns, 1988; Lin and Binns, 1991).
There is a need to identify high-yielding new crop varieties adapted to the nutrient-poor soils and harsh climatic conditions of the Guinea savanna of Ghana. Unfortunately, however, effective cultivar selection is compounded by environmental variation and G × E interaction, which slow down the process. The aim of this study was to select superior groundnut genotypes with high and stable yields (though sometimes elusive), to identify mega-environments for groundnut selection in the Guinea savanna of Ghana, and find genotypes that are winners in the test environments.
Materials and Methods
Experimental Sites and Plant Materials
The experiments were conducted at Nyankpala, Yendi, and Damongo in the Guinea savanna of Ghana during the 2012 and 2013 cropping seasons. The Guinea savanna is characterized by a unimodal annual rainfall of 900–1,100 mm, which starts in May and ends in September/October each year (MoFA-SRID, 2014). The soil chemical characteristics, GPS coordinates, temperatures, and annual rainfall at the experimental sites in 2012 and 2013 are shown in Table 1.
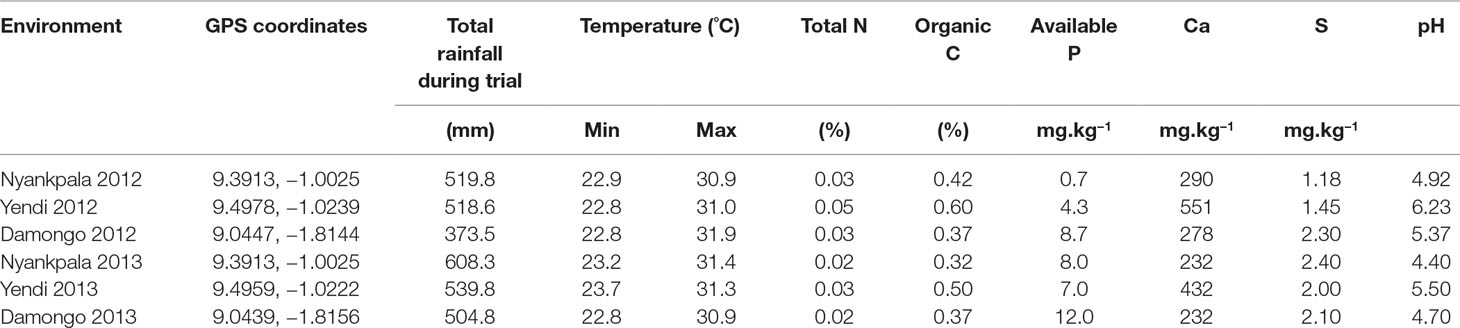
Table 1 Environmental and soil characteristics of sites used in this study.
Twenty-one groundnut genotypes comprising 17 advanced breeding lines from ICRISAT, 3 varieties from Ghana, and 1 variety from Nigeria (Table 2) were used in this study. Their pedigree, sources, and biological traits (maturity levels, leaf color, and seed coat color) are shown in Table 2. A randomized complete block design with four replicate plots was used. Each plot measured 3 m × 2 m with six rows. Inter- and intrarow spacings were 40 and 15 cm, respectively. The genotypes were sown in late July to early August in 2012 and 2013. No inputs (chemical fertilizers, rhizobial inoculants, etc.) were applied in this study. Weeds were controlled manually with a hoe, when necessary.
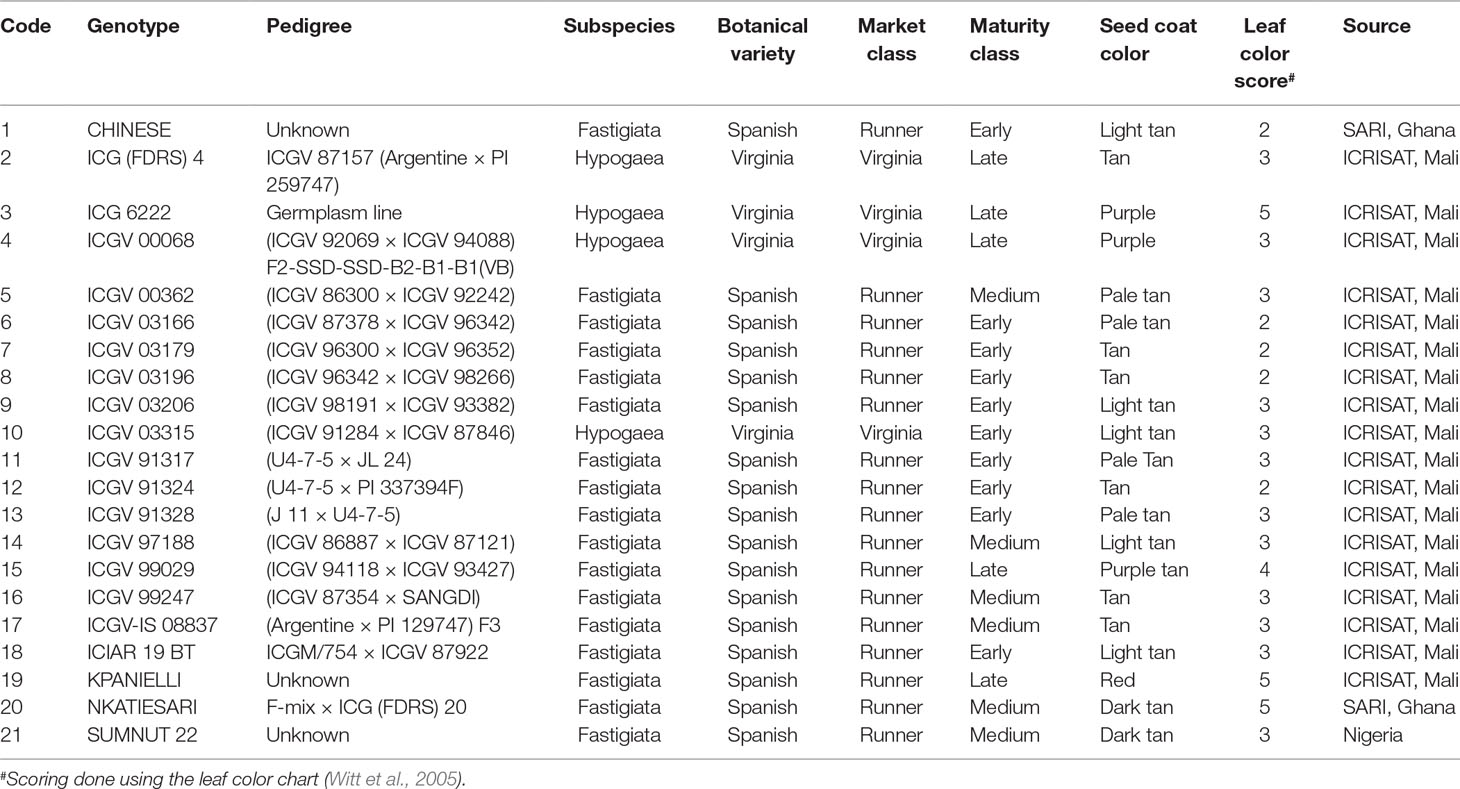
Table 2 Genotypes used in this study and their sources.
Data Collection
Pod yield was determined for plants harvested from a 1-m2 area at physiological maturity for all sites, except Yendi in 2012. The pods per unit area were air dried to a constant weight and pod yield (kg ha−1) estimated for each plot using plant density.
Plant biomass yield was assessed from weighing groundnut shoots dried at 60°C for 72 h. The dried shoots were milled and sieved through a 0.5-mm mesh. Subsamples of the ground powder were analyzed using mass spectrometry for 15N/14N and 13C/12C composition. The 15N/14N values were used to calculate the δ15N of each genotype using the following formula:
Nonleguminous species (reference plants) growing on the plots at the time of biomass sampling were also collected and processed in a similar manner as the groundnut shoots. The reference plants used included Celosia laxa, Euphorbia heterophylla, Hyptis suorelense, Zea mays, Panicum spp., Sorghum bicolor, Tridax procumbens, Cassia obstusifolia, and Andropogon gayanus. The δ15N of these nonlegumes were also determined as described earlier. The mean δ15N value of the reference plants and individual groundnut shoots were used to calculate the percent nitrogen derived from the atmosphere (%Ndfa) and, finally, the amount of N-fixed by the different genotypes using the formula below (Shearer and Kohl, 1986; Unkovich et al., 2008);
where δ15Nref is the mean δ15N of nonleguminous species used as reference plants, δ15Nleg is the δ15N value of the respective groundnut shoots, and the Bvalue is the δ15N value of a groundnut plant that depended solely on atmospheric N2 for its N nutrition. For this study, the Bvalue used was −1.35‰ (Unkovich et al., 2008).
The amount of N-fixed per plant was calculated using the following method proposed by (Maskey et al., 2001; Pule-Meulenberg et al., 2010):
Shoot δ13C was calculated from the 13C/12C in each shoot sample using the formula below (Mohale et al., 2014);
Data Analysis
Analysis of variance (ANOVA) was done for each data set using GenStat v.12.1 (Payne et al., 2009). Homogeneity of variances was tested for all traits in the three locations in 2012 and 2013 using the Bartlett’s test.
The data for the three locations and two seasons were combined to give a total of six environments and analyzed using a two-way ANOVA. Genotypic ( ) and phenotypic ( ) variances were computed using the expected mean squares from the analysis of variance table, as described by Ntawuruhunga and Dixon (2010). Broad sense heritability (H2) was estimated (Padi, 2008) as
where = genotypic variance, = phenotypic variance, = genotype × environment variance, = pooled error, E = number of environments, and R = number of replicates.
Estimates of the phenotypic coefficient of variation (PCV) and genotypic coefficient of variation (GCV) were obtained as described by Singh and Chaudhary (1979):
where ‘X’ = grand mean of trait
Single-site analysis using residual maximum likelihood (REML) method was also done with genotypes as random effects to obtain the best linear unbiased predictions (BLUPs) of the mean for estimating variance components related to the genotypes and design factors using Breeding View v. 3.0 software (Breeding Management System v.3.0.1). The broad sense heritability for each trait was calculated from the variance components. The analysis was repeated with genotypes as fixed effects to obtain the best linear unbiased estimates (BLUEs) of the mean for use in the G × E interaction analysis. The G × E interaction was assessed with the AMMI2 model, and the scores of the first two principal components (IPCA 1 and IPCA 2) were plotted to visualize the G × E interaction on genotypes, as well as the adaptation of genotypes to the test environments. GGE biplot statistical software was used to visualize the mean versus stability and which-won-where biplot (Yan, 2001; Yan and Tinker, 2006). The correlation between environments was computed and the stability of each genotype over the environments calculated using the bi, and Pi model.
Results
Analysis of Variance
Single site ANOVA (data not shown) revealed highly significant differences (p<0.05) among the genotypes for pod yield in each of the test environments (Table 3). The combined ANOVA revealed highly significant effects of genotypes, locations, years, and the interactions for all measured traits (Table 4). For all measured traits, locational effects accounted for the highest proportion of the total variation in the phenotype. In pod yield, location accounted for 55% of the total sum of squares, with genotype and G × E interaction accounting for only 14 and 15% of the total sum of squares, respectively, for pod yield (Table 4). Location effect on shoot biomass was high (34% of total sum of squares), while genotypic effect was moderate (14% of total sum of squares). The interactive effect of G × E on shoot biomass was moderate and accounted for only 16% of the total sum of squares (Table 4). The amount of N-fixed was highly influenced by location, which accounted for 47% of the total sum of squares. However, genotype and G × E interaction on N-fixed was moderate and accounted for 12.7 and 12.8%, respectively, of the total sum of squares (Table 4). Shoot δ13C values were largely influenced by the genotype (36% of total sum of squares) and the location (29% of total sum of squares), while only 9% of the variation was attributable to G × E interaction (Table 4).
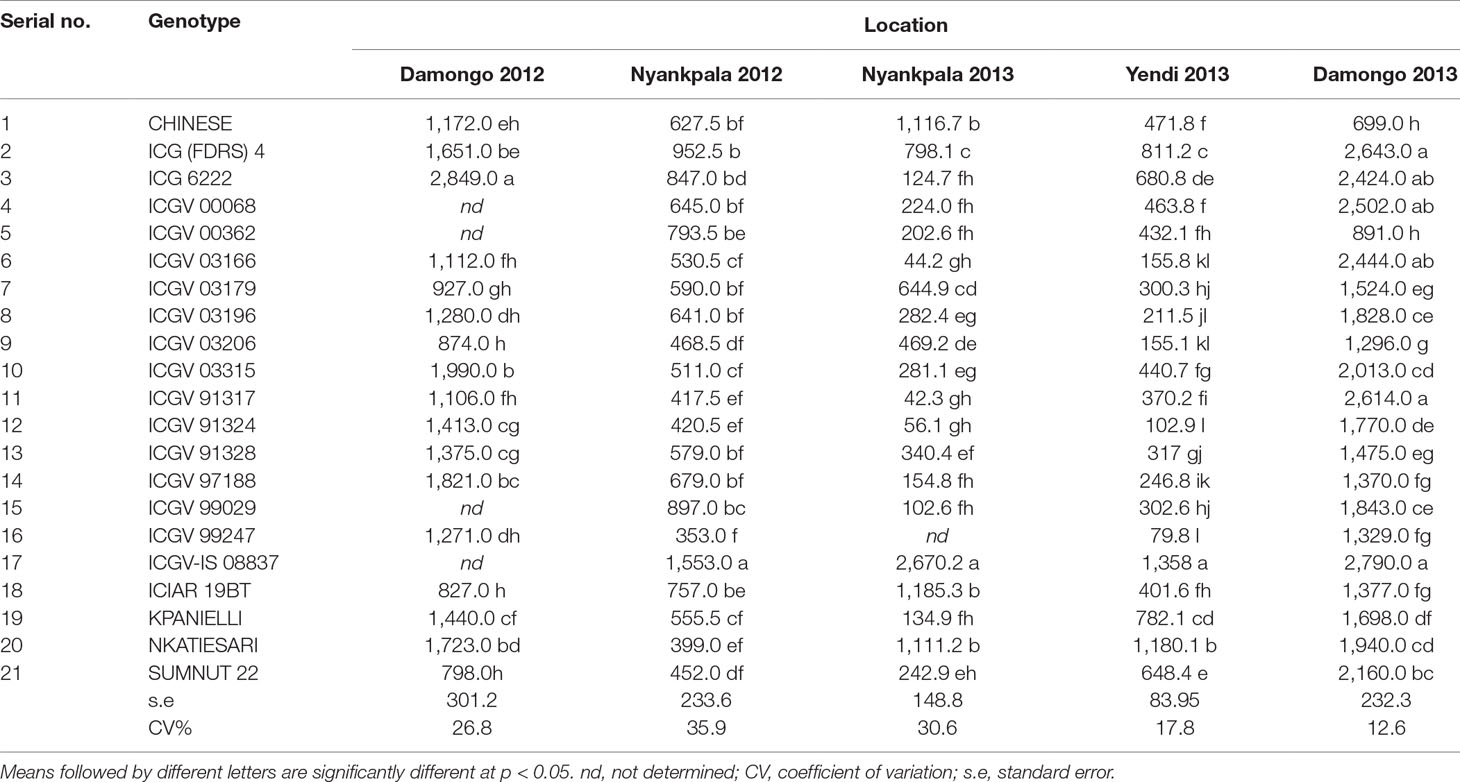
Table 3 Mean pod yield (kg ha−1) of groundnut genotypes evaluated in the guinea savanna of Ghana between 2012 and 2013.
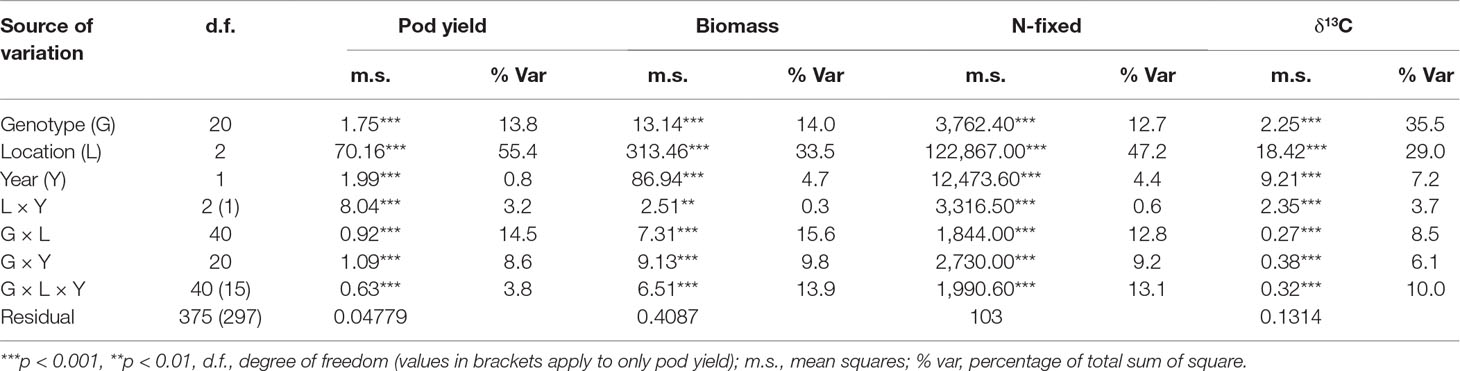
Table 4 ANOVA of pod yield, shoot biomass, N-fixed, and shoot δ13C values of 21 groundnut genotypes tested at three locations over 2 years.
Analysis of G × E Effect Using AMMI Model
The AMMI model partitioned the total G × E effect into two principal components (IPCA1 and IPCA2, Table 5). For pod yield, IPCA1 and IPCA2 were both highly significant (p < 0.001) and accounted for 82% of the total G × E interaction. With shoot biomass, both IPCA1 and IPCA2 were again significant (p < 0.001 and p < 0.01, respectively) and accounted for 79% of the total G × E interaction. About 87% of the total G × E interaction affecting N-fixed was explained by IPCA1 and IPCA2 values, which were both highly significant (p < 0.001). For shoot δ13C, IPCA1 and IPCA2 were both significant (p < 0.01) and together accounted for 62% of the total G × E interaction.
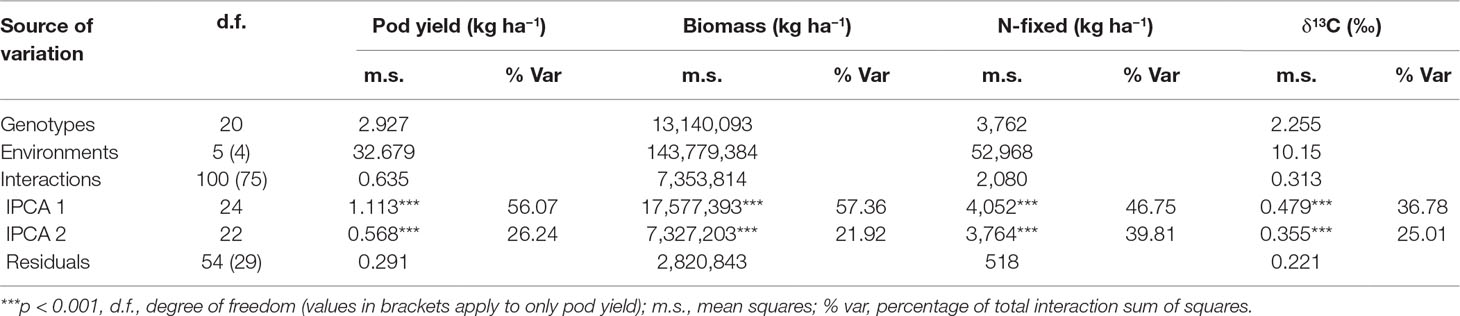
Table 5 ANOVA table for AMMI model applied to pod yield, shoot biomass, N-fixed, and shoot δ13C values of groundnut genotypes tested in six environments.
Genetic Variation in Traits and Variance Components
Pod yield ranged from 580 to 2,100 kg ha−1, with a mean of 960 kg ha−1 (Table 6). The genetic variation in pod yield was higher at Damongo in 2013 and lowest at Nyankpala in 2012 (Figure 1A). Shoot biomass ranged from 3,900 to 6,900 kg ha−1, with a mean of 4,950 kg ha−1 (Table 6). The genetic variation in shoot biomass was higher at Damongo in 2012 and lowest at Yendi in 2013 (Figure 1B). The amount of N-fixed ranged from 48 to 108 kg ha−1, with a mean of 64 kg ha−1 (Table 6). The extent of variation in N-fixed was highest at Nyankpala in 2012 and lowest at Nyankpala in 2013 (Figure 1C). Shoot δ13C values also ranged from −28.0 to −26.8‰, with a mean of −27.62‰ (Table 6). The genetic variation in shoot δ13C was highest at Nyankpala in 2013 and lowest at Damongo in 2013 (Figure 1D).
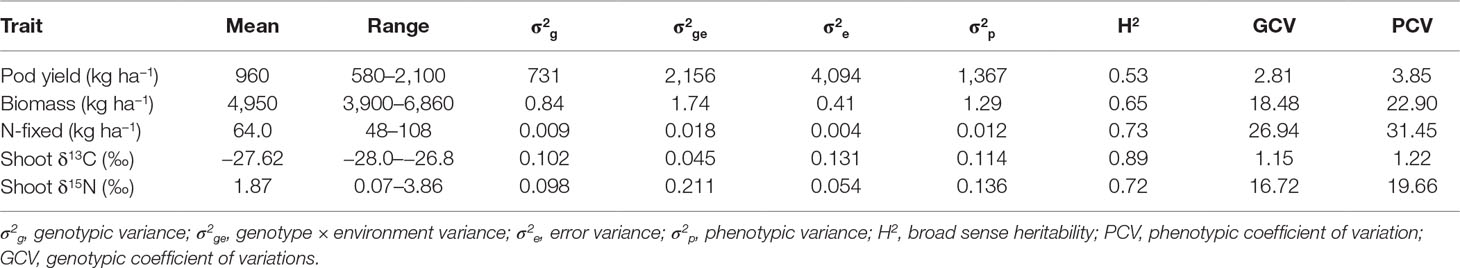
Table 6 Estimates of mean, range, variance components, broad sense heritability, and genotypic and phenotypic coefficient of variation for selected traits of 21 groundnut genotypes grown in six environments.
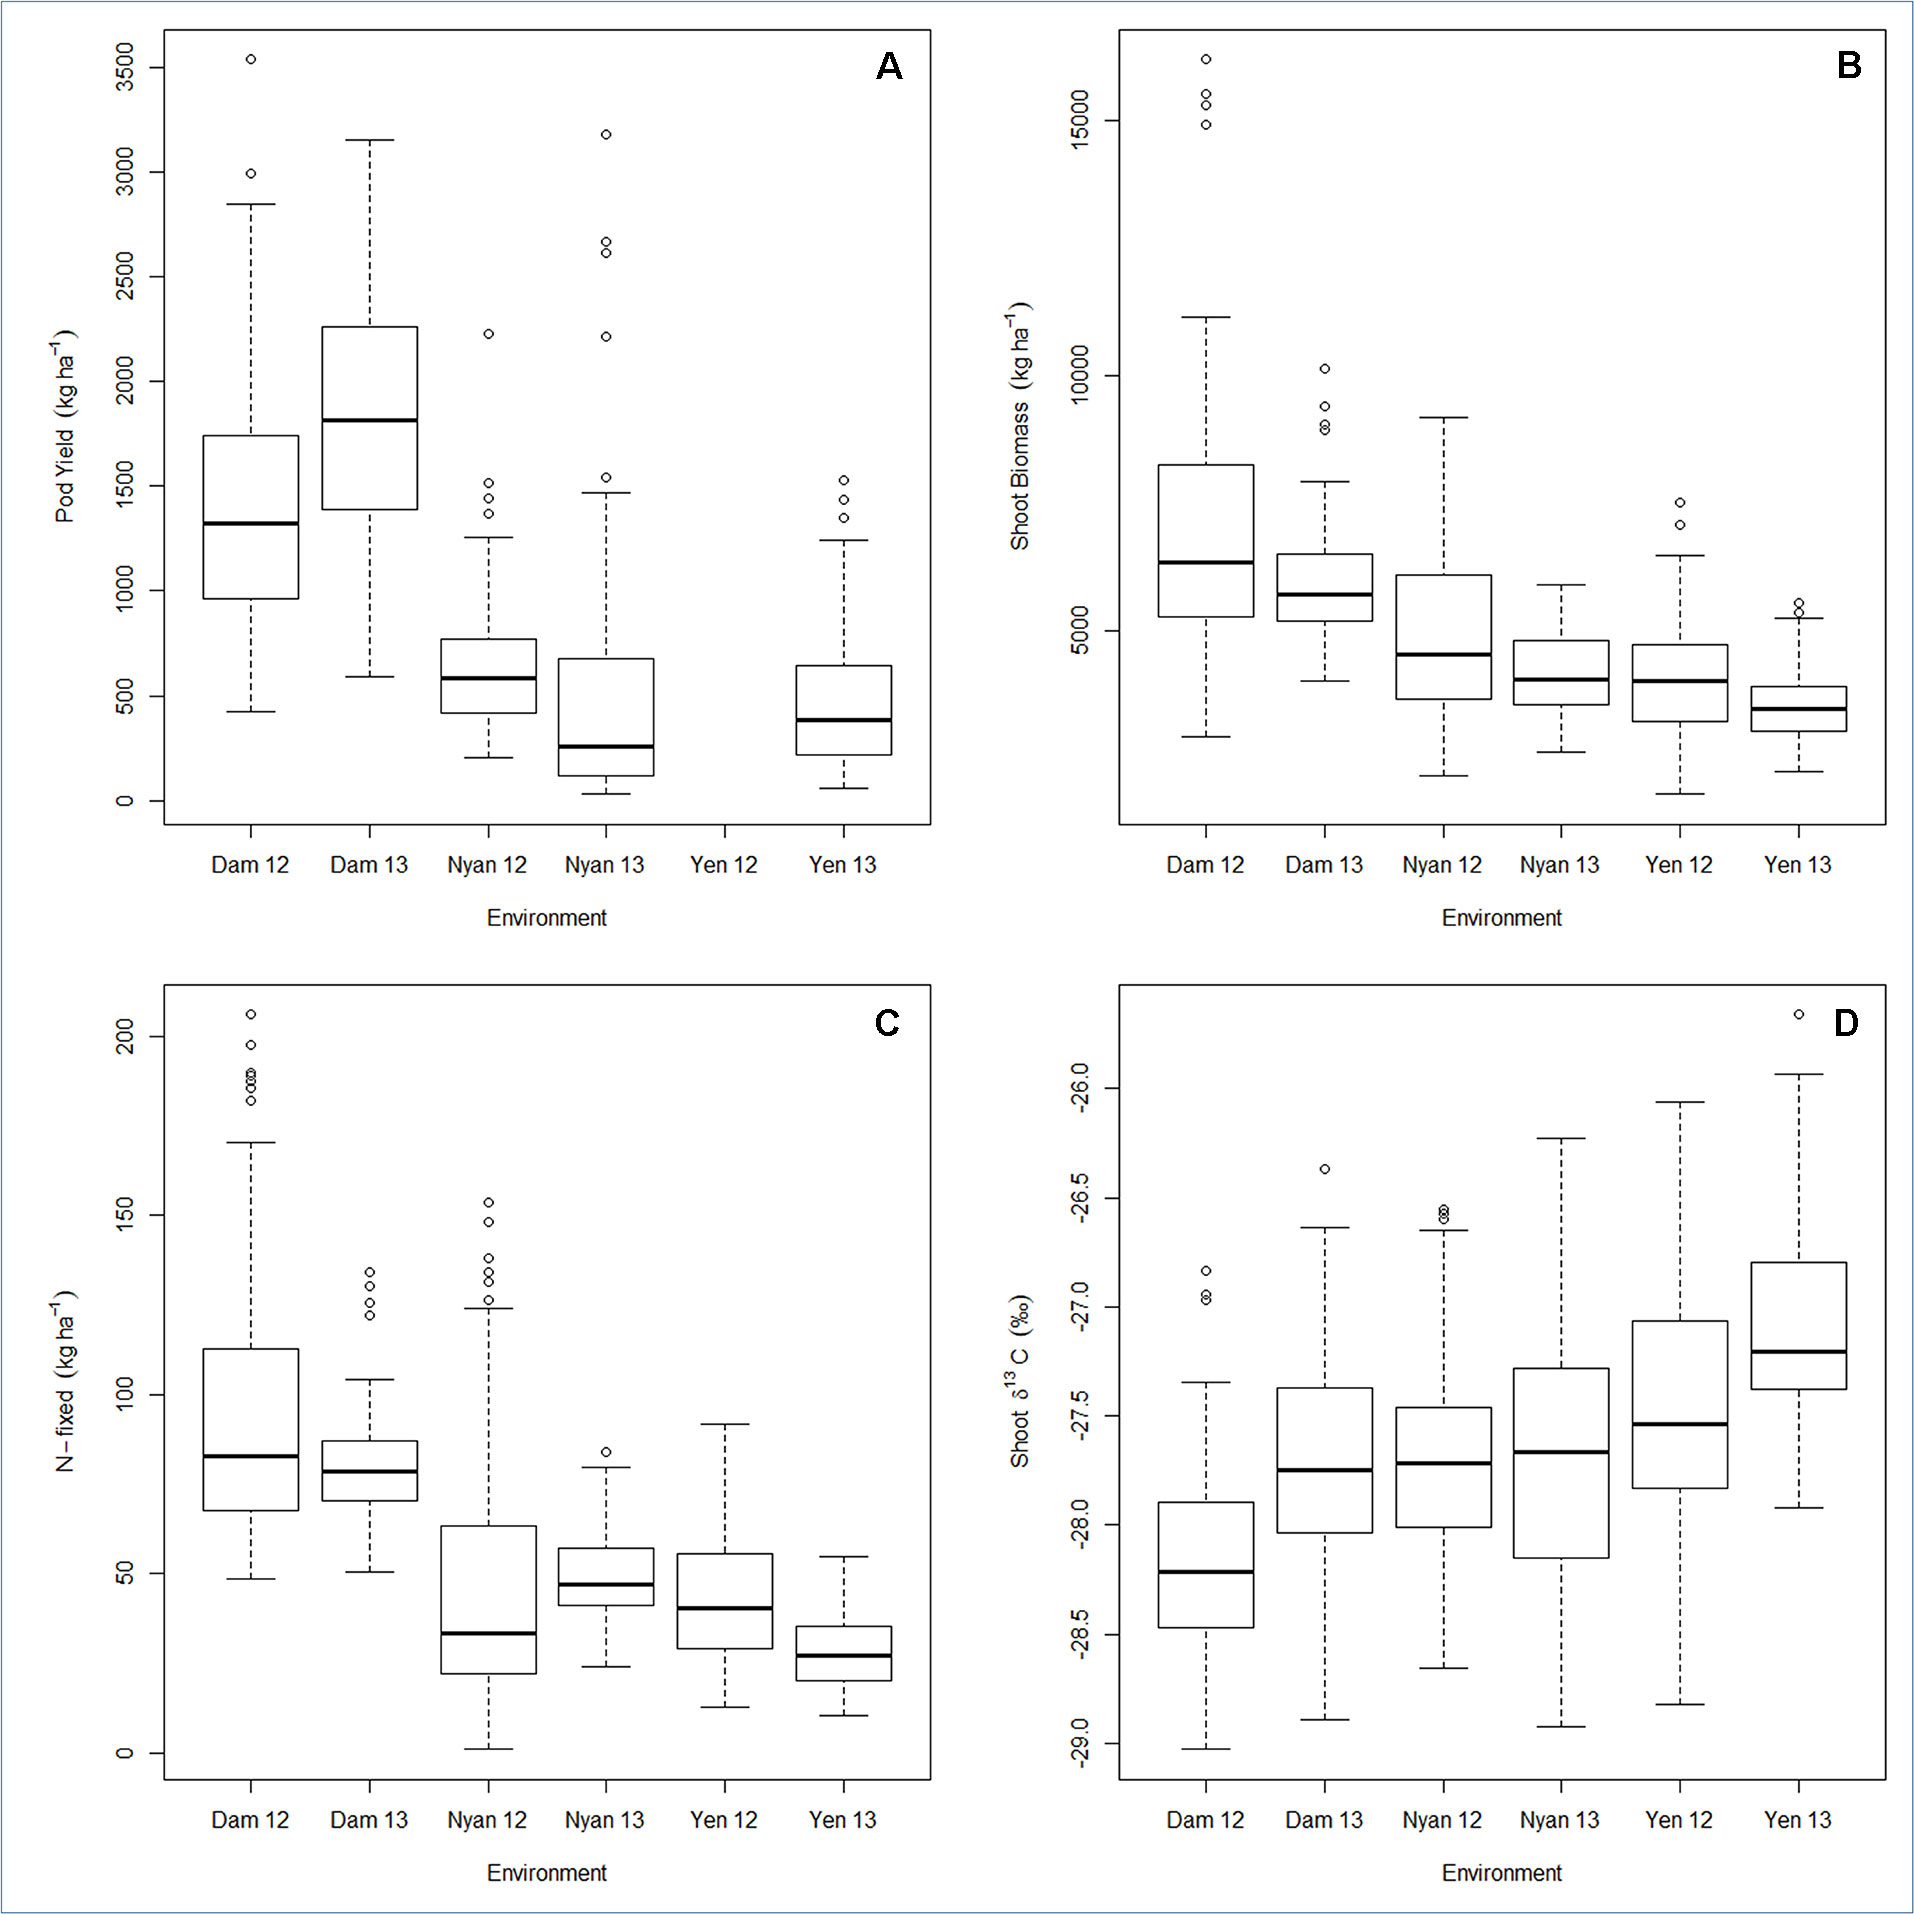
Figure 1 Box plot for (A) pod yield, (B) shoot biomass, (C) N-fixed, and (D) shoot δ13C displaying the total range, interquartile range, and median. Environment names are coded as Dam, Damongo; Nyan, Nyankpala; Yen, Yendi. The 12 refers to 2012, while 13 refers to 2013.
The G × E interaction variance (σ2ge) accounted for the highest phenotypic variance (σ2p) for the traits studied (Table 6). With the exception of pod yield, σ2ge was higher than genotypic variance (σ2g) and error variance (σ2e) for shoot biomass, amount of N-fixed, and shoot δ13C. Broad sense heritability estimates were 65% for shoot biomass, 72% for shoot δ13C 73% for amount of N-fixed, and a moderate 53% for pod yield. Genotypic coefficient of variation (GCV) ranged from 1.15% for shoot δ13C to 26.94% for amount of N-fixed. However, phenotypic coefficient of variation was moderate for shoot δ13C and pod yield (>10%) but high for shoot biomass and N-fixed (>20%).
Mean Versus Stability and Stability Analysis
The average environments coordinate (AEC) of the GGE biplot compared the means of genotypes relative to their stability. AEC–GGE biplots were generated for pod yield, shoot biomass, amount of N-fixed, and shoot δ13C values in groundnut grown at six environments (Figure 1A–D, Supplementary Figure 1).
The mean pod yield of the genotypes in each environment are presented in Table 3. Genotype 17 (ICGV-IS 08837) was the best in pod yield on the AEC–GGE biplot, with genotype 21 (SUMNUT 22) being just above average (Supplementary Figure 1A). However, genotype 20 (NKATIESARI) and genotype 2 [ICG (FDRS) 4] successfully combined high pod yield with stability, with genotype 17, genotype 2, ICGV 6222, genotype 10 (ICGV 03315), and genotype 20 also displaying potential for superior pod yield when compared to the rest (Supplementary Figure 1A). Of the latter group, genotype 17 exhibited the least sensitivity to the environment (bi = 0.61), followed by genotypes 20 and 2, which were moderately sensitive (bi = 0.76 and 1.23, respectively). The remaining genotypes with high pod-yielding potential were very sensitive to the environment (bi > 1.3). Of all the genotypes tested, genotype 1 (CHINESE) showed the least sensitivity (bi = 0.07) to the environment for pod yield. Cultivar superiority estimates confirmed the high-yielding genotypes as the best materials for increased groundnut production in the Guinea savanna of Ghana.
Shoot biomass accumulation was highest in genotypes 3 and 4 (ICGV 00068) (6,860 and 6,270 kg ha−1, respectively), a point confirmed by the AEC-GGE biplot, even though genotype 3 showed higher stability than genotype 4 (Supplementary Figure 1B). Only three genotypes (genotypes 3, 4, and 17) showed high sensitivity to the environment (bi > 1.3) with regards to accumulation of shoot biomass (Supplementary Table 1); other genotypes were less or moderately sensitive to environmental factors. The Pi estimates identified genotypes 3 and 4 as exhibiting the best plant growth and greater shoot biomass accumulation.
Amount of N-fixed was highest for genotypes 3 and 17 (108 and 88 kg N ha−1, respectively), a superiority confirmed by the AEC–GGE plot, which showed that only 6 out of the 21 genotypes evaluated recorded above average symbiotic performance (Supplementary Figure 1C). The genotypes exhibiting the highest sensitivity of N2 fixation to the environment included genotypes 3, 4, and 10 (bi > 1.3), with the remaining 18 genotypes showing low to moderate sensitivity of the symbiosis to the environment. In this study, Pi estimates ranked genotypes 3, 10, and 17 as the best groundnut cultivars in symbiotic N contribution (Supplementary Table 1).
With shoot δ13C, genotypes 2, 5 (ICGV 00362), and 14 (ICGV 97188) all had bi values >1.3, with only genotype 3 showing <0.7 bi value. The remaining genotypes showed moderate sensitivity (bi <1.3 to >0.7) of shoot δ13C to the environment. However, the Pi estimates ranked genotypes 16 (ICGV 99247) (−26.80‰), genotype 5 (−27.15‰), and genotype 2 (−27.28‰) with greater δ13C values or higher water-use efficiency than the remaining genotypes (Supplementary Table 1).
Of all the traits studied, mean performance ranking was positively correlated to Pi ranking, but negatively correlated to bi. Pod yield was the only trait with Pi and bi rankings that were not significantly correlated.
Identification of Mega-Environments and Best Expressed Traits in Genotypes
Based on pod yield, two mega-environments were identified for groundnut in the Guinea savanna of Ghana (Supplementary Figure 2A). One mega-environment comprised two environments which were Damongo 2012 and Damongo 2013. Of the 21 genotypes tested, genotype 3 emerged as the best cultivar for this mega-environment. The second mega-environment identified in terms of pod production consisted of Nyankpala 2012, Nyankpala 2013, and Yendi 2013, and here, genotype 17 emerged as the best groundnut genotype. In contrast, three mega-environments were identified based on shoot biomass production (Supplementary Figure 2B). Nyankpala 2012 and Nyankpala 2013 environments were placed in two different mega-environments. Genotype ICIAR 19 BT was the best genotype in biomass accumulation in the Nyankpala 2013 mega-environment, while genotype 5 emerged as the best in biomass production in the Nyankpala 2012 mega-environment. The third mega-environment in terms of shoot biomass comprised Yendi 2012, Yendi 2013, Damongo 2012, and Damongo 2013, with genotype 4 producing the highest biomass.
Two mega-environments were identified in the Guinea savanna of Ghana for the amount of N-fixed by groundnut (Supplementary Figure 2C). The first mega-environment consisted of four environments, namely, Nyankpala 2012, Damongo 2012, Damongo 2013, and Yendi 2013, with genotype 3 as the highest in symbiotic N contribution. The second mega-environment comprised Yendi 2012 and Nyankpala in 2013, with genotype 4 as the best in symbiotic N yield.
With δ13C, all the six tests used in this study were grouped together to form one mega-environment (Supplementary Figure 2D). In this cluster, genotype 16 exhibited the highest δ13C value (or water-use efficiency), a finding consistent with stability estimates.
Discussion
The effect of G × E interaction on any trait is observable when genotypes differentially perform across environments (Malosetti et al., 2013). The G × E interaction therefore poses a challenge to effective selection during breeding as it can reduce the heritability of traits in different environments (Romagosa et al., 2009). A genotype with a high mean performance and a low G × E interaction is usually considered suitable for a larger environment. However, when G × E interaction is high, genotypes may be selected for local adaptation (Gauch and Zobel, 1997). To ensure high yield stability and economic returns in the Guinea savanna, superior groundnut genotypes should be adapted to a broad range of environmental conditions. However, to avoid risk, farmers want genotypes that always win, as it is difficult to achieve consistent yields under their growing conditions (Padi, 2008). This means that information on G × E interaction and yield stability ought to be critical for any groundnut breeding program in the Guinea savanna.
In this study, the genotypic variance, environmental variance, and G × E interaction variance for the groundnut genotypes were highly significant for pod yield, shoot biomass, N-fixed, and shoot δ13C values. Although the genotype main effect for pod yield, shoot biomass, and N-fixed was also highly significant, it contributed <15% to the total sum of squares, in contrast to the genotype main effect for δ13C, which contributed 35% of the total sum of squares. This suggested that environmental influence on shoot δ13C values was low, justifying the need for the use of this physiological trait in the identification of drought-tolerant groundnut genotypes in multienvironment field trials (Nageswara Rao et al., 2001; Arunyanark et al., 2008). The large location effect on pod yield, biomass, and N-fixed reported in this study is consistent with the study of Gauch and Zobel (1996), who reported that a median yield trial has ∼70% of variation in E, 20% in GEI, and 10% in G, clearly indicating that the location effect is always larger than the other components.
While it may be argued that the plot size sampled for yield analysis in this study is small, optimum plot size is a function of soil/field heterogeneity. Breeding programs make use of single row plots to limit the space requirement for experiments and reduce heterogeneity in experimental plots (Upadhyaya et al., 2005; Oteng-Frimpong et al., 2019). Using small plot sizes to extrapolate yield on a per ha−1 basis is not new, especially when dealing with a large number of genotypes.
Marfo and Padi (1999) found strong contributions by genotype and location main effects as well as their interaction to variation in pod yield of 12 groundnut accessions evaluated in the Guinea savanna of Ghana. The G × E interaction was also found to significantly influence the yield of 47 groundnut genotypes in the same savanna environment (Padi, 2008). The findings of this study are therefore consistent with those of Marfo and Padi (1999) and Padi (2008) and thus underscored the strong effect of G × E interaction on groundnut production in the Guinea savanna. The highly significant year × location and year components of the total sum of squares emphasized that both the predictable environment (location) and the unpredictable environment (year) sources of variation were important in the performance of groundnut in the Guinea savanna (Adugna and Labuschagne, 2002). This, however, demonstrated the difficulty in selecting superior groundnut genotypes for such an environment.
A major contributor to genotypic variation in this study was the differences in soil fertility across the test environments and the spatial variability, as there was no plot-to-plot variation in plant density. As shown in Table 1, the soil sampled from Damongo in 2012 contained 300 mg N kg−1 and 8.7 mg kg−1 of available P, while the soil from Yendi contained 500 mg N kg−1 and 4.3 mg kg−1 of available P. High soil N can inhibit N2 fixation in groundnut (Mokgehle et al., 2014), while high levels of plant-available P enhances plant growth and N2 fixation in legumes, including groundnut (Bhadoria et al., 2002; Naab et al., 2009; Ohyama et al., 2011; Mohamed and Abdalla, 2013; Jat and Meena, 2014; Tanabata and Ohyama, 2014). It is therefore understandable that plant growth, N2 fixation, and pod yield were higher at Damongo (low soil N and higher P) than Yendi, where soil N was higher and P lower. An example was seen in genotype 12 (ICGV 91324), which fixed 74 kg ha−1 N at Damongo, while at Yendi, it fixed only 22 kg ha−1. Although it can be argued that plant growth and symbiotic performance with zero inputs (rhizobial inoculants, chemical fertilizers, etc.) at each site in this experiment was due to variation in native rhizobial strains and mineral nutrients across sites, the study directly mimicked farmer practice in the region.
Rainfall was another important contributor to the variation in plant growth, N2 fixation, and pod yield of groundnut genotypes across the test environments. Although the total amount of rainfall recorded during the trials seemed enough to support optimal plant growth (Table 1; Guled et al., 2013), the distribution was poor and had a negative effect on N2 fixation and pod yield (Kumar et al., 2012). For example, at Nyankpala, there was a break in rainfall for over 25 days in 2013 (just before flowering), a drought event that resulted in soil water deficit. The plants were thus exposed to temporary drought which impacted negatively on pod yield (100 kg ha−1) of genotype 6 (ICGV 03166), genotype 11 (ICGV 91317), and genotype 12. However, these same genotypes produced >1,700 kg ha−1 pod yield at Damongo, a location that experienced relatively better rainfall distribution during the same 2013 cropping season. The temporary drought imposed as a result of the poor rainfall distribution could also explain the high variability in shoot δ13C values observed at Nyankpala (Craufurd et al., 1999; Anyia and Herzog, 2004; Songsri et al., 2013).
Although the mean maximum daily temperature difference between environments was <1°C, its differential effect on crop plant growth, and hence contribution to G × E interaction, cannot be ignored (Prasad et al., 2000). In fact, small differences in vapor pressure deficit (not measured in this study) at study sites elsewhere contributed differentially to plant growth and yield, and this might have resulted in the observed G × E interaction (Kumar et al., 2012).
Using a limited number of seasons and their interactions to define mega-environments for identifying best performing genotypes can be fraught with risk if the planting season is not representative of the location, so an alternative to that is the use of crop stimulation models which take into consideration longer-term climate changes (Chenu, 2014). However, in this study, the planting seasons were quite representative of the locations. It is also important to note that genotype 1, which was the recommended variety used by farmers in the early 1980s, proved inferior to many genotypes in this study, especially genotype 17. The declined yield of genotype 1 cultivated since the 1980s indicated why breeding programs must continue to release new varieties to replace old ones that exhibit declining yields.
The observed high shoot δ13C values of genotype 16 at all the test environments clearly indicated its greater water-use efficiency and hence drought tolerance relative to the other genotypes (Wright et al., 1988; Wright et al., 1994; Condon et al., 2004). Increased water-use efficiency can be achieved either through greater photosynthetic capacity, a reduction in stomatal conductance, or both (Condon et al., 2002; Condon et al., 2004). However, a reduction in stomatal conductance usually results in decreased photosynthesis and consequently decreased biomass accumulation. This probably explained why, in this study, genotype 16, which exhibited greater water-use efficiency, had low shoot biomass and pod yield. The drought tolerance genes of genotype 16 could therefore be used to improve genotypes 17, 3, and 20, which recorded higher shoot biomass and greater pod yield but displayed lower water-use efficiency by adopting conventional backcrossing and/or marker-assisted backcrossing.
In this study, the AMMI2 model proved useful in partitioning the G × E interaction as the first two principal components could explain more than 80% of the total G × E interaction for all the traits studied. The Nyankpala and Damongo environments accounted for a greater proportion of the total G × E interaction for pod yield, shoot biomass, and amount of N-fixed. Interestingly, these two locations were also the most discriminatory for the same traits, as they fell relatively far away from the AEC axis (Figures 1A–D, S3). Soil fertility was better at Damongo compared to Nyankpala and Yendi, and this probably accounted for the observed differences in genotypic performance in the contrasting locations. in Addition, rainfall at Nyankpala was more erratic compared to Damongo and Yendi. Thus, the poor rainfall distribution at Nyankpala in 2013 could be responsible for the marked variation in shoot δ13C at that site compared to the other locations. The differences in environmental conditions at these two locations might have accounted for the observed high G × E interaction effect on the genotypes.
Heterogeneity of genotypic variances among and between environments, as well as a lack of genetic correlation among environment variances, have been observed in the presence of significant G × E interaction (Padi, 2008; Crossa, 2012; Malosetti et al., 2013). The significant G × E interaction in this study can be largely attributed to the low correlation between and among environments for all the tested traits except shoot δ13C (Supplementary Figure 3). Such low correlations do not permit the selection of genotypes for much wider adaptation as the environments are not only unrelated but also independent of each other (Gauch and Zobel, 1997). Creating relatively homogenous environments (mega-environments) within the region allows the identification of genotypes for adaptation to specific environments for higher superior performance (Gauch and Zobel, 1997; Gauch et al., 2008). In this study, two mega-environments were identified for pod yield and amount of N-fixed, with each year at Nyankpala separating out as a mega-environment and Damongo plus Yendi grouping together as one mega-environment for the two traits.
In this study, the stability of the 21 groundnut genotypes was assessed using the Finlay–Wilkinson regression slope (bi) and cultivar superiority estimates (Pi). The Piestimates ranked genotypes 17, 3, 2, 20, and 10 as the most superior and stable cultivars for shoot biomass, pod yield, and amount of N-fixed. Genotype mean rankings and Pirankings of genotypes displayed a strong correlation between the two parameters. The high correlation when combined with the high heritability of Pi estimates further confirmed that these genotypes were really superior for those traits (Lin and Binns, 1988; Lin and Binns, 1991) and are likely to be the most suited for environments with improved crop management and favorable climatic conditions (Makinde et al., 2013).
From the which-won-where biplots (Supplementary Figures 2A–D) genotype 3 seemed more adapted to Damongo, while genotype 20 was more adapted to Nyankpala and Yendi. Interestingly, genotype 1, which is the most widely cultivated groundnut variety in the Guinea savanna of Ghana ranked 14th for mean pod yield, but this was compensated for by its relatively good stability. In this study, genotypes 16, 5, and 2 showed low stability but exhibited much higher shoot δ13C values, a clear indication of their greater water-use efficiency and relative drought tolerance. However, genotype 16 seemed more adapted to Damongo and Yendi, while genotype 5 was more adapted to Nyankpala. The fact that some genotypes were stable for one trait but unstable for another suggested that the genetic factors involved in the G × E interaction differed between traits (Stagnari et al., 2013).
Taken together, the findings of this study seemed to suggest that different groundnut genotypes should be recommended for each study site. This argument is consistent with the recommendations of previous studies on groundnut bred for the Guinea savanna of Ghana. Furthermore, the AEC–GGE biplots showed that future selections for superior groundnut genotypes can be effectively done at Nyankpala and Damongo. A plot of the raw means across the environments against their variances (Supplementary Figure 4) showed that the GGE model used in the study was adequate. Genotype 16, which recorded greater shoot δ13C and hence higher water-use efficiency, would be the ideal candidate for use in future hybridization programs to improve the water-use efficiency and drought tolerance of groundnut in Ghana’s Guinea savanna. Furthermore, genotypes 17, 3, 10, and 4, which ranked highest for overall pod yield, shoot biomass production, and amount of N-fixed, could be recommended for further studies aimed at developing new varieties for the Guinea savanna of Ghana. Given the moderate to high heritability estimates of the traits assessed in this study, high genetic gains should be expected in a future hybridization program.
Author Contributions
FD conceptualized the study and edited the manuscript. RO-F carried out the experiment and wrote the draft paper. FD supervised the doctoral study of RO-F, which was included in this work. All authors read and contributed to finalize the manuscript.
Funding
This study was supported with funds from the Bill and Melinda Gates Foundation (BMGF) under the auspices of the BMGF-Project on Capacity Building in Africa (awarded to Tshwane University of Technology, Pretoria). RO-F is grateful to the Foundation for a competitive doctoral fellowship awarded under the Foundation with BMGF-Project, to CSIR-Savanna Agricultural Research Institute, Ghana, for grant of a study leave, and to ICRISAT for seed material and training support. The DST/NRF South African Research Chair in Agrochemurgy and Plant Symbioses and the Tshwane University of Technology are duly acknowledged for their continued funding support of FD’s research.
Conflict of Interest Statement
The authors declare that this study was conducted in the absence of any commercial or financial relationships that could be construed as a potential conflict of interest.
Supplementary Material
The Supplementary Material for this article can be found online at: https://www.frontiersin.org/articles/10.3389/fpls.2019.01070/full#supplementary-material
References
Adugna, W., Labuschagne, M. T. (2002). Genotype-environment interactions and phenotypic stability analyses of linseed in Ethiopia. Plant Breed. 71, 66–71. doi: 10.1046/j.1439-0523.2002.00670.x
Anniccchiarico, P., Bellah, F., Chiari, T. (2005). Defining subregions and estimating benefits for a specific-adaptation strategy by breeding programs. Crop Sci. 45, 1741–1749. doi: 10.2135/cropsci2004.0524
Anyia, A. O., Herzog, H. (2004). Water-use efficiency, leaf area and leaf gas exchange of cowpeas under mid-season drought. Eur. J. Agron. 20, 327–339. doi: 10.1016/S1161-0301(03)00038-8
Araus, J. L., Li, J., Parry, M. A. J., Wang, J. (2014). Phenotyping and other breeding approaches for a new green revolution. J. Integr. Plant Biol. 56, 422–424. doi: 10.1111/jipb.12202
Arunyanark, A., Jogloy, S., Akkasaeng, C., Vorasoot, N., Kesmala, T., Nageswara Rao, R. C., et al. (2008). Chlorophyll stability is an indicator of drought tolerance in peanut. J. Agron. Crop Sci. 1, 113–125. doi: 10.1111/j.1439-037X.2008.00299.x
Becker, H. C., Leon, J. (1988). Stability analysis in plant breeding. Plant Breed. 101, 1–23. doi: 10.1111/j.1439-0523.1988.tb00261.x
Bhadoria, P. B. S., Singh, S., Claassen, N. (2002). “Phosphorus efficiency of wheat, maize and groundnut grown in low phosphorus-supplying soil,” in Plant Nutrition Developments in plant and soil sciences. Eds. Horst, W. J., Schenk, M. K., Bürkert, A., Claassen, N. Flessa, H., Frommer, W. B. (Dordrecht: Springer Netherlands), 530–531. doi: 10.1007/0-306-47624-X_256
Blümmel, M., Ratnakumar, P., Vadez, V. (2012). Opportunities for exploiting variations in haulm fodder traits of intermittent drought tolerant lines in a reference collection of groundnut (Arachis hypogaea L.). F. Crop. Res. 126, 200–206. doi: 10.1016/j.fcr.2011.10.004
Chenu, K. (2014). “Charaterizing the crop improvement—nature, significance and aplications,” in Crop physiology: applications for genetic improvement and agronomy, 2nd Edn. Eds. Sadras, V. O., Calderini, D. F. (Cambridge: Academic Press), 321–348. doi: 10.1016/B978-0-12-417104-6.00013-3
Condon, A. G., Richards, R. A., Rebetzke, G. J., Farquhar, G. D. (2002). Improving intrinsic water-use efficiency and crop yield. Crop Sci. 42, 122–131. doi: 10.2135/cropsci2002.1220
Condon, A. G., Richards, R. A., Rebetzke, G. J., Farquhar, G. D. (2004). Breeding for high water-use efficiency. J. Exp. Bot. 55, 2447–2460. doi: 10.1093/jxb/erh277
Craufurd, P. Q., Wheeler, T. R., Ellis, R. H., Summerfield, R. J., Williams, J. H. (1999). Effect of temperature and water deficit on water-use efficiency, carbon isotope discrimination, and specific leaf area in peanut. Crop Sci. 39, 136–142. doi: 10.2135/cropsci1999.0011183X003900010022x
Crossa, J. (2012). From genotype × environment interaction to gene × environment interaction. Curr. Genomics 13, 225–244. doi: 10.2174/138920212800543066
Dakora, F. D., Aboyinga, R. A., Mahama, Y., Apaseku, J. (1987). Assessment of N2 fixation in groundnut (Arachis hypogaea L.) and cowpea (Vigna unguiculata L. Walp) and their relative N contribution to a succeeding maize crop in Northern Ghana. Mircen J. Appl. Microbiol. Biotechnol. 3, 389–399. doi: 10.1007/BF00935697
Eberhart, S. A., Russell, W. A. (1966). Stability parameters for comparing varieties. Crop Sci. 6, 36–40. doi: 10.2135/cropsci1966.0011183X000600010011x
FAO. (2014). FAOSTAT. Available at: http://faostat.fao.org/site/339/default.aspx (Accessed February 18, 2014).
Farquhar, G. D., Richards, R. A. (1984). Isotopic composition of plant carbon correlates with water-use efficiency of wheat genotypes. Aust. J. Plant Physiol. 11, 539. doi: 10.1071/PP9840539
Farquhar, G. D., Ehleringer, J. R., Hubick, K. T. (1989). Carbon isotope discrimination and photosynthesis. Annu. Rev. Plant Physiol. Plant Mol. Biol. 40, 503–537. doi: 10.1146/annurev.pp.40.060189.002443
Finlay, K. W., Wilkinson, G. N. (1963). The analysis of adaptation in a plant-breeding programme. Aust. J. Agric. Res. 14, 742. doi: 10.1071/AR9630742
Fox, P. N., Crossa, J., Romagosa, I. (1997). “Multi-environment testing and genotype × environment interaction,” in Statistical methods for plant variety evaluation, Plant Breeding Series 3. Eds. Kempton, R. A., Fox, P. N., Cerezo, M. (Dordrecht: Springer Netherlands), 117–138. doi: 10.1007/978-94-009-1503-9_8
Francis, T. R., Kannenberg, L. W. (1978). Yield stability studies in short-season maize. I. A descriptive method for grouping genotypes. Can. J. Plant Sci. 58, 1029–1034. doi: 10.4141/cjps78-157
Gauch, H. G., Zobel, R. W. (1996). “AMMI Analysis of Yield Trials,” in Genotype by environment interaction. Eds. Kang, M. S., Gauch, H. G. (Boca Raton, FL: CRC Press), 85–122. doi: 10.1201/9781420049374.ch4
Gauch, H. G., Zobel, R. W. (1997). Identifying mega-environments and targeting genotypes. Crop Sci. 37, 311–326. doi: 10.2135/cropsci1997.0011183X003700020002x
Gauch, H. G., Piepho, H.-P., Anniccchiarico, P. (2008). Statistical analysis of yield trials by AMMI and GGE: further considerations. Crop Sci. 48, 866–889. doi: 10.2135/cropsci2007.09.0513
Guled, P. M., Shekh, A. M., Patel, H. R., Pandey, V. (2013). Water requirement satisfaction index of rainfed sown groundnut cultivars (Arachis hypogaea L.) during two individual precipitation years in middle Gujarat agroclimatic zone. Asian J. Environ. Sci. 8, 106–110.
Hamidou, F., Ratnakumar, P., Halilou, O., Mponda, O., Kapewa, T., Monyo, E., et al. (2012). Selection of intermittent drought tolerant lines across years and locations in the reference collection of groundnut (Arachis hypogaea L.). F. Crop. Res. 126, 189–199. doi: 10.1016/j.fcr.2011.10.009
Jat, R. S., Meena, H. N. (2014). Pod yield and phosphorus-use efficiency in groundnut (Arachis hypogaea) as influenced by citric acid and its delivery methods under a semi-arid agro-ecosystem. Indian J. Agron. 59, 106–111.
Kumar, U., Singh, P., Boote, K. J. (2012). Effect of climate change factors on processes of crop growth and development and yield of groundnut (Arachis hypogaea L.). Adv. Agron. 116, 41–69. doi: 10.1016/B978-0-12-394277-7.00002-6
Lin, C. S., Binns, M. R. (1988). A superiority measure of cultivar performance for cultivar X location data. Can. J. Plant Sci. 68, 193–198. doi: 10.4141/cjps88-018
Lin, C. S., Binns, M. R. (1991). Genetic properties of four types of stability parameter. Theor. Appl. Genet. 82, 505–509. doi: 10.1007/BF00588606
Lin, C. S., Binns, M. R., Lefkovitch, L. P. (1986). Stability analysis: where do we stand? Crop Sci. 26, 894–900. doi: 10.2135/cropsci1986.0011183X002600050012x
Makinde, S. C. O., Ariyo, O. J., Akinbowale, R. I. (2013). Assessment of groundnut performance in different environments using additive main effect and multiplicative interaction (AMMI) model. Can. J. Plant Breed. 1, 60–66.
Makoi, J. H. J. R., Chimphango, S. B. M., Dakora, F. D. (2010). Photosynthesis, water-use efficiency and δ13C of five cowpea genotypes grown in mixed culture and at different densities with sorghum. Photosynthetica 48, 143–155. doi: 10.1007/s11099-010-0019-2
Malosetti, M., Ribaut, J.-M., van Eeuwijk, F. A. (2013). The statistical analysis of multi-environment data: modeling genotype-by-environment interaction and its genetic basis. Front. Physiol. 4, 44. doi: 10.3389/fphys.2013.00044
Marfo, K. O., Padi, F. K. (1999). Yield stability of some groundnut accessions in northern Ghana. Ghana J. Agric. Sci. 32, 137–144. doi: 10.4314/gjas.v32i2.1894
Martey, E., Wiredu, A. N., Oteng-Frimpong, R. (2015). Baseline study of groundnut in Northern Ghana. Riga: LAP Lambert academic publishing.
Maskey, S. L., Bhattarai, S., Peoples, M. B., Herridge, D. F. (2001). On-farm measurements of nitrogen fixation by winter and summer legumes in the Hill and Terai regions of Nepal. F. Crop. Res. 70, 209–221. doi: 10.1016/S0378-4290(01)00140-X
MoFA-SRID (2014). Agriculture in Ghana: facts and figures. 23rd ed. Accra: Ministry of Food and Agriculture, Statistics Research and Information Directorate.
Mohale, K. C., Belane, A. K., Dakora, F. D. (2014). Symbiotic N nutrition, C assimilation, and plant water use efficiency in Bambara groundnut (Vigna subterranea L. Verdc) grown in farmers’ fields in South Africa, measured using 15N and 13C natural abundance. Biol. Fertil. Soils 50, 307–319. doi: 10.1007/s00374-013-0841-3
Mohamed, S. S., Abdalla, A. S. (2013). Growth and yield response of groundnut (Arachis hypogaea L.) to microbial and phosphorus fertilizers. J. Agri-Food Appl. Sci. 1, 78–85.
Mokgehle, S. N., Dakora, F. D., Mathews, C. (2014). Variation in N2 fixation and N contribution by 25 groundnut (Arachis hypogaea L.) varieties grown in different agro-ecologies, measured using 15N natural abundance. Agric. Ecosyst. Environ. 195, 161–172. doi: 10.1016/j.agee.2014.05.014
Naab, J. B., Seini, S. S., Gyasi, K. O., Mahama, G. Y., Prasad, P. V. V., Boote, K. J., et al. (2009). Groundnut yield response and economic benefits of fungicide and phosphorus application in farmer-managed trials in northern Ghana. Exp. Agric. 45, 385–399. doi: 10.1017/S0014479709990081
Nageswara Rao, R. C., Talwar, H. S., Wright, G. C. (2001). Rapid assessment of specific leaf area and leaf nitrogen in peanut (Arachis hypogaea L.) using a chlorophyll meter. J. Agron. 182, 175–182. doi: 10.1046/j.1439-037X.2001.00472.x
Nageswara Rao, R. C., Udaykumar, M., Farquhar, G. D., Talwar, H. S., Prasad, T. G. (1995). Variation in carbon isotope discrimination and its relationship to specific leaf area and ribulose-1, 5-bisphosphate carboxylase content in groundnut genotypes. Aust. J. Plant Physiol. 22, 545–551. doi: 10.1071/PP9950545
Nageswara Rao, R. C., Wright, G. C. (1994). Stability of the relationship between specific leaf area and carbon isotope discrimination across environments in peanut. Crop Sci. 34, 98–103. doi: 10.2135/cropsci1994.0011183X003400010017x
Ntawuruhunga, P., Dixon, A. G. O. (2010). Quantitative variation and interrelationship between factors influencing cassava yield. J. Appl. Biosci. 26, 1594–1602.
Nutsugah, S. K., Abudulai, M. S., Oti-Boateng, C., Brandenburg, R. L., Jordan, D. L. (2007). Management of leaf spot diseases of peanut with fungicides and local detergents in Ghana. Plant Pathol. J. 6, 248–253. doi: 10.3923/ppj.2007.248.253
O’Leary, M. H. (1988). Carbon isotopes in photosynthesis. Bioscience 38, 328–336. doi: 10.2307/1310735
Ohyama, T., Fujikake, H., Yashima, H., Tanabata, S., Ishikawa, S., Sato, T., et al. (2011). “Effect of nitrate on nodulation and nitrogen fixation of soybean,” in Soybean physiology and biochemistry. Ed. El-shemy, H. (London: InTech), 333–364. doi: 10.5772/17992
Oteng-Frimpong, R., Kassim, Y. B., Danful, R., Akromah, R., Wireko-Kena, A., Forson, S. (2019). Modeling groundnut (Arachis hypogaea L.) performance under drought conditions. J. Crop Improv. 33, 125–144. doi: 10.1080/15427528.2018.1542363
Padi, F. K. (2004). Relationship between stress tolerance and grain yield stability in cowpea. J. Agric. Sci. 142, 431–443. doi: 10.1017/S0021859604004447
Padi, F. K. (2007). Genotype × environment interaction and yield stability in a cowpea-based cropping system. Euphytica 158, 11–25. doi: 10.1007/s10681-007-9420-8
Padi, F. K. (2008). Genotype × environment interaction for yield and reaction to leaf spot infections in groundnut in semiarid West Africa. Euphytica 164, 143–161. doi: 10.1007/s10681-008-9677-6
Payne, R. W., Murray, D. A., Harding, S. A., Baird, D. B., Soutar, D. M. (2009). Genstat for Windows, 12th Edition Introduction. 12th edn. Hemel Hempstead: VSN International.
Prasad, P. V. V., Craufurd, P. Q., Summerfield, R. J. (2000). Effect of high air and soil temperature on dry matter production, pod yield and yield components of groundnut. Plant Soil 222, 231–239. doi: 10.1023/A:1004793220787
Pule-Meulenberg, F., Belane, A. K., Krasova-Wade, T., Dakora, F. D. (2010). Symbiotic functioning and bradyrhizobial biodiversity of cowpea (Vigna unguiculata L. Walp.) in Africa. BMC Microbiol. 10, 1–12. doi: 10.1186/1471-2180-10-89
Rademacher-Schulz, C., Schraven, B., Mahama, E. S. (2014). Time matters: shifting seasonal migration in Northern Ghana in response to rainfall variability and food insecurity. Clim. Dev. 6, 46–52. doi: 10.1080/17565529.2013.830955
Romagosa, I., van Eeuwijk, F. A., Thomas, W. T. B. (2009). “Statistical analyses of genotype by environment data,” in Cereals. Ed. Carena, M. J. (New York, NY: Springer US), 291–331. doi: 10.1007/978-0-387-72297-9_10
Rowland, D. L., Puppala, N., Beasley, J., Burow, M. J., Gorbet, D., Jordan, D., et al. (2012). Variation in carbon isotope ratio and its relation to other traits in peanut breeding lines and cultivars from US trials. J. Plant Breed. Crop Sci. 4, 144–155. doi: 10.5897/JPBCS12.031
Shearer, G., Kohl, D. H. (1986). N2-fixation in field settings: estimations based on natural 15N abundance. Aust. J. Plant Physiol. 13, 699–756. doi: 10.1071/PP9860699
Sheshshayee, M. S., Bindumadhava, H., Rachaputi, N. R., Prasad, T. G., Udayakumar, M., Wright, G. C., et al. (2006). Leaf chlorophyll concentration relates to transpiration efficiency in peanut. Ann. Appl. Biol. 148, 7–15. doi: 10.1111/j.1744-7348.2005.00033.x
Shukla, G. K. (1972). Some statistical aspects of partitioning genotype-environmental components of variability. Heredity (Edinb.) 29, 237–245. doi: 10.1038/hdy.1972.87
Singh, R. K., Chaudhary, B. D. (1979). Biometrical methods in quantitative genetic analysis. Ludhiani: Kalyani publishers/Lyall Bk Depot.
Songsri, P., Jogloy, S., Junjittakarn, J., Kesmala, T., Vorasoot, N., Holbrook, C. C., et al. (2013). Association of stomatal conductance and root distribution with water use efficiency of peanut under different soil water regimes. Aust. J. Crop Sci. 7, 948–955.
Stagnari, F., Onofri, A., Codianni, P., Pisante, M. (2013). Durum wheat varieties in N-deficient environments and organic farming: a comparison of yield, quality and stability performances. Plant Breed. 132, 266–275. doi: 10.1111/pbr.12044
Sudaric, A., Simic, D., Vrataric, M. (2006). Characterization of genotype by environment interactions in soybean breeding programmes of southeast Europe. Plant Breed. 125, 191–194. doi: 10.1111/j.1439-0523.2006.01185.x
Tanabata, S., Ohyama, T. (2014). “Autoregulation of nodulation in soybean plants,” in Advances in biology and ecology of nitrogen fixation. Ed. Ohyama, T. (London: InTech), 73–88. doi: 10.5772/56996
Tsigbey, F. K., Brandenburg, R. L., Clottey, V. A. (2003). Peanut production methods in northern Ghana and some disease perspectives. Online J. Agron. 34, 36–47.
Unkovich, M. J., Herridge, D., Peoples, M., Cadisch, G., Boddey, R., Giller, K. E., et al. (2008). Measuring plant-associated nitrogen fixation in agricultural systems. ACIAR Monograph No. 136.
Upadhyaya, H. D., Swamy, B. P. M., Goudar, P. V. K., Kullaiswamy, B. Y., Singh, S. (2005). Identification of diverse groundnut germplasm through multienvironment evaluation of a core collection for Asia. F. Crop. Res. 93, 293–299. doi: 10.1016/j.fcr.2004.10.007
Vadez, V., Berger, J. D., Warkentin, T., Asseng, S., Ratnakumar, P., Chandra Rao, K. P., et al. (2012). Adaptation of grain legumes to climate change: a review. Agron. Sustain. Dev. 32, 31–44. doi: 10.1007/s13593-011-0020-6
Witt, C., Pasuquin, J. M. C. A., Mutters, R., Buresh, R. J. (2005). New leaf color chart for effective nitrogen management in rice. Better Crops 89, 36–39.
Wright, G. C., Hubick, K. T., Farquhar, G. D. (1988). Discrimination in carbon isotopes of leaves correlates with water-use efficiency of field-grown peanut cultivars. Aust. J. Plant Physiol. 15, 815. doi: 10.1071/PP9880815
Wright, G. C., Nageswara Rao, R. C. (1993). “Carbon isotope discrimination, water-use efficiency, specific leaf area relationships in groundnut,” in Selection for water-use efficiency in grain legumes - report of a workshop. (Patencheru: ICRISAT), 52–58.
Wright, G. C., Nageswara Rao, R. C., Farquhar, G. D. (1994). Water-use efficiency and carbon isotope discrimination in peanut under water deficit conditions. Crop Sci. 34, 92–97. doi: 10.2135/cropsci1994.0011183X003400010016x
Yan, W. (2001). GGEbiplot—a windows application for graphical analysis of multienvironment trial data and other types of two-way data. Agron. J. 93, 1111–1118. doi: 10.2134/agronj2001.9351111x
Yan, W., Tinker, N. A. (2006). Biplot analysis of multi-environment trial data: principles and applications. Can. J. Plant Sci. 6, 623–645. doi: 10.4141/P05-169
Keywords: groundnut, stability, N2 fixation, mega-environment, additive main effects and multiplicative interaction, multienvironment trials, water-use efficiency
Citation: Oteng-Frimpong R and Dakora FD (2019) Multienvironment Testing for Trait Stability and G × E Interaction on N2 Fixation, Plant Development, and Water-Use Efficiency of 21 Elite Groundnut (Arachis hypogaea L.) Genotypes in the Guinea Savanna. Front. Plant Sci. 10:1070. doi: 10.3389/fpls.2019.01070
Received: 05 January 2019; Accepted: 07 August 2019;
Published: 12 September 2019.
Edited by:
Nicolas Rispail, Spanish National Research Council (CSIC), SpainReviewed by:
Baffour Badu-Apraku, International Institute of Tropical Agriculture (Nigeria), NigeriaKenneth Jay Boote, University of Florida, United States
Copyright © 2019 Oteng-Frimpong and Dakora. This is an open-access article distributed under the terms of the Creative Commons Attribution License (CC BY). The use, distribution or reproduction in other forums is permitted, provided the original author(s) and the copyright owner(s) are credited and that the original publication in this journal is cited, in accordance with accepted academic practice. No use, distribution or reproduction is permitted which does not comply with these terms.
*Correspondence: Felix D. Dakora, RGFrb3JhRkRAdHV0LmFjLnph