 Zachary Stansell
 Mark Farnham3
 Thomas Björkman
- 1School of Integrative Plant Science, Cornell University, Ithaca, NY, United States
- 2Cornell Agritech, Cornell University, Geneva, NY, United States
- 3USDA-ARS Vegetable Laboratory, Department of Horticulture, Charleston, SC, United States
Improving horticultural quality in regionally adapted broccoli (Brassica oleracea var. italica) and other B. oleracea crops is challenging due to complex genetic control of traits affecting morphology, development, and yield. Mapping horticultural quality traits to genomic loci is an essential step in these improvement efforts. Understanding the mechanisms underlying horticultural quality enables multi-trait marker-assisted selection for improved, resilient, and regionally adapted B. oleracea germplasm. The publicly-available biparental double-haploid BolTBDH mapping population (Chinese kale × broccoli; N = 175) was evaluated for 25 horticultural traits in six trait classes (architecture, biomass, phenology, leaf morphology, floral morphology, and head quality) by multiple quantitative trait loci mapping using 1,881 genotype-by-sequencing derived single nucleotide polymorphisms. The physical locations of 56 single and 41 epistatic quantitative trait locus (QTL) were identified. Four head quality QTL (OQ_C03@57.0, OQ_C04@33.3, OQ_CC08@25.5, and OQ_C09@49.7) explain a cumulative 81.9% of phenotypic variance in the broccoli heading phenotype, contain the FLOWERING LOCUS C (FLC) homologs Bo9g173400 and Bo9g173370, and exhibit epistatic effects. Three key genomic hotspots associated with pleiotropic control of the broccoli heading phenotype were identified. One phenology hotspot reduces days to flowering by 7.0 days and includes an additional FLC homolog Bo3g024250 that does not exhibit epistatic effects with the three horticultural quality hotspots. Strong candidates for other horticultural traits were identified: BoLMI1 (Bo3g002560) associated with serrated leaf margins and leaf apex shape, BoCCD4 (Bo3g158650) implicated in flower color, and BoAP2 (Bo1g004960) implicated in the hooked sepal horticultural trait. The BolTBDH population provides a framework for B. oleracea improvement by targeting key genomic loci contributing to high horticultural quality broccoli and enabling de novo mapping of currently unexplored traits.
Introduction
Improvement of broccoli and other Brassica oleracea vegetables (cauliflower, cabbage, kale, Gai lan, Brussels sprouts, kohlrabi, and collard) is constrained by complex interactions of many genes affecting plant architecture, developmental processes, and yield. B. oleracea vegetable crop groups have benefited from a number of advances in plant biotechnology, gradually increasing the overall understanding of these quality-based traits. Specifically, diversity and domestication processes (Cheng et al., 2016; Stansell et al., 2018; Yousef et al., 2018; Li et al., 2019) have been clarified, next-generation sequencing and high-quality reference genomes (Liu et al., 2014; Parkin et al., 2014; Golicz et al., 2016) have expedited discovery of molecular markers associated with key traits, and diverse mapping populations segregating for these traits have been characterized (Kianian and Quiros, 1992; Landry et al., 1992; Camargo and Osborn, 1996; Ramsay et al., 1996; Bohuon et al., 1998; Hu et al., 1998; Lan and Paterson, 2000; Sebastian et al., 2000; Lan and Paterson, 2001; Axelsson et al., 2001; Li et al., 2003; Gao et al., 2007; Brown et al., 2014; Lee et al., 2015a; Li et al., 2015). For example, projects integrating these tools such as the Eastern Broccoli Project (SCRI No. 2010-51181-21062) and the USDA Vegetable Brassica Research Project (CRIS No. 6080-21000-019-00D) have developed heat-tolerant broccoli germplasm adapted to novel environments, reducing costs and enabling more sustainable production models (Atallah et al., 2014; Farnham and Björkman, 2011).
A current limitation in B. oleracea vegetable crop improvement is a lack of publicly available mapping populations, constraining information integration across research programs. Attempts to unify existing maps have been limited due to variable germplasm, different marker types, and linkage group nomenclature (Hu et al., 1998). Furthermore, these populations are often difficult to maintain due to self-incompatibility (Farnham, 1998; Bohuon et al., 1998; Sebastian et al., 2000; Pink et al., 2008; Walley et al., 2012).
To address these issues, the double-haploid (DH) BolTBDH population was developed from a cross between morphologically distinct parents (B. oleracea var. alboglabra × B. oleracea var. italica) that segregates for horticultural quality traits specific to broccoli (Iniguez-Luy et al., 2009). BolTBDH offers several distinct advantages over other mapping populations: a large sample size (N∼175), a high degree of self-compatibility, and a short generation time. The rapid-cycling parental taxa ‘TO1000DH3’ (P1; var. alboglabra) is the reference organism for the B. oleracea v.2 genome (Parkin et al., 2014). ‘Early Big’ (P2; var. italica) has been evaluated in previous studies (Li et al., 2003; Gao et al., 2005; Tortosa et al., 2018). Moreover, both P1 and P2 and included in the B. oleracea pangenome (Golicz et al., 2016). Furthermore, this population has already been used to investigate the genetic control of important traits: glucosinolate content (Sotelo et al., 2014), organ-specific phenylpropanoid metabolism (Francisco et al., 2016), antioxidant content (Sotelo Pérez et al., 2014), and black rot (Xanthomonas campestris pv. campestris) resistance (Iglesias-Bernabé et al., 2019). Under standard greenhouse conditions, BolTBDH lines will typically produce self-seed without the need for hand pollinations. The work presented here increases the value of this population by generating many high-quality genome-wide SNP markers and generating robust phenotypes for 25 horticultural quality traits.
The BolTBDH population provides an unique opportunity to evaluate the genetic basis of the heading broccoli phenotype due to the marked dissimilarity between the parental lines: P1 is rapid-flowering (∼ 65 days to flowering) and exhibits a leafy, non-head-forming inflorescence, whereas P2 is relatively late-flowering (∼ 85 days to flowering) and exhibits a heading broccoli phenotype characterized by extensive meristem proliferation during floral bud development and internode elongation (Björkman and Pearson, 1998). While considerable work has investigated head formation under optimal and heat-stressed conditions (Duclos and Björkman, 2008; Farnham and Björkman, 2011; Hasan et al., 2016; Lin et al., 2019), the exact genetic basis of this phenotype remains elusive (Axelsson et al., 2001; Li et al., 2003; Gao et al., 2007; Okazaki et al., 2007; Razi et al., 2008; Matschegewski et al., 2015; Irwin et al., 2016). There is a growing consensus of the central importance of the homologous flowering timing MADS-box transcription factor FLOWERING LOCUS C (BoFLC) in regulating the reproductive transition by inhibiting downstream BoSOC1 and BoFT expression; in turn, delaying a suite of floral-identity genes including BoLFY, BoAP1, and BoCAL (Lin et al., 2018). The genetic basis of the heading broccoli phenotype could be explained by a number of models: simple control by one or several genes, a constrictive-conditional model where multiple genetic factors must be present, or a pleiotropic model, where several key developmental genes would underlie the broccoli heading phenotype and be further modified by additional downstream factors. Under a simple control model, the heading broccoli phenotype would exhibit qualitative control by a limited number of QTL. Under a purely constrictive-conditional model, the broccoli heading phenotype would occur only when a minimum set of independent factors were present. Under a purely pleiotropic model, a small number of developmental loci or genes are implicated in heading quality traits with epistatic interactions with additional loci.
When breeding multiple quality traits in horticultural crops, it is often challenging to determine the degree that individual traits contribute to the overall quality of these crops when predictor traits are correlated. Relative-importance analyses (RIA) allows quantification of the proportional contribution of a predictor variable to the overall quality-model R2, considering both unique and joint contributions with other variables (Gromping, 2006) and may be used to establish breeding priorities within a horticultural context (Stansell et al., 2017). Within this study, RIA was used to evaluate the independent contribution of individual traits to overall horticultural quality.
Therefore, our main objectives were to: a) characterize the phenotypic variation of horticulturally important traits within the BolTBDH population; b) produce a reference set of robust and high-quality BolTBDH markers; c) identify optimal QTL models to best explain key horticultural quality traits important to broccoli germplasm; and d) identify which candidate B. oleracea developmental genes collocate with observed QTL.
Materials and Methods
Germplasm
The BolTBDH population was generated via anther culture from the parental lines ‘TO1000DH3’ DH (P1; B. oleracea var. alboglabra) × ‘Early Big’ DH (P1; B. oleracea var. italica) (Iniguez-Luy et al., 2009). Seed was provided by the USDA Vegetable Laboratory in Charleston, SC. All initial lines (N = 202; P1 and P1 inclusive) were increased in 2016 and closed-bud pollinations were made to verify selfing integrity. Except for P1 in Y1 due to inadequate seed quality, all lines were sown into 128 cell trays May 11 in Y1 and May 9 in Y2. Seedlings were grown in a greenhouse and transplanted into Lima silt loam fields in Geneva, NY on May 28–29 in Y1 and June 8–11 in Y2. All lines were divided into four randomized replications and transplanted onto raised beds with each plot containing 10–12 plants per genotype. Drip irrigation was applied as needed and any additional cultural practices were as previously described (Farnham and Björkman, 2011). Hourly weather data was collected locally at Cornell AgriTech (Figure S1).
Traits Investigated
Plots were evaluated daily and deemed mature when 1/3 of the plants reached a heading or heading-equivalent stage. Traits within six classes considered important to broccoli or other B. oleracea crop groups were chosen: architecture, biomass, bud morphology, leaf morphology, head quality, and phenology (Table 1; Figure 1; Stansell et al. (2017)). LT was measured as the degree of lateral shoot growth. MH was evaluated as flower bud bunching before antithesis. MS was measured as above-ground biomass of a representative central plant. VG was evaluated as overall plant vigor. Leaf color/waxiness (LC) was evaluated visually. LA and LM were evaluated as the leaf-tip angle and degree of leaf margin serration. No intermediate flower color was detected so FC was scored as a binary trait. Other bud morphology traits (SE, SS, SF, ST, and SH) were evaluated visually as unopened buds at head maturity. The traits bud size (BS), bud uniformity (BU), bracting (BR), head compactness (HC), head diameter (HD), head uniformity (HU), head extension (HE), head shape (HS), overall-heading quality, and (OQ) were evaluated following standardized protocols developed by the Eastern Broccoli Project using an ordinal scale (1 = worst; 5 = best) with slight population specific modifications (e.g.: adjusting scale centering to account for smaller DH heads) (Stansell et al., 2017). Days to maturity and flowering (DM and DF) were calculated as days from sowing to head maturity and first flowering respectively. Holding ability HA was defined as DF–DM. Correlation matrices were computed between traits as well as between trial years by invoking the Spearman method with the cor() function in R v3.6.0(R-Core-Team, 2018). RIA of overall heading quality OQ was conducted with the R package ratervar (Stansell et al., 2017) using 1,000 bootstraps under the metric “lmg” by fitting the model:
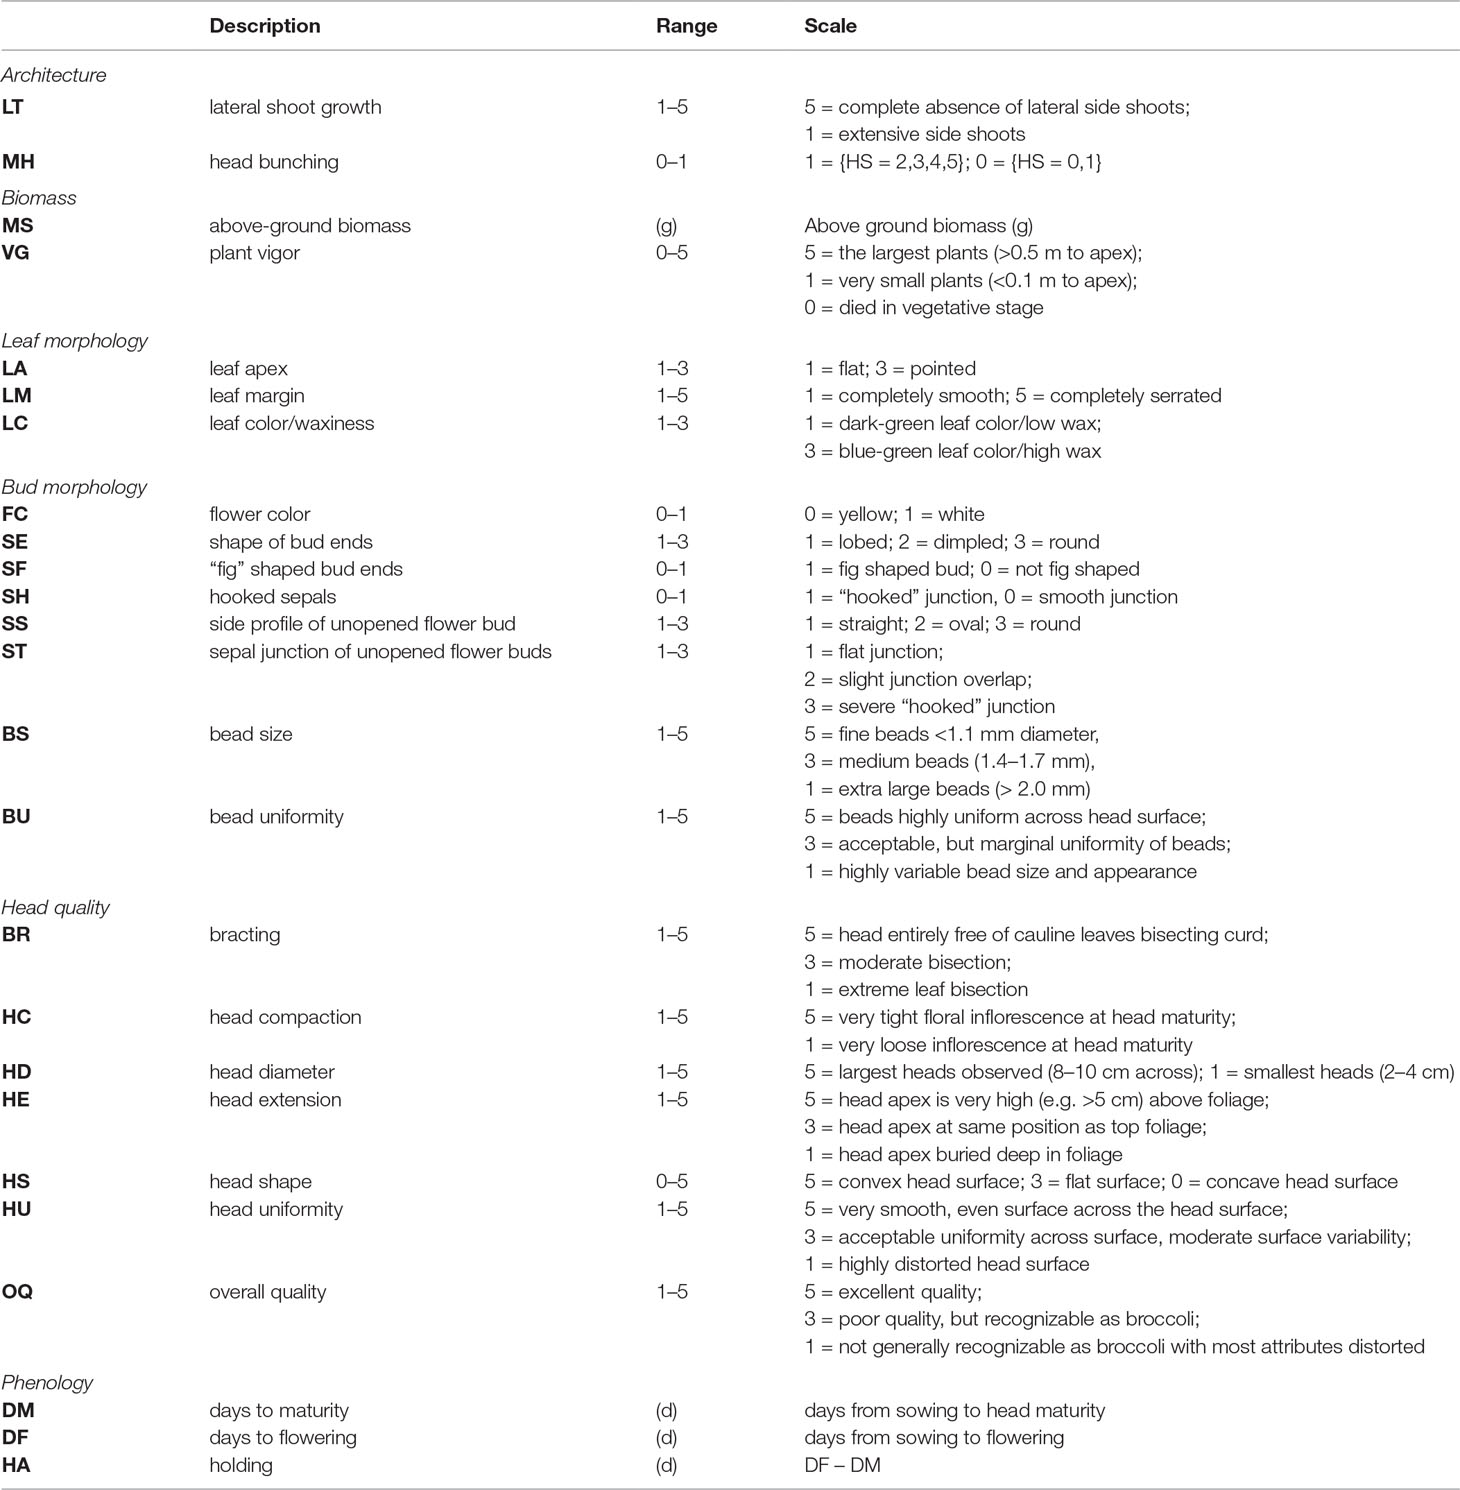
Table 1 Trait classes and traits evaluated within BolTBDH trials with descriptions and scoring scales.
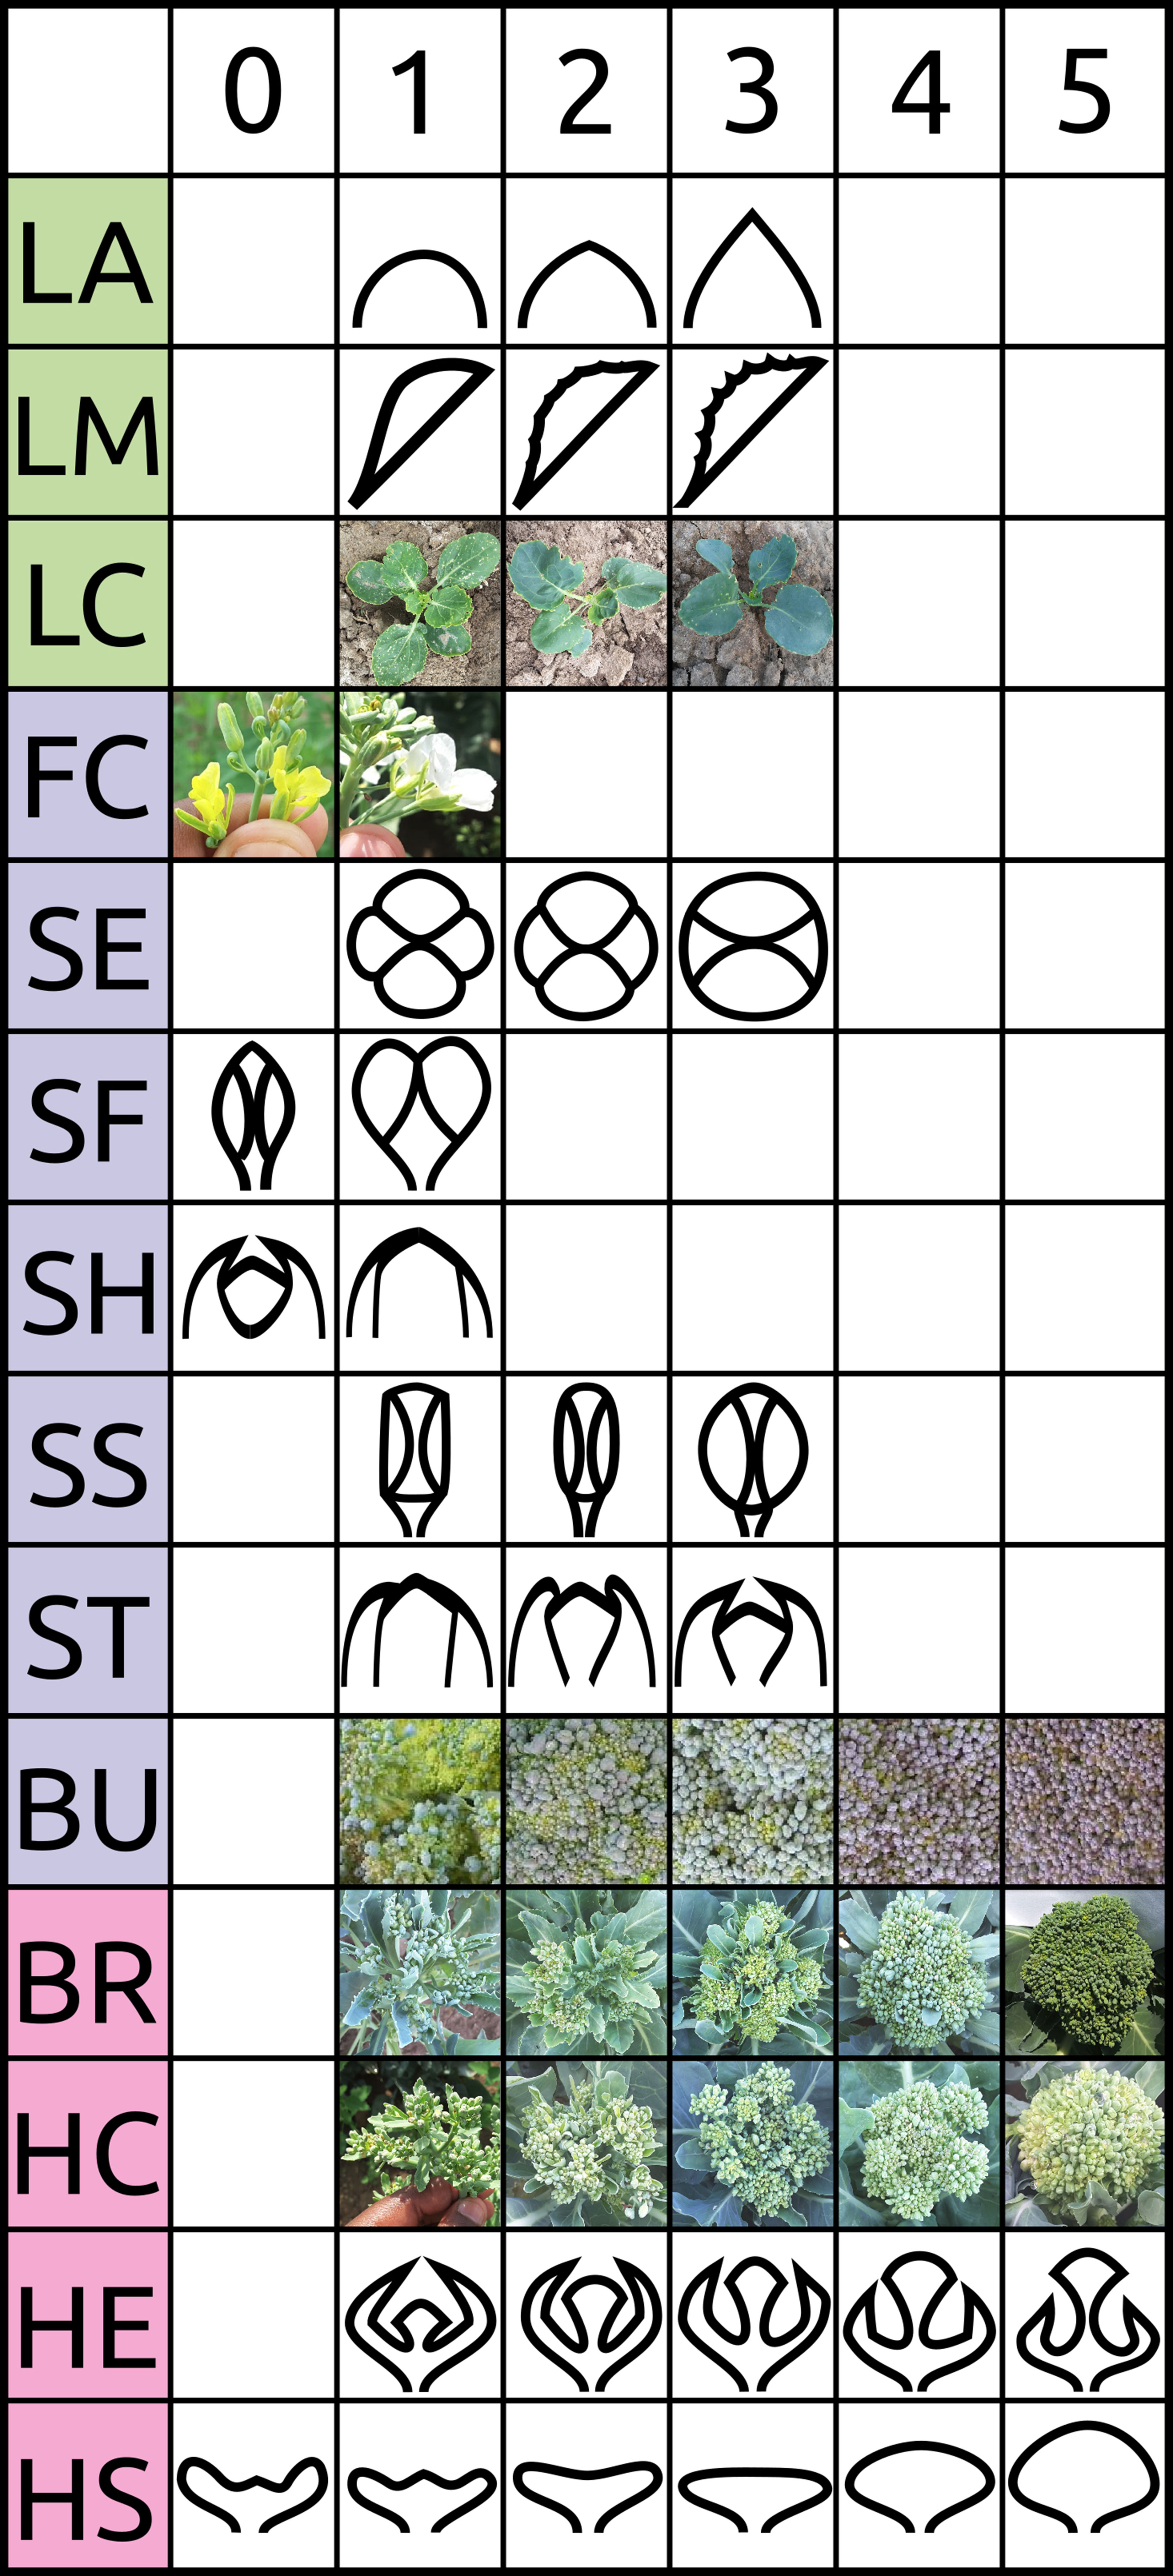
Figure 1 Visual scoring scale of selected traits evaluated in BolTBDH trials. See Table 1 and Stansell et al. (2017) for additional information.
Marker Development, Map Construction
DNA was extracted from young leaf tissue at the 2–3 true leaf stage, bulked from five plants and extracted according to standard protocols. GBS was accomplished at the University of Wisconsin Biotechnology Center DNA Sequencing Facility following methods of Elshire et al. (2011). Library construction occurred in 96-well plates with ApeKI digestion followed by sequencing on Illumina HiSeq 2500, producing 100-bp single-end reads. SNP production was accomplished using the TASSEL v5.2.35 GBS pipeline (Glaubitz et al., 2014): 214,757,912 raw sequence reads were initially generated and 168,722,056 (78.6%) were good barcoded reads (minimum quality score > 15; minimum K-mer count = 10; min K-mer length = 10) and reads were collapsed into 11,842,938 tags. Alignment of filtered tags were was accomplished with default settings with BWA v0.7.15 (Li, 2013) to the B. oleracea genome v2.1 (Parkin et al., 2014), producing 670,347 mapped tags. Initial filtering removed indels, loci with more than 10% missing data and minor SNP states. Missing data were imputed using the FSFHap plugin (Swarts et al., 2014) invoking the cluster algorithm option. Nucleotide data was recoded as ABH genotypes and heterozygous, missing, or ambiguous calls were removed. Additional quality control steps using the package rqtl (v.1.44-9; Broman et al. (2003)) were performed: taxa with > 5% missing data were removed and taxa pairs exhibiting over 95% pairwise genetic similarity were pruned. Individuals exhibiting three times more crossover events above standard deviation were removed. Ultimately, 175 DH lines were included in the final datasets. Markers exhibiting identical segregation patterns were pruned. Markers with χ2 −log[p.adj] > 40 segregation were removed as likely genotyping errors. Linkage disequilibrium analysis identified 87 markers that appeared to be assigned to the wrong linkage groups and these were removed. Markers were imputed using a Viterbi algorithm and genetic maps were constructed using the Kosambi mapping function (Supplementary Data S1–S6).
MQM Mapping
Multiple QTL mapping (MQM) was accomplished using rqtl using the forward and backward search algorithm stepwiseqtl() by searching for QTL models with the highest penalized LOD score (Broman et al., 2003; Arends et al., 2010). Genotypes were first simulated with hidden Markov modeling (N = 1,000) followed by estimation of the true underlying genotype probabilities calculated across a 1 cm fixed stepwidths. Initially, 1,000 permutations of two-dimensional scans per trait were run to establish trait-specific genome-wide significance thresholds and to calculate MQM model penalties. An initial forward scan was used to determine the maximum number of QTL per trait to include in stepwiseqtl(). The normal model was invoked for stepwiseqtl() except for the trait FC which was run under a binary model. Between model selection steps in MQM analysis, QTL positions were refined using iterative maximum likelihood scanning. Additional non-parametric scans using extension of the Kruskal-Wallis tests were run as an additional confirmation step to account for non-normal distributions. Epistatic effects were identified using two-dimensional scans with the scantwo() function and chosen according to the FV1 model: the log10 likelihood of the full QTL model on chromosomes j and k was compared against a single model QTL on j or k (pfv1 < 0.05). QTL intervals were called by applying the function find_peaks() by choosing MQM peaks surpassing the genome-wide significance threshold (α = 0.05), estimating interval start and stop locations as 95% Bayes credible intervals (BCIs), and selecting the best adjacent markers. Percent phenotypic variance explained was calculated by
Candidates were determined by subsetting the B. oleracea v2.1 genome annotation by the 95% BCI followed by further extraction of A. thaliana BLASTP hits. Additionally, a review of candidates implicated in developmental control of the horticultural traits under consideration was followed by pan-taxonomic searches using the online tools TAIR (Berardini et al., 2015) and EnsemblePlants (Ruffier et al., 2017) to determine the physical locations of 391 B. oleracea homologs (Supplementary Data S7). These candidates were then cross-referenced against the identified QTL using a custom R script that calculated the difference in physical location of a candidate and LOD peak location, retaining only candidates located within the 95% BCI or within 1 Mbp from the LOD peak.
Results
Phenotyping
For architectural traits, suppression of lateral shoot growth (LT) was considerably higher in Y1 (Y1 = 3.1, Y2 = 1.8; Figure 2A; Table 2) and was moderately correlated between years (r = +0.61; Figure 2B). Presence of floret bunching (MH) was lower in the Y2 trial (0.98 vs 0.86; r = +0.22). Average above-ground biomass (MS) was 90.5 g lower in Y2 trials, although plant vigor (VG) was consistent between years. MS and VG were positively correlated (r = +0.57). The leaf morphology traits LA and LM exhibited moderate between-trait correlation (r = +0.45). Leaf color (LC) was moderately correlated between years (r = +0.52). Except for flower color (FC; r = +1.00), other bud morphology traits exhibited low to intermediate year-to-year correlation, ranging from “bud profile:fig” (SF; r = +0.15) to flower bud size (BS; r = +0.55).
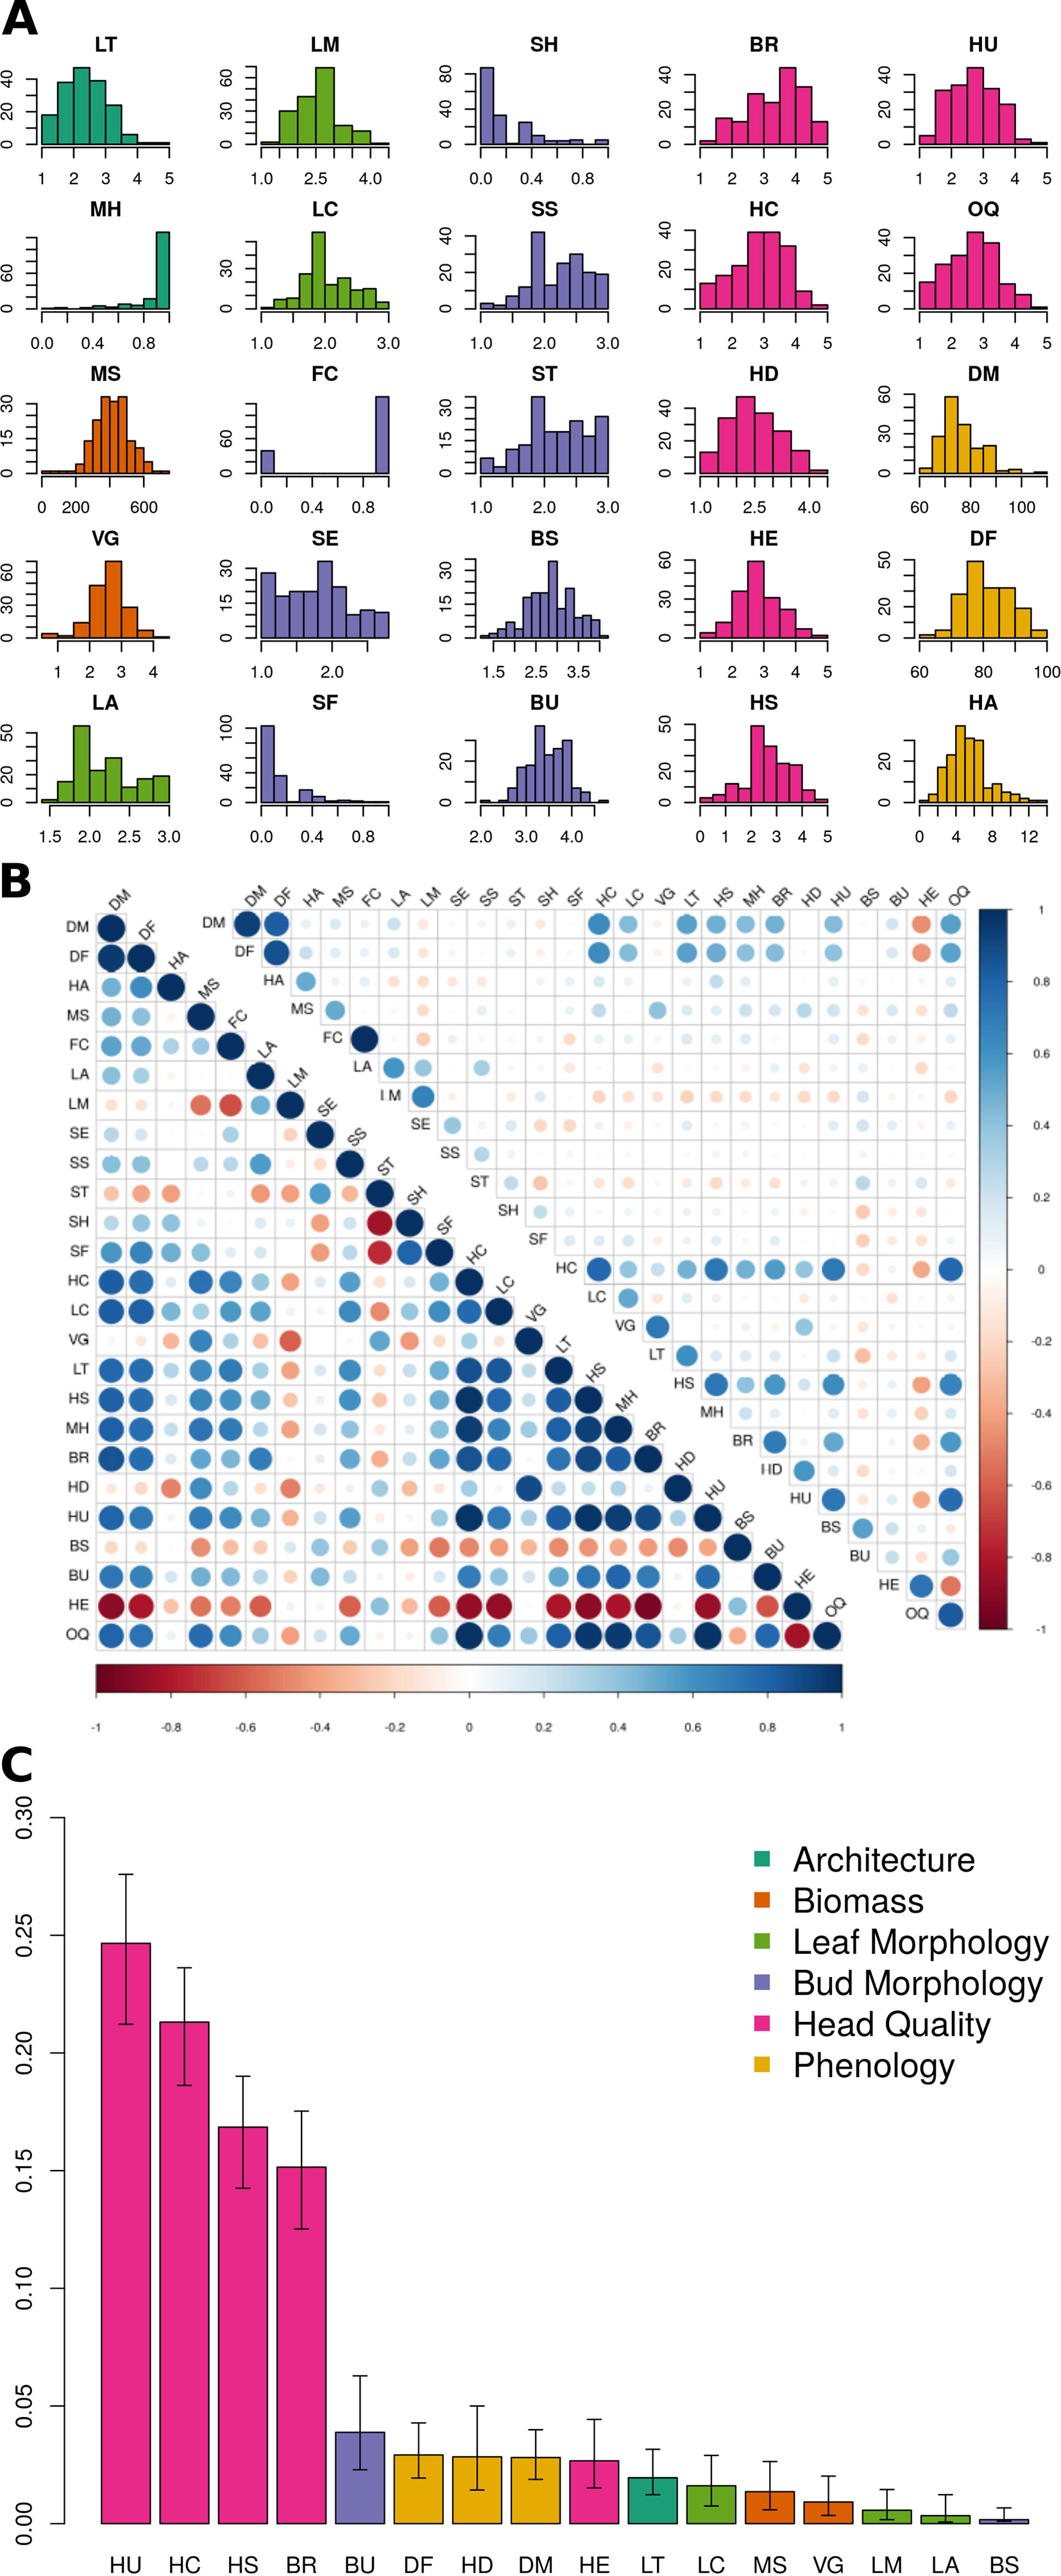
Figure 2 BolTBDH phenotypic analysis: (A) Distribution of phenotypic traits evaluated in year 1 and year 2 (Y12) trials. Trait class is indicated by color (architecture = dark green, biomass = orange, leaf morphology = light green, bud morphology = light blue, heading quality = pink, and phenology = yellow). (B) Y12 between-trait (bottom left) and between-year Y1 vs. Y2 (top right) Spearman correlation coefficients, with negative and positive correlations plotted in red and blue. (C) Percentage of Y12 overall quality model explained by relative importance predictors (RIA) by fitting the model [OQ ∼ LT + MH + MS + VG + LA + LM + LC + BS + BU + BR + HC + HD + HE + HS + HU + DF + DM] using the lmg method with the rateRvaR function raterimp() with 95% confidence intervals estimated by 1,000 permutations.
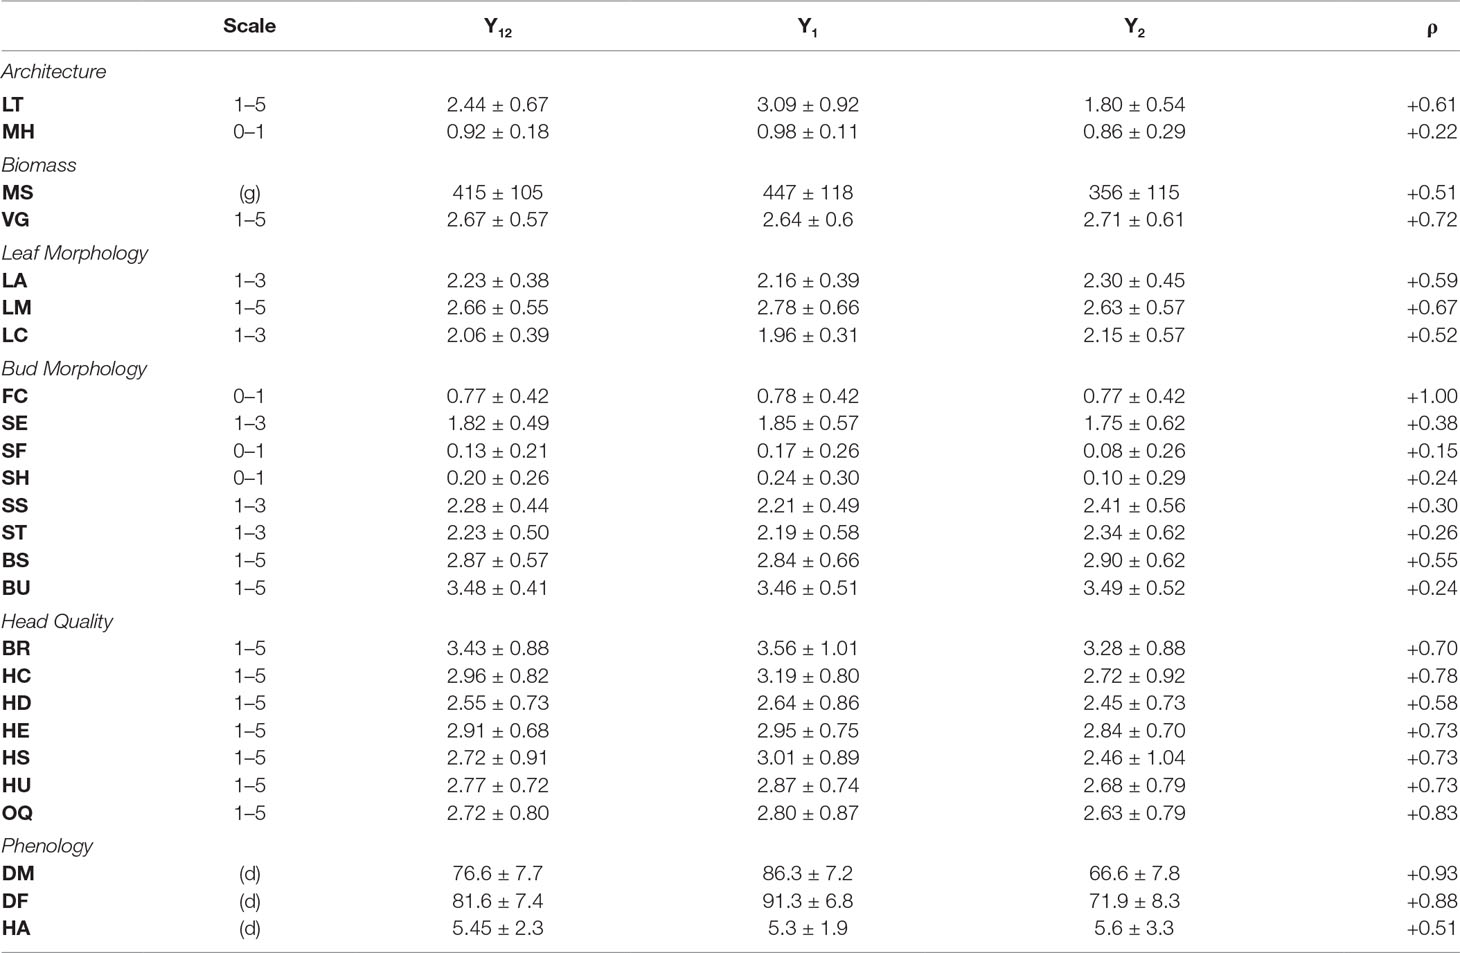
Table 2 Phenotypic evaluations pooled across year 1 (Y1) and year 2 (Y2) environments ± sd; Y1 and Y2 means ±sd; (ρ) = Spearman correlations between Y1 and Y2 evaluations.
All head quality traits were lower in Y2 when compared to Y1 except for bud uniformity (BU; −0.03) and head-quality traits were strongly correlated between years (r = +0.82). Head shape (HS; −0.55) and head compactness (HC; −0.47) exhibited the largest changes from Y1 to Y2 trials. Overall horticultural quality (OQ) was positively correlated with all other head quality traits such as head uniformity (HU; r = +0.94) and head shape (HS; r = 0.88) except for a negative correlation with head extension HE (r = −0.51). Days to head maturity DM (r = +0.93) and flowering DF (r = +0.88) were correlated between years, although lower in Y2 trials by 19.7 d and 19.4 d. DM and DF were correlated with each other (r = +0.94). Time from maturity to flowering (HA) was consistent between years (Y1 = 5.34 d and Y2 = 5.61 d) but was not strongly correlated with DM (r = +0.13) or DF (r = +0.39).
Relative importance analyses indicated that variation in the traits HU (24.7%), HC (21.3%), HS (16.4%), and BR (15.2%) explained 78.0% of the variability in overall heading quality model (Figure 2C, Table S1). Although OQ was correlated with DM (r = +0.53) and DF (r = 0.46), these traits were not strong predictors of OQ, each explaining < 3% of the variance in the RIA quality model.
Genotyping and Mapping
Genotype-by-sequencing of all initial lines (N = 202) resulted in 168,722,056 quality barcoded reads distributed across 2,529,429 unique tags of which 670,347 were mapped, producing 263,998 SNPs. FSFhap imputation and filtering for minor allele frequencies, missing data, and minor SNPs states reduced this value to 15,774; decreasing percent missing data from 21.0% to 2.7% (Figure S2). Markers assigned to the wrong linkage groups were removed (Figure 3A) and 1881 high-quality, non-duplicated markers were selected and distributed with a mean coverage of 4.25 SNPs/Mbp (Table S2).
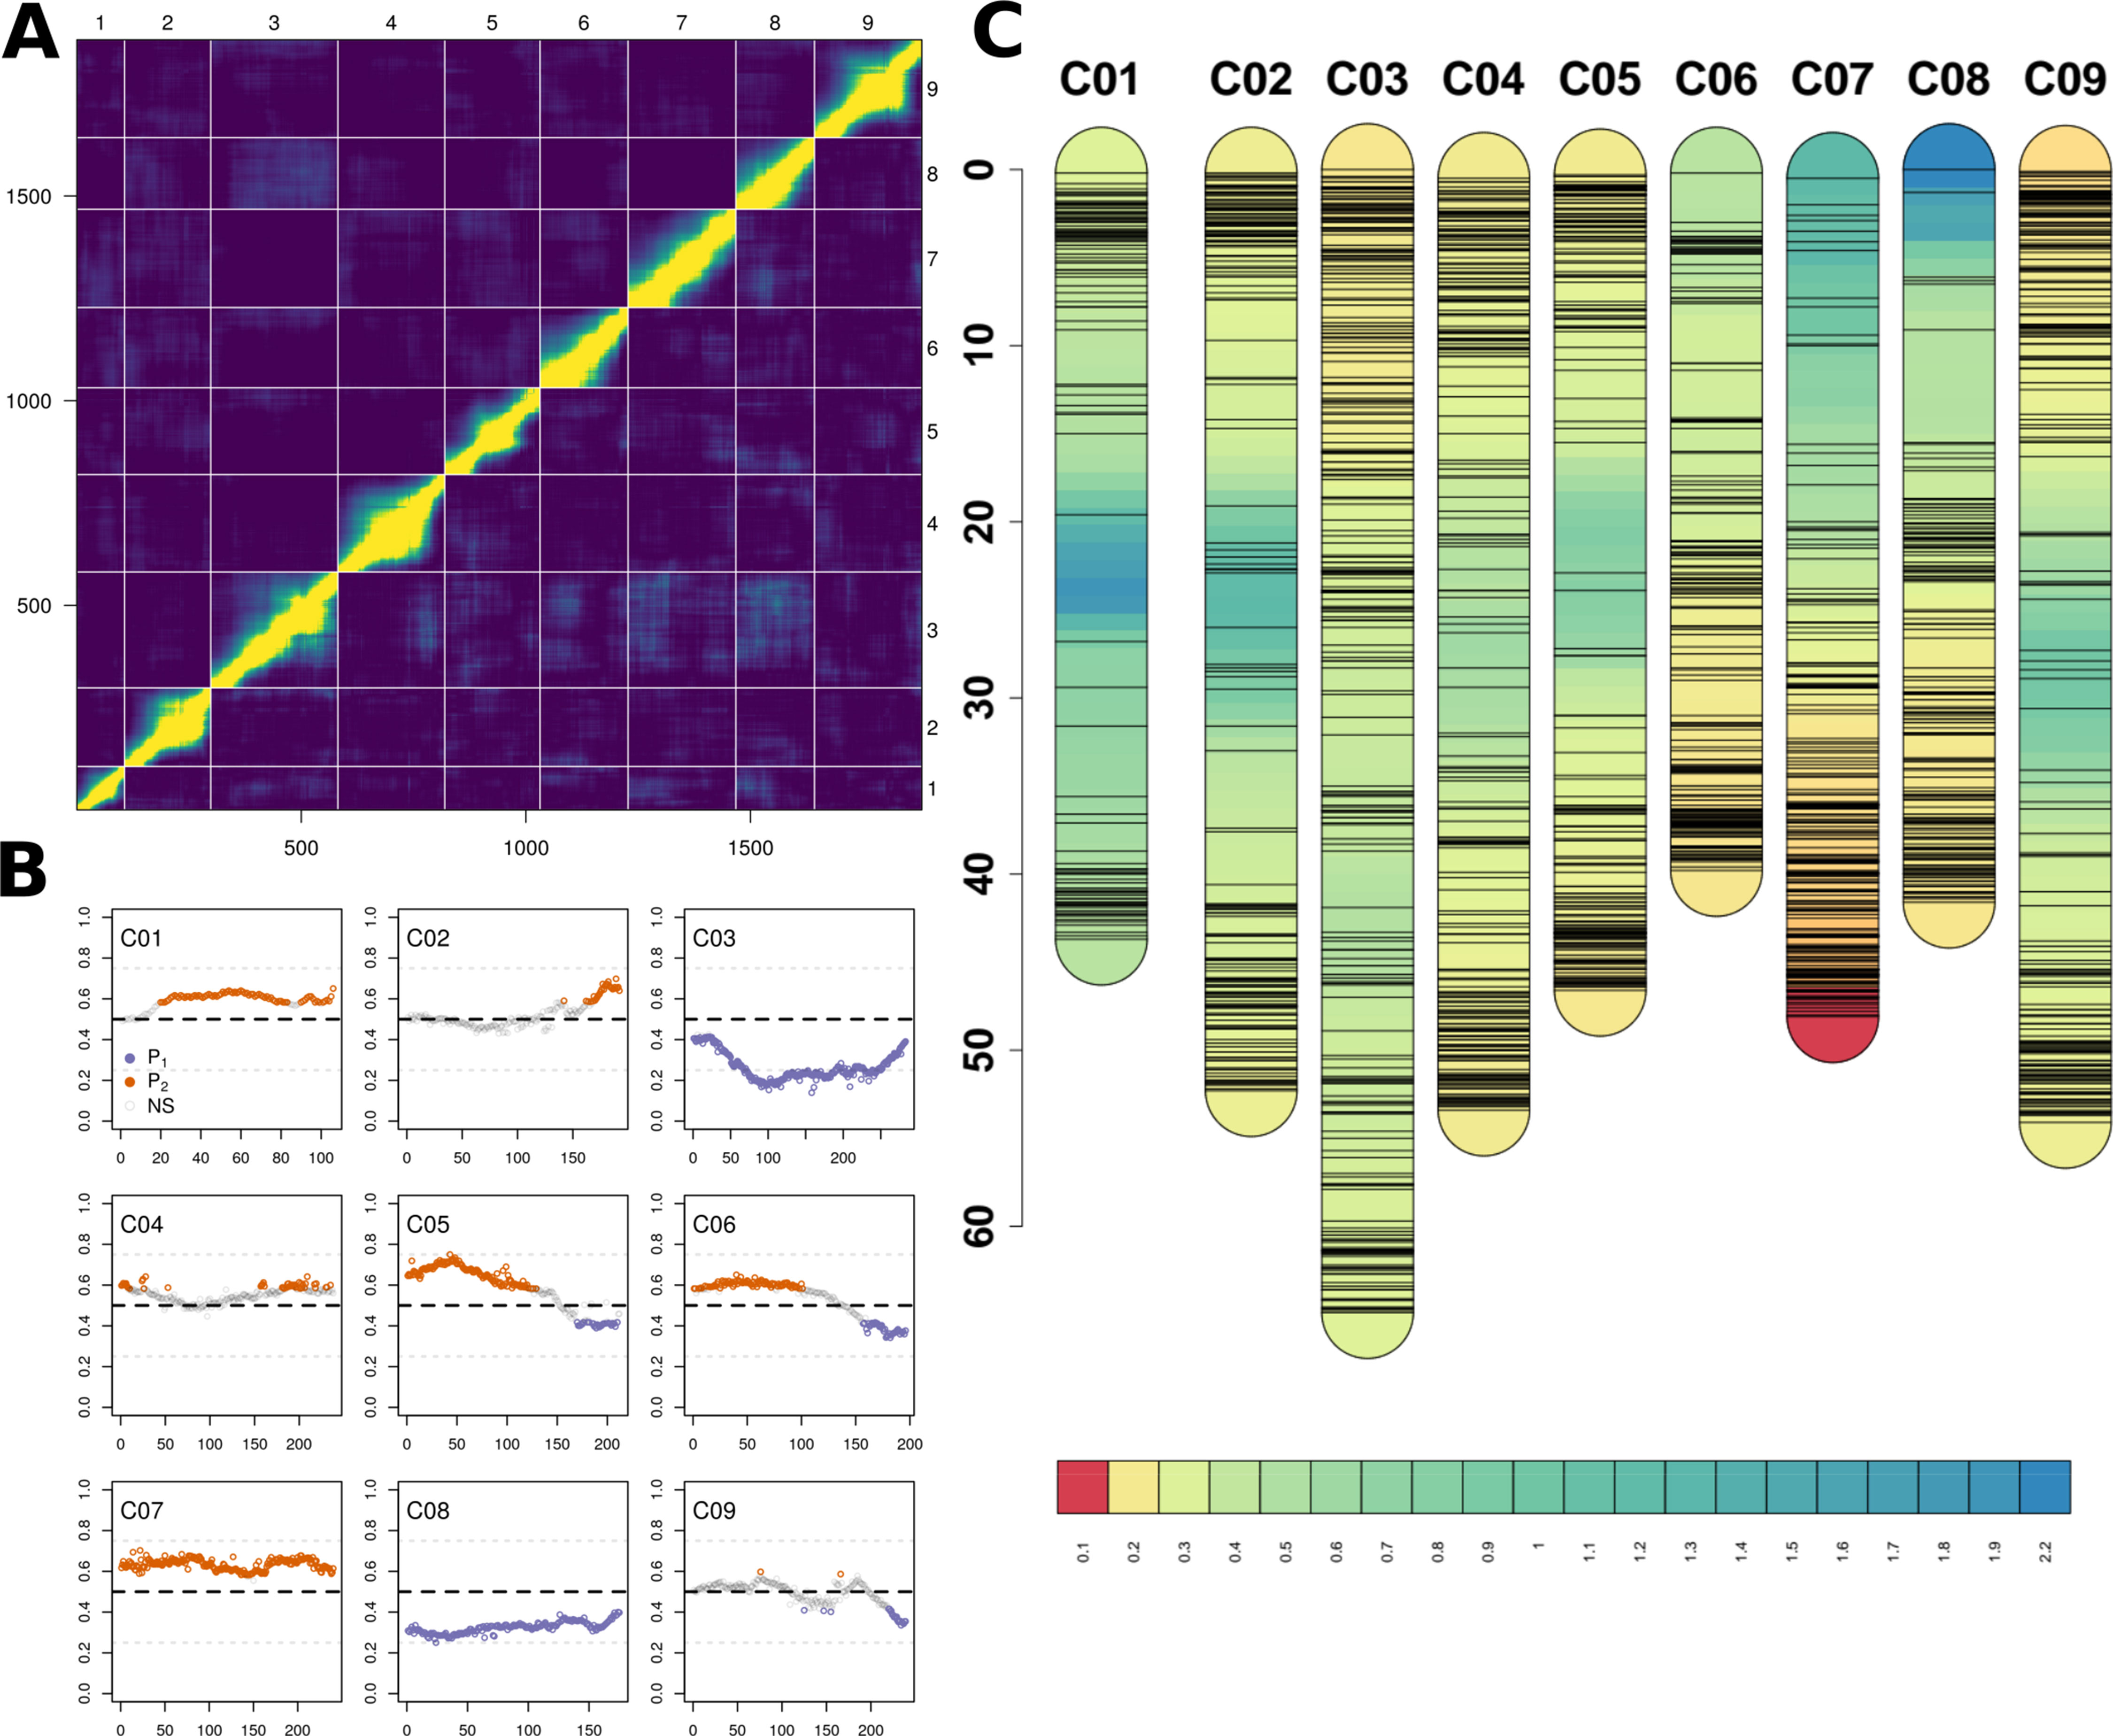
Figure 3 (A) Heatmap of relative recombination fractions (top left) and logarithm of odds scores (bottom right) comparing all pairs of the 1,881 markers (bottom and left axes) and by chromosome (top and right axes) used to construct BolTBDH genetic map. (B) Segregation distortion (Y-axis; f = P1 allele) observed using all markers (X-axis) disaggregatted by chromosomes (C01–C09). Markers exhibiting significant segregation distortion (χ2 [p.adj] < 0.05) plotted in orange (P1) or purple (P2). Non-significant segregation distortion markers are plotted in grey. (C) Genetic map, marker location (cm), and marker density (cm/marker) by chromosome using all 1,881 BolTBDH markers.
Lines identified as hybrids indicated by heterozygous calls, twinned lines, and crossover event outliers were removed, resulting in 175 lines included in multiple QTL mapping (Supplementary Data S1–S3). Deviation from the expected 1:1 segregation pattern (FDR < 0.05) was observed in 61.8% of markers and 50.9% alleles were contributed from P1. Several chromosomes exhibited strong segregation distortion, notably C03: 73.3% (P1), C08: 67.6% (P2), and C07: 63.3% (P1) (Figure 3B). Although segregation distortion may reduce overall QTL detection power, it does not limit detection in sufficiently dense marker sets, therefore these markers were retained.
A genetic map was constructed from 1,881 markers spanning all linkage groups (Figures 3A–C), with markers per chromosome ranging from 106 (C01) to 283 (C03). Total map distance was 1,060.8 cm with a mean and maximum marker spacing of 0.57 and 16.67 cm/marker. Maximum marker spacing per chromosome ranged from 2.26 cm/marker (C08) to 16.67 cm/marker (C05). Mean crossover events per double haploid were 15.0 ± 9.7; max = 61, min = 4.
MQM Mapping
MQM identified 56 single (Figure 4A; Table 3) and 41 epistatic (Table 5; Figure 5) QTL. QTL per chromosome ranged from 1 (C02) to 12 (C09)(Figure 4B). LOD values ranged from 2.85 (MS_C05@39.5; PVE = 7.3) to 39.9 (FC_C03@55.7; PVE = 65.8). Bayesian confidence intervals (95% CI) ranged from 0.3 to 59.9 Mbp (mean = 16.2 Mbp), and contained on average 1902.2 coding sequences and 330.6 A. thaliana hits (Table 4). QTL per trait class ranged from 3 (biomass) to 20 (head quality). Three architecture trait QTL were identified for LT, and no MH QTL were identified. Four biomass QTL were identified, one MS and three VG. Nine leaf morphology QTL were identified: five LA, three LM, and one LC. Thirteen significant bud morphology QTL were identified: one FC, SE, SF, SH, SS, and ST, five BS, and two BU. Twenty head quality QTL were identified, including two BR, two HC, three HD, three HE, two HS, three HU, and four OQ. Seven phenology QTL were identified: two DM, two DF, and three HA. Epistatic QTL (p < 0.05) were detected in every trait class except FC, MH, and SS.
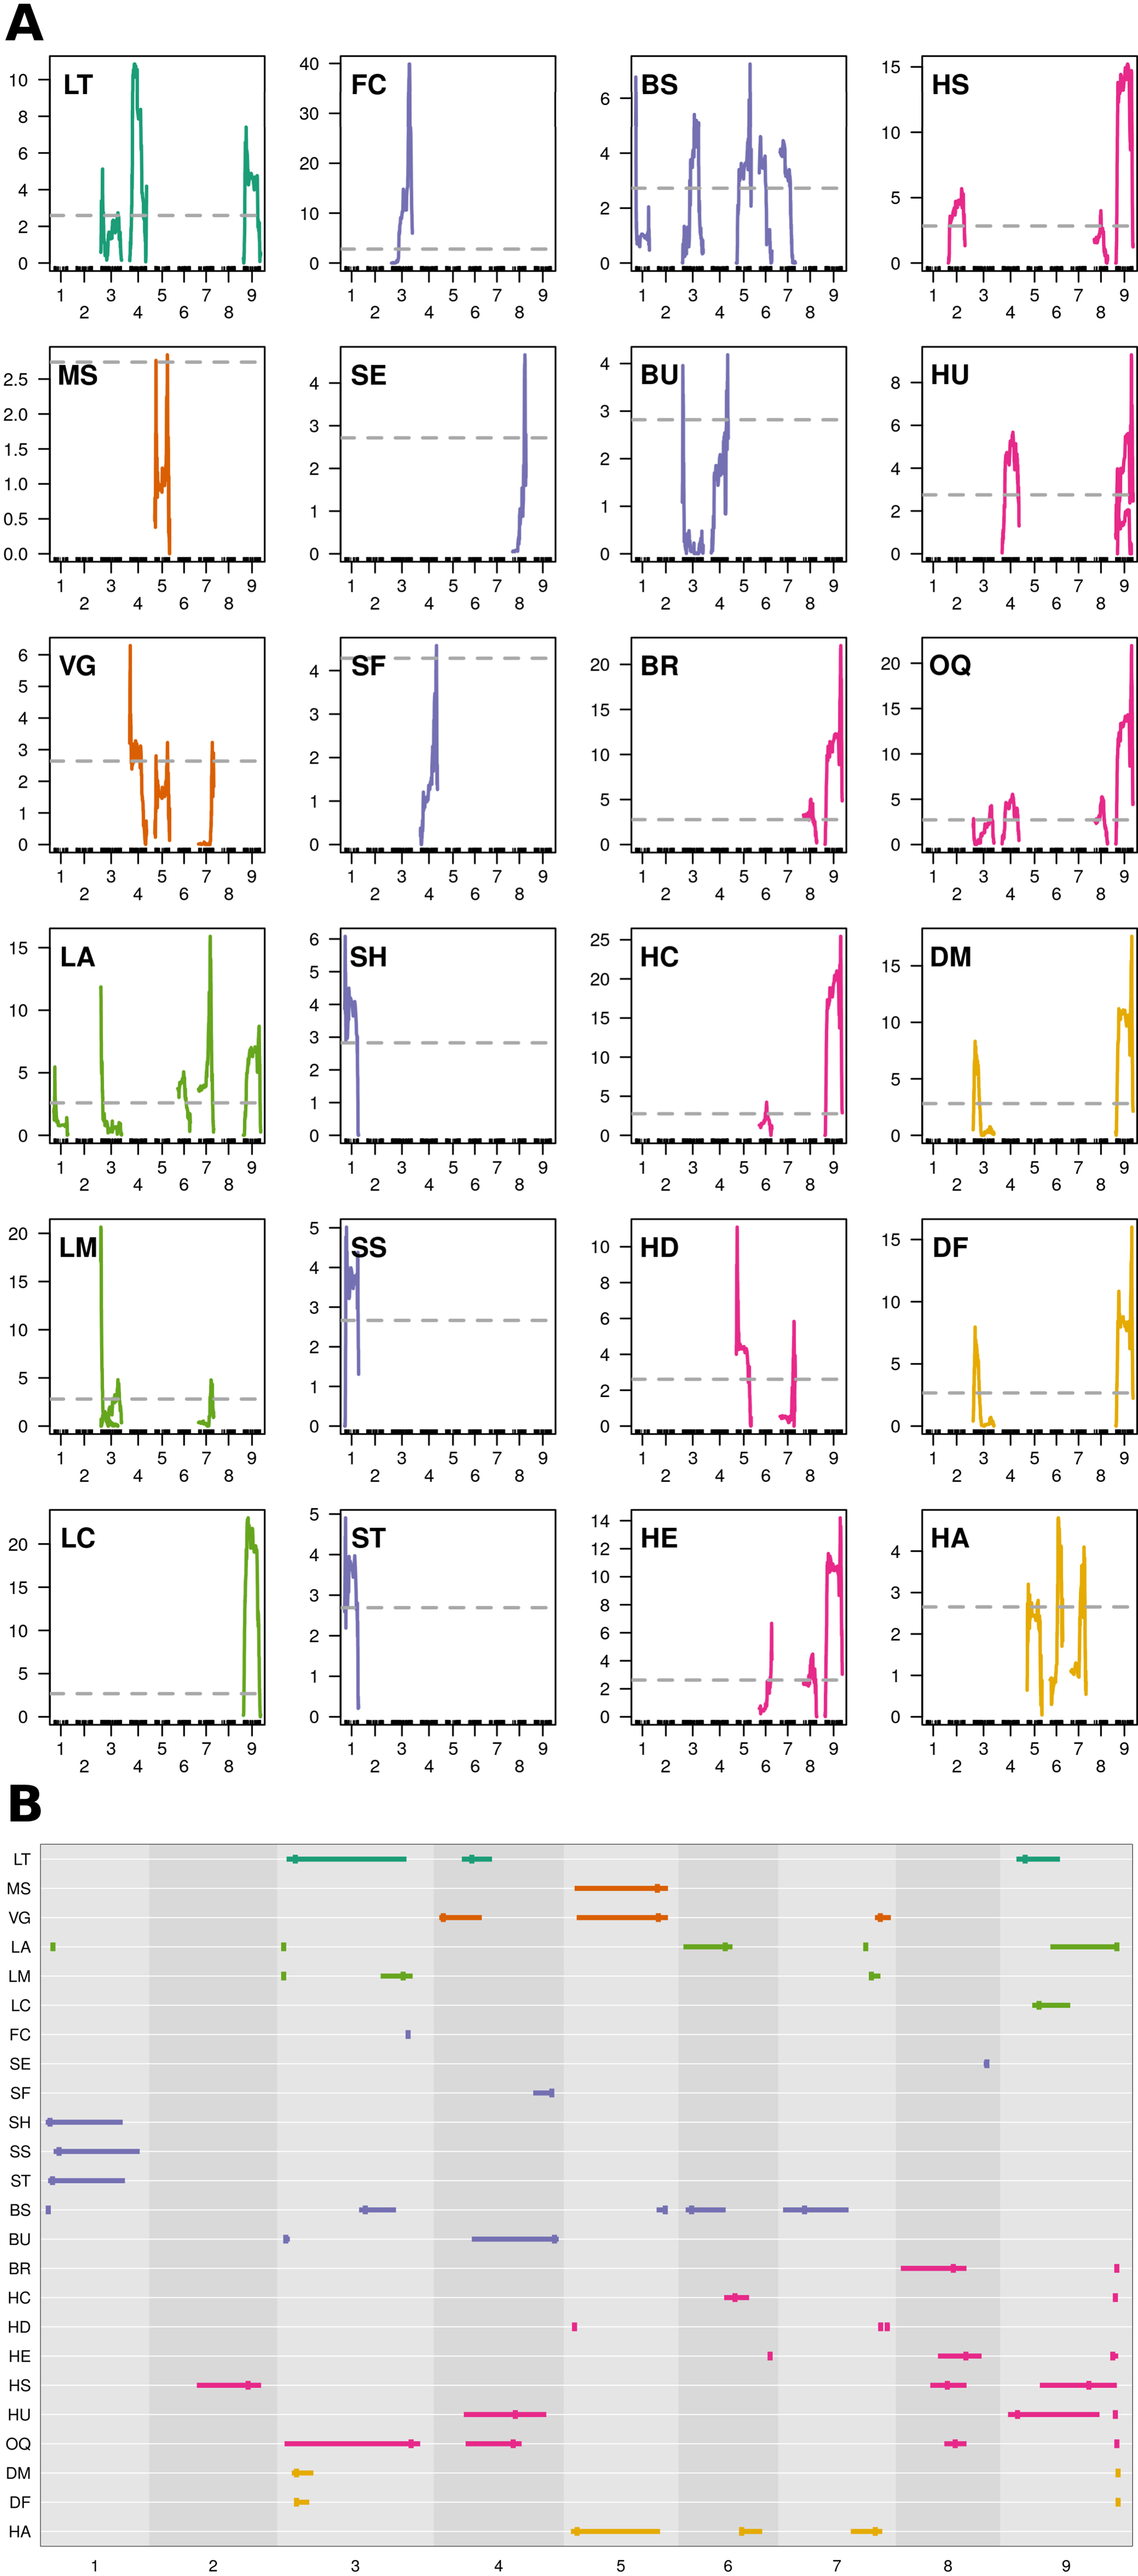
Figure 4 MQM QTL mapping results: (A) QTL plots by trait and chromosome using 1881 markers, 175 double haploid lines, and pooled phenotypes across environments (Y12; X-axis = chromosome, Y-axis = LOD). Horizontal, dashed, grey line = genome-wide significance threshold (α = 0.95) determined from 1,000 permutations of scantwo() for individual traits. Trait class is indicated by color (architecture = dark green, biomass = orange, leaf morphology = light green, bud morphology = light blue, heading quality = pink, and phenology = yellow). (B) Summarized MQM results; traits evaluated in BolTBDH printed along the Y-axis and chromosomes scaled by physical distance (Mbp) are arranged on the X-axis. MQM peak apex given by vertical bar and 95% Bayesian confidence intervals indicated by width of horizontal bar. Color schema is recycled from (A).
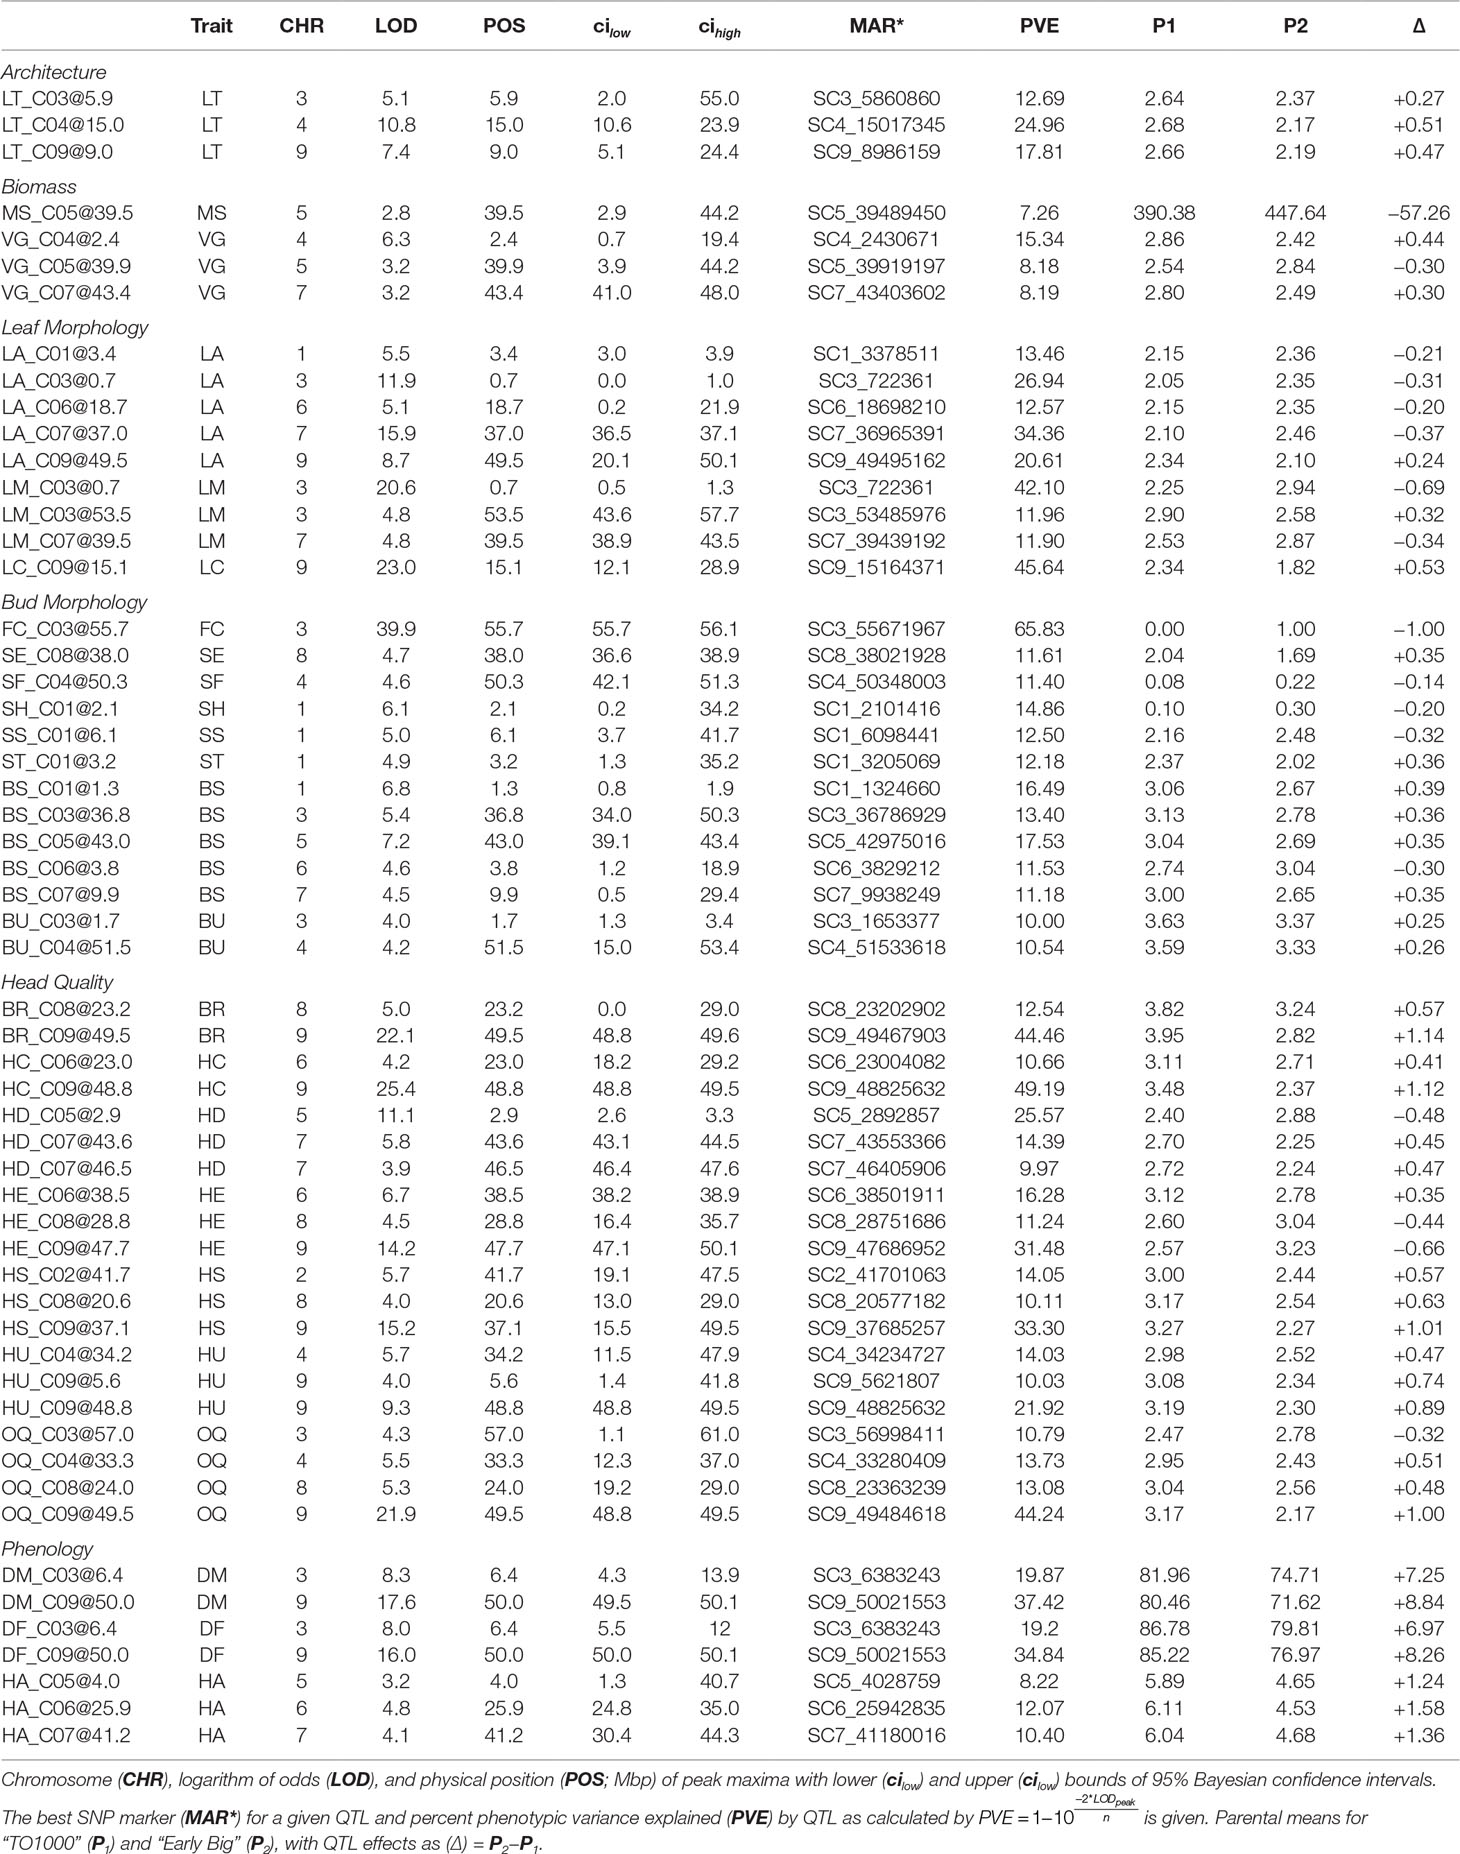
Table 3 Multiple mapping QTL identified in pooled Y12 dataset for individual traits (Trait) within trait classes.
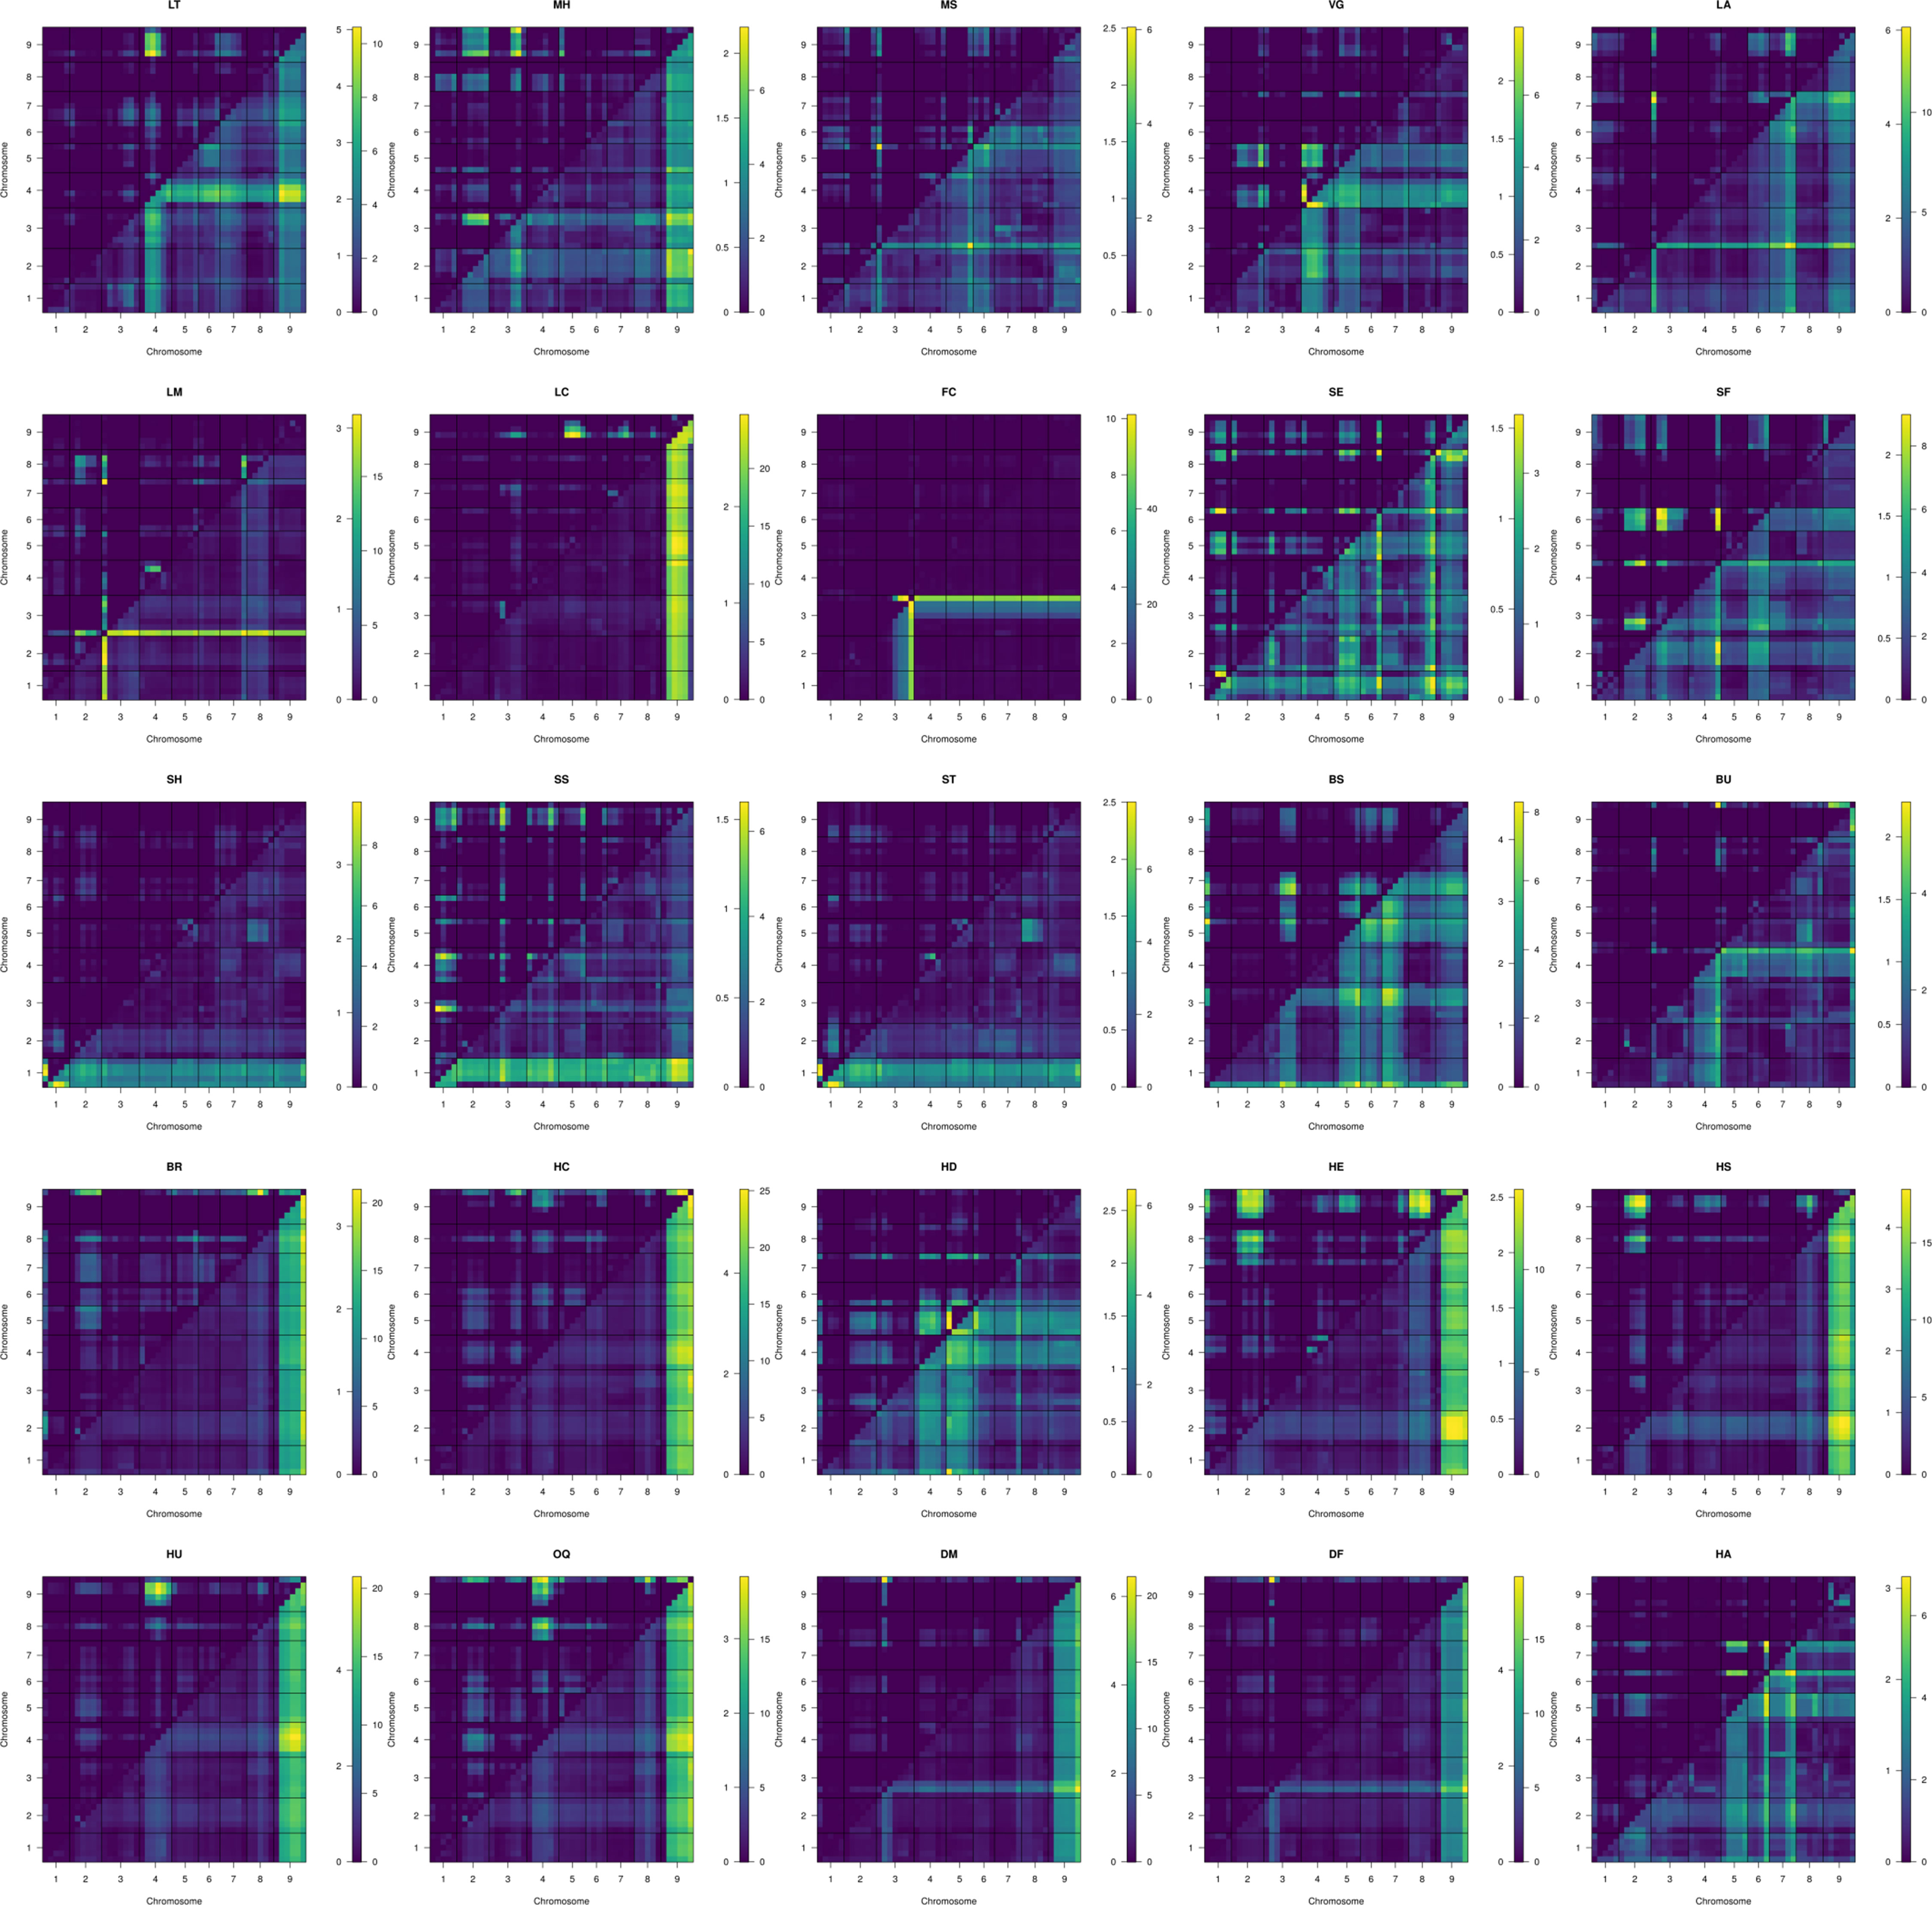
Figure 5 Two dimensional scans of all traits using 1,881 markers, using simulated genotype probabilities (N = 1000) with genotype probabilities calculated across 1 cm steps. Epistatic LOD scores are calculated the difference in the log-likelihood of the full model and the additive model for a given QTL pair and are printed above and left of trace. The full model LOD values are printed below and right of trace.
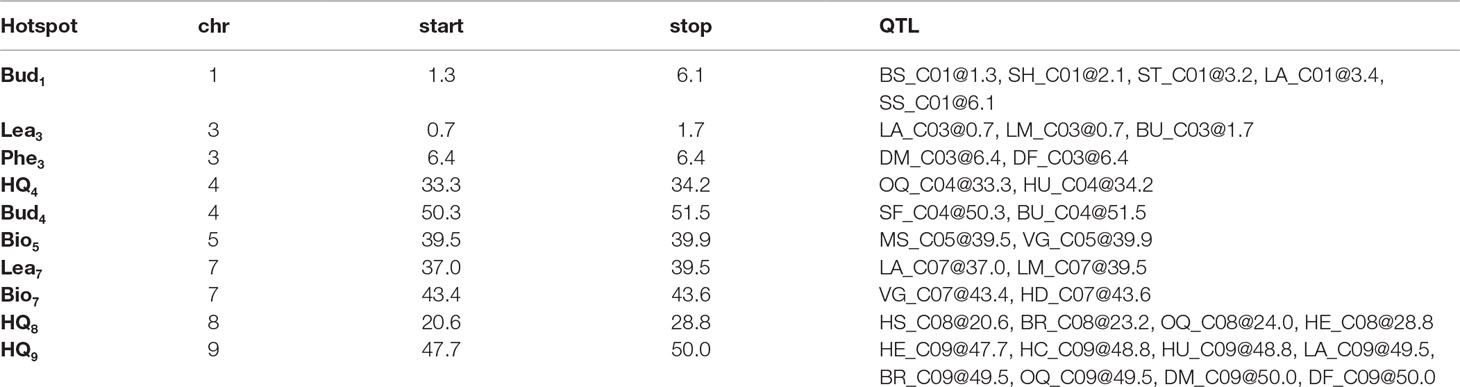
Table 4 Key genomic regions (hotspot) associated with multiple traits within BolTBDH multiple QTL mapping, identified by chromosome (chr), and interval (start and stop; Mbp) and single trait QTL identified within the interval.
Optimal MQM models were determined for all traits ranging in complexity from FC: FC ∼ 3@55.7 to LA ∼ 1@3.4 + 3@0.7 + 6@18.7 + 7@37.0 + [3@0.0 × 9@48.5] + [3@0.0 × 7@36.6] + [7@36.9 x 9@24.4] + [1@2.6 x 9@49.5] + [6@18.7 × 7@36.7] + [1@2.6 × 3@0.0] + [2@3.1 × 8.5] (Table 5).
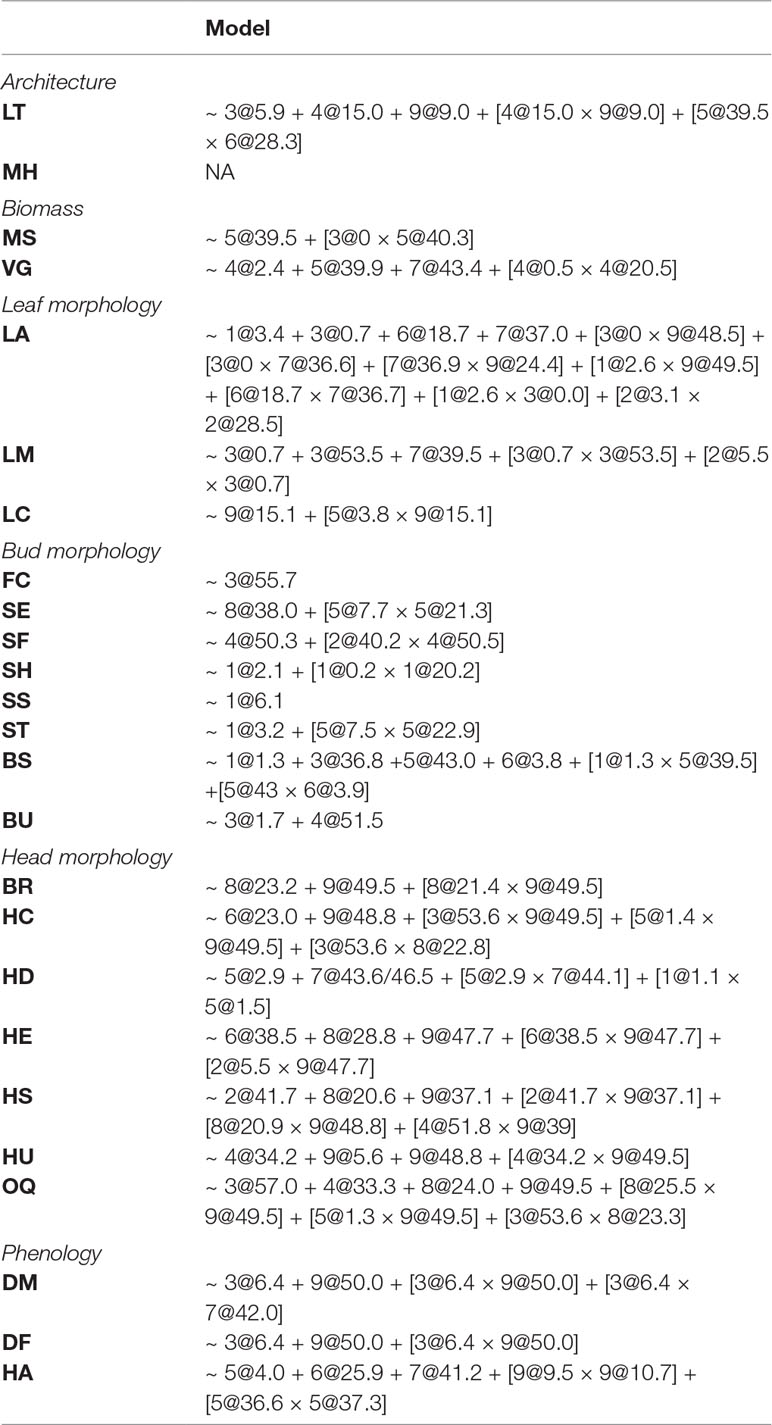
Table 5 Optimal MQM models for traits evaluated in BolTBDH using 1,881 markers within Y12 dataset. Epistatic interactions [QTL1 × QTL2] calculated using penalties assigned from 1,000 permutations of scantwo() and included when pfv1 < 0.05.
Ten QTL hotspots appearing to harbor QTL across multiple traits were identified: two biomass related (Bio5 and Bio7), four morphology related (Bud1, Lea3, Bud4, and Lea7), three heading quality related (HQ4, HQ8, and HQ9), and one phenology related (Phe3) (Table 4).
Discussion
Phenotyping
Field evaluations were conducted in growing seasons that differed somewhat in temperature stress (Figure S1). In year two (Y2), a strong heat wave in the first half of July (mean high = 29.5°C) coincided with the reproductive transition. Horticultural quality scores were lower in Y2 trails, likely due to less optimal temperatures during the transition to flowering (Table 2) [e.g.: suppression of lateral shoot growth (LT) was evaluated 1.3 points lower in Y2 trials].
Genotyping and Mapping
The GBS markers (Figure 3A and Figure S2) generated were high quality with less than 5% missing data and distributed across all chromosomes with a mean coverage 1.77 markers/cM (Figure 3C; Table S2; Figure S3), a six-fold improvement in marker coverage from previous BolTBDH maps, which relied upon approximately 300 SSR and RFLP markers (Sotelo Pérez et al., 2014; Francisco et al., 2016). Segregation distortion was prevalent but chromosome-specific (C03, C07, C08; Figure 3B).
MQM Analysis
Architecture
Excessive lateral side-shoot growth is a horticultural defect that increases harvest costs and reduces yield. Although improved broccoli F1 hybrids typically exhibit strong apical dominance, variability in lateral side-shoot growth occurs among genotypes, typically under environmentally stressed conditions (Potters et al., 2007). In a bulk-segregant analysis of shoot branching in B. juncea, Muntha et al. (2018) identified BjPAT1 and its signal integrator BjBRC1 as branching candidates. The BoPAT1 or BoBRC1 homologs did not collocate with the LT BCI identified in BolTBDH. Tyagi et al. (2019) determined that mutations in BjSOC1 may influence degree of lateral branching. A BoSOC1 ortholog (Bo3g038880) was identified within the 95% LT_C03@5.9 BCI, although this candidate was located >9.5 Mbp from the LOD peak, and is not likely involved in the LT phenotype response observed in BolTBDH. He et al. (2017) conducted GWA and QTL mapping of lateral branching in B. napus and identified BnaC03g63480D as a branching number candidate. The best BnaC03g63480D ortholog, Bo3g159770, was nominally located within the LT_C03@5.9 BCI, but is not considered a likely candidate within this population. Additional candidates associated with meristem identity and fate identified within LT QTL are listed (Table 6).
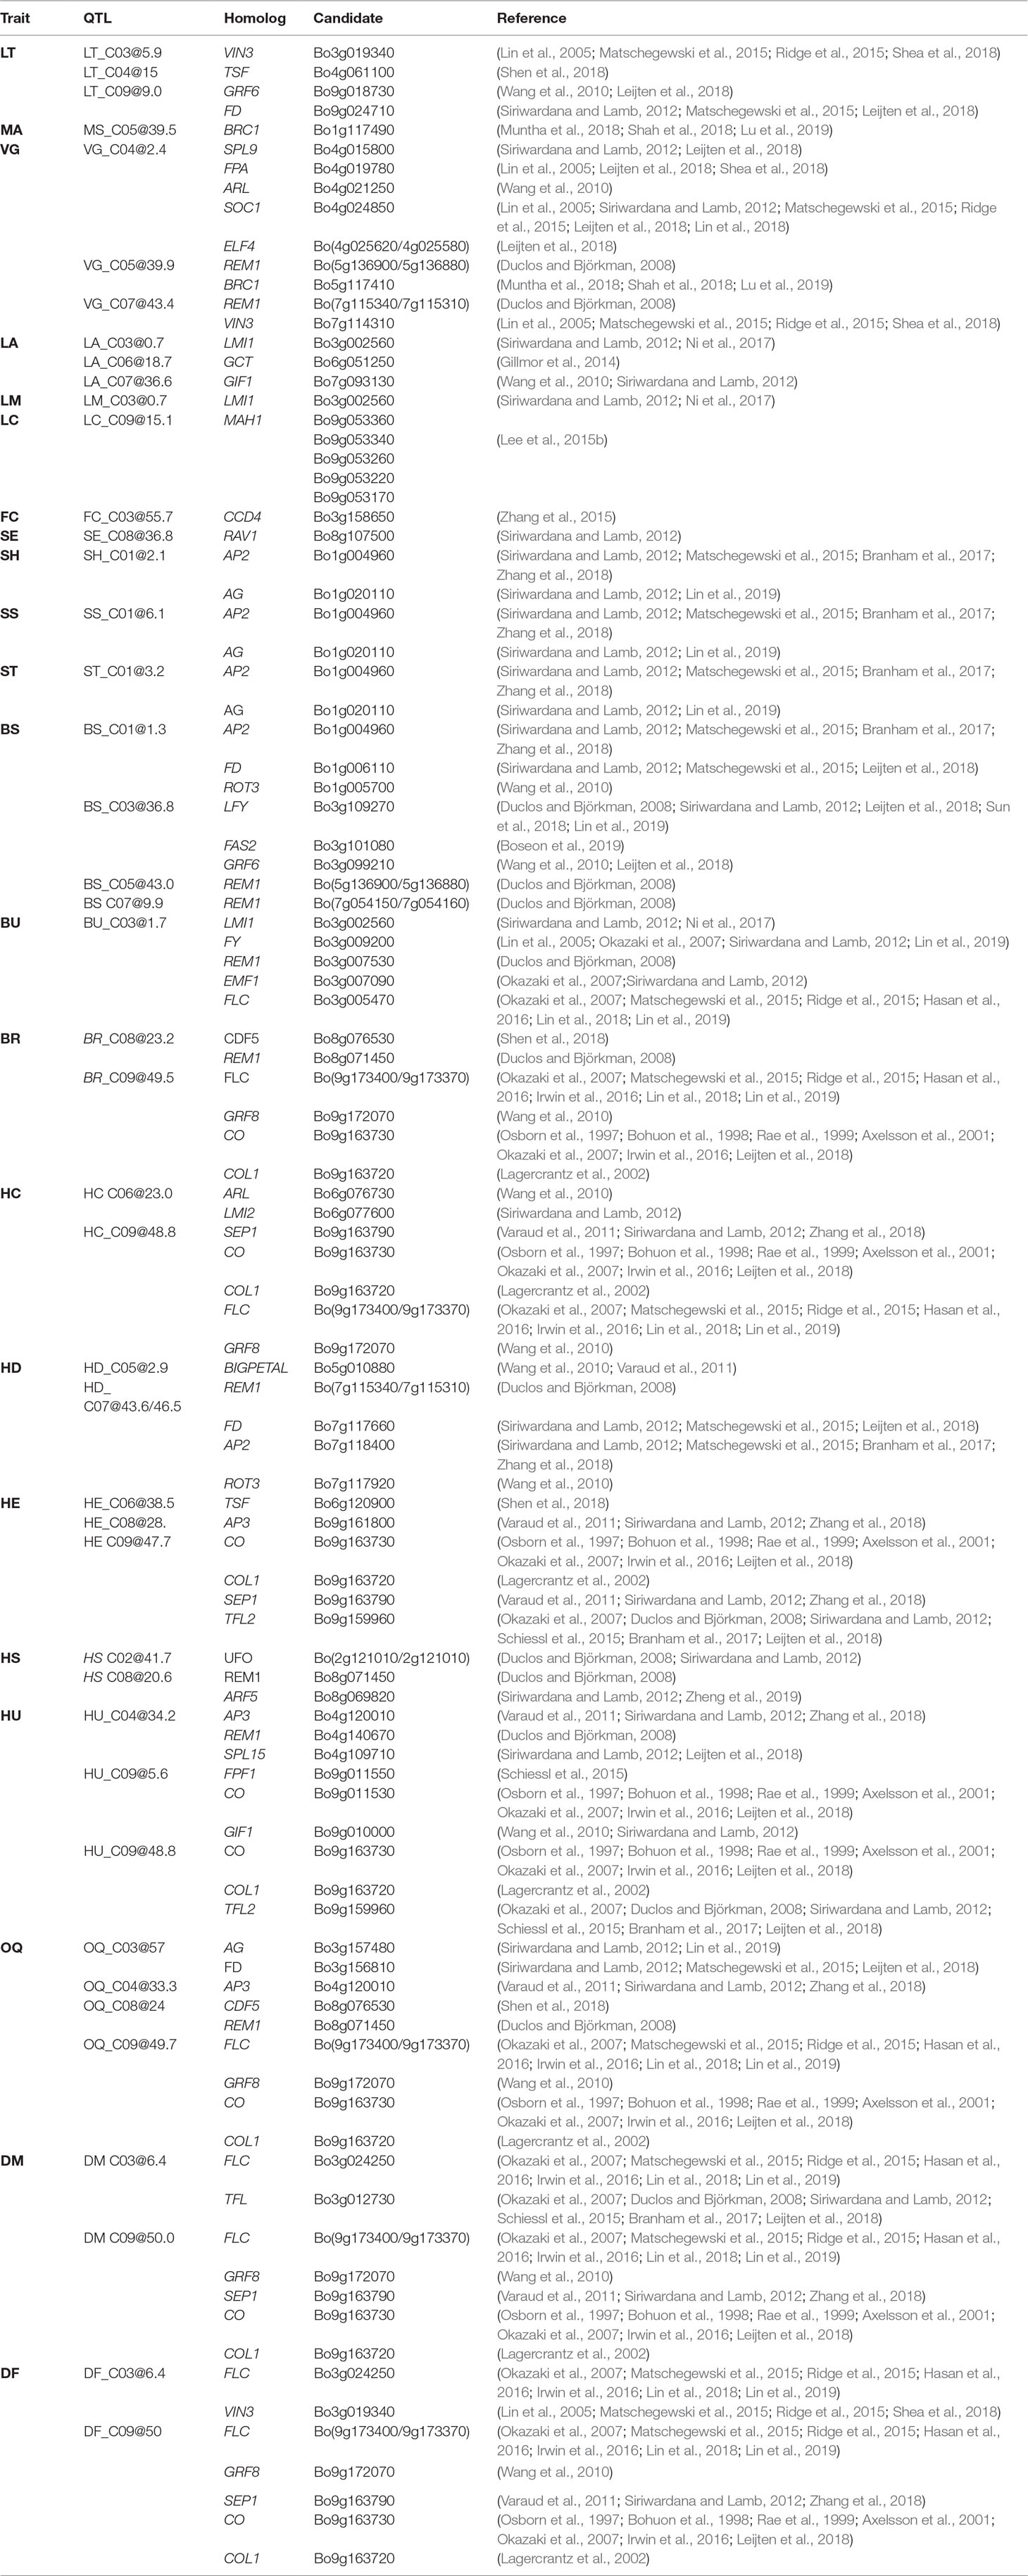
Table 6 For traits (Trait) evaluated within BolTBDH, the MQM QTL (QTL) determined by 95% Bayesian confidence intervals or ± 1 Mbp from LOD peak is (Candidate) intersected with homologous candidates (Homolog) identified by literature review/TAIR/EnsemblePlants.
Biomass
In broccoli, higher yielding genotypes are preferred for commercial production and vegetative biomass is positively correlated with head biomass (Lin et al., 2013). In a F2 broccoli × broccoli population, Lin et al. (2013) identified biomass QTL on linkage groups C1, C5, C8, and C9, although the authors did not identify candidates associated with these loci. In a GWA study of seedling vigor in B. napus, the vigor candidates Bna.SCO1, Bna.ARR4, and Bna.ATE1 were identified by Hatzig et al. (2015), although no homologous candidates were located within the BolTBDH VG BCIs. A GWA and transcriptome analysis in B. napus by Lu et al. (2017) identified two yield-related candidates: BnaA05g29680D and BnaC04g42030D. These candidates were not identified in BolTBDH biomass QTL, although one ortholog of BnaA05g29680D (Bo5g139830) was identified adjacent to the Bio5 hotspot.
The homologous candidates BRC1 (Bo1g117490 and Bo5g117410) is closely related to TEOSINTE BRANCHED1, and is a putative transcription factor involved in arresting axillary bud development and limiting axillary bud growth (Muntha et al., 2018) and was identified within Bio5. Additional homologous VG candidates involved in growth and growth regulation were identified (Table 6).
Leaf Morphology
Variation in leaf morphology is useful to improve and develop novel market classes of B. oleracea leafy greens. Lan and Paterson (2000) identified robust QTL associated with leaf lamina width on C01 and C07, although they did not identify likely candidates. Previous studies have identified leaf-apex QTL on LGO1 and LGO3 (cauliflower × Brussels sprouts) (Sebastian et al., 2002) and C06 and C07 (broccoli × broccoli) (Walley et al., 2012). Li et al. (2009) identified the candidate BrAS1 involved in leaf lamina width. The candidates AtLUG, AtWOX1, and AtAN3 were shown by Zhang et al. (2019) to be involved in leaf blade outgrowth although none of these candidates were identified in LA BCI within BolTBDH. In Arabidopsis, gif1 mutants exhibit a longer, narrow leaf phenotype (Shimano et al., 2018) and a GIF1 homolog (Bo7g093130) collocated within LA_C07@36.6 QTL.
In a QTL-seq analysis of ornamental kale, Ren et al. (2019) identified a lobed-leaf candidate BoLl to C09 (38.82–40.12 Mb), although BoLl did not collocate with BolTBDH LM QTL. Ni et al. (2017) transformed BnLMI1 into Arabidopsis producing serrated leaf margins, similar in appearance to the serrated leaf margin phenotype observed in BolTBDH. In BolTBDH, a BoLMI1 ortholog (Bo3g002560) collocated closely with Lea3 in agreement with Ni et al. (2017).
Alterations in cuticular wax alters herbivore behavior and may confer broad resistance (Branham and Farnham, 2017). Leaf color in B. oleracea is strongly affected by cuticle wax content and is likely responsible for the variation in blue-green matte and dark-green glossy leaf appearance observed in the BolTBDH population. Xu et al. (2019) conducted fine mapping of the cuticular wax synthesis gene BoWax1 controlling the glossy trait in a F2 cabbage population although this candidate was not identified in BolTBDH LC BCI. In another cabbage population segregating for the glossy leaves, Zhu et al. (2019) mapped a non-wax glossy NWGL locus to a 99 kb interval in C08. Neither BoWax1 or the NWGL locus collocated with the LC QTL identified in BolTBDH. Lee et al. (2015b) analyzed expression of wax synthesis candidates and determined that the homologous candidates LACS1, KCS1, KCR1, ECR, CER3, and MAH1 were differentially expressed in broccoli lines with elevated cuticular wax levels. Of these candidates, only MAH1 homologs collocated with LC_C09@15.1 and the BCI included five MAH1 copies: Bo9g053360, Bo9g053340, Bo9g053260, Bo9g053220, Bo9g053170. MAH1 encodes CYP96A15, a midchain alkane hydroxylase, involved in cuticular wax biosynthesis (Greer et al., 2007).
Bud Morphology
B. oleracea flower petals are typically white, but a dominant mutation of BoCCD4 implicated in a yellow-flower phenotype via inactivation of a carotenoid-degrading enzyme has been previously described (Zhang et al., 2015; Han et al., 2019). In BolTBDH, a single flower color QTL was identified (FC_C03@55.7) and BoCCD4 (Bo3g158650; C03:56.61Mb) was located < 1 Mbp from this LOD peak, in agreement with (Zhang et al., 2015). Interestingly, 77.2% of BolTBDH lines exhibited a white flower phenotype, an unexpected result given single locus control in the MQM trait model FC ∼ 3@55.7, however the segregation distortion observed at this locus (f = 0.76 P1) is consistent with this result (Figure 3B).
Certain bud morphology defects contribute to a reduction in head quality, often rendering broccoli heads unmarketable. Hooked sepals are commonly encountered in broccoli hybrids, resulting in a non-uniform crown surface and a reduced ability to shed water. In B. rapa, Zhang et al. (2018) identified loss-of-function BrAP2 alleles with sepal defects similar to the hooked sepal phenotype observed in BolTBDH. In BolTBDH, the optimal MQM model for hooked sepals (SH ∼ 1@2.1 + [1@0.2 × 1@20.2]) co-localized with the bud morphology hotspot Bud1. Bud1 QTL include the homologous candidates AP2 (Bo1g004960), in agreement with Zhang et al. (2018). Further evaluation of AP2 (Bo1g004960) homologs and other floral developmental candidates (Table 6) in the Bud1 hotspot may prove useful for improvement of bud morphology traits.
Small flower buds are preferred in broccoli, but heat-tolerant germplasm typically exhibits larger flower buds. MQM modeling of bead size in BolTHDH resulted in a complex model trait model: BS ∼ Bud1 + 3@36.8 + Bio5 + 6@3.8 + [Bud1 × Bio5] + [Bio5 × 6@3.9], suggesting complex genetic control of this trait.
Unequal-sized flower buds are a common horticultural defect in broccoli and bud uniformity requires an arrest of enlargement of older buds until younger buds reach an equivalent size, requiring complex coordination (Roeder et al., 2010). Lin et al. (2018) identified a QTL within CO6 (qCQ-6) associated with a reduction in uneven-sized flower buds and identified PAN and the most probable candidate within this interval, exhibiting strongly differential expression in floral bud at harvest stage. In the BolTBDH model of flower bud uniformity (BU ∼ Lea3 + 4@51.5), the PAN homolog Bo6g107140 was not harbored within the identified BU QTL.
Head Quality
For heading quality traits, the hotspot HQ9 was remarkably pronounced within MQM analysis of BolTBDH. HQ9 is syntenic with the telomeric region of the short arm of Arabidopsis Chr5 (O’neill and Bancroft, 2000), and this region has previously been shown to carry the homologs of the key flowering-time and vernalization-response genes TLF2, COL1, CO, and FLC (Osborn et al., 1997; Lagercrantz et al., 2002; Lin et al., 2005; Okazaki et al., 2007; Uptmoor et al., 2008; Iniguez-Luy et al., 2009; Hasan et al., 2016; Shea et al., 2018). Razi et al. (2008) mapped BoFLC1 to the end of C09, and homology searches in the BOLv.2 genome indicated that two FLC copies (Bo9g173370 and Bo9g173400) appear to be harbored within the HQ9 hotspot. These putative BoFLC1 copies are located ∼22 Kbp apart and may have been considered as a single copy in previous studies. In broccoli and cauliflower, this region has been implicated in vernalization requirement response (Bohuon et al., 1998; Rae et al., 1999), heat-tolerance (Branham et al., 2017), temperature dependent curd induction (Hasan et al., 2016), variation in heading response to temperature (Lin et al., 2019) and as a target for domestication due to a sharp increase in linkage disequilibrium when comparing improved broccoli and landrace broccoli genotypes (Stansell et al., 2018). Here, we identified HQ9 as containing disproportionately many key heading-quality broccoli QTL: BU_C04@51.5, BR_C09@49.5, HC_C09@48.8, HU_C09@48.8, HE_C09@47.7, and OQ_C09@49.5, as well as two phenology QTL, DM_C09@50.0 and DF_C09@50.0.
Broccoli is characterized by strong suppression of bract elongation in the inflorescence and the “leaf in curd” bracting phenotype has been previously linked to high temperature stress (>22°C) (Booij and Struik, 1990). Kop et al. (2003) identified a role Boap1-a in bracting suppression within broccoli and cauliflower heads, although the authors suggested that additional candidates may be involved in bract development, e.g., BoFUL. Neither AP1 (Bo2g062650, Bo6g095760, Bo6g095760, Bo6g108600), or FUL (Bo2g161210, Bo7g098190, Bo9g014400) homologs cosegregated with bracting loci identified within the BolTBDH MQM bracting model.
Compact broccoli heads are less susceptible to damage and are more efficient to ship. In broccoli, the degree of head compactness is a consequence of a short rachis at a large angle. In a F2B. oleracea cross, Lan and Paterson (2000) identified a C04 QTL (EW4D04w+7) likely implicated in curd density. A more complex head compactness model was observed in BolTBDH (HC ∼ HC_6@23.0 + HQ9 + [HQ9 × 3@53.6] + [HQ9 × 5@1.4] + [HQ8 × 3@53.6]).
Along with head compactness, head diameter at maturity is an important element of high yielding cultivars. In three B. oleracea F2 populations, Lan and Paterson (2000) identified 14 curd width QTL on chromosomes C01, C03, C4, C5, C7, C8, and C9. Within a broccoli × broccoli mapping population, Walley et al. (2012) identified QTL for head diameter on linkage groups C2, C4, C6, C7, and C9. Head diameter within BolTBDH was captured by the MQM model HD ∼ HD_C05 @2.9 + HD_C07@43.6/46.5 + [HD_C05@2.9 × HD_C07@43.6/46.5] + [Bud1 × HD_C05@2.9].
Head extension above lead rosette is a useful trait in broccoli by reducing labor during harvest. Alternatively, late stem elongation may be a useful to protect the head during growth. The MQM model of head extension is complex: HE ∼ HQ9 + HQ8 + C06@38.5 + [HQ9 × 6@38.5] + [HQ9 × 2@5.5].
Convex head shape is an important trait in broccoli by allowing the crown to shed water, thereby reducing disease incidence and exhibits complex control HC ∼ HQ8 + C02@41.7 + C09@37.1 + [HQ8 x HQ9] + [2@41.7 × 9@37.1].
As expected, overall broccoli heading quality is the most complex of the head quality traits, best captured by the MQM model: OQ ∼ 3@57.0 + HQ4 + HQ8 + HQ9 + [HQ8 × 3@53.6] + [HQ8 × HQ9] + [HQ9 × 5@1.3]. A simple control model of the broccoli heading-phenotype due to quantitative control of heading quality traits may be excluded given the MQM model determined in BolTBDH. Additionally, a constrictive-conditional model explaining the broccoli heading-phenotype seems less probable given the relative independence of heading quality traits. For example, the MQM models for HS and HU share HQ9, but HS does not share HQ4 with the overall heading quality model, nor does HU share HQ8 with the overall heading quality model (Figure S4). The arrested-meristem broccoli heading-phenotype is best explained by a pleiotropic model — where a small number of genes within HQ9 are implicated in multiple heading quality traits, and these HQ9 genes exhibit important epistatic interactions with other heading quality loci.
Phenology
In a previous study of days to flowering within a different albogabra × italica mapping population, Bohuon et al. (1998) identified QTL on C02, C03, C05, and C09. In a QTL-seq analysis of broccoli × cabbage, Shu et al. (2018) identified three flowering time regions: C02@0.9–2.9 Mb, C03@1.8–20 Mb, and C06@5.0–5.6 Mb. Only the C03@1.8–20 Mb region collocated with the DF QTL identified in BolTBDH (DF_C03@6.4). Using a relative expression approach, Abuyusuf et al. (2019) report sequence based variations in BoFLC1.C9 (C09:51.0–51.0 Mb) implicated in early and late flowering cabbage genotypes, in agreement with the DM_C09@50.0 and DF_C09@50.0 QTL identified in BolTBDH. In a study of curd initiation in DH cauliflower, Hasan et al. (2016) identified a temperature-dependent time to curd induction QTL on C09 at 49.4 Mb, closely collocating with DM_C09@50.0 and DF_C09@50.0 and identified additional days to flowering QTL on C04, C05, C06, and C07. Within BolTBDH, days to head maturity and flowering appear to be each strongly influenced by two hotspots HQ9 × PHE3 given by the QTL pairs (DM C03_6.4 and DF_C03@6.4) and (DM_C09@49.7 and DF_C09@49.7) and these pairs exhibit strong epistatic effects ([DM_3@6.4 × DM_9@50.0]; pfv1 << 0.01) and [DM_C09@50.0 × DF_C09@50.0] (pfv1 << 0.01). One additional DM epistatic effect was detected ([HQ9 x 7@DM_42.0]; pfv1 = 0.023). Interestingly, HQ9 collocates with the region of strongest genome-wide segregation distortion (P1 allele: f = 0.76). If late-flowering DHs were underrepresented during tissue culture or seed regeneration, the P1 allele and surrounding region would exhibit segregation enrichment.
Lan and Paterson (2000) identified 15 “days from budding to flowering” QTL, analogous to the holding ability trait measured in BolTHDH population. In BolTBDH, “days from head maturity trait to flowering” was best explained by a complex MQM model: HA ∼ 5@4.0 + 6@25.9 + 7@41.2 + [9@9.5 × 9@10.7] + [5@36.6 × 5@37.3] and no likely homologous candidates were identified.
Conclusions
Evaluation of the BolTBDH population provides new insights into key genomic regions and developmental candidates that define heading broccoli by identifying essential QTL implicated in these phenotypic outcomes. These results support a pleiotropic model of a heading broccoli phenotype. This work demonstrates several key genomic hotspots as essential for the phenotypes observed within this study, and these QTL and markers may prove useful for future marker-assisted breeding efforts. The phenomic and genomic dataset provided herein may be used for additional mapping studies and be integrated with previous work (e.g. metabolic and pathogen resistance studies).
Data Availability Statement
The datasets used for this study are included in Stansell_2019_Supp_Data.zip. The code used for this study is available at:
● https://github.com/zacharystansell/BolTBDH
● https://github.com/zacharystansell/ratervar
Author Contributions
ZS and TB conducted experimental design, ZS conducted phenotyping and statistical analyses. MF provided experimental germplasm. All authors wrote the manuscript.
Funding
This work is supported by Specialty Crop Research Initiative grant no. 2016-51181-25402 from the USDA National Institute of Food and Agriculture.
Conflict of Interest
The authors declare that the research was conducted in the absence of any commercial or financial relationships that could be construed as a potential conflict of interest.
Acknowledgments
We thank Miranda Penney and Aleah Butler-Jones for assistance with field phenotyping. Roberto Lazano, Deniz Akdemir, Jian Hua, Jacob Landis, and Sandra Branham provided many helpful comments and suggestions. The UWBC DNA Sequencing Facility provided valuable sequencing services.
Supplementary Material
The Supplementary Material for this article can be found online at: https://www.frontiersin.org/articles/10.3389/fpls.2019.01104/full#supplementary-material
References
Abuyusuf, M., Nath, U. K., Kim, H.-T., Islam, M. R., Park, J.-I., Nou, I.-S. (2019). Molecular markers based on sequence variation in BoFLC1.C9 for characterizing early-and late-flowering cabbage genotypes. BMC Genet. 20, 42. doi: 10.1186/s12863-019-0740-1
Arends, D., Prins, P., Jansen, R. C., Broman, K. W. (2010). R/qtl: high-throughput multiple QTL mapping. Bioinformatics 26, 2990–2992. doi: 10.1093/bioinformatics/btq565
Atallah, S. S., Gómez, M. I., Björkman, T. (2014). Localization effects for a fresh vegetable product supply chain: broccoli in the eastern united states. Food Policy 49, 151–159. doi: 10.1016/j.foodpol.2014.07.005
Axelsson, T., Shavorskaya, O., Lagercrantz, U. (2001). Multiple flowering time QTLs within several brassica species could be the result of duplicated copies of one ancestral gene. Genome 44, 856–864. doi: 10.1139/g01-082
Berardini, T. Z., Reiser, L., Li, D., Mezheritsky, Y., Muller, R., Strait, E., et al. (2015). The Arabidopsis information resource: making and mining the “gold standard” annotated reference plant genome. Genesis 53, 474–485. doi: 10.1002/dvg.22877
Björkman, T., Pearson, K. J. (1998). High temperature arrest of inflorescence development in broccoli (Brassica oleracea var. Italica l.). J. Exp. Bot. 49, 101–106. doi: 10.1093/jxb/49.318.101
Bohuon, E. J. R., Ramsay, L. D., Craft, J. A., Arthur, A. E., Marshall, D. F., Lydiate, D. J., et al. (1998). The association of flowering time quantitative trait loci with duplicated regions and candidate loci in Brassica oleracea. Genetics 150, 393–401.
Booij, R., Struik, P. (1990). Effects of temperature on leaf and curd initiation in relation to juvenility of cauliflower. Sci. Hortic. 44, 201–214. doi: 10.1016/0304-4238(90)90120-4
Boseon, B., Bilichak, A., Kovalchuk, I. (2019). Transgenerational response to heat stress in the form of differential expression of noncoding RNA fragments in Brassica rapa plants. Plant Genome 12, 180022 doi: 10.3835/plantgenome2018.04.0022
Branham, S. E., Farnham, M. W. (2017). Genotyping-by-sequencing of waxy and glossy near-isogenic broccoli lines. Euphytica 213, 84. doi: 10.1007/s10681-017-1873-9
Branham, S. E., Stansell, Z. J., Couillard, D. M., Farnham, M. W. (2017). Quantitative trait loci mapping of heat tolerance in broccoli (Brassica oleracea var. Italica) using genotyping-by-sequencing. Theor. Appl. Genet. 130, 529–538. doi: 10.1007/s00122-016-2832-x
Broman, K. W., Wu, H., Sen, Ś., Churchill, G. A. (2003). R/qtl: QTL mapping in experimental crosses. Bioinformatics 19, 889–890. doi: 10.1093/bioinformatics/btg112
Brown, A. F., Yousef, G. G., Chebrolu, K. K., Byrd, R. W., Everhart, K. W., Thomas, A., et al. (2014). High-density single nucleotide polymorphism (SNP) array mapping in Brassica oleracea: identification of qtl associated with carotenoid variation in broccoli florets. Theor. Appl. Genet. 127, 2051–2064. doi: 10.1007/s00122-014-2360-5
Camargo, L. E. A., Osborn, T. C. (1996). Mapping loci controlling flowering time in Brassica oleracea. Theor. Appl. Genet. 92, 610–616. doi: 10.1007/BF00224565
Cheng, F., Sun, R., Hou, X., Zheng, H., Zhang, F., Zhang, Y., et al. (2016). Subgenome parallel selection is associated with morphotype diversification and convergent crop domestication in Brassica rapa and Brassica oleracea. Nat. Genet. 48, 1218. doi: 10.1038/ng.3634
Duclos, D. V., Björkman, T. (2008). Meristem identity gene expression during curd proliferation and flower initiation in Brassica oleracea. J. Exp. Bot. 59, 421–433. doi: 10.1093/jxb/erm327
Elshire, R. J., Glaubitz, J. C., Sun, Q., Poland, J. A., Kawamoto, K., Buckler, E. S., et al. (2011). A robust, simple genotyping-by-sequencing (GBS) approach for high diversity species. PLoS One 6, e19379. doi: 10.1371/journal.pone.0019379
Farnham, M. W. (1998). Doubled-haploid broccoli production using anther culture: effect of anther source and seed set characteristics of derived lines. J. Am. Soc. Hortic. Sci. 123, 73–77. doi: 10.21273/JASHS.123.1.73
Farnham, M. W., Björkman, T. (2011). Evaluation of experimental broccoli hybrids developed for summer production in the eastern united states. HortScience 46, 858–863. doi: 10.21273/HORTSCI.46.6.858
Francisco, M., Ali, M., Ferreres, F., Moreno, D. A., Velasco, P., Soengas, P. (2016). Organ-specific quantitative genetics and candidate genes of phenylpropanoid metabolism in Brassica oleracea. Front. Plant Sci. 6, 1240. doi: 10.3389/fpls.2015.01240
Gao, M., Li, G., McCombie, W. R., Quiros, C. F. (2005). Comparative analysis of a transposon-rich Brassica oleracea bac clone with its corresponding sequence in A. thaliana. Theor. Appl. Genet. 111, 949–955. doi: 10.1007/s00122-005-0029-9
Gao, M., Li, G., Yang, B., Qiu, D., Farnham, M., Quiros, C. (2007). High-density Brassica oleracea linkage map: identification of useful new linkages. Theor. Appl. Genet. 115, 277–287. doi: 10.1007/s00122-007-0568-3
Gillmor, C. S., Silva-Ortega, C. O., Willmann, M. R., Buendía-Monreal, M., Poethig, R. S. (2014). The Arabidopsis mediator CDK8 module genes CCT (MED12) and GCT (MED13) are global regulators of developmental phase transitions. Development 141, 4580–4589. doi: 10.1242/dev.111229
Glaubitz, J. C., Casstevens, T. M., Lu, F., Harriman, J., Elshire, R. J., Sun, Q., et al. (2014). TASSEL-GBS: a high capacity genotyping by sequencing analysis pipeline. PloS One 9, e90346. doi: 10.1371/journal.pone.0090346
Golicz, A. A., Bayer, P. E., Barker, G. C., Edger, P. P., Kim, H., Martinez, P. A., et al. (2016). The pangenome of an agronomically important crop plant Brassica oleracea. Nat. Commun. 7, 13390. doi: 10.1038/ncomms13390
Greer, S., Wen, M., Bird, D., Wu, X., Samuels, L., Kunst, L., et al. (2007). The cytochrome p450 enzyme CYP96a15 is the midchain alkane hydroxylase responsible for formation of secondary alcohols and ketones in stem cuticular wax of Arabidopsis. Plant Physiol. 145, 653–667. doi: 10.1104/pp.107.107300
Gromping, U. (2006). Relative importance for linear regression in R: the package relaimpo. J. Stat. Software 17(1), 1–27. doi: 10.18637/jss.v017.i01
Han, F., Cui, H., Zhang, B., Liu, X., Yang, L., Zhuang, M., et al. (2019). Map-based cloning and characterization of BoCCD4, a gene responsible for white/yellow petal color in B. oleracea. BMC Genomics 20, 242. doi: 10.1186/s12864-019-5596-2
Hasan, Y., Briggs, W., Matschegewski, C., Ordon, F., Stützel, H., Zetzsche, H., et al. (2016). Quantitative trait loci controlling leaf appearance and curd initiation of cauliflower in relation to temperature. TAG. Theor. Appl. Genet. 129, 1273–1288. doi: 10.1007/s00122-016-2702-6
Hatzig, S. V., Frisch, M., Breuer, F., Nesi, N., Ducournau, S., Wagner, M.-H., et al. (2015). Genome-wide association mapping unravels the genetic control of seed germination and vigor in Brassica napus. Front. Plant Sci. 6, 221. doi: 10.3389/fpls.2015.00221
He, Y., Wu, D., Wei, D., Fu, Y., Cui, Y., Dong, H., et al. (2017). Gwas, qtl mapping and gene expression analyses in Brassica napus reveal genetic control of branching morphogenesis. Sci. Rep. 7, 15971. doi: 10.1038/s41598-017-15976-4
Hu, J., Sadowski, J., Osborn, T. C., Landry, B. S., Quiros, C. F. (1998). Linkage group alignment from four independent Brassica oleracea RFLP maps. Genome 41, 226–235. doi: 10.1139/g98-007
Iglesias-Bernabé, L., Madloo, P., Rodríguez, V. M., Francisco, M., Soengas, P. (2019). Dissecting quantitative resistance to Xanthomonas campestris pv. campestris in leaves of Brassica oleracea by QTL analysis. Sci. Rep. 9, 2015. doi: 10.1038/s41598-019-38527-5
Iniguez-Luy, F. L., Lukens, L., Farnham, M. W., Amasino, R. M., Osborn, T. C. (2009). Development of public immortal mapping populations, molecular markers and linkage maps for rapid cycling Brassica rapa and Brassica oleracea. Theor. Appl. Genet. 120, 31–43. doi: 10.1007/s00122-009-1157-4
Irwin, J. A., Soumpourou, E., Lister, C., Ligthart, J., Kennedy, S., Dean, C. (2016). Nucleotide polymorphism affecting FLC expression underpins heading date variation in horticultural brassicas. Plant J. 87, 597–605. doi: 10.1111/tpj.13221
Kianian, S. F., Quiros, C. F. (1992). Generation of a brassica oleracea composite RFLP map: linkage arrangements among various populations and evolutionary implications. Theor. Appl. Genet. 84, 544–554. doi: 10.1007/BF00224150
Kop, E. P., Teakle, G. R., McClenaghan, E. R., Lynn, J. R., King, G. J. (2003). Genetic analysis of the bracting trait in cauliflower and broccoli. Plant Sci. 164, 803–808. doi: 10.1016/S0168-9452(03)00068-2
Lagercrantz, U., Kruskopf Osterberg, M., Lascoux, M. (2002). Sequence variation and haplotype structure at the putative flowering-time locus COL1 of Brassica nigra. Mol. Biol. Evol. 19, 1474–1482. doi: 10.1093/oxfordjournals.molbev.a004210
Lan, T., Paterson, A. H. (2001). Comparative mapping of QTLs determining the plant size of Brassica oleracea. Theor. Appl. Genet. 103, 383–397. doi: 10.1007/s001220100615
Lan, T. H., Paterson, A. H. (2000). Comparative mapping of quantitative trait loci sculpting the curd of Brassica oleracea. Genetics 155, 1927–1954. doi: 10.1007/s001220100615
Landry, B. S., Hubert, N., Crete, R., Chang, M. S., Lincoln, S. E., Etoh, T. (1992). A genetic map for Brassica oleracea based on RFLP markers detected with expressed DNA sequences and mapping of resistance genes to race 2 of Plasmodiophora brassicae (woronin). Genome 35, 409–420. doi: 10.1139/g92-061
Lee, J., Izzah, N. K., Choi, B.-S., Joh, H. J., Lee, S.-C., Perumal, S., et al. (2015a). Genotyping-by-sequencing map permits identification of clubroot resistance QTLs and revision of the reference genome assembly in cabbage (Brassica oleracea l.). DNA Res. 23, 29–41. doi: 10.1093/dnares/dsv034
Lee, J., Yang, K., Lee, M., Kim, S., Kim, J., Lim, S., et al. (2015). Differentiated cuticular wax content and expression patterns of cuticular wax biosynthetic genes in bloomed and bloomless broccoli (Brassica oleracea var. Italica). Process Biochem. 50, 456–462. doi: 10.1016/j.procbio.2014.12.012
Leijten, W., Koes, R., Roobeek, I., Frugis, G. (2018). Translating flowering time from Arabidopsis thaliana to Brassicaceae and Asteraceae crop species. Plants 7, 111. doi: 10.3390/plants7040111
Li, F., Kitashiba, H., Inaba, K., Nishio, T. (2009). A Brassica rapa linkage map of EST-based SNP markers for identification of candidate genes controlling flowering time and leaf morphological traits. DNA Res. 16, 311–323. doi: 10.1093/dnares/dsp020
Li, G., Gao, M., Yang, B., Quiros, C. F. (2003). Gene for gene alignment between the Brassica and Arabidopsis genomes by direct transcriptome mapping. Theor. Appl. Genet. 107, 168–180. doi: 10.1007/s00122-003-1236-x
Li, G., Zhang, G., Zhang, Y., Liu, K., Li, T., Chen, H. (2015). Identification of quantitative trait loci for bolting and flowering times in Chinese kale (Brassica oleracea var. Alboglabra) based on ssr and srap markers. J. Hortic. Sci. Biotechnol. 90, 728–737. doi: 10.1080/14620316.2015.11668739
Li, H. (2013). “Aligning sequence reads, clone sequences and assembly contigs with BWA-MEM” in arXiv (Cambridge, USA: Broad Institute of Harvard and MIT), 1–3.
Li, Z., Mei, Y., Liu, Y., Fang, Z., Yang, L., Zhuang, M., et al. (2019). The evolution of genetic diversity of broccoli cultivars in China since 1980. Sci. Hortic. 250, 69–80. doi: 10.1016/j.scienta.2019.02.034
Lin, C.-W., Fu, S.-F., Liu, Y.-J., Chen, C.-C., Chang, C.-H., Yang, Y.-W., et al. (2019). Analysis of ambient temperature-responsive transcriptome in shoot apical meristem of heat-tolerant and heat-sensitive broccoli inbred lines during floral head formation. BMC Plant Biol. 19, 3. doi: 10.1186/s12870-018-1613-x
Lin, K., Chang, L., Lai, C., Lo, H. (2013). Aflp mapping of quantitative trait loci influencing seven head-related traits in broccoli (Brassica oleracea var. Italica). J. Hortic. Sci. Biotechnol. 88, 257–268. doi: 10.1080/14620316.2013.11512964
Lin, S.-I., Wang, J.-G., Poon, S.-Y., Wang, S.-S., Chiou, T.-J. (2005). Differential regulation of FLOWERING LOCUS C expression by vernalization in cabbage and Arabidopsis. Plant Physiol. 137, 1037–1048. doi: 10.1104/pp.104.058974
Lin, Y.-R., Lee, J.-Y., Tseng, M.-C., Lee, C.-Y., Shen, C.-H., Wang, C.-S., et al. (2018). Subtropical adaptation of a temperate plant (Brassica oleracea var. Italica) utilizes non-vernalization-responsive QTLs. Sci. Rep. 8, 13609. doi: 10.1038/s41598-018-31987-1
Liu, S., Liu, Y., Yang, X., Tong, C., Edwards, D., Parkin, I. A. P., et al. (2014). The Brassica oleracea genome reveals the asymmetrical evolution of polyploid genomes. Nat. Commun. 5, 3930. doi: 10.1038/ncomms4930
Lu, K., Peng, L., Zhang, C., Lu, J., Yang, B., Xiao, Z., et al. (2017). Genome-wide association and transcriptome analyses reveal candidate genes underlying yield-determining traits in Brassica napus. Front. Plant Sci. 8, 206. doi: 10.3389/fpls.2017.00206
Lu, K., Wei, L., Li, X., Wang, Y., Wu, J., Liu, M., et al. (2019). Whole-genome resequencing reveals Brassica napus origin and genetic loci involved in its improvement. Nat. Commun. 10, 1154. doi: 10.1038/s41467-019-09134-9
Matschegewski, C., Zetzsche, H., Hasan, Y., Leibeguth, L., Briggs, W., Ordon, F., et al. (2015). Genetic variation of temperature-regulated curd induction in cauliflower: elucidation of floral transition by genome-wide association mapping and gene expression analysis. Front. Plant Sci. 6, 720. doi: 10.3389/fpls.2015.00720
Muntha, S. T., Zhang, L., Zhou, Y., Zhao, X., Hu, Z., Yang, J., et al. (2018). Phytochrome A signal transduction 1 and CONSTANS-LIKE 13 coordinately orchestrate shoot branching and flowering in leafy Brassica juncea. Plant Biotechnol. J. 17, 1333–1343. doi: 10.1111/pbi.13057
Ni, X., Liu, H., Huang, J., Zhao, J. (2017). LMI1-like genes involved in leaf margin development of Brassica napus. Genetica 145, 269–274. doi: 10.1007/s10709-017-9963-0
Okazaki, K., Sakamoto, K., Kikuchi, R., Saito, A., Togashi, E., Kuginuki, Y., et al. (2007). Mapping and characterization of FLC homologs and QTL analysis of flowering time in Brassica oleracea. Theor. Appl. Genet. 114, 595–608. doi: 10.1007/s00122-006-0460-6
O’neill, C. M., Bancroft, I. (2000). Comparative physical mapping of segments of the genome of Brassica oleracea var. Alboglabra that are homoeologous to sequenced regions of chromosomes 4 and 5 of. Plant J. 23, 233–243. doi: 10.1046/j.1365-313x.2000.00781.x
Osborn, T. C., Kole, C., Parkin, I. A., Sharpe, A. G., Kuiper, M., Lydiate, D. J., et al. (1997). Comparison of flowering time genes in Brassica rapa, Brassica napus and Arabidopsis thaliana. Genetics 146, 1123–1129.
Parkin, I. A., Koh, C., Tang, H., Robinson, S. J., Kagale, S., Clarke, W. E., et al. (2014). Transcriptome and methylome profiling reveals relics of genome dominance in the mesopolyploid Brassica oleracea. Genome Biol. 15, R77. doi: 10.1186/gb-2014-15-6-r77
Pink, D., Bailey, L., McClement, S., Hand, P., Mathas, E., Buchanan-Wollaston, V., et al. (2008). Double haploids, markers and QTL analysis in vegetable brassicas. Euphytica 164, 509–514. doi: 10.1007/s10681-008-9742-1
Potters, G., Pasternak, T. P., Guisez, Y., Palme, K. J., Jansen, M. A. (2007). Stress-induced morphogenic responses: growing out of trouble? Trends Plant Sci. 12, 98–105. doi: 10.1016/j.tplants.2007.01.004
R Core Team (2019). R: A Language and Environment for Statistical Computing. Vienna, Austria: R Foundation for Statistical Computing.
Rae, A. M., Howell, E. C., Kearsey, M. J. (1999). More QTL for flowering time revealed by substitution lines in Brassica oleracea. Heredity 83, 586. doi: 10.1038/sj.hdy.6886050
Ramsay, L., Jennings, D., Kearsey, M. J., Marshall, D. F., Bohuon, E. J. R., Arthur, A. E., et al. (1996). The construction of a substitution library of recombinant backcross lines in Brassica oleracea for the precision mapping of quantitative trait loci. Genome 39, 558–567. doi: 10.1139/g96-071
Razi, H., Howell, E. C., Newbury, H. J., Kearsey, M. J. (2008). Does sequence polymorphism of FLC paralogues underlie flowering time QTL in Brassica oleracea? TAG. Theor. Appl. Genet. 116, 179–192. doi: 10.1007/s00122-007-0657-3
Ren, J., Liu, Z., Du, J., Fu, W., Hou, A., Feng, H. (2019). Fine-mapping of a gene for the lobed leaf, boll, in ornamental kale (Brassica oleracea L. var. Acephala). Mol. Breed. 39, 40. doi: 10.1007/s11032-019-0944-0
Ridge, S., Brown, P. H., Hecht, V., Driessen, R. G., Weller, J. L. (2015). The role of BoFLC2 in cauliflower (Brassica oleracea var. Botrytis l.) reproductive development. J. Exp. Bot. 66, 125–135. doi: 10.1093/jxb/eru408
Roeder, A. H. K., Chickarmane, V., Cunha, A., Obara, B., Manjunath, B. S., Meyerowitz, E. M. (2010). Variability in the control of cell division underlies sepal epidermal patterning in Arabidopsis thaliana. PLoS Biol. 8, e1000367. doi: 10.1371/journal.pbio.1000367
Ruffier, M., Kähäri, A., Komorowska, M., Keenan, S., Laird, M., Longden, I., et al. (2017). Ensembl core software resources: storage and programmatic access for DNA sequence and genome annotation. (Oxford) 2017, (1) bax020. doi: 10.1093/database/bax020
Schiessl, S., Iniguez-Luy, F., Qian, W., Snowdon, R. J. (2015). Diverse regulatory factors associate with flowering time and yield responses in winter-type Brassica napus. BMC Genomics 16, 737. doi: 10.1186/s12864-015-1950-1
Sebastian, R. L., Howell, E. C., King, G. J., Marshall, D. F., Kearsey, M. J. (2000). An integrated AFLP and RFLP Brassica oleracea linkage map from two morphologically distinct doubled-haploid mapping populations. Theor. Appl. Genet. 100, 75–81. doi: 10.1007/s001220050011
Sebastian, R. L., Kearsey, M. J., King, G. J. (2002). Identification of quantitative trait loci controlling developmental characteristics of Brassica oleracea L. Theor. Appl. Genet. 104, 601–609. doi: 10.1007/s001220100743
Shah, S., Weinholdt, C., Jedrusik, N., Molina, C., Zou, J., Große, I., et al. (2018). Whole-transcriptome analysis reveals genetic factors underlying flowering time regulation in rapeseed (Brassica napus L.). Plant Cell Environ. 41, 1935–1947. doi: 10.1111/pce.13353
Shea, D. J., Itabashi, E., Takada, S., Fukai, E., Kakizaki, T., Fujimoto, R., et al. (2018). The role of FLOWERING LOCUS C in vernalization of Brassica: the importance of vernalization research in the face of climate change. Crop Pasture Sci. 69, 30–39. doi: 10.1071/CP16468
Shen, Y., Xiang, Y., Xu, E., Ge, X., Li, Z. (2018). Major co-localized QTL for plant height, branch initiation height, stem diameter, and flowering time in an alien introgression derived Brassica napus DH population. Front. Plant Sci. 9, 390. doi: 10.3389/fpls.2018.00390
Shimano, S., Hibara, K.-I., Furuya, T., Arimura, S.-I., Tsukaya, H., Itoh, J.-I. (2018). Conserved functional control, but distinct regulation, of cell proliferation in rice and Arabidopsis leaves revealed by comparative analysis of GRF-INTERACTING FACTOR 1 orthologs. Development 145, dev159624. doi: 10.1242/dev.159624
Shu, J., Liu, Y., Zhang, L., Li, Z., Fang, Z., Yang, L., et al. (2018). Qtl-seq for rapid identification of candidate genes for flowering time in broccoli × cabbage. Theor. Appl. Genet. 131, 917–928. doi: 10.1007/s00122-017-3047-5
Siriwardana, N. S., Lamb, R. S. (2012). The poetry of reproduction: the role of leafy in Arabidopsis thaliana flower formation. Int. J. Dev. Biol. 56, 207–221. doi: 10.1387/ijdb.113450ns
Sotelo, T., Cartea, M. E., Velasco, P., Soengas, P. (2014). Identification of antioxidant capacity-related QTLs in Brassica oleracea. PLoS One 9(9), e107290. doi: 10.1371/journal.pone.0107290
Sotelo Pérez, T., Francisco Candeira, M., Cartea González, M. E., Rodríguez Graña, V. M., Soengas Fernández, M. D. P. (2014). QTLs controlling antioxidant capacity in leaves and flower buds of Brassica oleracea. PLoS One. doi: 10.1371/journal.pone.0107290
Stansell, Z., Björkman, T., Branham, S., Couillard, D., Farnham, M. W. (2017). Use of a quality trait index to increase the reliability of phenotypic evaluations in broccoli. HortScience 52, 1490–1495. doi: 10.21273/HORTSCI12202-17
Stansell, Z., Hyma, K., Fresnedo-Ramírez, J., Sun, Q., Mitchell, S., Björkman, T., et al. (2018). Genotyping-by-sequencing of Brassica oleracea vegetables reveals unique phylogenetic patterns, population structure and domestication footprints. Hortic. Res. 5, 38. doi: 10.1038/s41438-018-0040-3
Sun, X., Bucher, J., Ji, Y., van Dijk, A. D. J., Immink, R. G. H., Bonnema, G. (2018). Effect of ambient temperature fluctuation on the timing of the transition to the generative stage in cauliflower. Environ. Exp. Bot. 155, 742–750. doi: 10.1016/j.envexpbot.2018.06.013
Swarts, K., Li, H., Navarro, J. A. R., An, D., Romay, M. C., Hearne, S., et al. (2014). Novel methods to optimize genotypic imputation for low-coverage, next-generation sequence data in crop plants. Plant Genome 7, 0. doi: 10.3835/plantgenome2014.05.0023
Tortosa, M., Cartea, M. E., Rodríguez, V. M., Velasco, P. (2018). Unraveling the metabolic response of Brassica oleracea exposed to Xanthomonas campestris pv. J. Sci. Food Agric. 98, 3675–3683. doi: 10.1002/jsfa.8876
Tyagi, S., Sri, T., Singh, A., Mayee, P., Shivaraj, S., Sharma, P., et al. (2019). Suppressor of overexpression of constans1 influences flowering time, lateral branching, oil quality, and seed yield in Brassica juncea cv. Funct. Integr. Genomics 19, 43–60. doi: 10.1007/s10142-018-0626-8
Uptmoor, R., Schrag, T., Stützel, H., Esch, E. (2008). Crop model based QTL analysis across environments and QTL based estimation of time to floral induction and flowering in Brassica oleracea. Mol. Breed. 21, 205–216. doi: 10.1007/s11032-007-9121-y
Varaud, E., Brioudes, F., Szécsi, J., Leroux, J., Brown, S., Perrot-Rechenmann, C., et al. (2011). AUXIN RESPONSE FACTOR8 regulates Arabidopsis petal growth by interacting with the bHLH transcription factor BIGPETALp. Plant Cell 23, 973–983. doi: 10.1105/tpc.110.081653
Walley, P. G., Carder, J., Skipper, E., Mathas, E., Lynn, J., Pink, D., et al. (2012). A new broccoli × broccoli immortal mapping population and framework genetic map: tools for breeders and complex trait analysis. TAG. Theor. Appl. Genet. 124, 467–484. doi: 10.1007/s00122-011-1721-6
Wang, B., Zhou, X., Xu, F., Gao, J. (2010). Ectopic expression of a Chinese cabbage brargos gene in Arabidopsis increases organ size. Transgenic Res. 19, 461–472. doi: 10.1007/s11248-009-9324-6
Xu, X., Luo, W., Guo, J., Chen, H., Akram, W., Xie, D., et al. (2019). Fine mapping and candidate gene analysis of the yellow petal gene ckpc in Chinese kale (Brassica oleracea L. var. Alboglabra bailey) by whole-genome resequencing. Mol. Breed. 39, 96. doi: 10.1007/s11032-019-1011-6
Yousef, E. A. A., Müller, T., Börner, A., Schmid, K. J. (2018). Comparative analysis of genetic diversity and differentiation of cauliflower (Brassica oleracea var. Botrytis) accessions from two ex situ genebanks. PLoS One 13, e0192062. doi: 10.1371/journal.pone.0192062
Zhang, B., Liu, C., Wang, Y., Yao, X., Wang, F., Wu, J., et al. (2015). Disruption of a CAROTENOID CLEAVAGE DIOXYGENASE 4 gene converts flower colour from white to yellow in Brassica species. New Phytol. 206, 1513–1526. doi: 10.1111/nph.13335
Zhang, F., Wang, H., Kalve, S., Wolabu, T. W., Nakashima, J., Golz, J. F., et al. (2019). Control of leaf blade outgrowth and floral organ development by LEUNIG, ANGUSTIFOLIA 3 and WOX transcriptional regulators. New Phytol. 223, 2024–2038. doi: 10.1111/nph.15921
Zhang, Y., Huang, S., Wang, X., Liu, J., Guo, X., Mu, J., et al. (2018). Defective APETALA2 genes lead to sepal modification in Brassica crops. Front. Plant Sci. 9, 367. doi: 10.3389/fpls.2018.00367
Zheng, M., Hu, M., Yang, H., Tang, M., Zhang, L., Liu, H., et al. (2019). Three BnaIAA7 homologs are involved in auxin/brassinosteroid-mediated plant morphogenesis in rapeseed (brassica napus L.). Plant Cell Rep. 1–15. doi: 10.1007/s00299-019-02410-4
Keywords: Brassica olecarea var. italica, broccoli, BolTBDH, genotype-by-sequencing, QTL mapping, complex horticultural traits, BoFLC, “TO1000”
Citation: Stansell Z, Farnham M and Björkman T (2019) Complex Horticultural Quality Traits in Broccoli Are Illuminated by Evaluation of the Immortal BolTBDH Mapping Population. Front. Plant Sci. 10:1104. doi: 10.3389/fpls.2019.01104
Received: 28 June 2019; Accepted: 12 August 2019;
Published: 18 September 2019.
Edited by:
Ryo Fujimoto, Kobe University, JapanReviewed by:
Zhansheng Li, Institute of Vegetables and Flowers (CAAS), ChinaTakahiro Kawanabe, Tokai University, Japan
Copyright © 2019 Stansell, Farnham and Björkman. This is an open-access article distributed under the terms of the Creative Commons Attribution License (CC BY). The use, distribution or reproduction in other forums is permitted, provided the original author(s) and the copyright owner(s) are credited and that the original publication in this journal is cited, in accordance with accepted academic practice. No use, distribution or reproduction is permitted which does not comply with these terms.
*Correspondence: Zachary Stansell, WmpzMjlAY29ybmVsbC5lZHU=