 Guiliana M. Mustiga1
 Joe Morrissey1
 Joseph Conrad Stack1
 Ashley DuVal1
 Stefan Royaert1
 Johannes Jansen2
 Carolina Bizzotto3
 Cristiano Villela-Dias3
 Linkai Mei4
 Edgar B. Cahoon4Ed Seguine5Jean Philippe Marelli1
 Juan Carlos Motamayor1*
- 1Mars Chocolate, Miami, FL, United States
- 2University of Wageningen, Wageningen, Netherlands
- 3Plant Sciences, Mars Center for Cocoa Science, Itajuípe, Brazil
- 4Department of Biochemistry and Center for Plant Science Innovation, University of Nebraska-Lincoln, NE, United States
- 5Seguine Cacao/Guittard Chocolate Co, Arroyo Grande, CA, United States
The main ingredients of chocolate are usually cocoa powder, cocoa butter, and sugar. Both the powder and the butter are extracted from the beans of the cacao tree (Theobroma cacao L.). The cocoa butter represents the fat in the beans and possesses a unique fatty acid profile that results in chocolate’s characteristic texture and mouthfeel. Here, we used a linkage mapping population and phenotypic data of 3,292 samples from 420 progeny which led to the identification of 27 quantitative trait loci (QTLs) for fatty acid composition and six QTLs for fat content. Progeny showed extensive variation in fat levels and composition, with the level of palmitic acid negatively correlated to the sum of stearic acid, oleic acid, and linoleic acid. A major QTL explaining 24% of the relative level of palmitic acid was mapped to the distal end of chromosome 4, and those higher levels of palmitic acid were associated with the presence of a haplotype from the “TSH 1188” parent in the progeny. Within this region of chromosome 4 is the Thecc1EG017405 gene, an orthologue and isoform of the stearoyl-acyl carrier protein (ACP) desaturase (SAD) gene in plants, which is involved in fatty acid biosynthesis. Besides allelic differences, we also show that climate factors can change the fatty acid composition in the beans, including a significant positive correlation between higher temperatures and the higher level of palmitic acid. Moreover, we found a significant pollen donor effect from the variety “SIAL 70” which was associated with decreased palmitic acid levels.
Introduction
The cacao tree (Theobroma cacao L.) provides the essential raw materials for the manufacture of chocolate, with the unique fatty acid (FA) profile of cocoa beans contributing to the desirable textural characteristics of chocolate and other confections. The center of T. cacao diversity is Western Amazonia (Motamayor et al., 2002; Cornejo et al., 2018) although the trees are now cultivated globally throughout the humid tropics. Small melon-like pods produce 25 to 50 seeds (“beans”), which are traditionally fermented in banana leaves, boxes, baskets, or bags. The microbial fermentation promotes the development of flavor and color to the beans, which are then dried in the sun. Manufacturers clean and roast the dried beans, during which decortication of the fibrous testa occurs and is removed through winnowing to extract the cotyledon. Husked and winnowed beans are cracked into smaller pieces (“nibs”) that are ground to produce cocoa liquor, which is roughly 45% to 55% cocoa butter, i.e., fat. Hydraulic presses or millstones extract the cocoa butter from the liquor, with the remaining cake becoming cocoa powder.
The FA composition of cocoa butter is roughly equal parts palmitic (C16:0), stearic (C18:0), and oleic (C18:1) acids (Lipp and Anklam, 1998; Lipp et al., 2001; Naik and Kumar, 2014). The saturated FAs, palmitic acid, and stearic acid have relatively high melting points of 62°C and 68°C, respectively, whereas unsaturated oleic acid melts at only 16°C (Berg, et al., 2002). This unique combination allows chocolate to be solid at room temperature, yet melt when it touches the palate (McHenry and Fritz, 1987). A minor fraction of the FA composition of cocoa butter contains the saturated arachidic acid (C20:0), the unsaturated palmitoleic acid (C16:0) and traces of the other FAs. The unique FA profile of cocoa butter also makes it desirable to the cosmetics and pharmaceutical industries, and it is one of the most expensive edible fats in the world (McHenry and Fritz, 1987).
In plants, the FA biosynthetic pathways are relatively well characterized (Figure 1). Long-chain FAs are formed by sequential condensation, reduction, dehydration, and reduction of two-carbon units by β-ketoacyl-acyl carrier protein (ACP) synthase (KAS family) enzymes (Ohlrogge and Browse, 1995) with the ACP. Each KAS enzyme has different specificities. KASIII condenses acetyl-CoA with malonyl-ACP to form 4:0-ACP (Li-Beisson et al., 2013). KASI elongates 4:0-ACP to 16:0-ACP. KASII elongates 16:0-ACP to 18:0-ACP (Pidkowich et al., 2007). The stromal Δ9 stearoyl-ACP desaturase (SAD) SAD2 desaturates 18:0-ACP to form 18:1-ACP. FATA and FATB are ACP thioesterases that terminate FA chain extension, releasing the FAs from ACPs, so that palmitic acid, stearic acid, and oleic acid can be exported from the plastid (Koo et al., 2004) for lipid assembly in the endoplasmatic reticulum. Biosynthesis from stearic (C18:0) to arachidic FA (C20:0) is achieved through elongases coded by FA elongation gene (FAE) whereby very long-chain FAs (VLCFA), such as C18:0, are synthesized with the addition of carrier proteins (Barker et al., 2007). In the cytosol, acyl chain elongation of the monounsaturated C18:1 to the polyunsaturated C18:2 is facilitated through FA desaturase 2 enzyme (FAD2) (Dar et al., 2017).
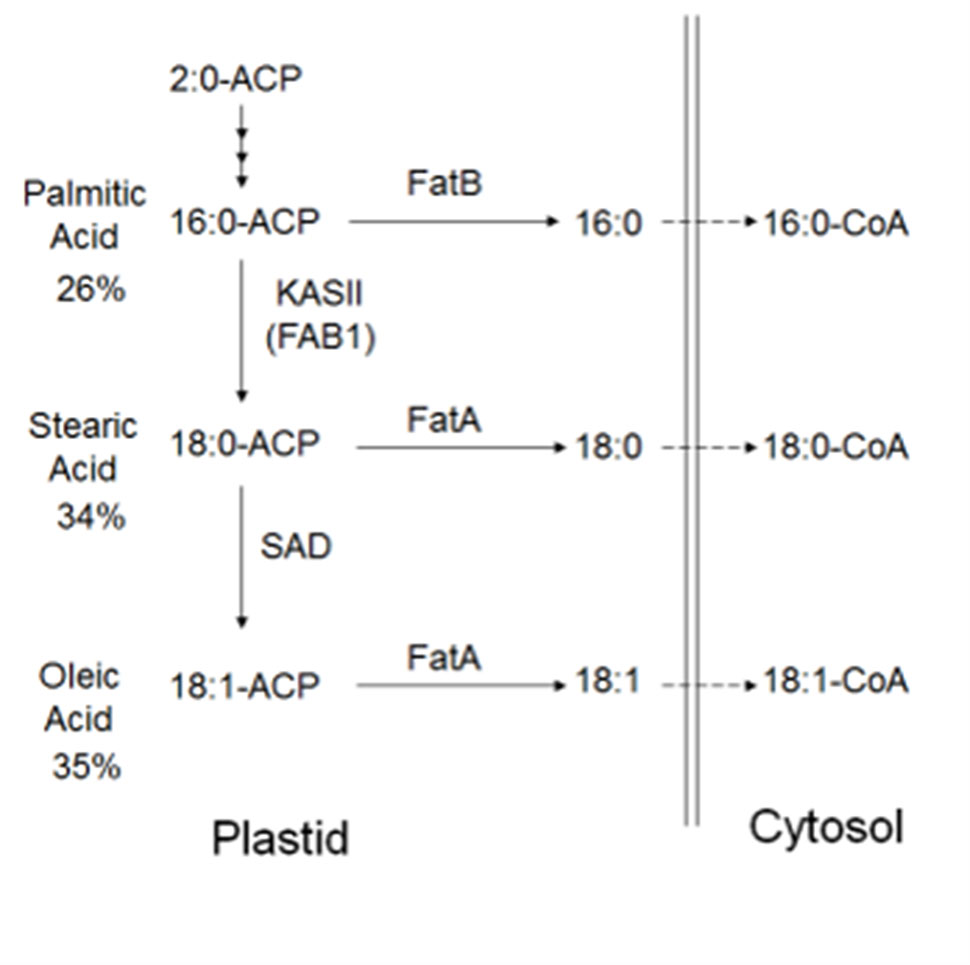
Figure 1 Predicted FA biosynthesis pathway in cacao with candidate genes. Cocoa bean fat is comprised primarily of palmitic acid, stearic acid, and oleic acid. FAs are synthesized in plastids, prior to transport to the cytosol, then the endoplasmic reticulum for modification and lipid assembly. Candidate genes in other plant species have been identified, and fatty acid-related genes exist (Argout et al., 2011)
The effects of environmental conditions on FA composition have been consistently shown in many studies on various plant species (Yeilaghi et al., 2012; Bellaloui et al., 2015; Hemingway et al., 2015). Environmental conditions have also been shown to impact the ratio of saturated (palmitic and stearic acids) to unsaturated (oleic acid) FAs in cocoa beans, with the proportion of oleic and linoleic acids increasing with lower temperatures (Lehrian et al., 1980; McHenry and Fritz, 1987). South American origins, in particular Brazil, are associated with higher oleic, “soft” cocoa butter (Chaiseri and Dimick, 1989; Lipp and Anklam, 1998). “Soft” cocoa butter from cooler climates have a lower melting point (Lehrian et al., 1980), complicating chocolate manufacture, and are associated with lower prices for growers (McHenry and Fritz, 1987).
Variation in cocoa bean FA composition and total fat levels has been observed between genotypes (Liendo et al., 1997; Pires et al., 1998; Vázquez-Ovando et al., 2015). The genetics of FA biosynthesis have been identified in Arabidopsis and are relatively conserved across plants (Lightner et al., 1994; Kachroo et al., 2007). The Belizian Criollo “B97-61/B2” genome had 84 orthologues to the 71 FA-associated Arabidopsis genes (Argout et al., 2011). The only published quantitative trait loci (QTL) mapping of total bean fat levels reported extreme transgressive segregation: Trinitario (“ICS 1”) and Contamana (“Scavina 6”) parents have similar fat levels (52% and 54%, respectively), but their F2 progeny averaged only 46% (Araújo et al., 2009). Although QTLs for FA composition and cocoa butter hardness were identified in the said population, both LOD scores were low (5 and 3, respectively), with large QTL regions occupying approximately one third of the linkage group.
Here, we report the use of a segregating mapping population from a cross between two heterozygous parents to identify QTLs explaining the variability of palmitic, stearic, and arachidic acid levels in cocoa beans. The female parent, “TSH 1188,” is a hybrid variety developed in Trinidad, and contains genetic material from “POUND 18,” “TSH 735,” and “TSA 641,” with this last one being the result of a cross between “SCA 6” and “IMC 67” (Turnbull and Hadley, 2019). The male parent, “CCN 51,” is likely the most commonly cultivated commercial hybrid clone in Latin America and is derived from crosses involving “IMC 67” and “ICS 95” (Boza et al., 2014). Our study shows a strong genetic effect on the FAs of cocoa beans, as indicated by high-log10p scores found. We also report a significant role for environmental factors, with emphasis on temperature fluctuation and pollen donor effects in FA composition.
Materials and Methods
Mapping Population
The creation of the MP01 mapping population, including the genotyping procedure and its genetic map, was described in Motamayor et al. (2013), Barreto et al. (2015), Royaert et al. (2016), and Stack et al. (2015). Briefly, this study involves 420 of the total 459 offspring from a cross between “TSH 1188” and “CCN 51.” The MP01 mapping population was planted at Mars Center for Cocoa Science in Barro Preto, Bahia, Brazil (14°42′45 N, 39°22′13 E) in the year 2000 in a 3 × 3 m grid in a hydromorphic and typical tropudalf (Itabuna modal) mixed soil type. Shade was provided using the traditional “cabruca” system, where the trees are grown amongst the Atlantic Forest’s native canopies. DNA was extracted from leaves using the protocol described by Motamayor et al. (2013) and ran on the cacao Illumina Infinium Cacao6kSNP array (Livingstone et al., 2015). JoinMap®4.1 (Van Ooijen, 2006) was used to create the genetic map, integrated genetic maps were obtained using the Maximum Likelihood (ML) mapping algorithm (Van Ooijen, 2011), map distances were calculated using the Haldane mapping function and the resulting maps were drawn using MapChart 2.1 (Voorrips, 2002).
Bean Sampling
Two to four biological replicates were sampled for each genotype, based on mature pod availability across 12 harvest months with one to three harvest days per month from August 2010 to November 2011 (Figure 2). The parents, “TSH 1188” and “CCN 51” had one extra sampling date in July 2010. Biological replicates for individual trees came from multiple pods harvested from the same tree. Each sample contained about 13 beans (200g of wet bean) which were micro-fermented as described in Seguine et al. (2014). A total of 3,292 samples were analyzed for FA composition comprising of 420 total genotypes in the MP01 population.
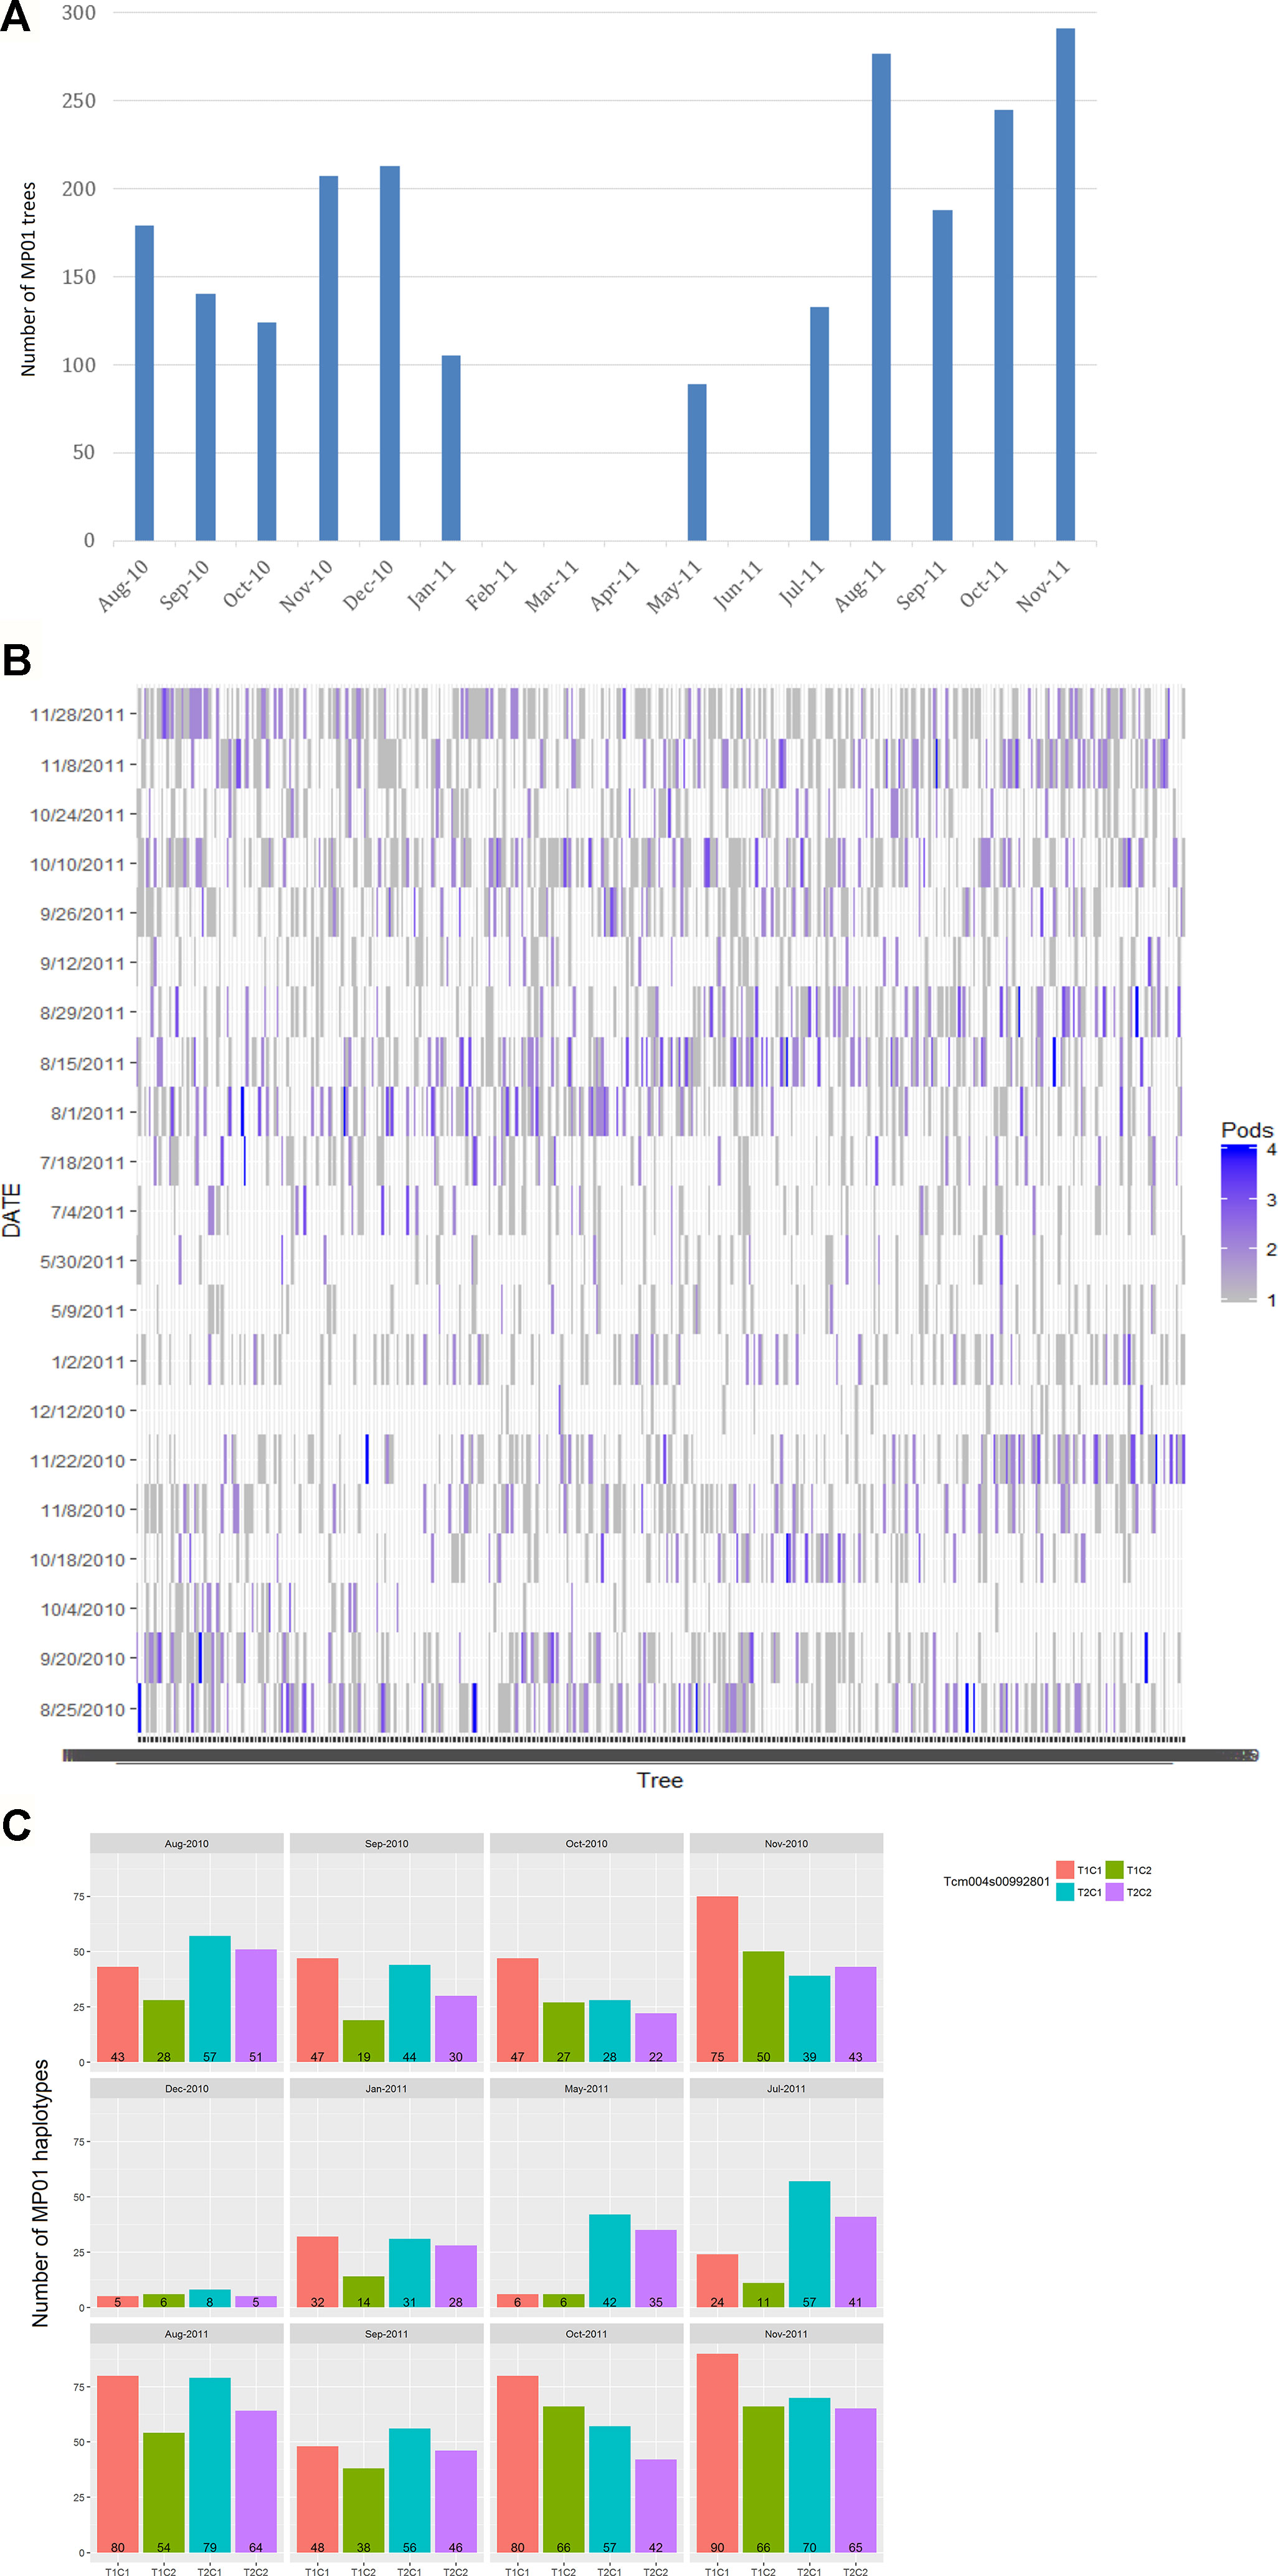
Figure 2 Harvest of MP01 progenies for FA analysis. (A) Distribution of number of MP01 progenies (y-axis) by month of harvest (x-axis). (B) Number of replicates (pods) per genotype (x-axis) harvested per harvest date (y-axis). (C) Skew of parental haplotype combinations (T1C1, T1C2, T2C1, and T2C2) based on harvest date, based on Tcm004s00992801 marker.
Liquor Processing
Pods from the MP01 population (“TSH 1188” × “CCN 51”) were harvested based on inspection of the pods and classified as ripe by experienced cacao harvesters. The harvested pods were free of any evidence of disease, particularly witches’ broom disease (WBD) and black pod (BP), two prevalent diseases in the Bahia region. Each pod was harvested separately, fermented and dried as described in the protocol of the micro-fermentation patent (Seguine et al., 2014). Following the fermentation and drying, the beans were stored for at least six weeks to stabilize the flavor of the beans. Storage was at ambient conditions in a screened area to avoid infestation.
After aging, the beans were roasted using a FD153 convection drying oven with multiple samples roasted on a split tray using separators. Beans were roasted one layer deep. Approximately 80 to 100 samples were roasted at a time (single pods, approximately 30–50 g of net dry beans per pod). Roasting was conducted at 120°C for 25 min timed from the time the oven temperature recovered to 118°C (range of recovery time, 5–7.5 min). Following the roasting, the entire tray was put out in the lab on risers that held it approximately 3 inches on the top of a stainless steel lab table with air flow from the top. Beans were cooled to room temperature for approximately 30 min, then placed individually into small polyethylene bags, and held not more than 24 h before subsequent processing.
For processing, the beans were placed in a small plastic bag and crushed with a rolling pin to separate the shells from the beans and to break them down into smaller pieces. Individual samples were winnowed with a CAPCO Engineering Cocoa Winnower and the winnowed nibs were inspected for shells and residual shells were removed.
Milling was then conducted in a RETSCH-RM200 motorized mortar and pestle equipped with porcelain mortar and pestle. The mill was run for a total of 30 min with scraping at the 5- to 10-minute mark to ensure complete grinding of the entire nibs. Following the grinding, particle size was measured with a micrometer to obtain fineness within the range of 18 to 25 microns. Mass was transferred to high-density polypropylene centrifuge tubes and capped. Liquor samples were put into tubes, varying between 15 and 30 g. Tubes were stored for one week at ambient conditions and then moved to a −80ºC freezer until analysis.
A total of 3,292 cocoa liquor samples were analyzed for FA composition comprising of 420 total genotypes in the MP01 population. The preparation of liquor samples followed all of the defined parameters recommended by the cocoa ECA/CAOBISCO/FCC quality guide (CABISCO/ECA/FCC, 2015) which defines in a general sense all of the protocols used.
Bean Fat Analysis
Approximately 25 mg of cocoa liquor samples were weighed in 13 x 100 mm screw cap glass tubes. Furthermore, 2.5 ml of 2.5% (v/v) sulfuric acid in methanol and 60 mg of the internal standard triheptadecanoin (17:0-triacylglycerol; NuChek Prep) from a 10 mg/ml stock solution dissolved in toluene were added. Samples were capped under nitrogen and mixed thoroughly prior to heating at 95°C for 1 h. Following cooling, 3 ml of heptane and 3 ml of deionized water were added to each tube. These were mixed thoroughly and centrifuged at 1000g for 2 min in a Q222 RM table top centrifuge (Quimis, Diadema, Sao Paulo, Brazil). The recovered heptane layer containing FA methyl esters was transferred to autosampler vials and analyzed by gas chromatography using an Agilent 7890 gas chromatograph (GC) with flame ionization detection (FID). Sample components were resolved using a HP-INNOWax column (30 m length × 0.25 mm inner diameter × 0.25 µm film thickness; Agilent) with oven, detector, and injector temperatures as described in Cahoon et al. (2006). Briefly, the GC inlet and FID temperatures were set at 250°C and 260°C, respectively. The oven was operated at a temperature program of 185°C (1 min hold) to 230°C (3 min hold) over a linear gradient of 7°C/min. The carrier gas was H2 at an inlet flow rate of 30 ml/min. FA compositions of samples were obtained from these analyses. Fat content was obtained by quantifying FA methyl esters in samples by measurement of FID response relative to that of methyl heptadecanoate from the internal standard (Christie, 1982; Badings and De Jong, 1983; Christie, 1989).
Identification of QTLs
QTL mapping analysis for the FAs was performed on the MP01 linkage map with Genstat v.18 (VSN International, 2015). Each trait was checked for normality and mapped with the interval mapping (IM) procedure. After the initial IM, the markers with highest P values obtained from Wald tests in the -log10 scale (-log10p) were used as cofactors in the subsequent QTL run as part of the composite IM (CIM) procedure. A second analysis with the REML algorithm for linear mixed models was used to separate the additive parental effects and dominance effect (interaction). For each marker, the associated probability (p value) from the Wald test statistic was used to test significance (Lynch and Walsh, 1998). The threshold for significance used was the corrected-Bonferroni option in Genstat (Li and Ji, 2005) with 0.05 significance level. For these analyses the threshold for maternal, paternal and interaction effects are 3.688, 3.701, and 3.826, respectively.
QTL analyses were performed on two instances/partitions of the phenotypic data: (i) best linear unbiased predictors (BLUPs) obtained from pooled data with the 12 sampling dates from August 2010 to November 2011, and (ii) BLUPs for the effects of genotypes by harvest season. The two harvest seasons analyzed spanned the periods August 2010 to January 2011 for the first harvest season, and May 2011 to November 2011 for the second harvest season. Both harvest seasons have 6 months of pod collection, with data for 361 genotypes on the first year, 404 genotypes in the second year, and 420 genotypes for the combined periods. Weather data from the MCCS research station were used to complement the data for both harvest seasons. These data include daily average, minimum and maximum temperatures in °Celsius and rainfall in millimeters. Summary statistics for the climate data are presented in Supplementary Table 1. The average FA and fat content were calculated by date of harvest, generating twelve data points. The FA means were then compared to the corresponding average temperatures of the months prior, where one lag (lag1) indicates comparison between the FA means of trees harvested in a given month to the average temperatures 1 month prior.
Haplotype Phasing and Effect
The parental haplotypes were identified for each of the MP01 progeny for both the peak markers and the markers at the regions surrounding the QTLs associated with FAs, for the two partitions of the data previously described. The genotypes of the progeny were phased with iXora (Utro et al., 2013) and with JoinMap (Van Ooijen, 2011). Favorable alleles/haplotypes were identified by taking the average percentage of FAs of the individuals containing the parental haplotype combinations separately for each FA peak marker. To test the significance of the haplotype–phenotype associations, a regression was applied to the peak markers, and the Tukey post hoc test for multiple comparisons was used to identify the difference in the effect of the parental haplotype combinations (T1C1, T1C2, T2C1, and T2C2), where “T” and “C” represent the parental haplotypes from “TSH 1188” and “CCN 51,” respectively.
Phylogenetic Analysis of Palmitic Acid Allele
A diversity panel consisting of 200 accessions were re-sequenced at high coverage (Cornejo et al., 2018) and filtered to match markers in common with the 6K SNP chip used for MP01. The filtered genotypes were then phased with the program Beagle v4 (Browning and Browning, 2007), with 10 burn-in iterations, 5 iterations for burn-in phase, sliding window of 1000 with 500 overlaps, and 16 threads for haplotype sampling. Twenty-two markers were used within the QTL region encompassing one-log10p away from the peak marker for palmitic acid in chromosome 4. The distance matrix for phylogeny estimation was created with the Maximum Composite Likelihood algorithm in MEGA v.7.0 with 1000 bootstraps (Kumar et al., 2016) for the 400 haplotypes. The resulting neighbor-joining (NJ) was collapsed to reflect support values of 70% or higher from the bootstraps.
Structure Analysis of 200 Genomes Diversity Panel
The 200 accessions were assigned to the 10 genetic cacao groups (Motamayor et al., 2008; Cornejo et al., 2018) by proportion of membership, using a supervised admixture analysis with Admixture software (Alexander et al., 2009). The reference set for the cacao groups consisted of genotypes with 85% or more membership to a specific genetic group.
Statistical Analysis
Summary statistics of the FA composition for the parents, “TSH 1188” and “CCN 51” with p value from Student’s T distribution testing the null hypothesis of equal means. The significance of the genotypic variation was determined with a multivariate analysis of variance (MANOVA) for tests of main effects, including genotype, pollination type, and harvest season. Univariate ANOVAs were generated from the multivariate linear model, corrected for simultaneous inference with the Holm p value adjustment.
In addition, a random effects model was used to estimate the variance components of the tested traits:
where yijk is the individual FA observation of the kth sample (k = 1,…,9) of the ith F1 genotype in the jth harvest season, µ is the grand mean, εijk is the residual variance, Gi is the random effect of the ith genotype (i = 1,…, 413) , αj is the random effect of jth harvest season (j = 1,2), and (Gα)ij is the genotype-by-harvest season interaction for the ith genotype in the jth year. The estimates of the variance components were obtained with the above model and ran with the program ASREML-R (Butler et al., 2009) with the restricted maximum likelihood method. The standard errors for the ratios of the variance components were obtained by approximation with the Delta method and the BLUPs were used in the QTL analyses.
Broad-sense heritability (H2) and the total phenotypic variance () are expressed as:
The proportions of each variance component estimate are expressed as and relative to the total phenotypic variance .
Results
Variation in Cocoa Butter Fat Levels and FA Composition
Extensive variation was found in the progeny of the MP01 population: The effect of genotype was highly significant in the MANOVA (p < 0.0001) with Wilk’s λ = 0.01 and in the univariate case and was found to be significant in all the FAs and percentage of fat content (Table 1). The parents, “TSH 1188” and “CCN 51,” show nearly identical FA composition in our data set, but with “TSH 1188” having slightly higher average fat content levels (Supplementary Table 2).
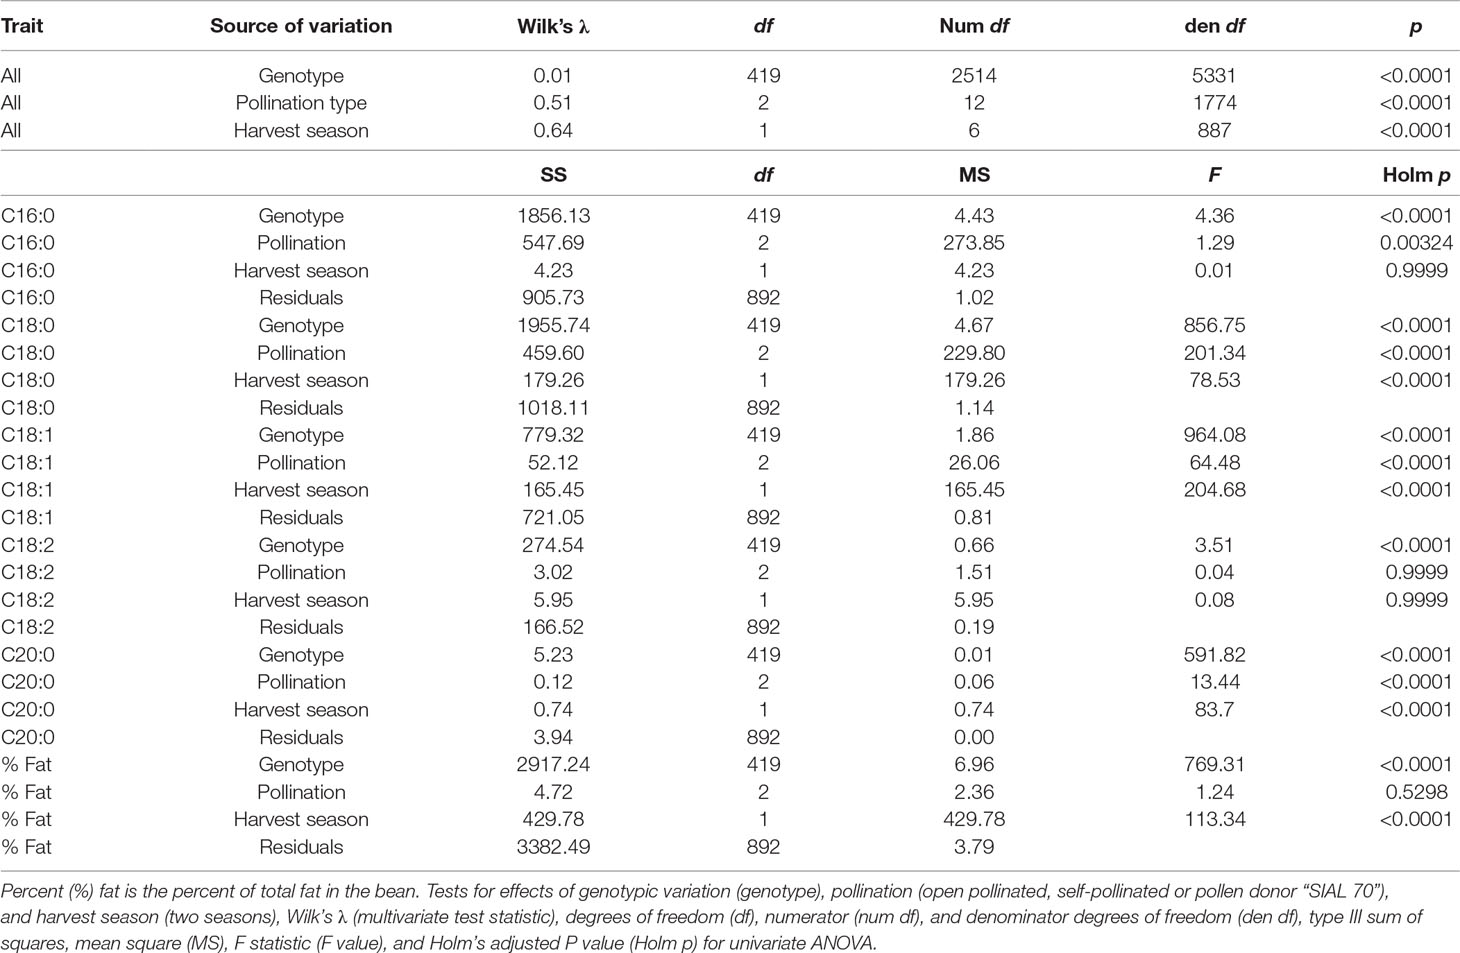
Table 1 Multivariate analysis of variance (MANOVA) and univariate ANOVA for FA values (C16:0 Palmitic, C18:0 Stearic, C18:1 Oleic, C18:2 Linoleic, C20:0 Arachidic) represent proportion of total FA for the specific FAs.
In our study, total fat content in the progeny ranged from 32.2% to 70.7% and from 50.2% to 62.4% when averaged per genotype (Table 2 and Figure 3). The mean fat content for the mapping population was 56%, falling between the means of the two parents, “TSH 1188” and “CCN 51” (54.6% and 57.3%). The level of palmitic, stearic, and oleic acids represents a total of 94.9% of FAs (Table 2). While the observed levels for the two major saturated FAs, palmitic and stearic acids, were 25.6% and 25.1%, respectively, for the monounsaturated oleic acid, the lowest level observed was 32.6%. There was also a much smaller range of variation for oleic acid, with only 5.2 percentage points separating the maximum and minimum genotypes. Ranges for palmitic and stearic acid were 8.2% and 11.3%, respectively.
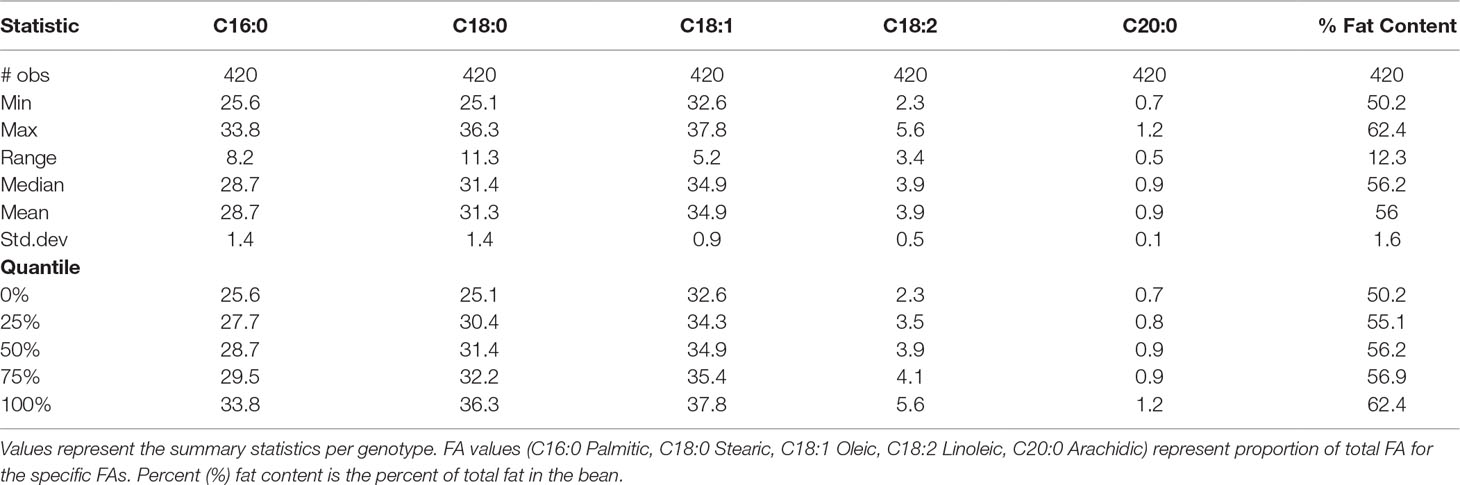
Table 2 Variation in MP01 beans.
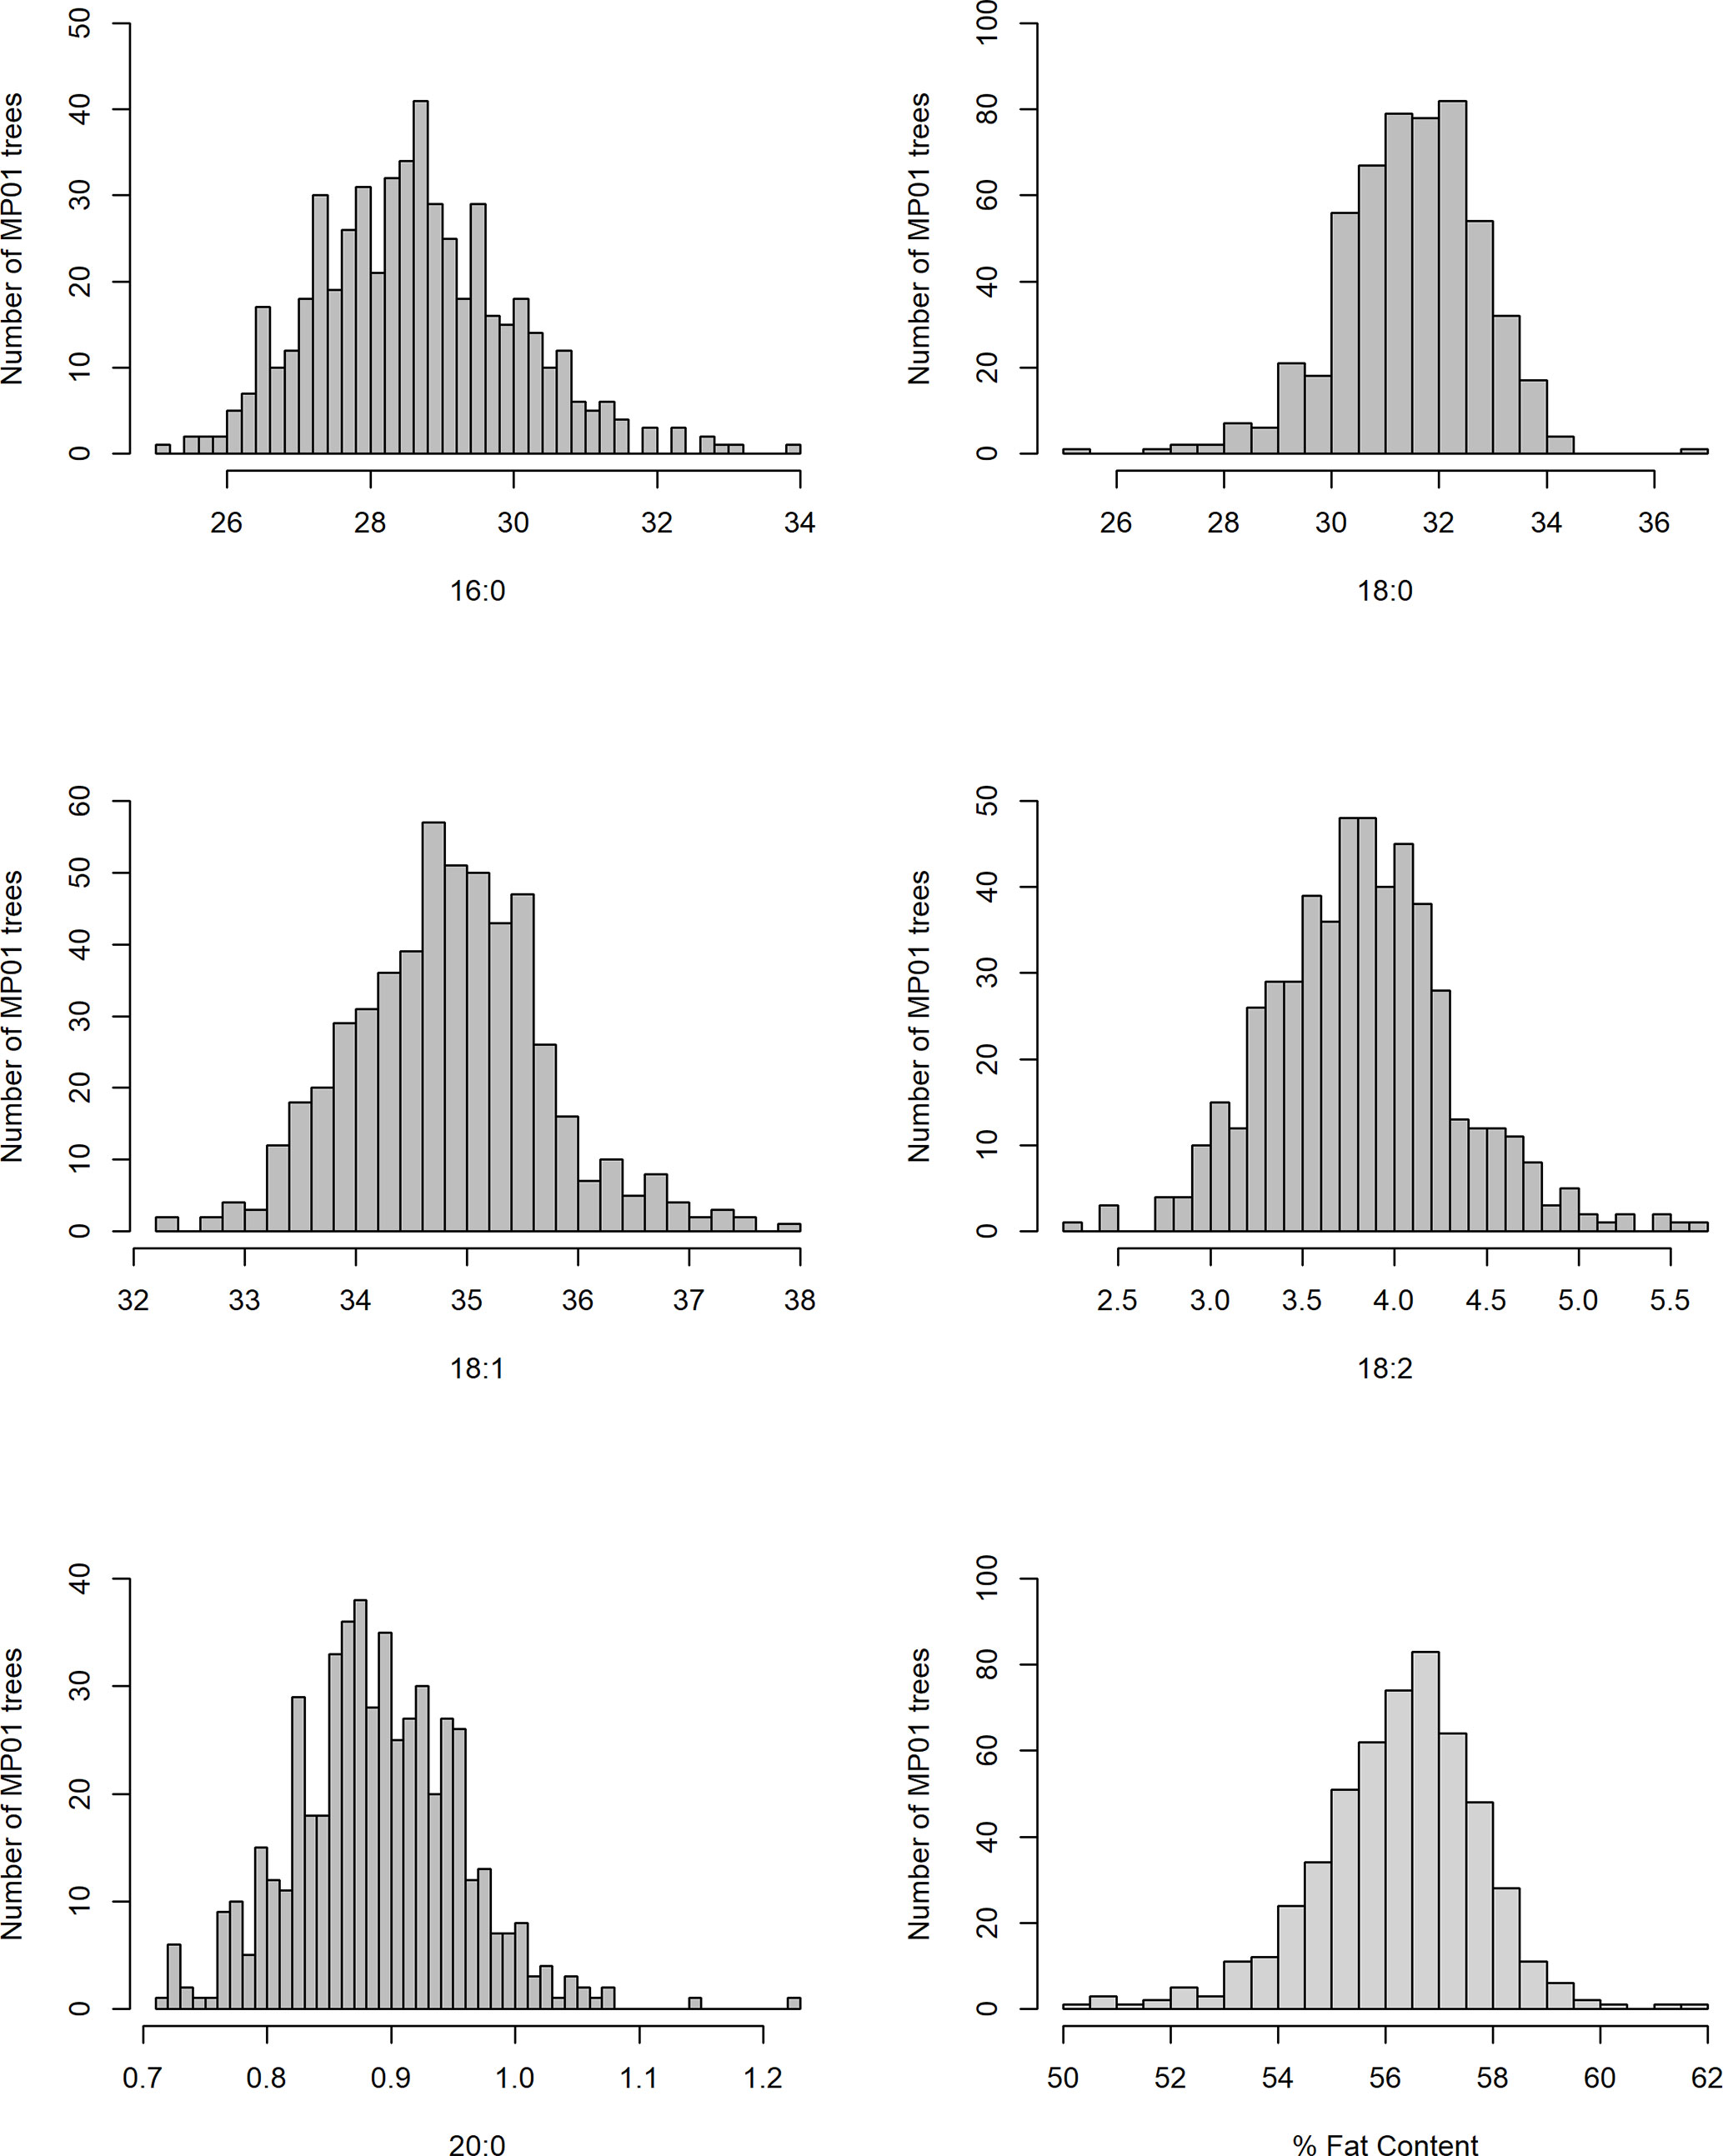
Figure 3 Distribution of FA content for MP01 progenies for both periods.
Correlation Between Traits
The main significant correlations were negative correlations between palmitic acid and stearic acid (−0.74), and between palmitic acid and oleic acid (−0.37) (Table 3). A negative correlation between palmitic acid and arachidic acid (−0.37) was also identified, but of less biological interest, given that arachidic acid represents less than 1% of FAs in cocoa beans (Table 2). Fat content (as a percentage of the bean) was positively correlated with stearic acid levels (0.25) and negatively correlated with palmitic (−0.12) and oleic acid levels (−0.11). Directionality of the FA traits and total fat content are displayed in the PCA plot (Supplementary Figure 1), capturing 57.9% of the total variation in the data.
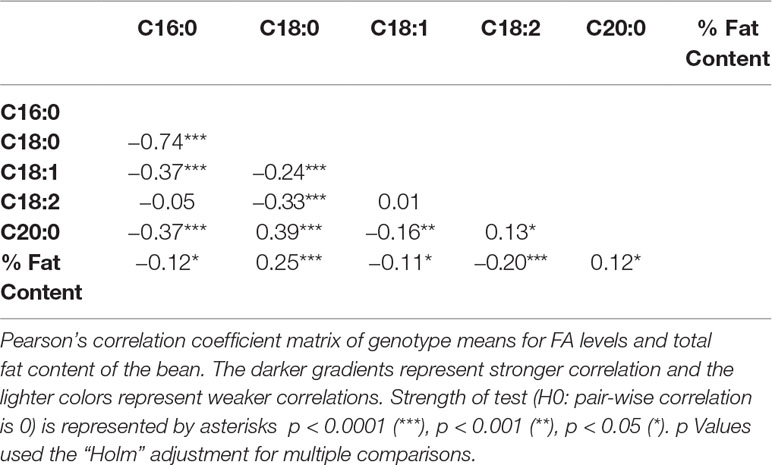
Table 3 Correlations between fat traits (least squares means).
A significant negative correlation was measured between the level of palmitic acid and the downstream FAs stearic (−0.74), oleic (−0.37), and linoleic acids (−0.05) (Table 3). In Figure 4, a graphical presentation of the negative correlation between the levels of palmitic acid and the sum of the downstream FAs is shown. This supports the predicted cacao FA biosynthesis pathway, where palmitic acid is consumed by a KASII/FAB1 enzyme to create stearic acid and then can be converted into oleic acid by SAD/FAB2 (Figure 1).
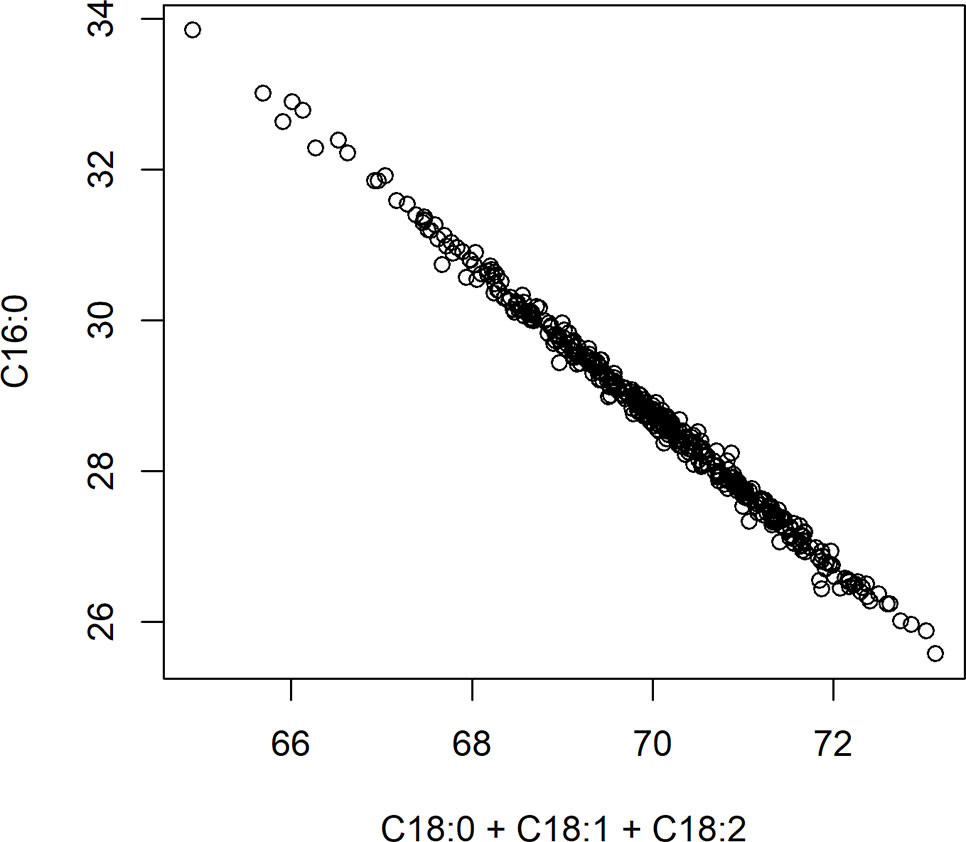
Figure 4 Negative correlation between palmitic acid (C16:0) and the sum of stearic acid (C18:0), oleic acid (C18:1), and linoleic acid (C18:2). Axes represent percent of either palmitic acid relative to total fat, or the sum of stearic, oleic, and linoleic acids relative to total fat.
Sampling of MP01 and Identification of QTLs
The collection of samples depended on pod availability, which varied between sampling time and genotypes. For this reason, the pooled data from all months were used for the QTL analyses, and the 12 months were partitioned into two harvest seasons (Figure 2) to determine a variance component for environment in terms of seasonal effect.
QTLs with a -log10p score greater than the threshold of 3.688 were identified. The IM and CIM mapping procedures were similar in outcome for the position of the peak markers in the traits evaluated, thus we report the IM results from the haplotype phase from the QTL regions encompassing one -log10p away from the peak markers (Table 4, Figure 5).
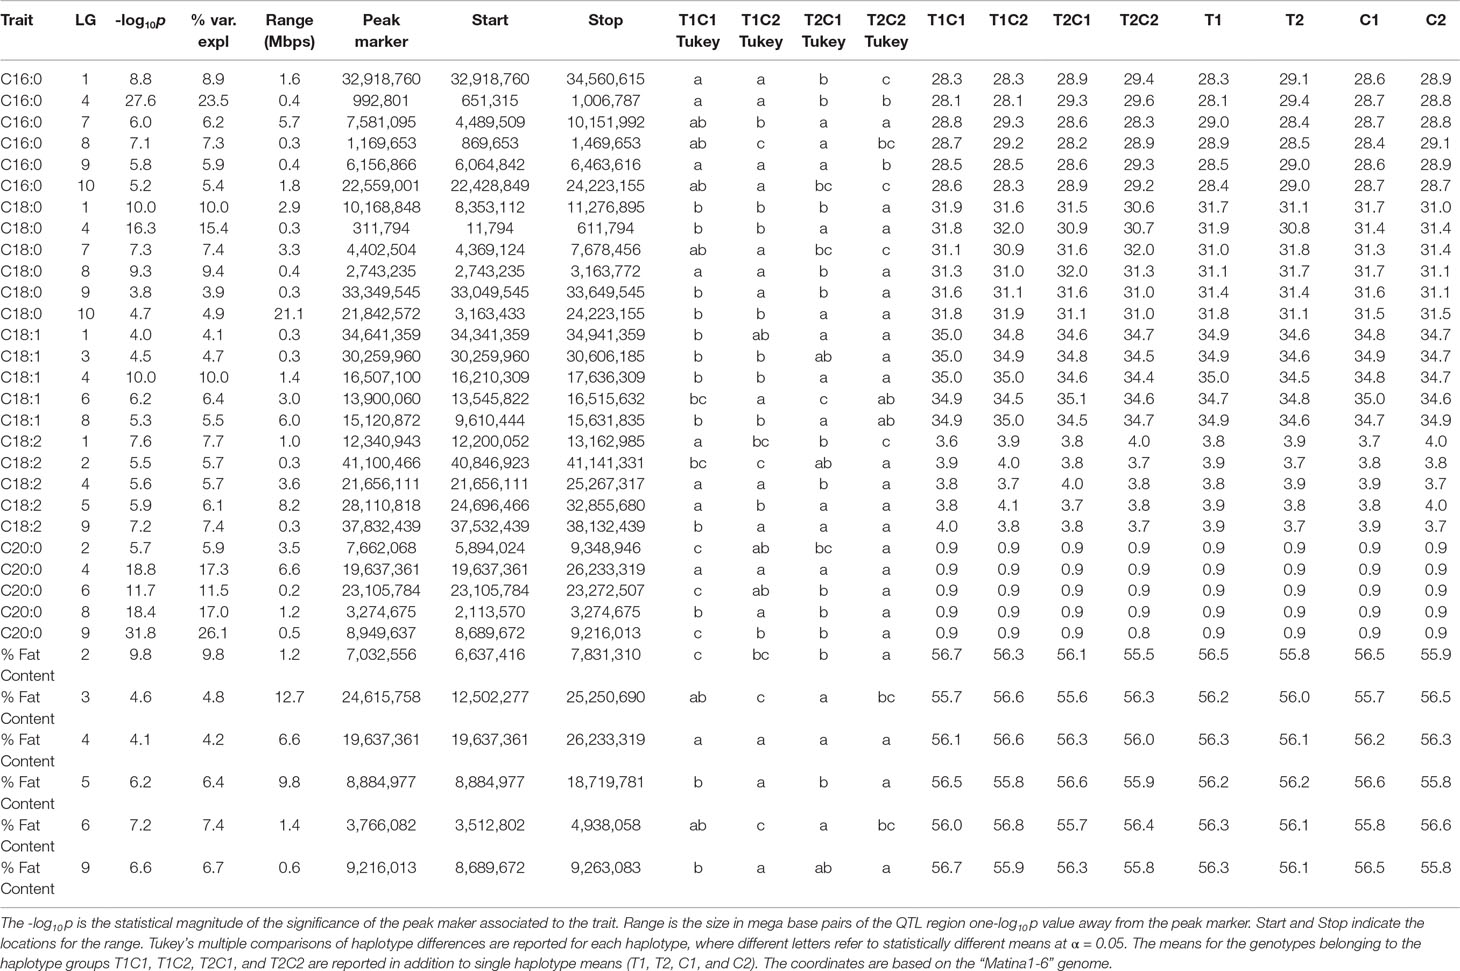
Table 4 QTL results from the IM procedure for combined FA BLUP values for the combined harvest seasons.
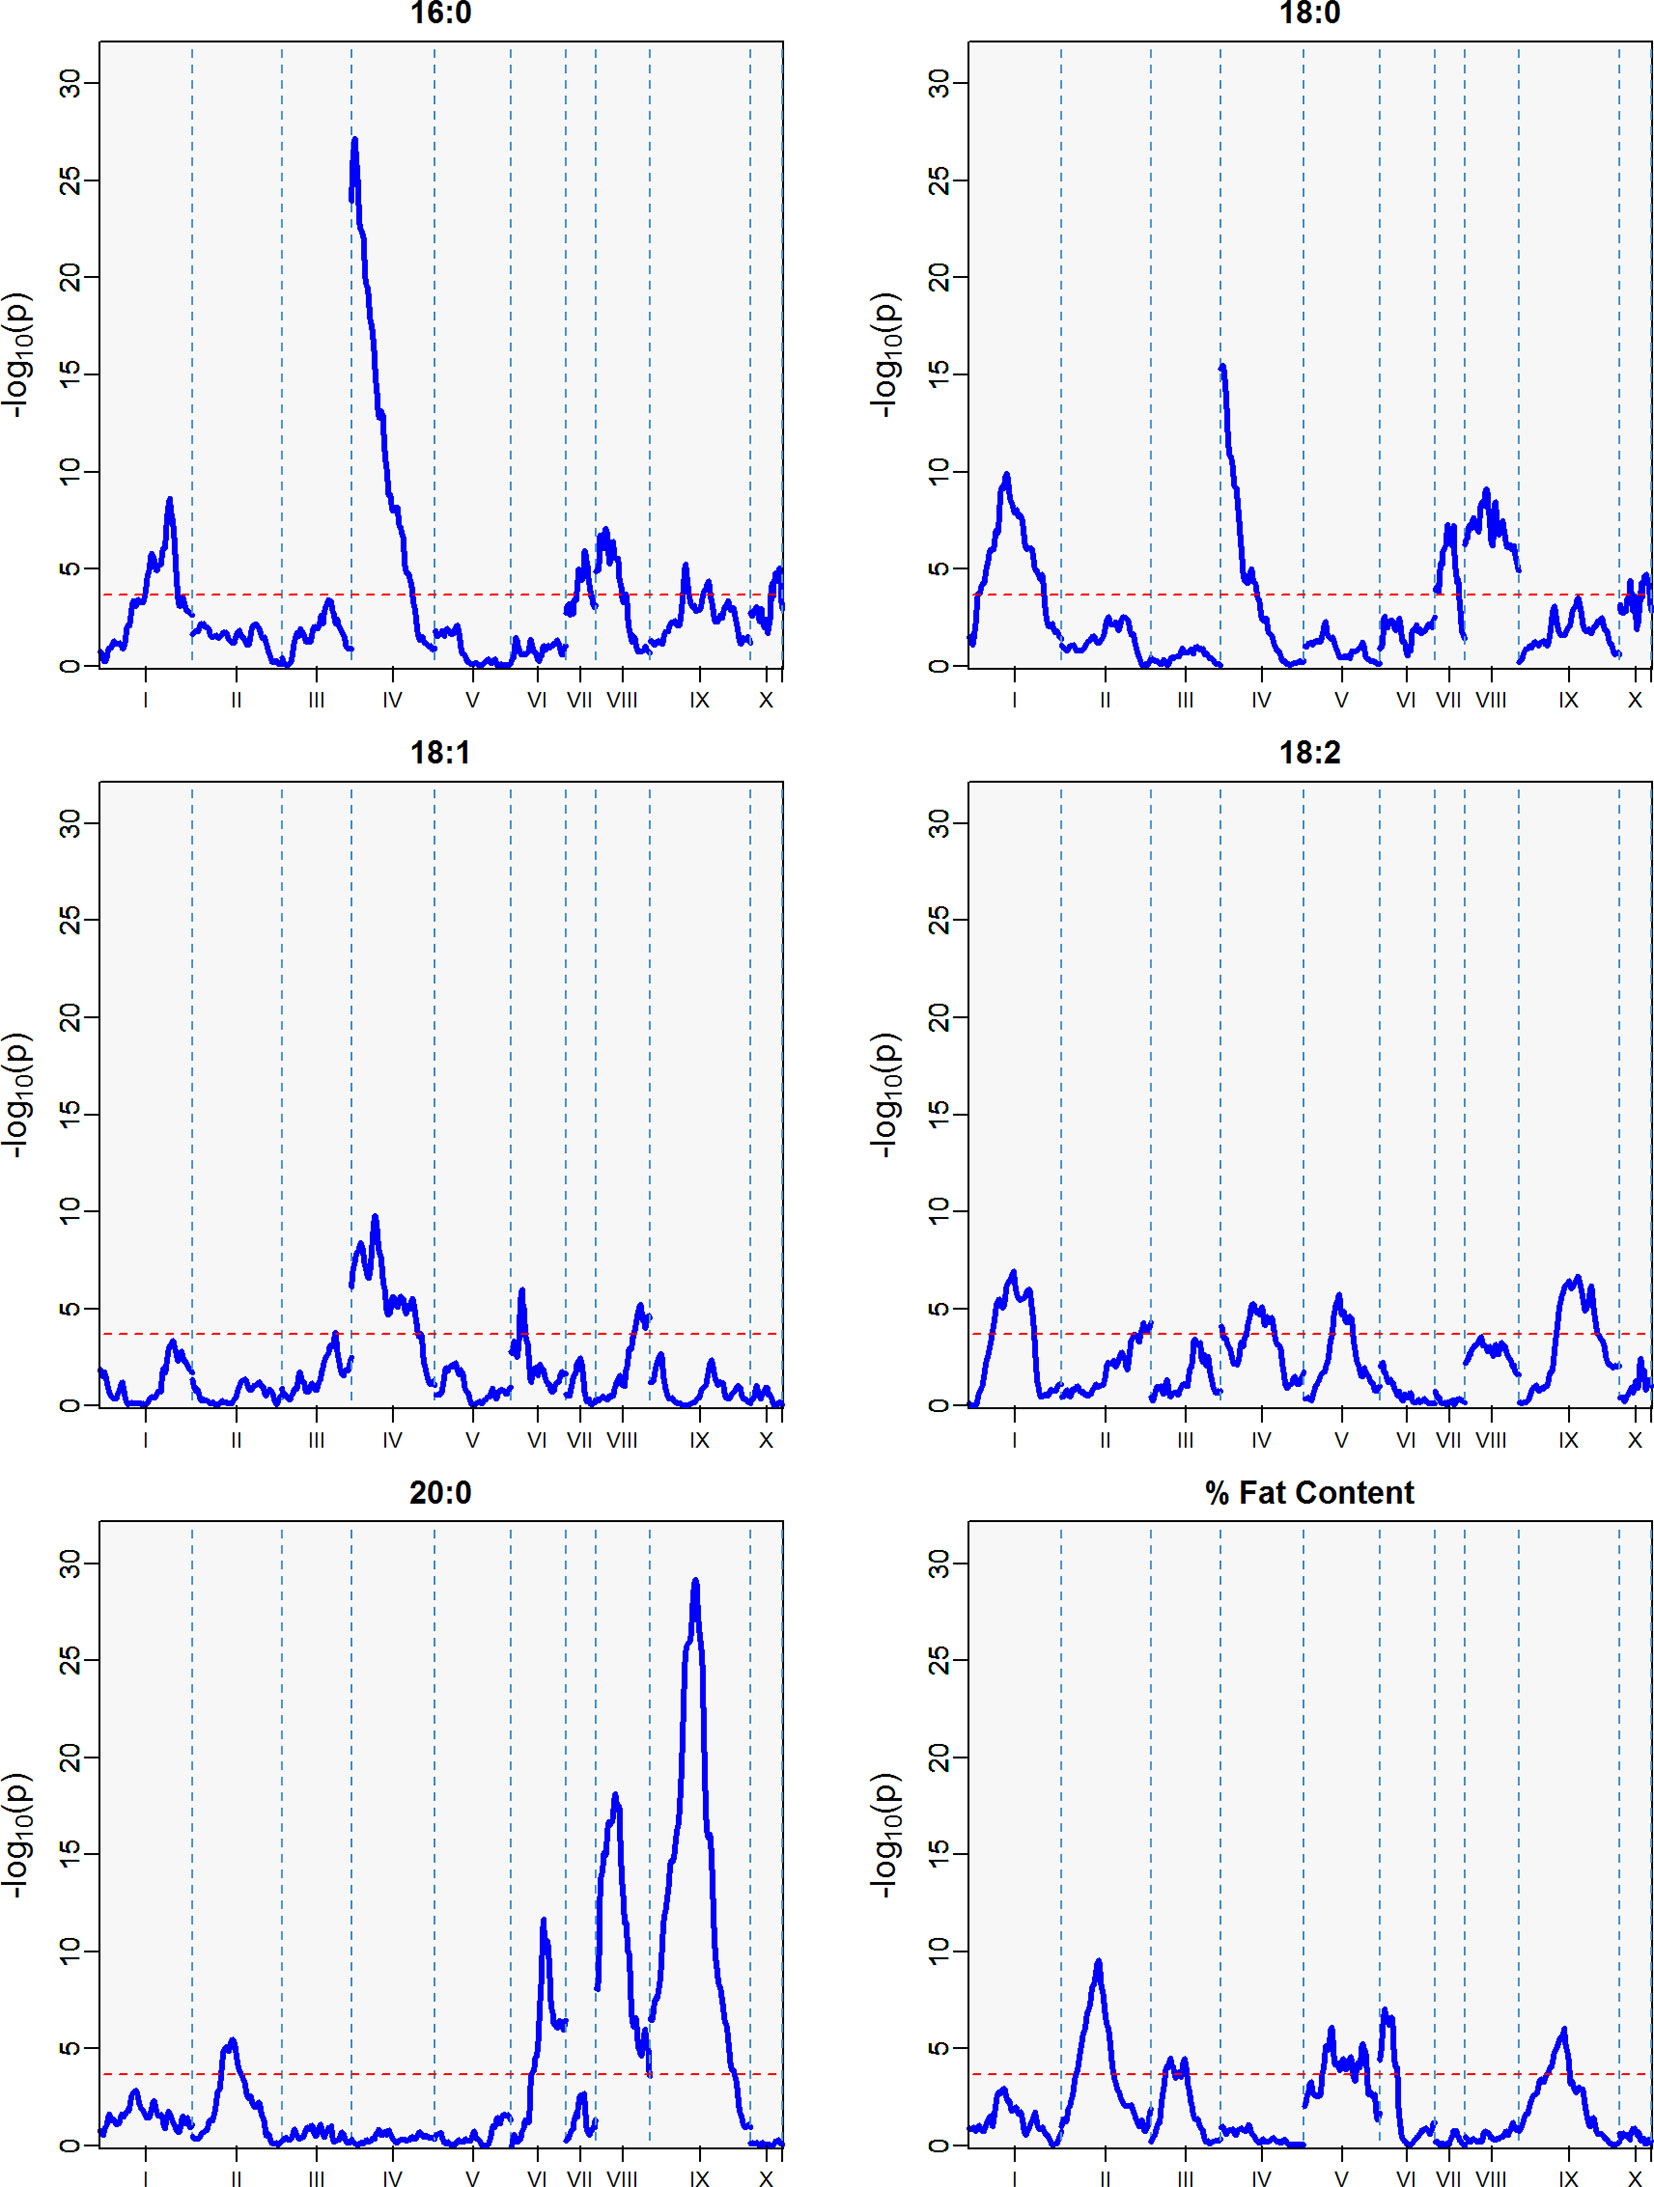
Figure 5 QTLs from best linear unbiased predictors (BLUPs) calculated using the 12 sampling dates spanning August 2010 to November 2011. The -log10p is the statistical magnitude of the significance of the peak maker associated to the trait. The coordinates are based on the “Matina1-6” genome V1.1. The threshold of significance (red dash) is a multiple comparison adjustment at 3.688.
The strength of the combined data set allowed us to identify two QTLs with -log10p > 27 (Table 4). A QTL in LG 4 with a -log10p of 27.6 explained 23.5% of variation in palmitic acid (C16:0), and a QTL on LG 9 with a -log10p of 31.8 explained 26.1% of arachidic acid (C20:0) variation. Because they explain over 15% of the variation for the trait, we refer to these QTLs as “major.” Minor QTLs were identified for stearic acid (C18:0) (LGs 1, 4, 7, 8, 9, and 10), oleic acid (C18:1) (LGs 1,3,4,6 and 8), linoleic acid (C18:2) (LGs 1, 2, 4, 5, and 9), arachidic acid (C20:0) (LGs 1, 2, 4, 6, and 8), and % fat content (LGs 2, 3, 4, 5, 6, and 9).
The major QTL for palmitic acid (-log10p > 15) was located in the gene model region, Tc04_g005590, corresponding to the SAD5 gene and minor QTLs (-log10p ∼7) were located in the gene model regions Tc04_g01710, Tc04_g01720, and Tc04_g01740, corresponding to SAD1, SAD2, and SAD3 genes, respectively (Zhang et al., 2015). Significant markers for stearic acid were found only in the Tc04_g005590 region (-log10p ∼9), which encodes for chloroplast transient peptides (Kachroo et al., 2004; Zhang et al., 2015). Oleic and linoleic acids had minor QTLs in all previously mentioned gene models, and a major QTL in LG 4 for arachidic acid which was found in the regions corresponding to gene models Tc04_g01710, Tc04_g01720, and Tc04_g01740. The gene model regions refer to the Criollo v1 assembly (Argout et al., 2011) and the Criollo v2 assembly annotation and positions (Argout et al., 2017) are also listed in Supplementary Table 3. In addition, the corresponding mapping of SAD gene models in the identified FA QTLs near the FAB2/SAD candidate genes are presented in Supplementary Table 4.
Identification of QTLs by Harvest Season
Three minor QTLs were identified for the first harvest season, from August 2010 to January 2011 (Table 5, Figure 6), but barely above the threshold of significance (3.7) for the FAs linoleic and arachidic acid. The second harvest season, from May 2011 to November 2011, showed stronger QTLs among the FAs (Table 5, Figure 7), with the greatest peak from palmitic acid in LG04 (-log10p 18.3, var. expl 16.9%). Stearic acid, oleic and arachidic acid had QTLs in LG04 with larger effect from oleic acid (-log10p 11.2, var. expl 11.0%). Arachidic acid had QTLs with the strongest peak in LG09 (-log10p 8.2, 8.3% var expl), and three minor QTLs in LG04 (-log10p 6.6, 6.8% var. expl), 6 (-log10p 4.6, var.expl 4.8%), and 8 (-log10p 4.7, var expl 4.9%).
Table 5 QTL summary 1 -log10p away from peak for harvest seasons 1 and 2.
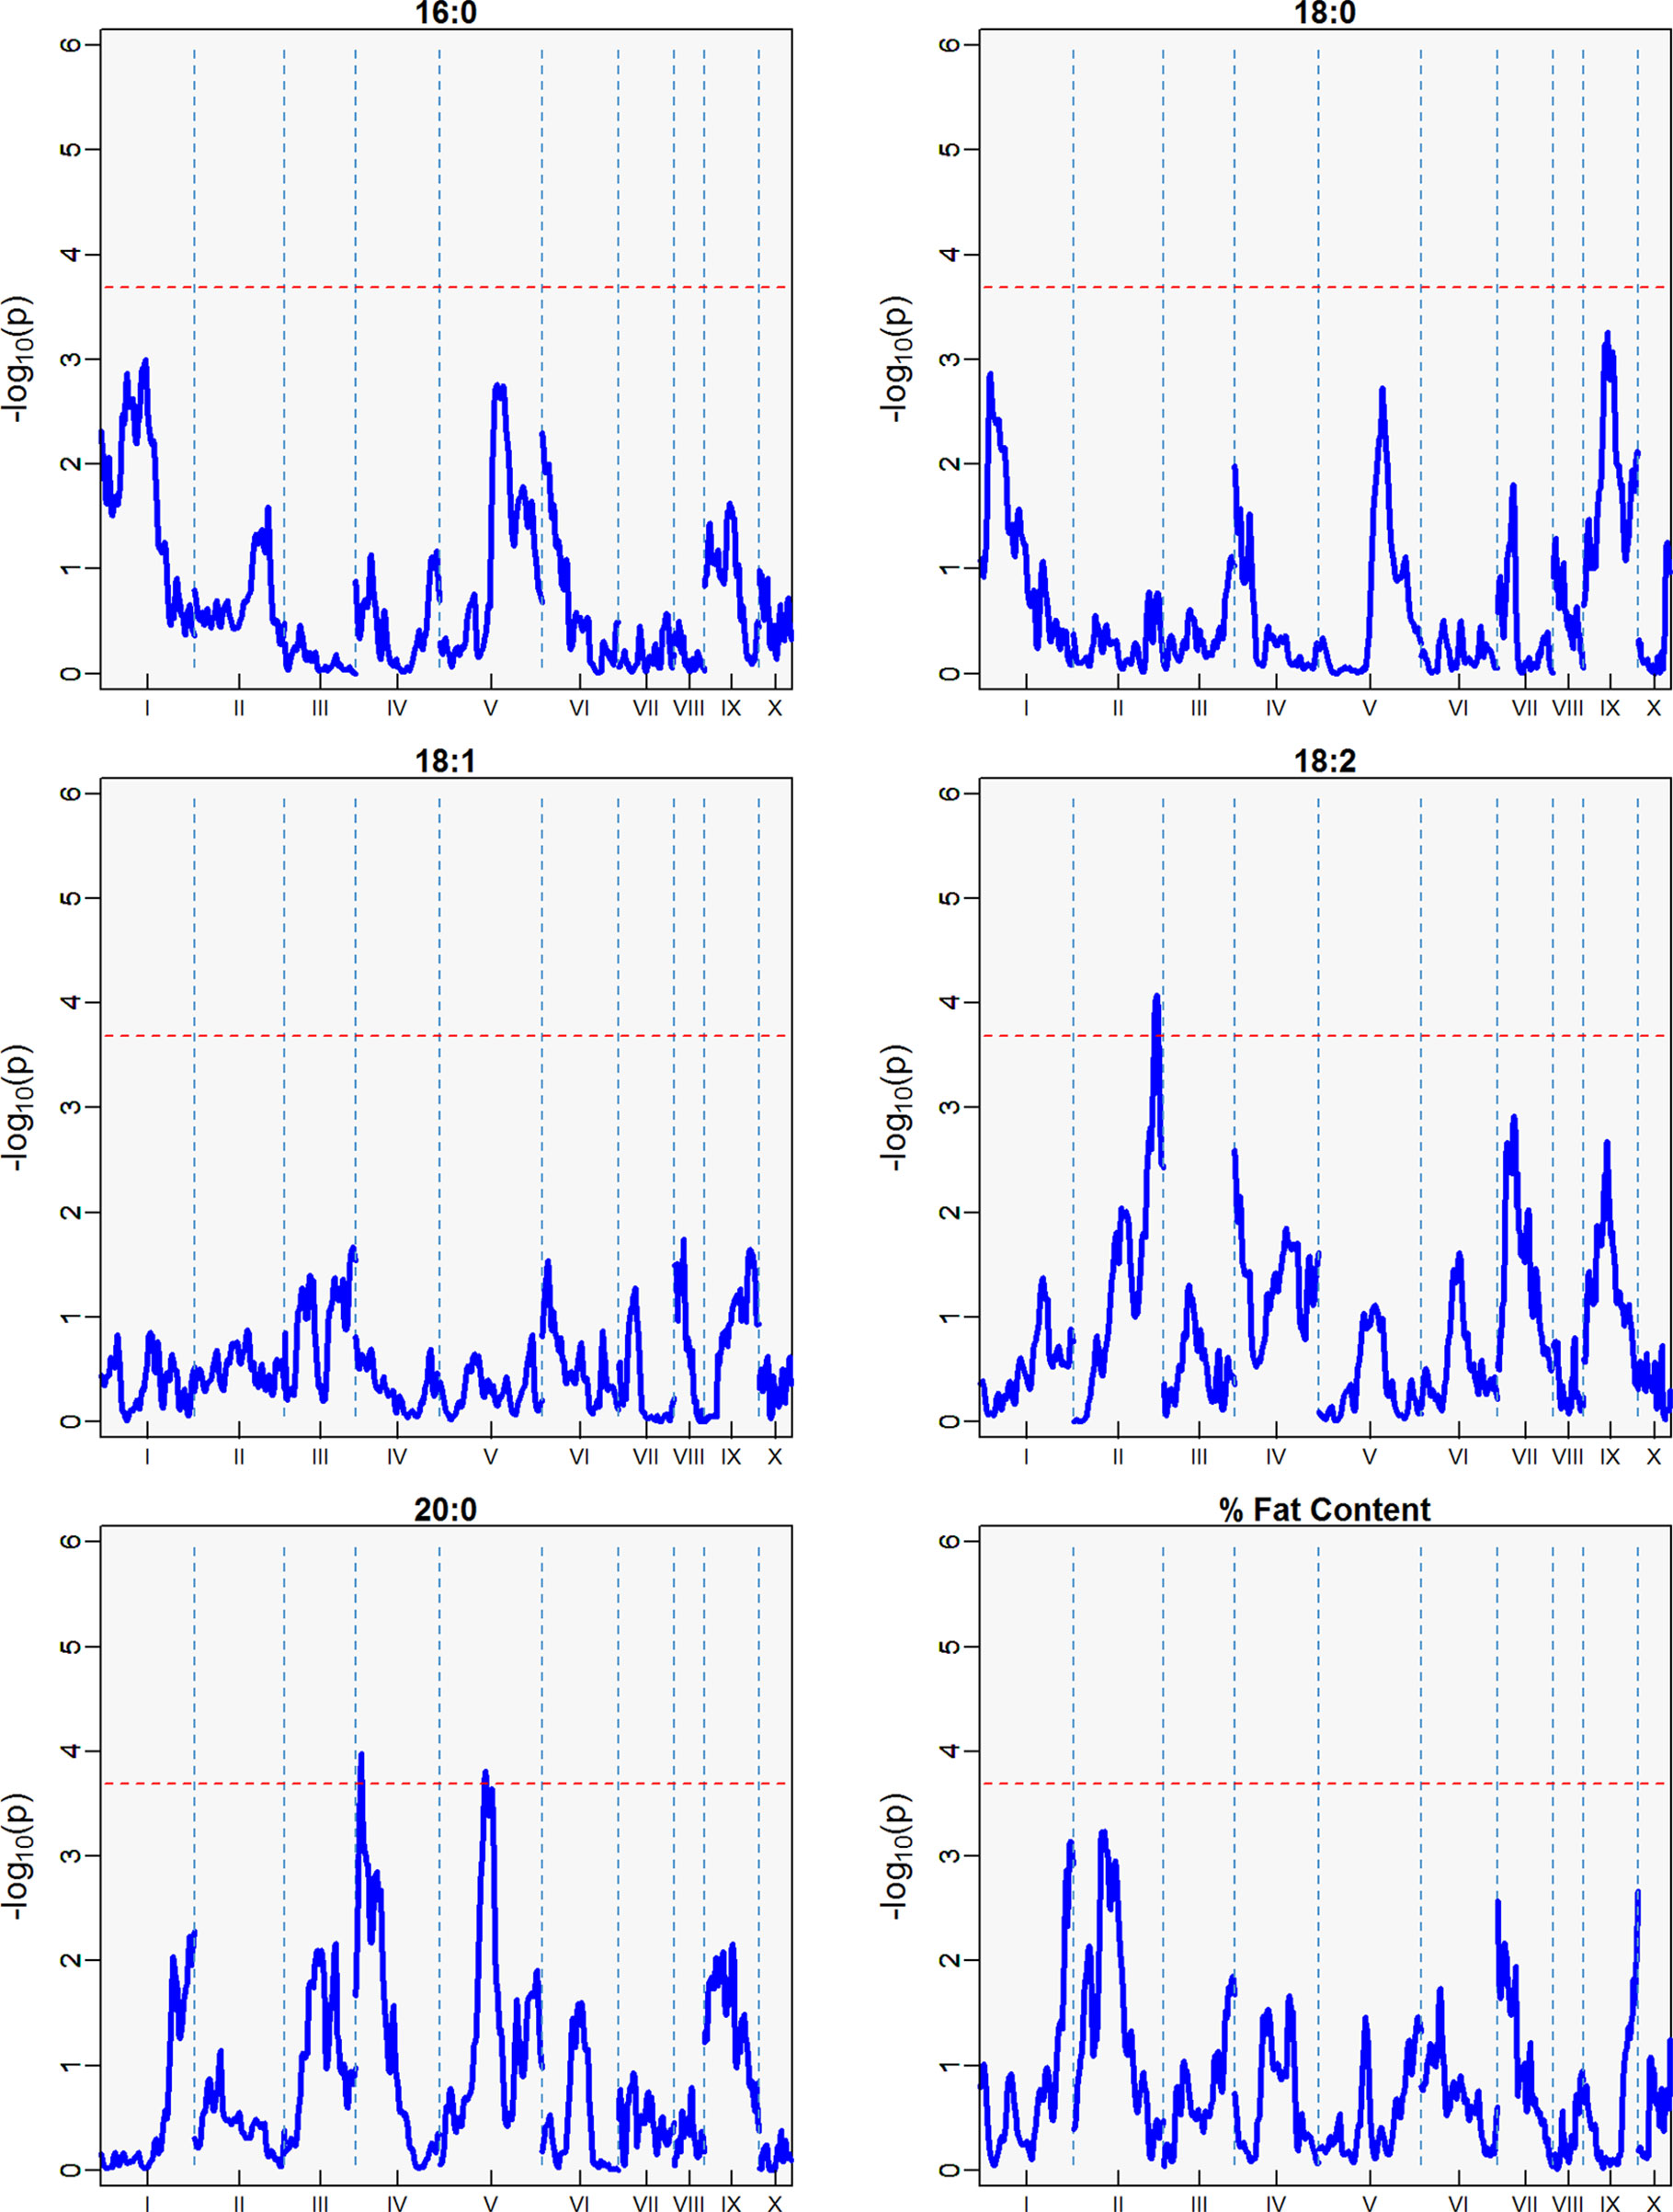
Figure 6 QTLs from the best linear unbiased predictors (BLUPs) from the first harvest season (6 sampling dates) spanning August 2010 to January 2011. The -log10p is the statistical magnitude of the significance of the peak maker associated to the trait. The coordinates are based on the “Matina1-6” genome V1.1. The threshold of significance (red dash) is a multiple comparison adjustment at 3.688.
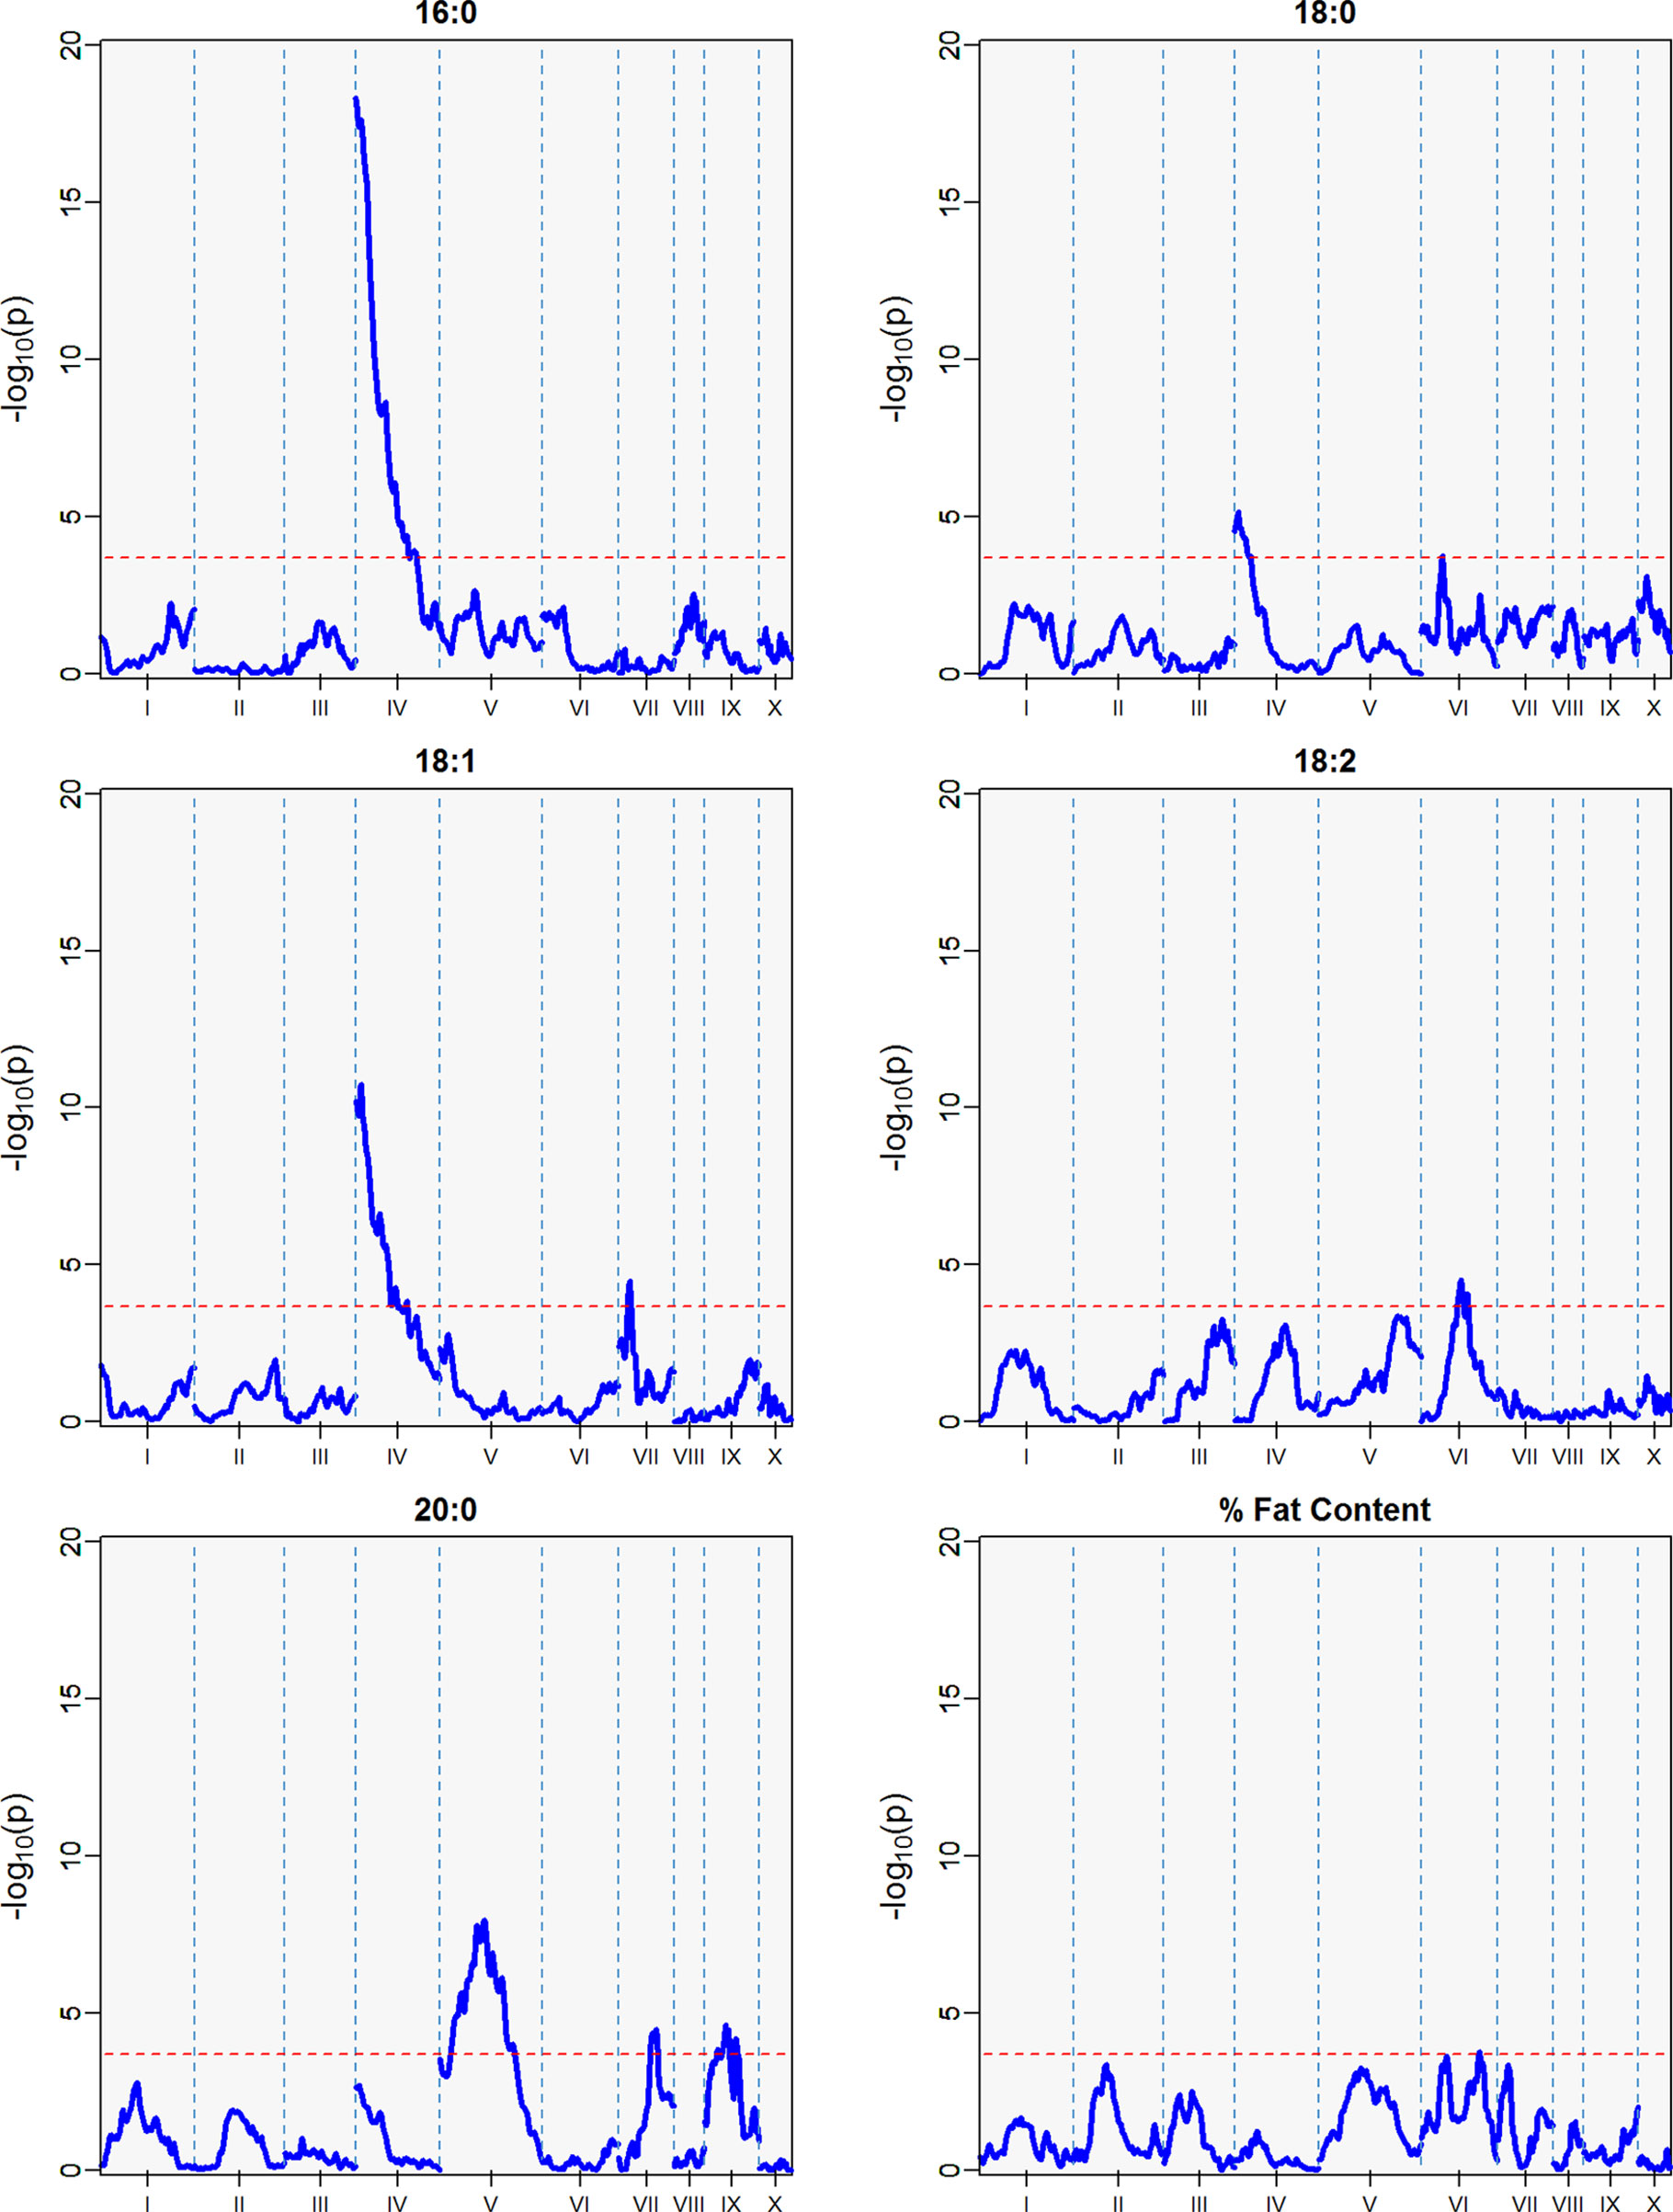
Figure 7 QTLs from the best linear unbiased predictors (BLUPs) from the second harvest season (6 sampling dates) spanning May 2011 to November 2011. The -log10p is the statistical magnitude of the significance of the peak maker associated to the FA. The coordinates are based on the “Matina1-6” genome V1.1. The threshold of significance (red dash) is a multiple comparison adjustment at 3.688.
This result indicates the stability of the arachidic acid QTL in LG09, which is present in both harvest seasons and the combined data sets with range of peak markers overlapping in the range of 6 to 9 Mbps. The difference in the significance (-log10p) and percent of variation explained are possibly due to the different sample sizes between the harvest seasons, affecting statistical power of the QTL detection. In the case of palmitic acid, QTLs are present in the combined harvest seasons (LGs 1, 4, 7, 8, 9, and 10), and one QTL in LG04 in harvest season 2, and no presence of QTL in harvest season 1. Percent of total fat content is also a trait that has multiple QTLs in the combined seasons (LGs 2, 3, 4, 5, 6, and 9) with peak in LG02 (-log10p 9.8, max var expl 9.8%) and one QTL in LG05 for the second harvest season -log10p 4.1, %var expl 4.2%), with no presence of QTL in the first harvest season.
Weather Correlations With FA Composition and Total Fat Content
Similar to described previously by Wintgens (1992) and by Lehrian et al. (1980 we observed a weak but significant positive correlation (r = 0.28, p < 0.001) between higher temperatures and palmitic acid content at the four-month moving average (lag4) (Table 6, Supplementary Figure 4). There was no difference between the lag3 and lag4 correlations with the traits, thus, we only present lag4 as representative. Increased temperatures for the month of harvest (lag0) and prior to harvest (lag1) were associated with increased stearic acid values. Oleic acid had a consistent, negative correlation with temperature (min, max, and average) for all lagged months, with a stronger correlation with maximum temperature observed at lag1 (r = −0.52, p < 0.001). Similarly, linoleic acid was also negatively correlated with temperature for most lags and was moderately associated with maximum temperature of the month prior to harvest (lag1, r = −0.41, p < 0.001). Total percentage of fat content also had a low, positive correlation with increased temperatures, particularly for the 6 months prior to harvest (lag6, r = 0.28, p < 0.001). In addition, temperature was not associated with percentage of fat content and palmitic acid for lag0 and lag1. The strongest linear relationships were observed between temperature and palmitic acid, with maximum temperatures at lag4 (r = 0.85, p < 0.001).
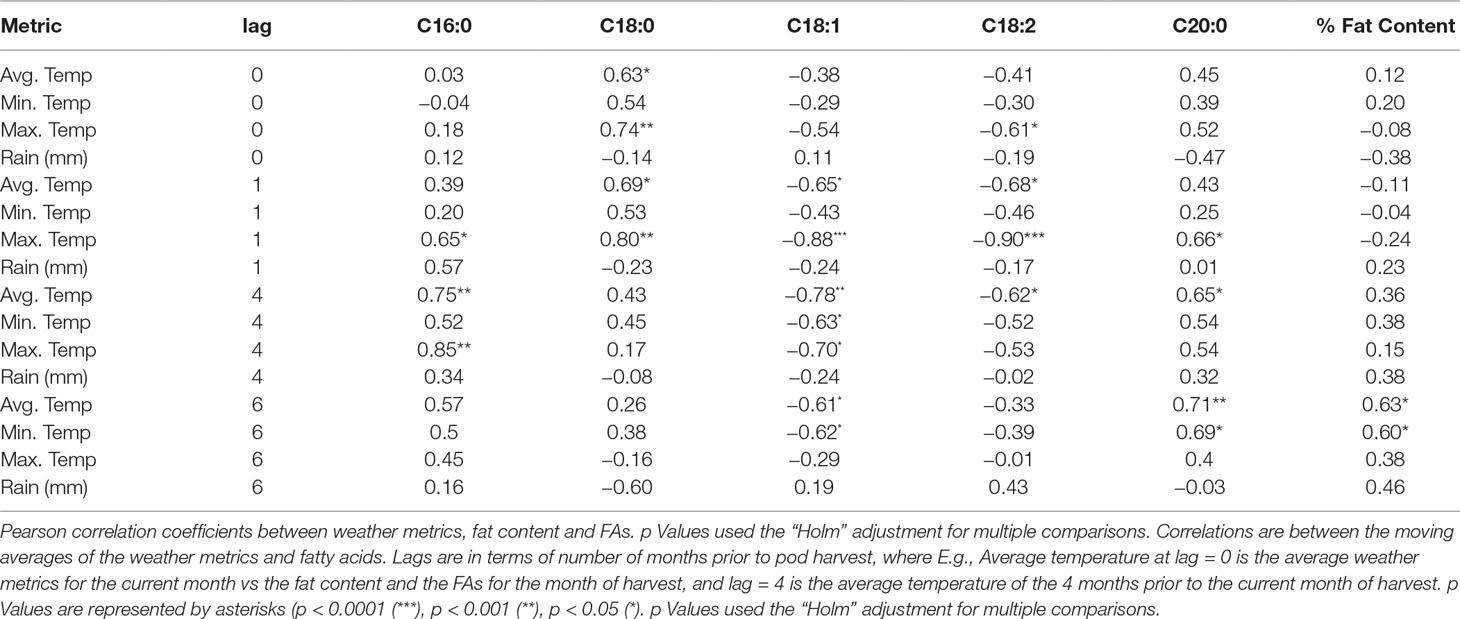
Table 6 Correlations between climate and traits.
Positive correlations between FAs and the amount of rainfall were significant for lags 1, 4, and 6, particularly for palmitic acid at lag1 (r = 0.27, p < 0.001), oleic acid at lag4 (r = −0.32, p < 0.001), and linoleic acid at lag6 (r = 0.22, p < 0.001). However, negative correlations were observed for stearic acid at lag6 (r = −0.20, p < 0.001) and arachidic acid at lag0 (r = −0.30, p < 0.001). Fat content had either negative or positive correlations with rainfall, depending on the lagged month. We observed that for the month of harvest, fat content had a negative correlation with rain (r = −0.20, p < 0.001) and a positive correlation when the average amount of rainfall is taken during the 6 months (pod formation) prior to harvest (r = 0.23, p < 0.001).
Heritability
Most traits for which estimates of heritability have been reported (Ndoumbé et al., 2001; Lockwood et al., 2007; Cilas et al., 2010; Ofori et al., 2016; DuVal et al., 2017; Mustiga et al., 2018; Padi et al., 2017; Romero Navarro et al., 2017) show a range between 0.13 and 0.79. Heritabilities calculated for the FA content in this study (Table 7) also varied within that range (0.14–0.43). Interestingly, total fat content showed the lowest heritability value (0.14); this could be explained by the fact that it is a complex quantitative trait strongly influenced by both temperature and amount of rainfall for the longest periods (4 and 6 months before harvest) as shown in Table 6. Heritabilities of palmitic, stearic, and linoleic acids are highest (H2 = 0.43, 0.38, 0.35, respectively), and moderate heritabilities are reported for oleic and arachidic acids (H2 = 0.22, 0.26, respectively).
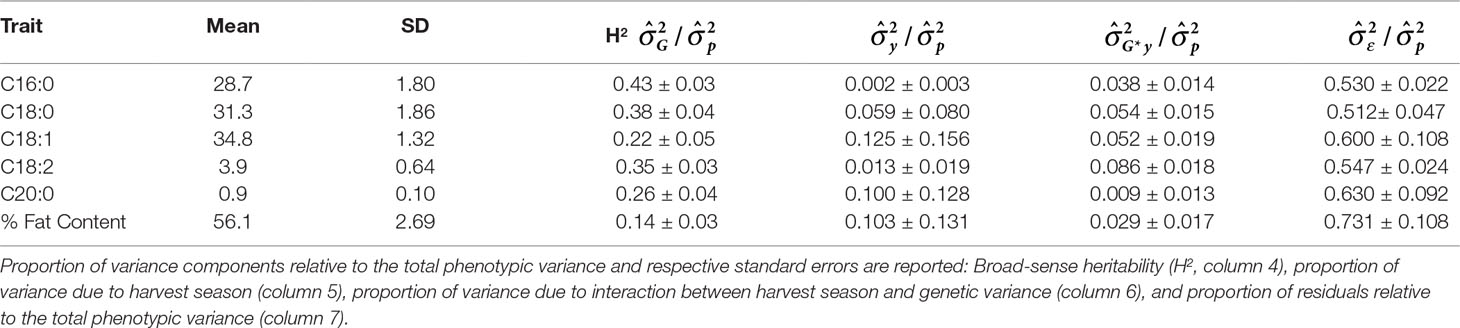
Table 7 Mean and standard deviation (SD) for the phenotypic fatty acid profiles and percentage of fat content in the MP01 population.
Major QTL for Palmitic Acid Variation
A major QTL (defined here as explaining >15% of variation) on linkage group four explains 23.5% of the variation in palmitic acid levels, with a -log10p score of 27.6 from the two combined harvest seasons (Table 4, Figure 5) and also present in the second harvest season (18.3 -log10p, 16.9% var expl). The ordinary least squares regression of palmitic acid levels on the means of the four parental haplotype combinations (T1C1, T1C2, T1C2, and T2C2, with T representing “TSH 1188” and C representing “CCN 51”) for the peak marker confirms high significance (p << 0.0001). Tukey’s linear hypothesis shows the effect of T2 to be significantly higher (p < 0.001) than the genotypes containing T1, C1, and C2 in the analysis of the combined seasons. Hence, the T2 haplotype from “TSH 1188” has the greatest effect on increasing the level of palmitic acid (Table 5); the genotypes containing T2 have an average palmitic acid value of 29.4 %, which is, on average, 4.5% higher than T1 haplotype, and 2.4% and 2.0% higher than the C1 and C2 haplotypes, respectively (Table 4).
Source of the Allele That Increases Palmitic Acid
To identify the ancestry of the T2 allele that increases palmitic acid levels, an NJ tree of ancestral haplotypes was created from a diversity panel that includes “TSH 1188” and “CCN 51.” The T2 allele clustered with individuals that have a high percentage of the Iquitos genetic group (Motamayor et al., 2008) with a support value of 86% based on the 1000 bootstrap consensus tree (Figure 8). The phased alleles between T2 from “TSH 1188” and one of the phased alleles from “IMC 12,” “IMC 47,” and “IMC 50” are identical. “TSH 1188” is an admixed genotype, with 48% Iquitos, 16% Amelonado, 11% Contamana, 13% Marañon, 7% Criollo, 3% Guiana, and 2% Nacional ancestral groups (Romero Navarro et al., 2017). “IMC 12” and “IMC 50” have 100% and 93% Iquitos ancestry, respectively. “IMC 47” is more admixed, but also with highest proportion of Iquitos (58%), 21% Nacional, 11% Nanay, 6% Amelonado, and 5% Guiana. For reference, CCN51 is also admixed and has 49% Iquitos, 32% Amelonado, and 19% Criollo membership.
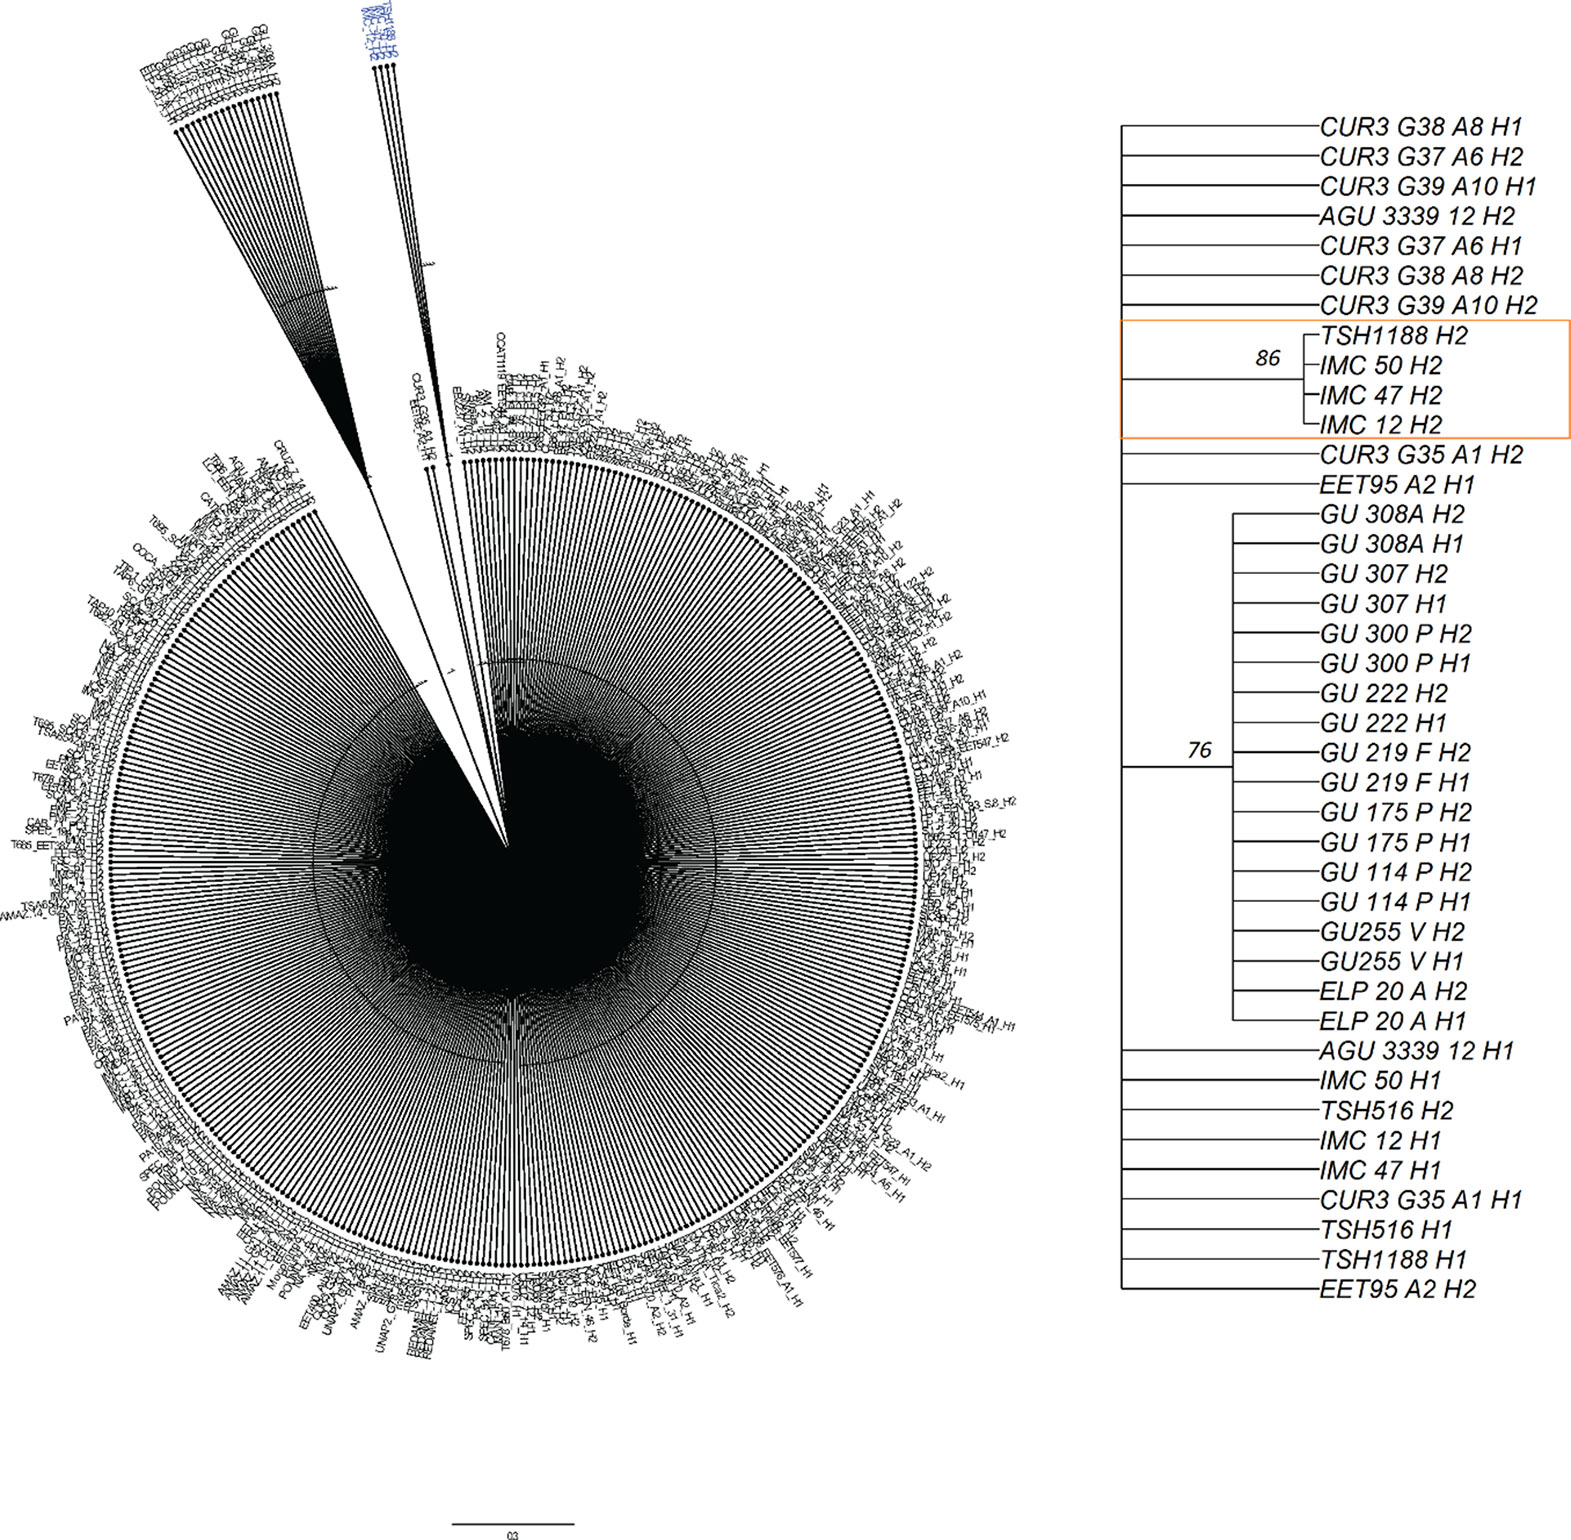
Figure 8 Neighbor joining tree for haplotypes from 200 diversity panel individuals. Zoomed in section for the palmitic haplotype from TSH1188 H2 haplotype and the cluster with Iquitos haplotypes with support values are on the right figure.
Pollination Effects
Pollen effects on fat content and FA profile were evaluated from 76 trees pollinated with three sources of pollen: (i) open pollinated (OP), (ii) self-pollinated (SP), and (iii) clone “SIAL 70.”
Significant differences in the values of FAs were found between pollination types. Palmitic acid was significantly lower when “SIAL 70” was used as a pollen donor, stearic acid was highest with “SIAL 70,” oleic acid was lowest with SP, linoleic acid lowest with “SIAL 70,” and arachidic acid highest with SP. There was no evidence of pollen effects on total fat content (Supplementary Table 6).
Discussion
FA Variation in T. cacao Ancestral Groups
Preliminary chemical analyses of FA composition and total fat content of some of the progeny in the mapping population showed a wide range of variation, even though the parents displayed very similar FA compositions, with the exception that the maternal genotype, “TSH 1188” had slightly higher fat content. The high variation allowed us to identify various genomic regions associated with the tested traits. Total fat content in the State of Bahia in Brazil has been previously reported (Pires et al., 1998) from the germplasm collection at the Centro de Pesquisas do Cacau (CEPEC), with a mean of 53.2% from 490 accessions, ranging from 45.4% to 60.3%
Despite the similarity of their phenotypes, the parents of the mapping population have different proportions and memberships to the ten previously identified ancestral groups (Motamayor et al., 2008). Thus, through recombination, the F1 progenies obtained combinations of those alleles that lead to a range of phenotypic values (transgressive segregation). The phenotypes of the progeny showed small variations for oleic acid and higher ranges of palmitic and stearic acid (Table 2). This could indicate that within the two parental genomes, there exists genetic variation for the major saturated fats in cocoa beans, but less so for genes affecting oleic acid.
FA Content in T. cacao Relatives
Analysis of arachidic acid levels in the beans of other species of Theobroma showed similarly low levels (less than 2.1% of FAs) in T. bicolor, T. microcarpum, and T. speciosum (Carpenter, et al. 1994). In contrast, T. grandiflorum, which is cultivated for use in desserts and cosmetics in Brazil, has 9.8% to 12.1% arachidic acid, whereas the wild species T. gileri, T. angustifolium, T. obovatum, and T. mammosum had levels ranging from 8.6% to 13.4% (Carpenter et al., 1994). Bean FA composition from the sister genus Herrania was even more rich in arachidic acid, ranging from 16.3% to 20.1% of total FAs (Carpenter et al., 1994). Thus, while no significant differences have been found between FA profiles within the same Theobroma phylogeneic sections, significant differences have been reported between different Theobroma sections (Gilabert-Escrivá et al., 2002). The diversity of FA composition in Theobroma species can be valuable for breeding programs aiming for introgression of targeted FA profiles, fat content, and seed quality traits into T. cacao.
QTL Identification
With a large QTL in chromosome 4, explaining more than 23% of the genotypic variation, palmitic acid can be selected against, given its identification of the source of the allele that increases palmitic acid originates from the maternal “TSH 1188” haplotype (T2). The three clones from our diversity group with the T2 haplotype form an Iquitos sub-group, “IMC 12” was previously reported as belonging to sub-group or sub-cluster IMCI in Motamayor et al. (2008). The FA profiles of cocoa beans and chocolates vary across geographic origins (Torres-Moreno et al., 2015). Environmental conditions affect FA in cocoa beans (Lehrian et al., 1980; McHenry and Fritz, 1987; Chaiseri and Dimick, 1989; Lipp and Anklam, 1998), but genetics may also play a role. Palmitic acid levels in selection of Criollo ancestral group cultivars ranged from 20% to 30% (Liendo et al., 1997), while the levels in the MP01 population ranged from 26% to 34%. The Iquitos allele that “TSH 1188” shares with the IMC genotypes is associated with the elevated palmitic acid levels, and is not present in the Ciollo ancestral group, implying that genetic backgrounds contribute to palmitic acid levels in beans.
Within linkage group 4 QTL, both the “B97-61/B2” and “Matina1-6” reference genomes have four copies of the SAD/FAB2 stearoyl-ACP desaturase (Argout et al., 2011; Motamayor et al., 2013; Zhang et al., 2015). These are annotated as TcSAD1, TcSAD2, TcSAD3, and TcSAD5. In total, cacao has eight SAD homologues and Arabidopsis has seven (Argout et al., 2011). Examination of “CCN 51” and “TSH 1188” SNPs in the SAD genes and the surrounding regions shows extensive variation in the quantity of SNPs (Supplementary Table 5). Of particular interest are missense mutations in the coding region of “TSH 1188,” which could conceivably alter enzyme function. “TSH 1188” also has many more SNPs in SAD2 and SAD3, especially in the downstream region, suggesting a high level of genetic variation.
Although arachidic acid comprised an average of 0.9% of bean FAs in the MP01 population, we identified three major QTLs for arachidic acid variation. The largest effect QTL was on chromosome 9 and explains 26.1% of the variation in arachidic acid (C20:0) levels with a -log10p of 31.8 (Table 4). Close to this region, on chromosome 9, is Thecc1EG037982 (Tc09cons_t010430.1 in Criollo v2 assembly), an orthologue of the Arabidopsis gene FAE1/KCS18, which encodes the 3-ketoacyl-CoA synthase 18. FAE1/KCS18 elongates saturated and monounsaturated FAs of 16 and 18 carbons (Ghanevati and Jaworski, 2002), and ketoacyl-CoA synthases play a role in arachidic acid biosynthesis in Arabidopsis (Millar and Kunst, 1997). Mapping in Arabidopsis found that a point mutation in FAE1/KCS18 controlled variation in ratio between the long FAs (20 to 24 carbons, like arachidic acid) and short FAs (16 to 18 carbons, like palmitic and stearic acids) (Jasinski et al., 2012). For reference, there are 20 copies of KCS in cacao and 21 in Arabidopsis (Argout et al., 2011).
A minor QTL for variation in stearic acid was identified on linkage group 8 explaining 9.4% of variation with a -log10p of 9.3. Within this region is SAD7 (Thecc1EG035438). Like the other SAD genes, variation was detected between the two parents, with the “CCN 51” alleles identical to “Matina1-6,” and the “TSH 1188” containing multiple SNPs compared to “CCN 51.” (Supplementary Table 5).
TcSAD1, TcSAD2, TcSAD3 are cacao orthologues that are closely related to the Arabidopsis FAB2 gene (Zhang et al., 2015). The fab2 mutant has increased levels of stearic acid and lower levels of oleic acid (Lightner et al., 1994; Kachroo et al., 2007) while knocking-down SAD/FAB2 expression in rapeseed, maize, and Arabidopsis increased stearic acid levels in seeds (Knutzon et al., 1992; Du et al., 2016). Expression of Arabidopsis FAB2 in Escherichia coli decreased the level of palmitic acid and resulted in the production of oleic acid that was otherwise absent in wild type E. coli (Cao et al., 2010).
Correlation Between FAs
From the analyses for the phenotypic correlation between traits, total fat content was positively associated with stearic acid and arachidic acid, and negatively correlated with palmitic, oleic, and linoleic acid (Table 3). Moreover, palmitic acid levels and the combined level of stearic, oleic, and linoleic acids were negatively correlated (Figure 4).
In addition, selection of genotypes in the 95th percentile for fat content (higher % fat) have significant differences in FA profile compared with genotypes that have low fat content (5th percentile). More specifically, the FA profile for high-fat genotypes contains high stearic (p = 0.012), lower oleic (p = 0.023), and linoleic (p = 0.042) FA profiles, and no differences in palmitic or arachidic acid values were found (Supplementary Figure 3). Although the high-fat genotypes are generally associated with higher saturated (C18:0) and lower unsaturated FAs (C18:1, C18:2), the selection of genotypes that are correlation breakers is feasible in breeding programs (Supplementary Figure 2). The strongest linear relationship observed was between palmitic and stearic acid (−0.74). Thus, based on the results from this mapping population, a clone with low palmitic acid, high stearic acid, and high cocoa butter content could be bred (Supplementary Figure 2). The relatively higher heritability for both palmitic acid (H2 = 0.43) and stearic acid (H2 = 0.38) may contribute to this process, even though heritability for fat content is low (H2 = 0.14) (Supplementary Table 3). The combination of low saturated and high unsaturated FA could be desirable for the food industry, as palmitic acid, but not stearic acid, has often been associated with negative cardiovascular health impacts (Mozaffarian et al., 2010; Zong et al., 2016).
This study also found a significant correlation between arachidic and palmitic acid (r = −0.37). This result could be related to the mechanism of the FA biosynthesis pathway regulation during seed development, where palmitic (C16:0) is converted to stearic (C18:0) by the KASII/FAB1 enzyme and C18:0 is converted to arachidic (C20:0) through elongases coded by FA elongation (FAE) gene. Species from the section Glossopetalum have been found to have significantly lower levels of palmitic and increased levels of arachidic than in T. cacao (Gilabert-Escrivá et al., 2002), suggesting the negative correlation between the two FAs. The negative correlation between C20:0 and C16:0 has also been identified in other plant species, such as in some peanut families and in wild safflower (Arslan, 2007; Wang et al., 2015).
Effect of Climate Factors on FA Content
Complex quantitative traits are affected by several environmental factors, each having specific scales of impact on a crop, depending on the physiological stages of the crop and stage of seed development. Studies in developing embryos in cacao beans demonstrate that changes in FA composition occur between 95 and 115 days after pollination and during this period, linoleic and palmitic acid decrease relative to the total lipid amount, whereas stearic and oleic increase (Patel et al., 1994). Thus, changes in FA composition during embryo and seed development are a function of FA accumulation, growth rate of the embryo, and interaction with environmental factors. In our study, we found various levels of association between climatic factors including temperature and amount of rainfall during pod development with either increased or decreased FA levels. For each of the 12 harvest dates in the study, the means for FA and fat content were calculated and plotted against the average temperature and rain for different lags in time. For instance, at lag4, trees harvested in August 2011 would have been compared with the average temperature in April 2011 (3 months prior, during pod formation), and so on, for the 12 harvest dates, generating 12 data points for each lag comparison (Table 6, Supplementary Figure 4).
Arachidic acid had a weak positive correlation with temperature, particularly for the 6 months prior to pod harvest (lag6, r = 0.32, p < 0.001), also shown in Lehrian et al. (1980). Strong positive linear relationships were found between temperature and both palmitic and stearic acids, specifically for temperatures 4 to 6 months prior to harvest. Lower temperatures were strongly associated with increased levels of oleic and linoleic acid. This negative correlation for oleic acid was also reported by McHenry and Fritz (1987). These data are also in accordance with previous research, where lower temperatures were found to be associated with increased levels of linoleic acid (Canvin, 1965; Lehrian et al., 1980; Leathers and Scragg, 1989).
Interestingly, oleic acid is the first unsaturated FA that is generated from the saturated FAs produced by the FA synthase. In plants, oleic acid is produced via a stearoyl-[acp], an acyl-carrier protein-bound intermediate (Jaworski and Stumpf, 1974). Cheesbrough (1989) found that when culturing developing soybean seeds for 20 h in liquid media at 20°C, 25°C, or 35°C the total activity of stearoyl-ACP desaturase decreased twofold between 20°C and 25°C and sixfold between 20°C and 35°C cultures. This seems to be in line with lower temperatures and increased levels of the unsaturated FAs, oleic and linoleic acid during the lag4, especially when this lag4 corresponds with the colder months of the year, which also seems to coincide with the changes in FA composition that occur between 95 and 115 days after pollination (Patel et al., 1994).
The amount of rain 6 months prior to harvest was associated with reducing stearic acid levels and increasing both linoleic acid and total fat content. This may indicate that temperatures and rain tend to have more of an effect on FA during seed formation, before ripening of the pod. Previous studies on pod formation report that ripening occurs 140 days after pollination or 5 to 6 months from the time the flower is pollinated (Mckelvie, 1956; Glendinning, 1962).
Pollen Donor Effects
The effect of pollen donor was significant in this study for FAs, but not for total fat content, even though previous research has shown a highly significant effect of pollen donors on fat content, in addition to interaction between parents (specific combining ability) (Pires et al., 1998). In our study, the pollen from the clone “SIAL 70” was associated with 5% and 8% decreased palmitic acid levels and increased stearic (4.3%) and oleic acid (5.4%) when compared with open or self-pollinated treatments, respectively (Supplementary Table 6). The effect of pollen source is known to impact the composition of FAs, affecting expression levels of the main desaturase genes involved (SAD and FAD), especially during rapid oil accumulation, typically during seed development (Xie et al., 2019).
Conclusion
Our research provides further evidence that variation in cocoa bean fat composition has an environmental and genetic basis. Further research is needed to decompose the specific physiological events during bean formation that are the most affected by temperature and water availability influencing fat content and FA profile. Indeed, our studies were carried out without fertigation; it would be interesting to compare our results from studies implemented on fertigated plots. We have identified alleles with positive or negative effects on the fat profile (composition and content) through genetic mapping. Ultimately, the markers associated with fat content and FA composition reported here could be used to breed for the most desirable fat profile for chocolate producers and consumers. The low heritability of fat content and the costs associated with the analyses described suggest that including marker-assisted selection for these traits would be a cost-efficient approach to include in breeding programs to obtain various favorable traits. Furthermore, the use of appropriate pollen donors, further temperature monitoring during pod development months, and the identification of sites worldwide with the most adequate natural rainfall and temperature conditions could increase the probability of obtaining the desired FA composition in the cocoa beans.
Author Contributions
GM analyzed the data and wrote the manuscript. JM and SR wrote the manuscript. CV-D, CB, EC, and ES collected data. JS, EC, LM, AD, and JJ analyzed data. SR, JCM, and JPM designed the trial. JPM managed collection of field data. JCM conceived the experiment and wrote the manuscript.
Conflict of Interest
Author(s) Guiliana M. Mustiga, Joe Morrissey, Joseph Conrad Stack, Ashley DuVal, Stefan Royaert, Carolina Bizzotto, Cristiano Villela-Dias, Ed Seguine, Jean Philippe Marelli and Juan Carlos Motamayor are/were employed by company(ies) Mars Chocolate, Mars Center for Cocoa Science and Guittard Chocolate Co at the time of the research or the writing of this paper. The remaining authors declare that the research was conducted in the absence of any commercial or financial relationships that could be construed as a potential conflict of interest.
Acknowledgments
The authors thank the MCCS field team for the years of monthly pod collection, and the team at the Center for Plant Science Innovation for providing the FA analysis. Financial support for this research was provided by Mars, Inc.
Supplementary Material
The Supplementary Material for this article can be found online at: https://www.frontiersin.org/articles/10.3389/fpls.2019.01159/full#supplementary-material
Supplementary Table 1 | Climate data for each of the 12 months sampled. The minimum, maximum, and average temperatures (Cº) (Min., Max., Temp) are reported for each of the harvest months and season with the amount of rain fall (mm) and the FA averages.
Supplementary Table 2 | Fatty acid composition of beans of the MP01 parents. Average percent FA composition of beans from MP01 parents, and percent total fat. Descriptive statistics for parental fatty acid phenotypic values for the period evaluated for the parents from July 2010-November 2011. Total number of observations (n) are n = 22 and n = 28 for “TSH 1188” and “CCN 51,” respectively. p is the p value from the t-test for comparing the means of the two parents.
Supplementary Table 3 | Coordinates of FAB2/SAD candidate genes from palmitic acid major QTL.
Supplementary Table 4 | Mapping of SAD gene models in the identified FA QTLs. QTL mapping results for the markers near the FAB2/SAD candidate genes with the Matina v2 coordinates.
Supplementary Table 5 | SNPs variations relative to Matina1-6 reference genome (Motamayor et al., 2013). Upstream and downstream refer to 200 bp region from UTR.
Supplementary Table 6 | ANOVA with Mean, SD, F-statistic, Mean Square and p value for pollination effect from 70 genotypes of the MP01 population.
Supplementary Figure 1 | PCA for the FA traits and total fat content from average of both harvest seasons, with n = 420 genotypes.
Supplementary Figure 2 | Biplot of 420 genotypes in MP01. Highlighted in red are trees with higher fat (95th percentile, % fat >= 58.4) and lower palmitic fatty acid (10th percentile, C16:0 <= 27).
Supplementary Figure 3 | Boxplot of fatty acid profiles from individuals within the 5th and 95th percentiles for total fat content. N=21 for both groups. P-value is the T-test for comparison of means between the low fat (5th percentile) and higher fat (95th percentile) genotypes.
Supplementary Figure 4 | Temperature, fatty acids and % fat content plotted against the weather metrics (Average, minimum, and maximum temperatures) at specific lags for which the correlations were most significant based on (Table 7). Each point on the plot (12 points) represents the average FA and fat content vs the temperature lag for the month of harvest.
References
Alexander, D. H., Novembre, J., Lange, K. (2009). Fast model-based estimation of ancestry in unrelated individuals. Genome Res. 19, 1655–1664. doi: 10.1101/gr.094052.109
Araújo, I. S., de Souza Filho, G. A., Pereira, M. G., Faleiro, F. G., de Queiroz, V. T., Guimarães, C. T., et al. (2009). Mapping of quantitative trait loci for butter content and hardness in cocoa beans (Theobroma cacao L.). Plant Mol. Biol. Report 27, 177–183. doi: 10.1007/s11105-008-0069-9
Argout, X., Martin, G., Droc, G., Fouet, O., Labadie, K., Rivals, E., et al. (2017). The cacao Criollo genome v2.0: An improved version of the genome for genetic and functional genomic studies. 18, 730. BMC Genomics doi: 10.1186/s12864-017-4120-9
Argout, X., Salse, J., Aury, J. M., Guiltinan, M. J., Droc, G., Gouzy, J., et al. (2011). The genome of Theobroma cacao. Nat. Genet. 43, 101–108. doi: 10.1038/ng.736
Arslan, B. (2007). The determination of oil content and fatty acid compositions of domestic and exotic safflower (Carthamus tinctorius L.) genotypes and their interactions. J. Agron. 6, 415–420. doi: 10.3923/ja.2007.415.420
Badings, H. T., De Jong, C. (1983). Glass capillary gas chromatography of fatty acid methyl esters. A study of conditions for the quantitative analysis of short- and long-chain fatty acids in lipids. J. Chromatogr. A, 279, 493–506. doi: 10.1016/S0021-9673(01)93650-7
Barker, G. C., Larson, T. R., Graham, I. A., Lynn, J. R., King, G. J. (2007). Novel insights into seed fatty acid synthesis and modification pathways from genetic diversity and quantitative trait loci analysis of the brassica C genome. Plant Physiol. 144, 1827–1842. doi: 10.1104/pp.107.096172
Barreto, M. A., Santos, J. C. S., Corrêa, R. X., Luz, E. D. M. N., Marelli, J., Souza, A. P. (2015). Detection of genetic resistance to cocoa black pod disease caused by three Phytophthora species. Euphytica. 206, 677–687. doi: 10.1007/s10681-015-1490-4
Bellaloui, N., Reddy, K. N., Mengistu, A. (2015). "Drought and heat stress effects on soybean fatty acid composition and oil stability," in Processing and Impact on Active Components in Food, ed. Preedy, V., (Academic Press), 377–384.
Boza, E. J., Motamayor, J. C., Amores, F. M., Cedeño-Amador, S., Tondo, C. L., Livingstone, D. S., et al. (2014). Genetic characterization of the cacao cultivar CCN 51: its impact and significance on global cacao improvement and production. J. Am. Soc. Hortic. Sci. 119, 219–229. doi: 10.21273/JASHS.139.2.219
Browning, S. R., Browning, B. L. (2007). Rapid and accurate haplotype phasing and missing-data inference for whole-genome association studies by use of localized haplotype clustering. Am. J. Hum. Genet. 81, 1084–1097. doi: 10.1086/521987
Butler, D. G., Cullis, B. R., Gilmour, A. R., Gogel, B. J. (2009). ASReml-R reference manual mixed models for S language environments. Hemel Hempstead, HP1 1ES, UK: VSN Int. Ltd, 149. www.vsni.co.uk.
CABISCO/ECA/FCC. (2015). “CAOBISCO/ECA/FCC Cocoa Beans: Chocolate and Cocoa Industry Quality Requirements. Appendix B: Protocols for the preparation and flavour evaluation of samples and small-scale fermentation techniques.,” in, ed. End, M.J., Dand, R.104. Available at: http://www.cocoaquality.eu/data/CocoaBeansIndustryQualityRequirementsApr 2016_En.pdf.
Cahoon, E. B., Dietrich, C. R., Meyer, K., Damude, H. G., Dyer, J. M., Kinney, A. J. (2006). Conjugated fatty acids accumulate to high levels in phospholipids of metabolically engineered soybean and Arabidopsis seeds. Phytochemistry 67, 1166–1176. doi: 10.1016/j.phytochem.2006.04.013
Canvin, D. T. (1965). The effect of temperature on the oil content and fatty acid composition of the oils from several oil seed crops. Can. J. Bot. 63, 43–49. doi: 10.1139/b65-008
Cao, Y., Xian, M., Yang, J., Xu, X., Liu, W., Li, L. (2010). Heterologous expression of stearoyl-acyl carrier protein desaturase (S-ACP-DES) from Arabidopsis thaliana in Escherichia coli.. 69, 209–214 Protein Expr. Purif. doi: 10.1016/j.pep.2009.08.011
Carpenter, D. R., Hammerstone, J. F., Romanczyk, L. J., Aitken, W. M. (1994). Lipid composition of herrania and theobroma seeds. J. Am. Oil Chem. Soc. 71, 845–851. doi: 10.1007/BF02540460
Chaiseri, S., Dimick, P. (1989). Lipid and hardness characteristics of cocoa butters from different geographic regions. J. Am. Oil Chem. Soc. 66, 1771–1776. doi: 10.1007/BF02660745
Cheesbrough, T. M. (1989). Changes in the enzymes for fatty acid synthesis and desaturation during acclimation of developing soybean seeds to altered growth temperature. Plant Physiol. 90, 760–764. doi: 10.1104/pp.90.2.760
Christie, W. (1982). A simple procedure for rapid transmethylation of glycerolipids and cholesteryl esters. J. Lipid Res. 23, 1072–1075.
Christie, W. (1989). Gas chromatography and lipids, A practical guide. Ayr: Oily Press. doi: 10.1016/0031-9422(89)80324-3
Cilas, C., Machado, R., Motamayor, J. C. (2010). Relations between several traits linked to sexual plant reproduction in Theobroma cacao L.: number of ovules per ovary, number of seeds per pod, and seed weight. Tree Genet. Genomes. 6, 219–226. doi: 10.1007/s11295-009-0242-9
Cornejo, O. E., Yee, M.-C., Dominguez, V., Andrews, M., Sockell, A., Strandberg, E., et al. (2018). Population genomic analyses of the chocolate tree, Theobroma cacao L., provide insights into its domestication process. Commun. Biol. 1, 167. doi: 10.1038/s42003-018-0168-6
Dar, A. A., Choudhury, A. R., Kancharla, P. K., Arumugam, N. (2017). The FAD2 gene in plants: occurrence, regulation, and role. Front. Plant Sci. 8, 1–16. doi: 10.3389/fpls.2017.01789
Du, H., Huang, M., Hu, J., Li, J. (2016). Modification of the fatty acid composition in Arabidopsis and maize seeds using a stearoyl-acyl carrier protein desaturase-1 (ZmSAD1) gene. BMC Plant Biol. 16, 137. doi: 10.1186/s12870-016-0827-z
DuVal, A., Gezan, S. A. S. A., Mustiga, G., Stack, C., Marelli, J.-P., Chaparro, J., et al. (2017). Genetic parameters and the impact of off-types for Theobroma cacao L. In a breeding program in Brazil. Front. Plant Sci. 8, 1–12. doi: 10.3389/fpls.2017.02059
Ghanevati, M., Jaworski, J. G. (2002). Engineering and mechanistic studies of the Arabidopsis FAE1 β-ketoacyl-CoA synthase, FAE1 KCS. Eur. J. Biochem. 269, 3531–3539. doi: 10.1046/j.1432-1033.2002.03039.x
Gilabert-Escrivá, M. V., Gonçalves, L. A. G., Silva, C. R. S., Figueira, A. (2002). Fatty acid and triacylglycerol composition and thermal behaviour of fats from seeds of Brazilian Amazonian Theobroma species. J. Sci. Food Agric. 82, 1425–1431. doi: 10.1002/jsfa.1107
Hemingway, J., Eskandari, M., Rajcan, I. (2015). Genetic and environmental effects on fatty acid composition in soybeans with potential use in the automotive industry. Crop Sci. 55, 658–668. doi: 10.2135/cropsci2014.06.0425
Jasinski, S., Lécureuil, A., Miquel, M., Loudet, O., Raffaele, S., Froissard, M., et al. (2012). Natural variation in seed very long chain fatty acid content is controlled by a new isoform of KCS18 in Arabidopsis thaliana. PLoS One. 7, e49261 doi: 10.1371/journal.pone.0049261
Jaworski, J. G., Stumpf, P. K. (1974). Fat metabolism in higher plants. Properties of a soluble stearyl-acyl carrier protein desaturase from maturing Carthamus tinctorius. Arch. Biochem. Biophys. 162, 158–165. doi: 10.1016/0003-9861(74)90114-3
Kachroo, A., Shanklin, J., Whittle, E., Lapchyk, L., Hildebrand, D., Kachroo, P. (2007). The Arabidopsis stearoyl-acyl carrier protein-desaturase family and the contribution of leaf isoforms to oleic acid synthesis. Plant Mol. Biol. 63, 257–271. doi: 10.1007/s11103-006-9086-y
Kachroo, A., Venugopal, S. C., Lapchyk, L., Falcone, D., Hildebrand, D., Kachroo, P. (2004). Oleic acid levels regulated by glycerolipid metabolism modulate defense gene expression in Arabidopsis. Proc. Natl. Acad. Sci. U. S. A. 101, 5152–5157. doi: 10.1073/pnas.0401315101
Knutzon, D. S., Thompson, G. A., Radke, S. E., Johnson, W. B., Knauf, V. C., Kridl, J. C. (1992). Modification of Brassica seed oil by antisense expression of a stearoyl-acyl carrier protein desaturase gene. Proc. Natl. Acad. Sci. U. S. A. 89, 2624–2628. doi: 10.1073/pnas.89.7.2624
Koo, A. J. K., Ohlrogge, J. B., Pollard, M. (2004). On the export of fatty acids from the chloroplast. J. Biol. Chem. 279, 16101–16110. doi: 10.1074/jbc.M311305200
Kumar, S., Stecher, G., Tamura, K. (2016). MEGA7: Molecular Evolutionary Genetics Analysis Version 7.0 for Bigger Datasets. Mol. Biol. Evol. 33, 1870–1874. doi: 10.1093/molbev/msw054
Leathers, R. R., Scragg, A. H. (1989). The effect of different temperatures on the growth, lipid content and fatty acid composition of. Plant Sci. 62, 217–227. doi: 10.1016/0168-9452(89)90084-8
Lehrian, D. W., Keeney, P. G., Butler, D. R. (1980). Triglyceride characteristics of cocoa butter from cacao fruit matured in a microclimate of elevated temperature1. J. Am. Oil Chem. Soc. 57, 66–69. doi: 10.1007/BF02674362
Li-Beisson, Y., Shorrosh, B., Beisson, F., Andersson, M. X., Arondel, V., Bates, P. D., et al. (2013). Acyl-lipid metabolism. Arabidopsis Book 11, e0161–e0161. doi: 10.1199/tab.0161
Li, J., Ji, L. (2005). Adjusting multiple testing in multilocus analyses using the eigenvalues of a correlation matrix. Heredity (Edinb). 95, 221. doi: 10.1038/sj.hdy.6800717
Liendo, R., Padilla, F. C., Quintana, A. (1997). Characterization of cocoa butter extracted from Criollo cultivars of Theobroma cacao L. Food Res. Int. 30, 727–731. doi: 10.1016/S0963-9969(98)00025-8
Lightner, J., Wu, J., Browse, J. A. (1994). A mutant of Arabidopsis with increased levels of stearic acid. Plant Physiol. 106, 1443–1451. doi: 10.1104/pp.106.4.1443
Lipp, M., Anklam, E. (1998). Review of cocoa butter and alternative fats for use in chocolate—Part A. Compositional data. Food Chem. 62, 73–97. doi: 10.1016/S0308-8146(97)00160-X
Lipp, M., Simoneau, C., Ulberth, F., Anklam, E., Crews, C., Brereton, P., et al. (2001). Composition of genuine cocoa butter and cocoa butter equivalents. J. Food Compos. Anal. 14, 399–408. doi: 10.1006/jfca.2000.0984
Livingstone, D., Royaert, S., Stack, C., Mockaitis, K., May, G., Farmer, A., et al. (2015). Making a chocolate chip: development and evaluation of a 6K SNP array for Theobroma cacao. DNA Res. 22, 279–291. doi: 10.1093/dnares/dsv009
Lockwood, G., Owusu-Ansah, F., Adu-Ampomah, Y. (2007). Heritability of single plant yield and incidence of black pod disease in cocoa. Exp. Agric. 43, 455–462. doi: 10.1017/S0014479707005352
Lynch, M., Walsh, B. (1998). “Genetics and Analysis of Quantitative Traits,” in Genetics and Analysis of Quantitative Traits (New York: Oxford University Press), 980. doi: 10.1086/318209
McHenry, L., Fritz, P. J. (1987). Cocoa butter biosynthesis: effect of temperature on Theobroma cacao acyltransferases. J. Am. Oil Chem. Soc 64, 1012–1015. doi: 10.1007/BF02542440
Mckelvie, A. D. (1956). Cherelle wilt of cacao: I. Pod development and its relation to wilt. J. Exp. Bot. 7, 252–263. doi: 10.1093/jxb/7.2.252
Millar, A. A., Kunst, L. (1997). Very-long-chain fatty acid biosynthesis is controlled through the expression and specificity of the condensing enzyme. Plant J. 12, 121–131. doi: 10.1046/j.1365-313X.1997.12010121.x
Motamayor, J. C., Lachenaud, P., da Silva e Mota, J. W., Loor, R., Kuhn, D. N., Brown, J. S., et al. (2008). Geographic and genetic population differentiation of the Amazonian Chocolate Tree (Theobroma cacao L). PLoS One 3, e3311. doi: 10.1371/journal.pone.0003311
Motamayor, J. C., Mockaitis, K., Schmutz, J., Haiminen, N., Livingstone, D., Cornejo, O., et al. (2013). The genome sequence of the most widely cultivated cacao type and its use to identify candidate genes regulating pod color. Genome Biol. 14, r53. doi: 10.1186/gb-2013-14-6-r53
Motamayor, J. C., Risterucci, A. M., Lopez, P. A., Ortiz, C. F., Moreno, A., Lanaud, C. (2002). Cacao domestication I: the origin of the cacao cultivated by the Mayas. Heredity (Edinb). 89, 380–386. doi: 10.1038/sj.hdy.6800156
Mozaffarian, D., Micha, R., Wallace, S. (2010). Effects on coronary heart disease of increasing polyunsaturated fat in place of saturated fat: a systematic review and meta-analysis of randomized controlled trials. PLoS Med. 7, e1000252. doi: 10.1371/journal.pmed.1000252
Mustiga, G. M., Gezan, S. A., Phillips-mora, W., Arciniegas-leal, A., Mata-quirós, A., Motamayor, J. C. (2018). Phenotypic description of Theobroma cacao L. for yield and vigor traits from 34 hybrid families in costa rica based on the genetic basis of the parental population. Front. Plant Sci. 9, 1–17. doi: 10.3389/fpls.2018.00808
Naik, B., Kumar, V. (2014). Cocoa butter and its alternatives: a review. J. Bioresour. Eng. Technol. 2, 1–11.
Ndoumbé, M., Bieysse, D., Cilas, C. (2001). Multi-trait selection in a diallel crossing scheme of cocoa. Plant Breed. 120, 365–367. doi: 10.1046/j.1439-0523.2001.00590.x
Ofori, A., Padi, F. K., Ansah, F. O., Akpertey, A., Anim-Kwapong, G. J. (2016). Genetic variation for vigour and yield of cocoa (Theobroma cacao L.) clones in Ghana. Sci. Hortic. (Amsterdam). 213, 287–293. doi: 10.1016/j.scienta.2016.11.003
Ohlrogge, J., Browse, J. (1995). Lipid biosynthesis. Plant Cell. 7, 957–970. doi: 10.1105/tpc.7.7.957
Padi, F. K., Ofori, A., Arthur, A. (2017). Genetic variation and combining abilities for vigour and yield in a recurrent selection programme for cacao. J. Agric. Sci. 155, 444–464. doi: 10.1017/S0021859616000459
Patel, V. K., Shanklin, J., Rtek, D. B. (1994). Changes in fatty-acid composition and stearoyl-acyl carrier protein desaturase expression in developing Theobroma cacao L. embryos. Planta. 193, 83–88. doi: 10.1007/BF00191610
Pidkowich, M. S., Nguyen, H. T., Heilmann, I., Ischebeck, T., Shanklin, J. (2007). Modulating seed β-ketoacyl-acyl carrier protein synthase II level converts the composition of a temperate seed oil to that of a palm-like tropical oil. Proc. Natl. Acad. Sci. U. S. A. 104, 4742–4747. doi: 10.1073/pnas.0611141104
Pires, J. L., Cascardo, J. C. M., Lambert, S. V., Figueira, A. (1998). Increasing cocoa butter yield through genetic improvement of Theobroma cacao L.: seed fat content variability, inheritance, and association with seed yield. Euphytica 103, 115–121. doi: 10.1023/A:1018327411530
Romero Navarro, J. A., Phillips-Mora, W., Arciniegas-Leal, A., Mata-Quirós, A., Haiminen, N., Mustiga, G., et al. (2017). Application of genome wide association and genomic prediction for improvement of cacao productivity and resistance to black and frosty pod diseases. Front. Plant Sci. 8, 1905. doi: 10.3389/fpls.2017.01905
Royaert, S., Jansen, J., da Silva, D. V., de Jesus Branco, S. M., Livingstone, D. S., Mustiga, G., et al. (2016). Identification of candidate genes involved in witches’ broom disease resistance in a segregating mapping population of Theobroma cacao L. in Brazil. BMC Genomics. 17, 107. doi: 10.1186/s12864-016-2415-x
Seguine, E., Mills, D., Marelli, J.-P., Motamayor-Arias, J. C., Coelho, I. D. S. (2014). Micro-fermentation of cocoa. Intl. Patent No. WO 2013/025621 A1. 1 Mar. 2015.
Stack, J. C., Royaert, S., Gutiérrez, O., Nagai, C., Holanda, I. S. A., Schnell, R., et al. (2015). Assessing microsatellite linkage disequilibrium in wild, cultivated, and mapping populations of Theobroma cacao L. and its impact on association mapping. Tree Genet. Genomes. 11, 19.doi: 10.1007/s11295-015-0839-0
Torres-Moreno, M., Torrescasana, E., Salas-Salvadó, J., Blanch, C. (2015). Nutritional composition and fatty acids profile in cocoa beans and chocolates with different geographical origin and processing conditions. Food Chem. 166, 125–132. doi: 10.1016/j.foodchem.2014.05.141
Turnbull, C. J., Hadley, P. (2019). International Cocoa Germplasm Database (ICGD). [Online Database]. UK: CRA Ltd./ICE Futures Europe/University of Reading. Available at: http://www.icgd.reading.ac.uk.
Utro, F., Haiminen, N., Livingstone, D., Cornejo, O. E., Royaert, S., Schnell, R. J., et al. (2013). IXora: exact haplotype inferencing and trait association. BMC Genet. 14, 48. doi: 10.1186/1471-2156-14-48
Van Ooijen, J. W. (2006). JoinMap ® 4 Software for the calculation of genetic linkage maps in experimental populations. JoinMap. Wageningen: Plant Research International. doi: 10.1016/j.actbio.2006.02.004
Van Ooijen, J. W. (2011). Multipoint maximum likelihood mapping in a full-sib family of an outbreeding species. Genet. Res. (Camb). 93, 343–349. doi: 10.1017/S0016672311000279
Vázquez-Ovando, A., Molina-Freaner, F., Nuñez-Farfán, J., Betancur-Ancona, D., Salvador-Figueroa, M. (2015). Classification of cacao beans (Theobroma cacao L.) of southern Mexico based on chemometric analysis with multivariate approach. Eur. Food Res. Technol. 240, 1117–1128. doi: 10.1007/s00217-015-2415-0
Voorrips, R. E. (2002). MapChart: software for the graphical presentation of linkage maps and QTLs. J. Hered. 93, 77–78. doi: 10.1093/jhered/93.1.77
VSN International. (2015). Genstat for Windows 18th Edition. 18th ed. Hemel Hepstead, UK: VSN International. Available at: Genstat.co.uk.
Wang, M. L., Khera, P., Pandey, M. K., Wang, H., Qiao, L., Feng, S., et al. (2015). Genetic mapping of QTLs controlling fatty acids provided insights into the genetic control of fatty acid synthesis pathway in peanut (Arachis hypogaea L.). PLoS One. 10, e0119454. doi: 10.1371/journal.pone.0119454
Wintgens, J. N. (1992). Influence of genetic factors and agroclimatic conditions on the quality of cocoa. In International Congress on Cocoa and Chocolate 1991: Munich, Germany.
Xie, L., Hu, J., Zhang, Q., Sun, Q., Zhang, Y., Niu, L. (2019). Influence of pollen sources on the expression of FA and TAG biosynthetic pathway genes in seeds of Paeonia rockii during the rapid oil accumulation. Sci. Hortic. (Amsterdam). 243, 477–483. doi: 10.1016/j.scienta.2018.09.002
Yeilaghi, H., Arzani, A., Ghaderian, M., Fotovat, R., Feizi, M., Pourdad, S. S. (2012). Effect of salinity on seed oil content and fatty acid composition of safflower (Carthamus tinctorius L.) genotypes. Food Chem. 130, 618–625. doi: 10.1016/j.foodchem.2011.07.085
Zhang, Y., Maximova, S. N., Guiltinan, M. J. (2015). Characterization of a stearoyl-acyl carrier protein desaturase gene family from chocolate tree, Theobroma cacao L. Front. Plant Sci. 6, 239. doi: 10.3389/fpls.2015.00239
Keywords: cacao, fat content, fatty acid composition, weather, QTL, SNP, linkage mapping, heritability
Citation: Mustiga GM, Morrissey J, Stack JC, DuVal A, Royaert S, Jansen J, Bizzotto C, Villela-Dias C, Mei L, Cahoon EB, Seguine E, Marelli JP and Motamayor JC (2019) Identification of Climate and Genetic Factors That Control Fat Content and Fatty Acid Composition of Theobroma cacao L. Beans. Front. Plant Sci. 10:1159. doi: 10.3389/fpls.2019.01159
Received: 19 July 2018; Accepted: 26 August 2019;
Published: 14 October 2019.
Edited by:
Raul De La Rosa, IFAPA Centro Alameda del Obispo, SpainReviewed by:
Ahmad Arzani, Isfahan University of Technology, IranAlfredo Vázquez-Ovando, Autonomous University of Chiapas, Mexico
Copyright © 2019 Mustiga, Morrissey, Stack, DuVal, Royaert, Jansen, Bizzotto, Villela-Dias, Mei, Cahoon, Seguine, Marelli and Motamayor. This is an open-access article distributed under the terms of the Creative Commons Attribution License (CC BY). The use, distribution or reproduction in other forums is permitted, provided the original author(s) and the copyright owner(s) are credited and that the original publication in this journal is cited, in accordance with accepted academic practice. No use, distribution or reproduction is permitted which does not comply with these terms.
*Correspondence: Juan Carlos Motamayor, anVhbi5tb3RhbWF5b3IxQGVmZmVtLmNvbQ==