 László Ivanizs1†
 István Monostori1†
 András Farkas1Mária Megyeri1
 Péter Mikó1
 Edina Türkösi1
 Eszter Gaál1Andrea Lenykó-Thegze1
 Kitti Szőke-Pázsi1
 Éva Szakács1
 Éva Darkó1Tibor Kiss1Andrzej Kilian2
 István Molnár1,3*
- 1Agricultural Institute, Centre for Agricultural Research, Martonvásár, Hungary
- 2University of Canberra, Diversity Array Technologies, Canberra, ACT, Australia
- 3Institute of Experimental Botany, Center of the Region Haná for Biotechnological and Agricultural Research, Olomouc, Czechia
Understanding the genetic diversity of Aegilops biuncialis, a valuable source of agronomical useful genes, may significantly facilitate the introgression breeding of wheat. The genetic diversity and population structure of 86 Ae. biuncialis genotypes were investigated by 32700 DArT markers with the simultaneous application of three statistical methods— neighbor-joining clustering, Principal Coordinate Analysis, and the Bayesian approach to classification. The collection of Ae. biuncialis accessions was divided into five groups that correlated well with their eco-geographic habitat: A (North Africa), B (mainly from Balkans), C (Kosovo and Near East), D (Turkey, Crimea, and Peloponnese), and E (Azerbaijan and the Levant region). The diversity between the Ae. biuncialis accessions for a phenological trait (heading time), which is of decisive importance in the adaptation of plants to different eco-geographical environments, was studied over 3 years. A comparison of the intraspecific variation in the heading time trait by means of analysis of variance and principal component analysis revealed four phenotypic categories showing association with the genetic structure and geographic distribution, except for minor differences. The detailed exploration of genetic and phenologic divergence provides an insight into the adaptation capacity of Ae. biuncialis, identifying promising genotypes that could be utilized for wheat improvement.
Introduction
The genome of wild relatives of common wheat (Triticum aestivum L.) can be considered as a potential reservoir of gene variants for wheat improvement (Schneider et al., 2008; Zhang et al., 2015; Kishii, 2019). Interspecific hybridization is a promising approach to enlarge the genetic diversity of cultivated bread wheat by the chromosome-mediated transfer of the wild alleles present in related species (Jauhar, 1993; Jauhar and Chibbar, 1999; Kishii, 2019). Goatgrasses (Aegilops), which comprise 11 diploid, 10 tetraploid, and 2 hexaploid species, are the closest relatives of Triticum (van Slageren, 1994). Seven different genomes (D, S, U, C, N, M, and T) were identified in the diploid species, indicating the extreme genetic diversity of the genus. Accessions of several Aegilops species are highly resistant to important cereal diseases (Friebe et al., 1996; Marais et al., 2006; Bansal et al., 2017; Olivera et al., 2018), while others shows good tolerance of abiotic stresses such as salt, drought, frost, and heat stress (Rekika et al., 1997; Zaharieva et al., 2001a; Zaharieva et al., 2001b; Molnár et al., 2004; Colmer et al., 2006; Dulai et al., 2014). Some alleles associated with these agronomic traits have already been introgressed from Aegilops into the wheat gene pool by the development of wheat-Aegilops hybrids and addition or translocation lines (Schneider et al., 2008; Marais et al., 2009; Liu et al., 2011a; Liu et al., 2011b; Olson et al., 2013). However, the genetic potential of Aegilops is still largely underutilized. In the case of biotic stresses, the 41 resistance genes that have so far been integrated into the wheat genome originated from only 30 accessions from 12 Aegilops species, most of them belonging to the primary gene pool of hexaploid wheat (Zhang et al., 2015). There are numerous Aegilops accessions in gene banks in various parts of the world (Monneveux et al., 2000) that have not yet been utilized for wheat improvement, so their introduction into breeding programs would be desirable.
The annual allotetraploid Aegilops biuncialis Vis. (2n = 4x = 28; UbUbMbMb) is largely autogamous and belongs to the tertiary gene pool of bread wheat (Friebe et al., 1996). Ae. biuncialis is native to Mediterranean and Western Asiatic regions and populations can be found in the Aegean, Turkey, Bulgaria, Cyprus, in the western part of the Fertile Crescent, in Cis- and Transcaucasia, and in the southern parts of Russia and Ukraine (van Slageren, 1994; Kilian et al., 2011). The annual rainfall in these habitats ranges from 225–1250 mm and some of them are characterized by a dry summer season with high temperature and high irradiance (van Slageren, 1994). The wide eco-geographical distribution suggests the presence of great diversity in the phenological traits of Ae. biuncialis. The heading time, as one of the main phenological factors, is crucial for the ecological adaptation of plants to local conditions. Early flowering, as an avoidance mechanism, may have a major role in the adaptation of plants to a Mediterranean climate by allowing them to escape drought (Araus et al., 2004). The adaptation strategy of wild emmer wheat populations to natural habitats that are characterized by frequent high temperatures in spring includes early flowering (Peleg et al., 2005), while adaptation to habitats with high altitudes involves late heading. Nevertheless, no data have been published on the intraspecific variation of heading time in accessions representing the broad ecological adaptability of Ae. biuncialis, which exhibits great genetic diversity.
The genetic diversity of wild species that are gene sources for cultivated wheat is a critical component of research in evolution, population genetics, conservation and breeding (Tahernezhad et al., 2010; Wang et al., 2013; Arora et al., 2017; Edet et al., 2018; Etminan et al., 2019; Singh et al., 2019). Little has been reported about the genetic diversity of Ae. biuncialis. Studies based on amplified fragment length polymorphism (AFLP), sequence-specific amplified polymorphism, random amplified polymorphic DNA, and inter-simple sequence repeat molecular markers were used to reveal the genetic variability within the genome of Ae. biuncialis accessions (Okuno et al., 1998; Monte et al., 2001; Nagy et al., 2006; Thomas and Bebeli, 2010), but Nagy et al. (2006) concluded that the marker data of only 10 accessions cannot demonstrate the existing genetic variability in Ae. biuncialis, so it is essential to investigate a larger diverse collection of genotypes with high marker density for the comprehensive study of genetic diversity. The 5–10 accessions so far assessed using a larger number of loci all originated from narrow geographical regions (Greece, the Iberian Peninsula or Transcaucasia), so do not represent the wide distribution of the species and do not allow an objective picture to be obtained of the genetic diversity existing within Ae. biuncialis (Okuno et al., 1998; Monte et al., 2001; Thomas and Bebeli, 2010). Moreover, different parts of the genome may have undergone different evolutionary changes (Kellogg et al., 1996). In the Triticeae, structural rearrangements frequently occur in the pericentric region of the chromosomes after polyploidization (Qi et al., 2006), as also revealed in Ae. biuncialis accessions (Molnár et al., 2011). Additionally, the frequency of recombination and the rate of interstitial deletions and insertions of gene loci is much higher in the distal third of the chromosomes than in the proximal two-thirds (Dvorak and Akhunov, 2005). As a consequence, only part of the genetic polymorphisms present in the species can be detected if the genome is not sufficiently covered by molecular markers.
Diversity Array Technology (DArT) was originally developed as a hybridization-based microarray platform to detect polymorphism at the recognition sites of methylation-sensitive restriction enzymes (Jaccoud et al., 2001; Wenzl et al., 2004). More recently, a combination of this genome complexity reduction approach of DArT technology with next-generation sequencing technologies resulted in a sequence-independent, low-cost, high-throughput genotyping by sequencing platform allowing the simultaneous detection of several thousands of polymorphic loci spread over the genome (Wenzl et al., 2004; Tinker et al., 2009; Sansaloni et al., 2011; Kilian et al., 2012). The advanced DArTseq technology has been efficiently utilized for genotyping, genetic diversity analysis, genome-wide association studies and linkage mapping in cultivated and wild relatives of wheat such as Triticale (Badea et al., 2011), rye (Bolibok-Brągoszewska et al., 2014; Gawroński et al., 2016), barley (Comadran et al., 2011), Tibetan wild barley (Cai et al., 2013), durum wheat (Baloch et al., 2017), Aegilops tauschii (Kumar et al., 2015), Triticum monococcum (Jing et al., 2009), and hexaploid wheat cultivars (Nielsen et al., 2014; Monostori et al., 2017).
In the present work, genetic diversity and its association with the phenotypic variation in heading time were studied in a collection of 86 Ae. biuncialis genotypes to obtain a better understanding of the background of its genotypic and phenotypic diversification. To achieve this goal, the genetic relationships between the accessions were analyzed using three statistical methods after the DArTseq genotyping of the plants. Furthermore, the phenological variation pattern was compared with the genetic structure and eco-geographical distribution to obtain information on possible correlations between them. The comprehensive study of how changes in phenological traits relate with genetic diversity will facilitate the utilization of the enhanced adaptability of Ae. biuncialis, especially in the light of climate change.
Materials and Methods
Plant Material
Eighty-six wild Ae. biuncialis Vis. (2n = 4x = 28, UbUbMbMb) accessions, collected from 64 sites in 16 countries from Libya to Azerbaijan, were genotyped together with the Mv9kr1 wheat accession on a DArTseq® platform (Table 1 and Supplementary Table S1). This population, originating from a wide range of ecological habitats, is representative of the geographical distribution of the species. The Aegilops genotypes were provided by the following germplasm collections: Genebank of the Agricultural Institute, Agrártudományi Kutatóközpont (ATK) (Martonvásár, Hungary), Wheat Genetics Resource Center (Kansas State University, USA), United States Department of Agriculture Agricultural Research Service (Beltsville, MD, USA), and Institute of Plant Genetics and Crop Plant Research (Gatersleben, Germany). The A. biuncialis accessions were maintained and grown in the Department of Plant Genetic Resources of ATK Mezőgazdasági Intézet. To avoid hybridization and intercrossing between the genotypes, the isolated accessions were multiplicated by self-fertilization.
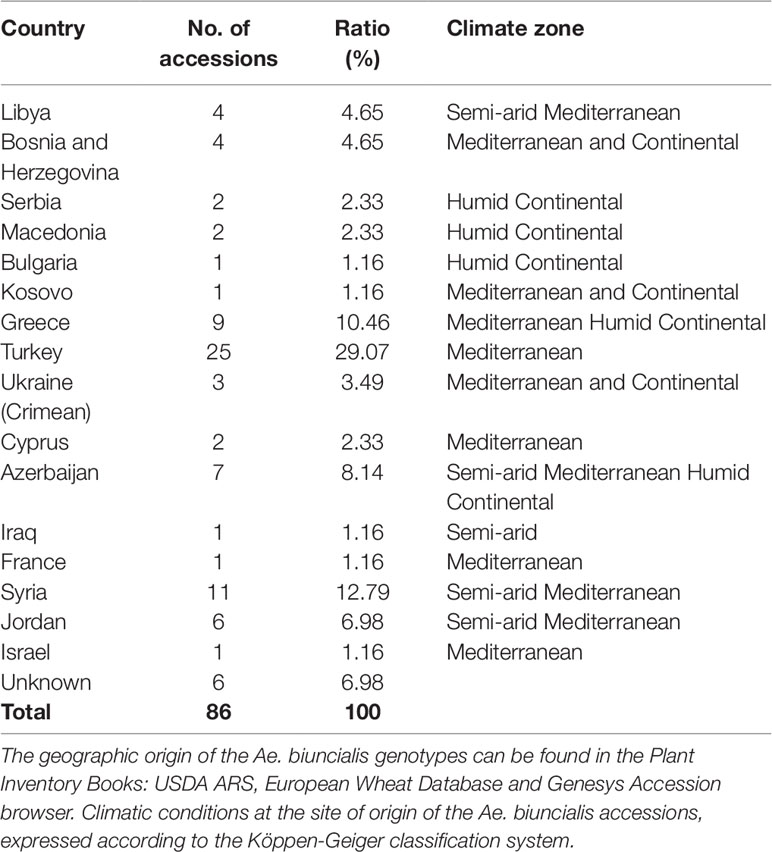
Table 1 Geographic distribution of the A. biuncialis collection maintained in Martonvásár.
Field Experiments
The collection of 86 Ae. biuncialis accessions was grown under field conditions in three consecutive seasons (2015–16, 2016–17, and 2017–18). The seeds were planted in fall in fields belonging to the Agricultural Institute of ATK (Breeders nursery, Martonvásár, Hungary, geographic coordinates: 47°19’39”N, 18°47’01”E). The soil type at each location was chernozem. Each genotype was grown in a 6 m2 plot with 6 × 3 m rows, 50 seeds per row, and a row distance of 0.15 m, as previously described by Mikó et al. (2014). The heading time of each plot was recorded and defined as the period elapsing between January 1 and the day when 50% of the inflorescences reached the DEV59 developmental stage (Tottman, 1987).
Additionally, to monitor the stay-green ability of the plants, the leaf chlorophyll content of each Ae. biuncialis genotype was determined twice (on May 12 and 31, 2018) during the grain-filling period using a Soil Plant Analysis Development 502 cholorophyll meter (Minolta Camera Co., Ltd, Tokyo, Japan). At least 10 leaves were measured from randomly selected plants for each genotype on each occasion. For each leaf, the average of three SPAD readings around the midpoints of the flag leaf was taken.
DNA Extraction and Genotyping
Genomic DNA was extracted from young leaves of 86 Ae. biuncialis genotypes together with hexaploid wheat (Triticum aestivum L.) genotype Mv9kr1 using Quick Gene-Mini80 (FujiFilm, Japan) with a QuickGene DNA tissue kit (FujiFilm, Japan) according to the manufacturer’s instructions (Cseh et al., 2011).
The DNA of the Ae. biuncialis accessions and the Mv9kr1 wheat genotype was sent for a high-throughput genotyping commercial service to Diversity Arrays Technologies Pty. Ltd., Australia (www.diversityarrays.com). The “wheat DArTseq™ 1.0” genotyping by sequencing service was optimized for wheat. This method used the combination of complexity reduction methods developed initially for array-based DArT and multiplex sequencing in Illumina HiSeq2500 instrument (Sansaloni et al., 2011; Kilian et al., 2012). Briefly, DArT markers are DNA fragments obtained by the genome complexity reduction method contains the digestion of genomic DNA by PstI/TaqI endonucleases, ligation of the genomic fragments to a PstI adapter, amplification using a primer complementer with the adaptor sequence and transformation into Escherichia coli. DNA fragments obtained by this genome complexity reduction method were sequenced by Illumina HiSeq2500.
The markers developed by the above mentioned “wheat DArTseq™ 1.0” genotyping by sequencing platform have been included in Supplementary Data S1. The obtained silicoDArT marker set was filtered on the basis of individual marker-related statistics. After removing markers with inappropriate quality control parameters, including call rate <90%, reproducibility <95% and minor allele frequency < 2%, the 0/1 binary matrix of the remaining 32,700 markers was used in the subsequent analysis.
Analysis of Population Structure and Phylogenetic Relationship
In order to assess the population structure of the Ae. biuncalis accessions, three different statistical methods were adopted and compared. First, a clustering approach based on the Bayesian model was applied to estimate the real number of subpopulations (K) using the admixture model of STRUCTURE software 2.3.4 with correlated allele frequencies (Pritchard et al., 2000). Three independent runs were performed for each hypothetical number of subpopulations (K) from one to eight applying a burn-in period of 100,000 iterations followed by 100,000 Markov Chain Monte Carlo iterations to obtain a precise parameter estimate. The most probable number of subpopulations was determined by means of the ΔK method using STRUCTURE HARVESTER software (Evanno et al., 2005). Each genotype was assigned to one subpopulation based on its membership probability. Principal coordinate analysis was then carried out using PAST software version 3.12 to visualize the genetic stratification within the Ae. biuncialis collection based on genetic correlations among individuals (Hammer et al., 2001). Thirdly, the phylogenetic relationship between the 86 accessions was estimated using PAST software with the neighbor-joining method based on marker data. The genetic distance matrix based on Jaccard’s similarity coefficient was applied to construct a phylogenetic tree. The neighbor-joining dendrogram was generated using bootstrap analysis with 1,000 replicates. The wheat genotype Mv9kr1 was used as outgroup species in order to define the root position of the phylogenetic tree.
Statistical Analysis
The phenotypic values of the Ae. biuncialis accessions were grouped based on the subpopulations obtained in the STRUCTURE cluster analysis. The variations in heading time among the subpopulations were analyzed for 3 years using descriptive statistics: mean, standard deviation, boxplot, and histogram (Excel 2016, Microsoft Company).
One-way analysis of variance (ANOVA) (SPSS 16.0, IBM) was conducted to compare the heading time of the Ae. biuncialis subpopulations in each year at the P < 0.05 significance level. In addition, the significant differences in the heading time of each subpopulation were examined among the 3 years by means of one-way ANOVA (SPSS 16.0). Bivariate correlation of the heading times of the Ae. biuncialis accessions among the 3 years was analyzed pair-wise by means of Pearson coefficient (SPSS 16.0). Linear regression analysis was carried out for each subpopulation among the years.
The principal component analysis of the Statistica 6 software was used to study associations between the heading times of the Ae. biuncialis accessions by visualizing the grouping pattern of phenotypic variations.
The stay-green trait (delayed foliar senescence) was determined by calculating differences between the SPAD values measured on the two dates. Pearson and rank correlation (Spearman, Kendall tau) coefficients were applied to analyze the dependence and relationship between the heading time and the differences in SPAD values at the P < 0.01 significance level (SPSS 16.0).
Results
Population Stratification
A total of 47,777 polymorphic dominant silicoDArT markers were generated from 86 Ae. biuncialis accessions originating from different eco-geographical habitats (Supplementary Data S1). The silicoDArT marker set was filtered for various quality parameters (call rate, reproducibilty, minor allele frequency) and reduced to 32,700 markers. Based on the marker data, the genetic diversity in the Ae. biuncialis collection was analyzed using the Bayesian clustering approach performed with STRUCTURE software. After the STRUCTURE analysis had been run for K = 1 to K = 8, the most likely number of subpopulations was estimated with the STRUCTURE Harvester software following the ΔK method. The maximum ΔK value occurred at K = 5 (Figure 1 and Supplementary Figure S1). Each genotype was assigned to one of the subpopulations based on a membership probability coefficient > 0.51.
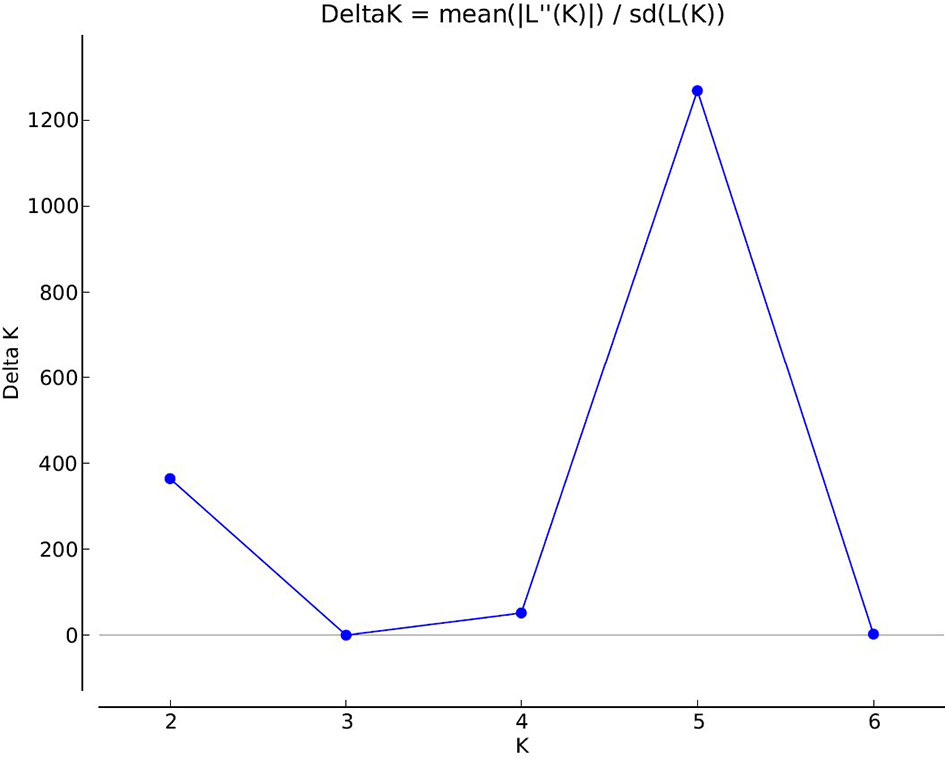
Figure 1 Estimation of the genetically most probable number of Ae. biuncialis subpopulations based on Evanno’s Delta K method (Evanno et al., 2005). The maximum value of delta K occurred at K = 5 indicates that the investigated Ae. biuncialis collection can be devided into five hypothetical subpopulations.
The Ae. biuncialis accessions were grouped into five clusters A, B, C, D, and E with 6, 14, 3, 31, and 29 accessions, respectively. Three accessions had mixed allelic patterns that could not be assigned to any of the subpopulations with a probability of more than 50% (mixed group). The accessions clustered in accordance with their origin: the accessions in cluster A originated mainly from North Africa; cluster B represented genotypes from the Central Balkans, North Greece, and West Turkey; the three genotypes in cluster C originated from different geographic regions (Balkans and Near East); cluster D contained accessions from Asia Minor, the Crimean Peninsula, and Southern Greece (Peloponnese); while cluster E comprised genotypes from the Levant region (Jordan, Syria, and South Turkey) and Azerbaijan (Figures 2 and 3).
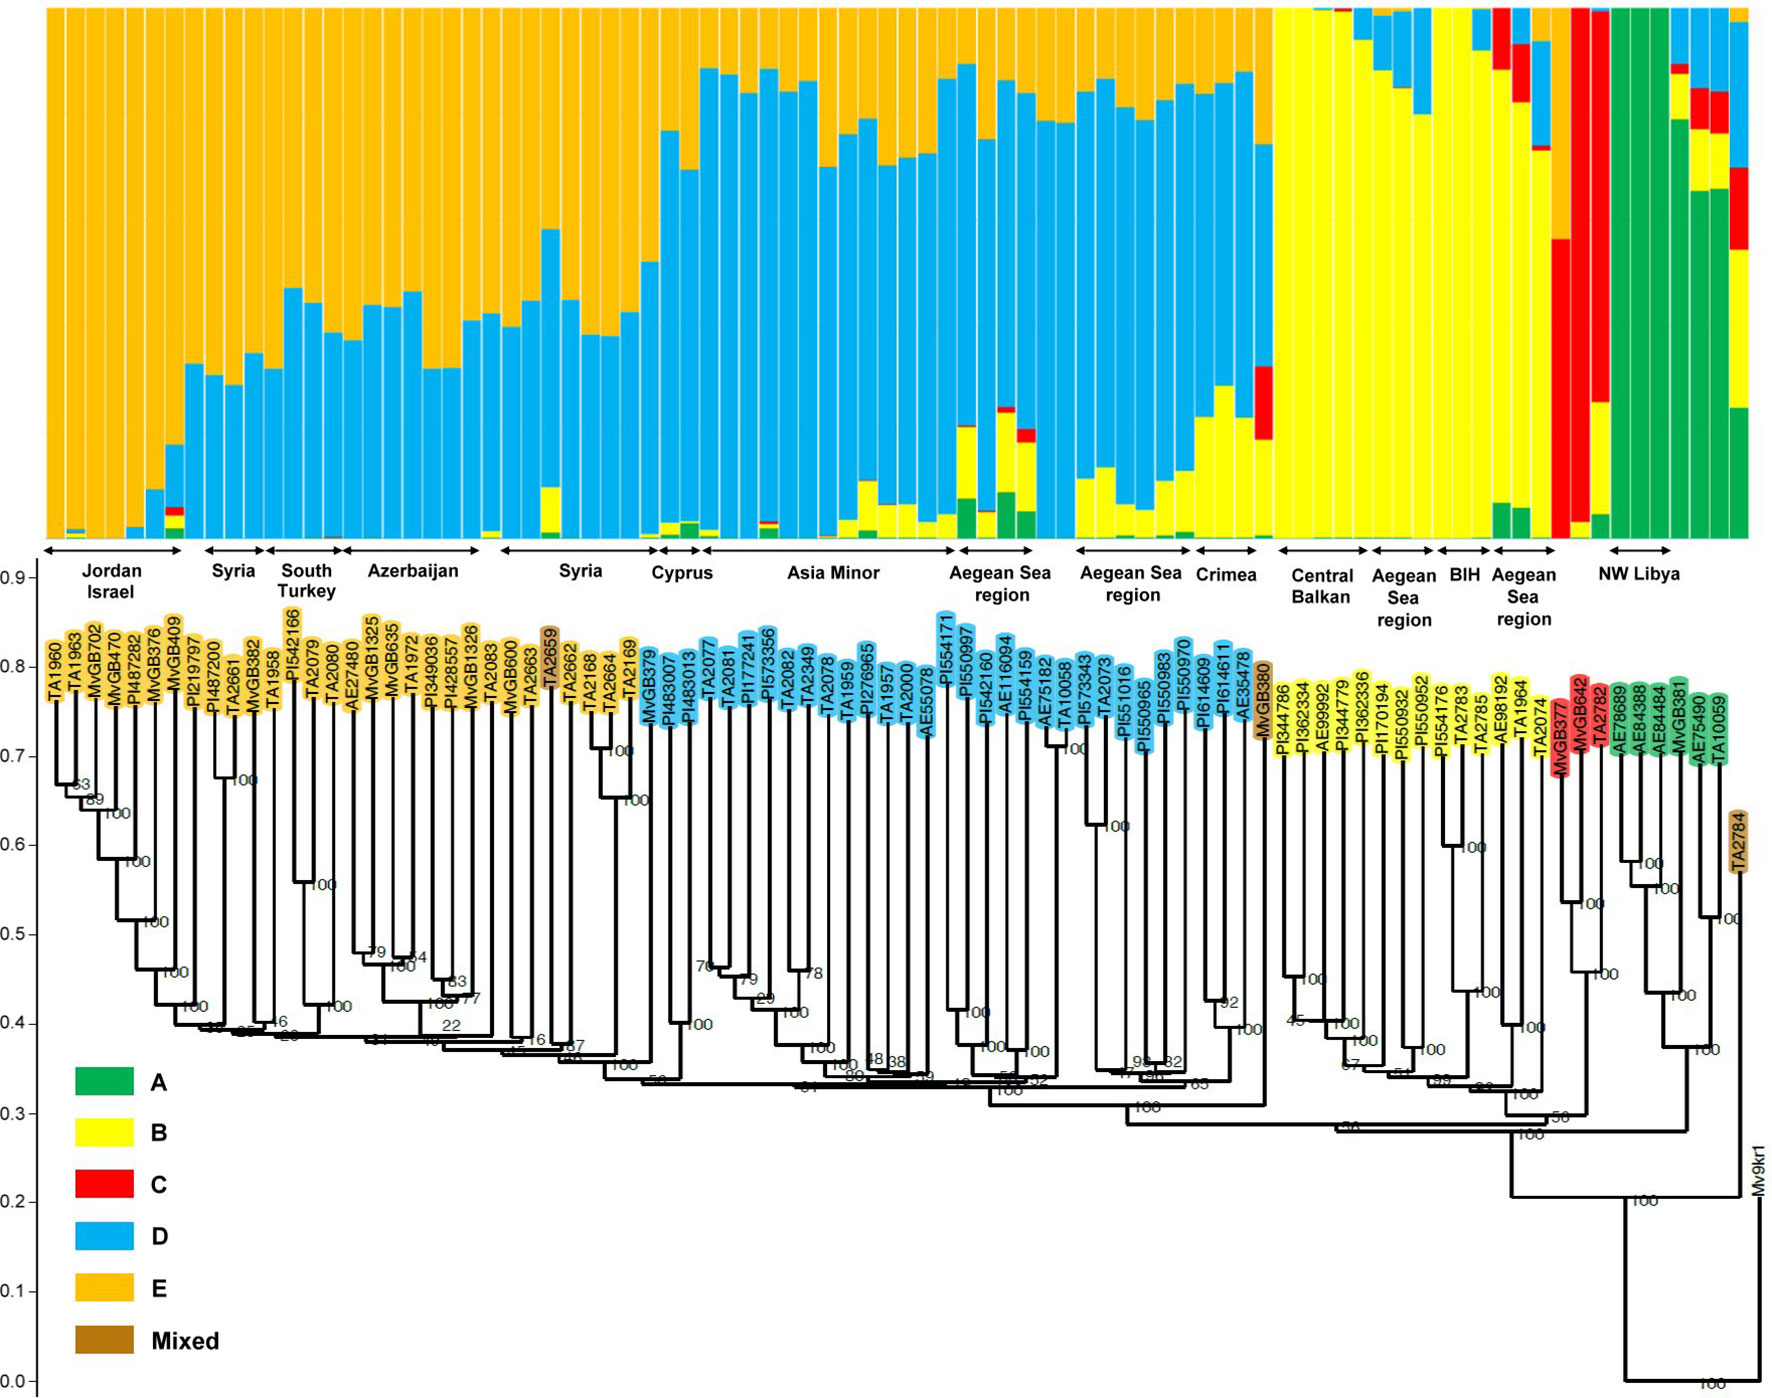
Figure 2 Comparison of grouping patterns based on STRUCTURE analysis at K = 5 and the neighbor-joining dendrogram in a collection of 86 Ae. biuncialis accessions. The order of the genotypes on the STRUCTURE plot matches that represented on the phylogenetic tree. The wheat genotype Mv9kr1 is represented as an outgroup accession in the dendrogram. Genotypes belonging to the same clade represent similar membership probability in the relevant subpopulation and are from a common area within the larger geographic regions. BIH: Bosnia and Herzegovina.
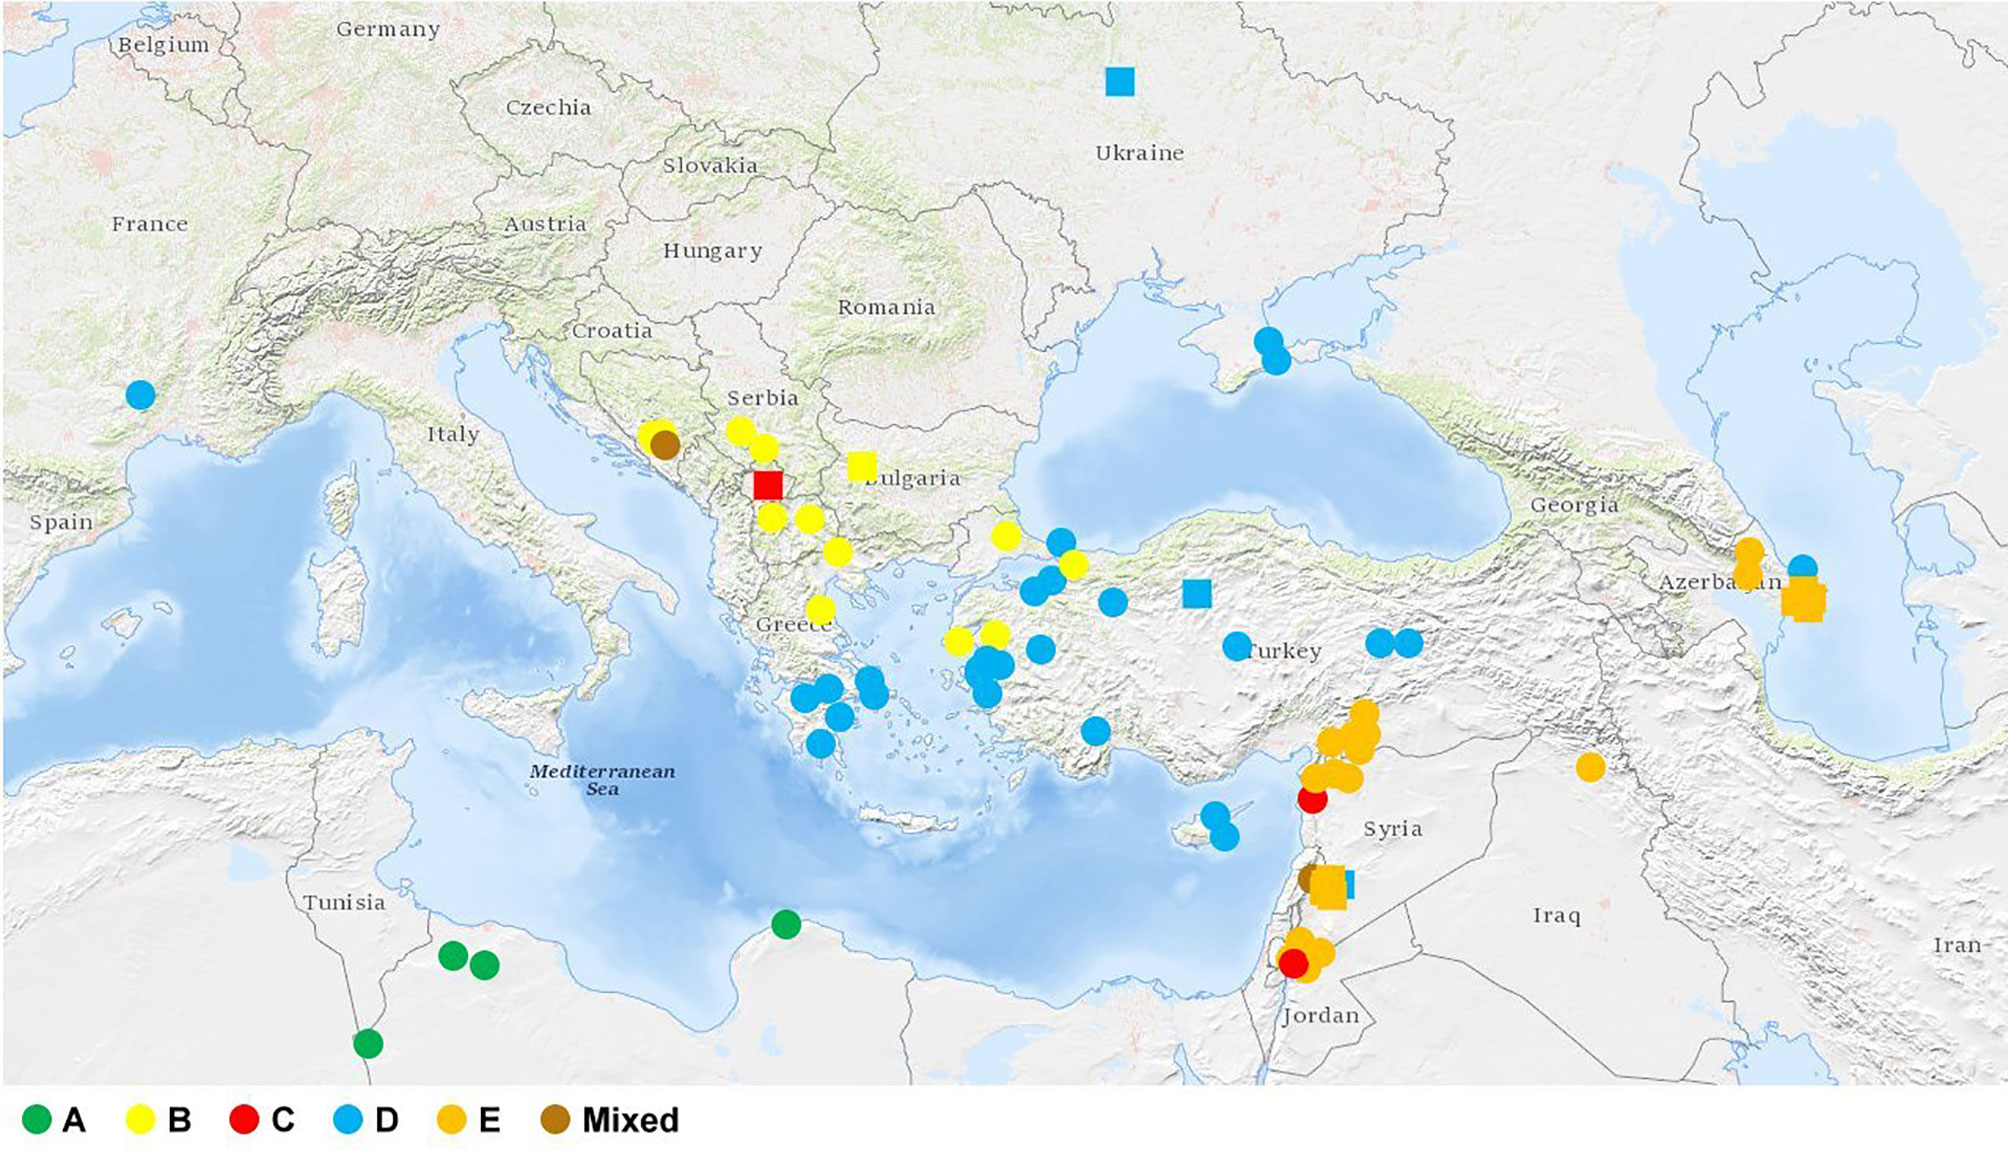
Figure 3 Geographic origin of the Ae. biuncialis collection. Circles represent accessions with known geographic location. Where only the country of origin is known, it is indicated by a square representing the capital. There is no information about the origin of six accessions in the collection. The different colors of the symbols (circle, square) in the figure represent the clusters (or subpopulations) corresponding to the population structure obtained by STRUCTURE analysis.
Based on the membership probability of genotypes, subpopulations A, B, and C could be clearly separated, whereas D and E were less distinct due to their similar share in the genome of several accessions (Figure 2). Subpopulation A was differentiated and sub-divided according to the membership probability of each cluster: Three of the six accessions (AE78689, AE84388, and AE84484) segregated into a homogeneous subgroup, but the other three formed a heterogeneous subgroup. Subpopulation A appeared in different proportions in the genome of the two subgroups. Subpopulation D contributed to the gene pool of some accessions in subpopulation B whereas the B subpopulation was also detectable in several genotypes in subpopulation D. These accessions within the two subpopulations occupy a common eco-geographic area in Greece and West Turkey (Aegean Sea region), indicating admixture events between subpopulations B and D. In subpopulation C, other subpopulations also significantly contributed to the genome of two accessions (TA2782 and MvGB377). Subpopulation B was revealed in genotype TA2782 from Kosovo, whereas subpopulation E was detected in the genome of MvGB377, originating from Jordan. The third, Syrian genotype (MvGB642) had a 97% membership probability in cluster C.
Analysis of Genetic Diversity
To refine the genetic relationship between the Ae. biuncialis accessions, the genetic similarity within the population was calculated based on Jaccard’s coefficient. The average genetic similarity between all 86 genotypes was estimated to be 0.45 and ranged from 0.28 to 0.96, indicating that the Ae. biuncialis population had large genetic variability (data of the genetic similarity matrix not shown). The phylogenetic dendrogram split the Ae. biuncialis collection into five separate branches, which had a good fit with the subpopulations (A-E) revealed by STRUCTURE analysis (Figure 2). The pair-wise genetic similarity of the accessions was studied within each subpopulation, of which cluster D had the lowest average value (0.51) and the widest range (0.41–0.96), indicating its broad genetic diversity. The Ae. biuncialis accessions were genotyped together with wheat accession, Mv9kr1 which was used as an outgroup accession for constructing the phylogenetic dendrogram for the Ae. biuncialis collection.
Based on the STRUCTURE and neighbor-joining analyses results, the subpopulations could be further divided into subgroups (or intra-cluster lineage), where genotypes from common areas share similar genetic ancestry and show high genetic similarity (Figure 2). This intra-cluster differentiation was in agreement with the provenance of the genotypes within the larger geographic regions. Cluster B could be separated into subgroups originating mainly from Bosnia and Herzegovina, the central area of the Balkans and coast of the Aegean Sea (North Greece and Northwest Turkey). Subpopulation D was divided into clades springing from Asia Minor, Crimea and region of the Aegean See (South Greece and West Turkey). Based on their genetic similarity, three accessions from Cyprus and Syria (MvGB379, PI483007, and PI483013) could be discriminated clearly in subpopulation D as showing a close genetic relationship with subpopulation E. The latter could be partitioned into distinct subgroups representing their geographic origin, such as Jordan, Azerbaijan, Syria and the southern part of Turkey.
Principal coordinate analysis was used as an alternative way of analyzing and visualizing the population structure. The first three principal coordinates explained 38.428% of the genotypic variance (PCo1: 21.46%, PCo2: 10.81%, PCo3: 6.15%), and also discriminated the accessions of clusters A, B, D and E, confirming the STRUCTURE result (Figure 4, Supplementary Figures S2 and S3).
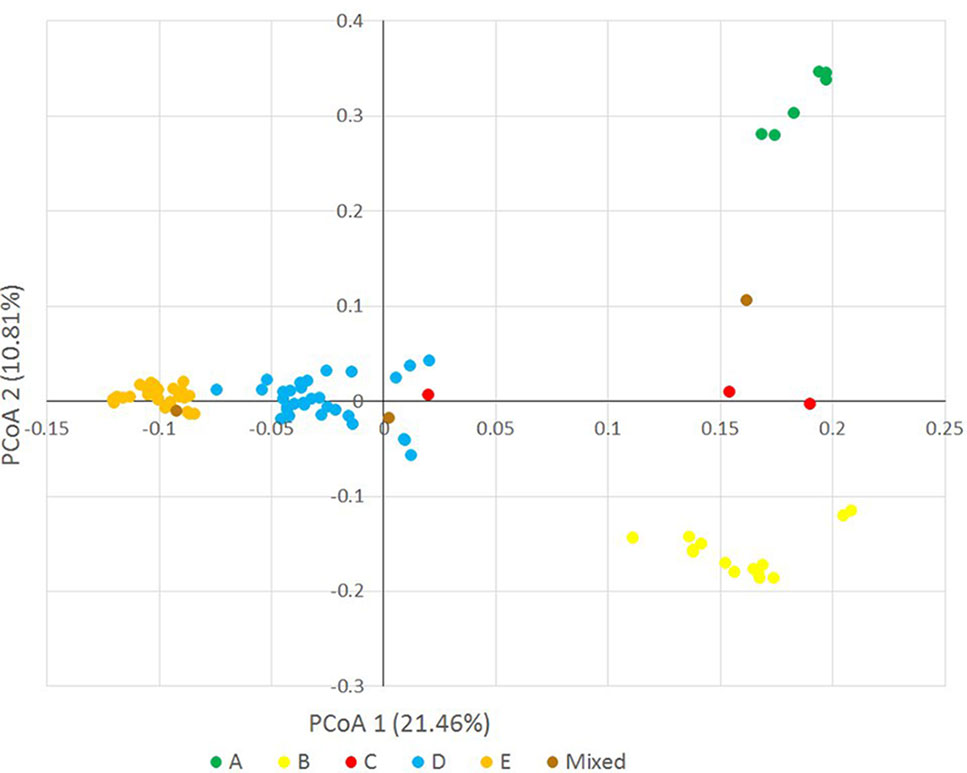
Figure 4 Principal coordinate analysis on the Ae. biuncialis accessions based on 32,700 DArT markers. Different colors indicate different subpopulations (A–E) in the population.
Phenotypic Evaluation of Heading Time
The heading time, as a phenological trait, was grouped according to the subpopulations obtained by cluster analysis (Supplementary Table S2). One-way ANOVA was carried out in order to study the differences between the heading time of the five subpopulations within each year, and to analyse the differences in each subpopulation among the 3 years. Although subpopulations A and C had much smaller sample size than the others, they were not excluded from the statistical analysis.
The heading time within each subpopulation differed not significantly among 2016 and 2017, while the heading time values in the 2018 season were considerably shorter than in the other 2 years (Figure 5 and Supplementary Figure S4), which was confirmed by the correlation analysis (Figure 6). The difference could be explained by the very different precipitation and temperature conditions during the spring months that are critical for the flowering period (Supplementary Figure S5). One-way ANOVA of the heading time within 1 year pointed out significant differences between four subpopulations (A, B, D, and E) in the Ae. biuncialis collection (Figure 5 and Supplementary Figure S4). The subpopulation C was not separated from those of subpopulations D and E; and in 2018 the subpopulation C differed not from those of A, D, and E.
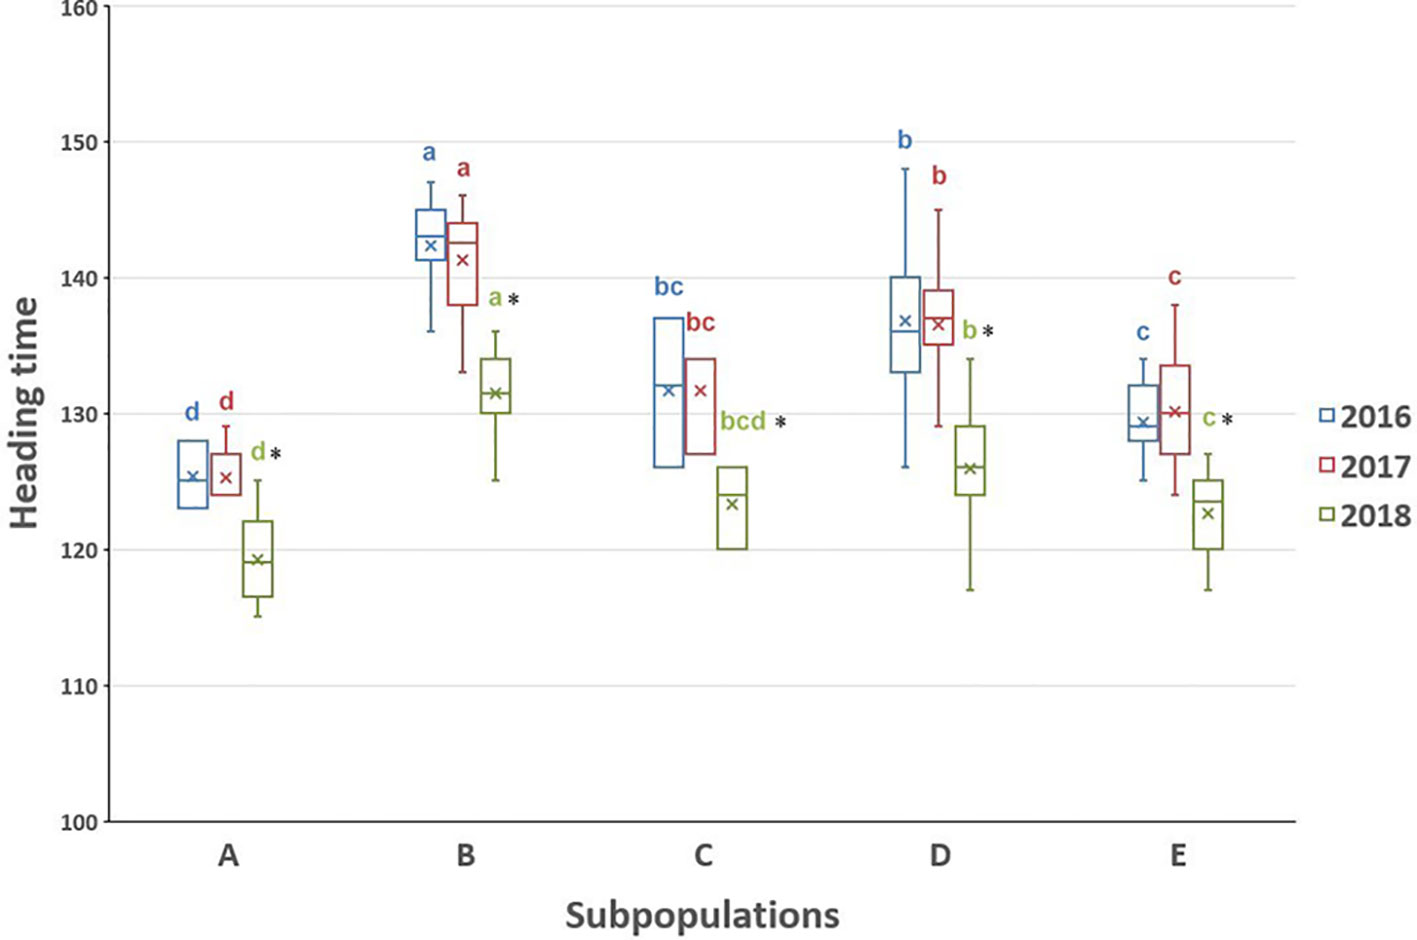
Figure 5 Boxplot chart of the heading times of the Ae. biuncialis subpopulations (A–E) showing the mean, median and range of the phenotypic data in 3 years. The heading time trait was expressed in number of days elapsed from January 1 to the DEV59 developmental stage. Different letters indicate significant differences between the subpopulations within the same year at P < 0.05, using one-way analysis of variance. *Indicates the heading time in 2018 differs significantly from the others within relevant subpopulation at the P < 0.05 level.
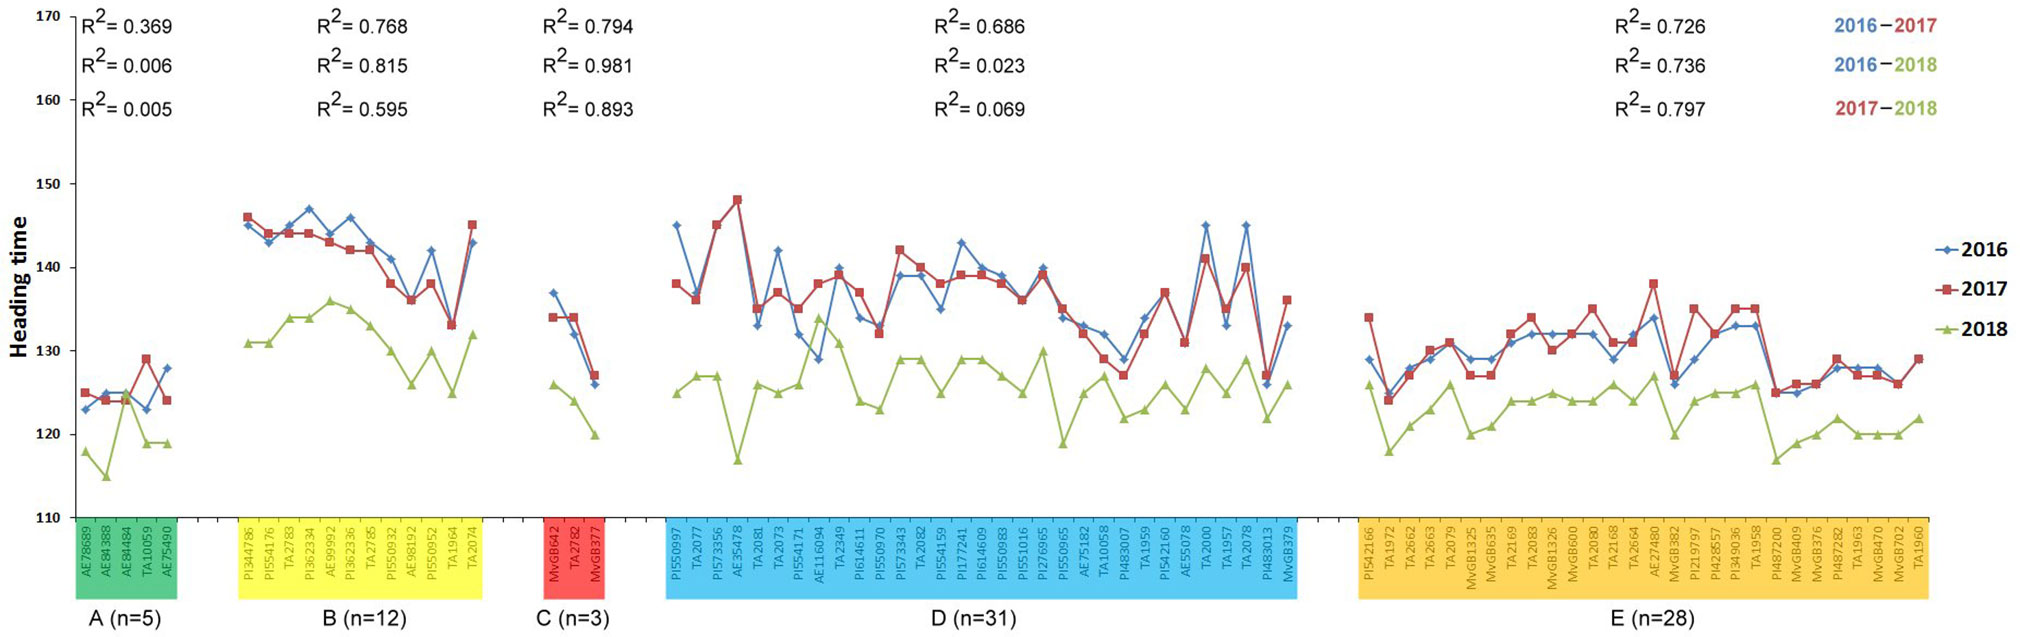
Figure 6 Correlation of the heading times of Ae. biuncialis accessions among three different seasons. Heading time was defined as the number of days required to reach the DEV59 developmental stage from January 1. Color codes indicate different subpopulations (A–E) identified from STRUCTURE analysis. Number of accessions (n), clustered into one subpopulation, are represented in the figure. The R2 values of pair-wise correlation for each subpopulation among different seasons are included in the figure.
To visualize the correlation between genetic diversity and phenotypic variation, principal component analysis was performed for the heading time of the Ae. biuncialis accessions (Figure 7, Supplementary Figures S6 and S7). The first two components explained 97.29% of the phenotypic variance and grouped the majority of genotypes into four phenotypic categories, which corresponded with the genetic structure and geographic distribution of the population in spite of the fact that they showed not clearly differenctiation (Figure 7). Since the third principal component represented only 2.72% of the variation, it was not taken into account in the phenotypic classification. Subpopulations A and E correlated to group I and group II, respectively, exhibiting the earlier heading phenotypes, whereas subpopulation D largely coincided with the intermediate group III. Subpopulation B corresponded the group IV, which had the latest heading date (Figure 7). The heading time of subpopulation C could not be classified in a separate phenotypic group, which was in accordance with the results of one-way ANOVA.
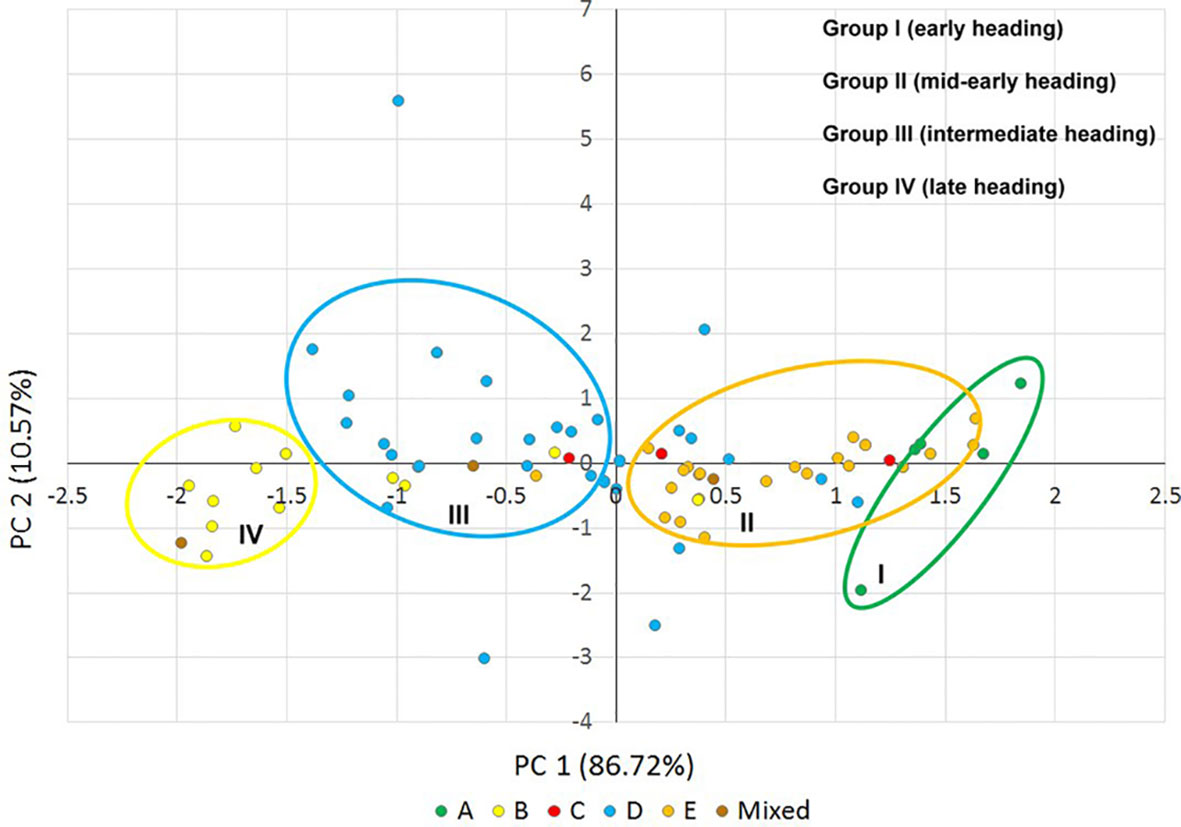
Figure 7 Scatter plot of principal components 1 and 2, explaining 97.29% of the phenotypic variance in the heading time (2016, 2017, and 2018) of the Ae. biuncialis collection. Different colored dots indicate the Ae. biuncialis accessions in the subpopulations (A–E) obtained from STRUCTURE analysis. Groups I–IV indicate the phenotypic categories for heading time.
Analysis of Delayed Foliar Senescence
The relationship between delayed foliar senescence (stay-green trait of plants) and the heading time was also investigated. At the first measuring date (May 12), the average SPAD values of the genotypes ranged between 42 and 61, indicating that these plants were still green (Supplementary Table S3, Supplementary Figures S8 and S9). In the second phase (May 31) SPAD values could not be recorded for seven Ae. biuncialis accessions, because the green color intensity of their leaves was below the detection level due to their advanced maturity. For the other genotypes, a significant correlation was revealed between the heading time and the difference in SPAD values based on the Pearson and rank coefficients. This revealed eight genotypes which had early heading times, but exhibited the small differences in SPAD values that are characteristic of the stay-green phenotype (Supplementary Table S3 and Supplementary Figure S10).
Discussion
Genetic Structure of the Aegilops biuncialis Collection
The present study is the first report on the use of the DArTseq platform to estimate the intraspecific genetic diversity of Ae. biuncialis on accessions representing the natural distribution area of the species. Three statistical methods gave consistent results for the genetic diversity and population structure: The Ae. biuncialis accessions clustered into five subpopulations in accordance with their place of origin. Three genotypes (MvGB380, TA2784, and TA2659) could not be classed into any of the distinct subpopulations based on their membership probability and these showed the lowest genetic similarity to the other accessions, indicating that this mixed group was the most distant genetically from the other genotypes in the population.
Based on random amplified polymorphic DNA markers, Ae. biuncialis accessions from Transcaucasia were classed by Okuno et al. (1998) in two clusters, which corresponded with groups from the eastern shores of the Black Sea and the western shores of the Caspian Sea, while Ae. biuncialis subpopulations from the central and southern parts of the Iberian Penninsula were clearly discriminated by AFLP markers that correlated with their geographical distribution (Monte et al., 2001). Based on simple sequence repeat, AFLP, and single nucleotide polymorphism markers, Ae. tauschii genotypes were grouped in two lineages, showed clear differentiation (Pestsova et al., 2000; Mizuno et al., 2010; Jones et al., 2013; Wang et al., 2013; Arora et al., 2017; Singh et al., 2019). Large range of genetic similarity (0.61 to 0.99) was reported for Ae. tauschii by Sohail et al. (2012), who used DArT markers to study the genetic relationship between 81 genotypes representing the eco-geographic distribution of the species. In the present study the Ae. biuncialis collection had a relatively wide genetic variability (0.28 to 0.96). When comparing the genetic diversity of various Aegilops species, Kilian et al. (2007) found lower genetic similarity in Aegilops speltoides (0.656) and Ae. tauschii (0.75) than in Aegilops sharonensis (0.84), Aegilops searsii (0.825), and Aegilops longissima (0.812). Species in the Sitopsis section, except for Ae. speltoides, have limited distribution in the Levantine, representing a smaller geographical area in the eastern Mediterranean Basin (van Slageren, 1994; Mendlinger and Zohary, 1995; Millet, 2007; Kilian et al., 2011). The narrow geographic range of Ae. sharonensis, restricted to the coastal areas of Levantine, could explain the high average genetic similarity (0.82) estimated between the genotypes (Olivera and Steffenson, 2009; Olivera et al., 2010). AFLP marker analysis on a set of Aegilops geniculata genotypes revealed that accessions originating from the main regions of the Mediterranean Basin could be classed into seven groups (Arrigo et al., 2010). Six of the seven groups had a strong bio-geographical structure, derived from the northern parts of the Mediterranean, whereas the remaining one exhibited less genetic structuring, representing the southern Mediterranean areas, including North Africa, Levantine, and the Bosphorus Strait. In contrast, the Ae. biuncialis population in the southern and eastern Mediterranean regions could be divided into distinct subpopulations, where subpopulation A occupied North Africa, subpopulations E and C were characteristic of Levantine and subpopulation D was located mainly in Asia Minor. The Ae. biuncialis collection, fragmented in the eastern part of the Mediterranean Basin, showed a distinct phylo-geographical pattern, indicating the extremely large genetic diversity of the species.
The subpopulations of the Ae. biuncialis collection could be further divided into subgroups, resulting in intra-cluster differentiation, which may explain the admixture events between the genotypes (Figure 2). Three of the six accessions in subpopulation A had a close genetic relationship, suggesting that the higher rate of gene flow between them may have resulted in a homogeneous subgroup. They differ phenotypically from the rest of the subpopulation as they have an earlier heading date. As this homogeneous subgroup is derived from the northwest part of Libya, they were presumably isolated from the other members of the subpopulation while adapting to the arid climate. The natural distribution areas of certain accessions, representing an admixture of subpopulations B and D, overlap in the region of the Aegean Sea, suggesting that the genome shared by the two subpopulations was formed due to the intercrossing of parental genotypes derived from the different subpopulations. Three accessions (MvGB379, PI483007, and PI483013) were grouped in subpopulation D based on their membership probability, whereas they also showed a closer phylogenetic relationship with some Syrian genotypes from subpopulation E. As both subpopulations have made similar contributions to the genome of these accessions, their genetically similar germplasm and recent common ancestor suggest that the two clusters have not yet fully separated phylogenetically or that intraspecific hybridization has occurred between them. Subpopulations B and C contributed in similar proportions to the genome of the accession TA2782 originating from Kosovo, postulating an earlier admixture event between ancestral genotypes belonging to different subpopulations. Although three genotypes are not enough to represent the native distributional range of subpopulation C, the TA2782 accession seems to have developed outside this area and may have reached Kosovo as a result of migration. Genotypes AE75182 and TA10058 have close genetic similarity (0.95) in spite of being from distant regions. TA10058 originated from Azerbaijan, but was found well away from the natural distribution area of its subpupolation, so it might be an introduced accession. Herbivores, as vectors, can support the long distance dispersal of plants (Janzen, 1984; Vellend et al., 2003; Römermann et al., 2005), which is enhanced by human activities, such as pastoralism (Blondel, 2006). On the other hand, human-caused climate change may have an impact on the expansion of numerous species (Parmesan and Yohe, 2003; Thomas et al., 2004; Hickling et al., 2006; Jarvis et al., 2008; Devictor et al., 2012). The occurrence of two genotypes (PI614609 and PI614611) in the Crimean Peninsula corresponds to the prognosis that predicts a probable shift in the natural range of Ae. biuncialis to the Azov Sea in response to global warming (Ostrowski et al., 2016).
The large genetic diversity of Ae. biuncialis, enabling its adaptation to various climatic conditions (Zaharieva et al., 2004; Zaharieva and Monneveux, 2006), may serve as a rich source of potential genes to improve the adaptive capacity of cultivated wheat. It has been reported that some Ae. biuncialis accessions have good tolerance of heat and drought stress (Molnár et al., 2004; Dulai et al., 2014) and others are promising for resistance to rust diseases (Molnár-Láng et al., 2014; Olivera et al., 2018).
Phenotypic Diversity Pattern
Based on one-way ANOVA and correlation analysis (Figures 5 and 6), the heading times differed among subpopulations similarly in each year in spite of the fact that the heading times of all subpopulations was shorter in 2018 than in 2016 and 2017. The extrem weather conditions, observed in the 2018 season, can explain the low level of correlation and shorter phenotypic values. Significant differences in heading date was found between four subpopulations (A, B, D, and E), corresponding with genetic relatedness and geographic origin with the exception of subpopulation C, which could not be separated from subpopulations D and E (Figures 5 and 7). In subpopulation C, the variation pattern of the heading date suggested that the admixed genomes of these accessions represented a diverse gene pool, and had different geographic origin. However, subpopulation C contained relatively few accessions, so no additional conclusions can be drawn on its phenotypic diversity.
Subpopulations with different phenotype are originating from eco-geographic regions that can be characterized by different agro-climatic conditions. Subpopulation A from North Africa had early phenotype which is prevalent in the semi-arid area, whereas subpopulation B and D from the Balkans and Asia Minor exhibited later heading times, which are predominant in the Continental and Mediterranean regions, respectively. The phenological trait patterns of the subpopulations correlated largely with the climatic conditions found in the relevant geographical areas, suggesting that the heading time diversification might be an adaptive change for Ae. biuncialis. The broad genetic diversity and its association with adaptive changes in heading date allowed the species to spread widely. Nevertheless, genealogically-based chloroplast DNA analysis could lead to a more comprehensive identification of the ancestral and derived sublineages and a better understanding of the course of the geographic spread of Ae. biuncialis.
The Aegilops triuncialis accessions in California, which evolved due to the independent introduction of a few Eurasian genotypes (Peters et al., 1996), were grouped using microsatellite markers into three lineages, each of which had different eco-geographical distribution and showed significant differences in flowering time (Meimberg et al., 2006; Meimberg et al., 2010). However, the phenotypic diversity pattern of the invasive lineages cannot express the intraspecific variation for flowering time because the introduced accessions represent only a part of the natural distribution area of Ae. triuncialis.
The correlation between the population structure and flowering time diversification in a collection of 200 Ae. tauschii accessions was studied by Matsuoka et al. (2008) using chloroplast DNA geneological analysis. Two of the four major haplogroups (HG7 and HG16) were phenotypically heterogeneous, representing a large proportion (83.5%) of the population. When comparing the DArT marker-based genetic divergence and phenological variation pattern of Ae. tauschii, Matsuoka et al. (2015) found that the intraspecific lineage structure was associated with changes in the flowering trait. This finding has been supported by the present study, as the Ae. biuncialis subpopulations A, B, D, and E showed significant differences in the heading time. The broad intraspecific diversity of the heading phenotypes could be introduced into bread wheat by means of chromosome-mediated gene transfer in order to diversify the maturation time and prolong the harvest period.
Besides the heading time, the stay-green trait, which is associated with foliar senescence characters, was also determined in the Ae. biuncialis accessions (Bachmann et al., 1994; Thomas et al., 1996). Delayed senescence allows the leaves to maintain photosynthetic activity during the active grain-filling period, thus ensuring the incorporation of assimilates to the grain (Thomas and Howarth, 2000; Spano et al., 2003; Kobata et al., 2015). The stay-green phenotype is associated with the ability of plants to maintain grain development longer, resulting in better yields, especially under water-limited conditions (Borrell et al., 2000; Christopher et al., 2008). In the present experiments, seven of the 86 Ae. biuncialis genotypes had SPAD values below the detection limit, due to premature leaf senescence. Eight accessions that exhibited the stay-green phenotype with early flowering were identified as potential gene sources for wheat breeding programs aimed to improve drought tolerance. Terminal drought during the grain-filling period can be avoided through accelerated reproduction, while the crop yield may be increased due to the preservation of the green leaf area.
Conclusions
This paper confirmed that the DArTseq genotyping approach can be used efficiently to investigate the genetic diversity and population structure of Ae. biuncialis. The population structure defined using a combination of three clustering methods was in agreement with the geographic origin of the accessions. The heading trait diversity was also found to correlate largely with the genetic structure and geographic distribution. The wide-ranging genetic diversity of Ae. biuncialis may make it a potential genetic source for wheat improvement. The large intraspecific variation for heading time offers opportunities for the maximization of grain yield by shortening the plant life cycle, resulting in the termination of the grain-filling period before the drought season. The comparative analysis of genetic and phenological diversity patterns enables the selection of Ae. biuncialis genotypes adapted to a wide variety of ecological habitats, which could be used to breed new wheat cultivars able to cope with extreme climatic changes.
Data Availability Statement
The SilicoDArT marker data of the Ae. biuncialis collection can be found in EBI https://www.ebi.ac.uk/biostudies/studies/S-BSST277.
Author Contributions
LI participated in the analysis of the phenotypic data and wrote the manuscript. IMon performed the cluster analysis and made valuable comments on the manuscript. MM and PM maintained the germplasm and phenotyped it for the heading time. AF, ET, EG, AL-T, KS-P, and ÉS contributed to the maintenance of the plant material and the field experiments. ÉD carried out the phenotypic analysis of SPAD. TK evaluated the heading time of the genotypes. AK helped in GBS data analysis. IMol planned and managed the whole study, and supervised the manuscript preparation.
Funding
This paper was financed by a Marie Curie Fellowship Grant (‘AEGILWHEAT’-H2020-MSCA-IF-2016-746253) under the H2020 framework program of the European Union and by the Hungarian National Research, Development and Innovation Office—NKFIH 116277, 112226, and 119387 and by the ERDF project „Plants as a tool for sustainable global development” (no. CZ.02.1.01/0.0/0.0/16_019/0000827).
Conflict of Interest
The authors declare that the research was conducted in the absence of any commercial or financial relationships that could be construed as a potential conflict of interest.
Acknowledgments
Special thanks to Tamás Árendás for providing the weather data measured between 2015 and 2018. The technical assistance of Fanni Tóth, Ildikó Könyves-Lakner and Ágnes Bencze is gratefully acknowledged. Thanks are due to Barbara Hooper for revising the manuscript linguistically.
Supplementary Material
The Supplementary Material for this article can be found online at: https://www.frontiersin.org/articles/10.3389/fpls.2019.01531/full#supplementary-material
References
Araus, J. L., Slafer, G. A., Reynolds, M. P., Royo, C., (2004). “Physiology of yield and adaptation in wheat and barley breeding,” in Physiology and Biotechnology Integration for Plant Breeding. Eds.Nguyen, H. T., Blum, A. (New York, USA: Marcel Dekker), 1–49. doi: 10.1201/9780203022030.ch16
Arora, S., Singh, N., Kaur, S., Bains, N. S., Uauy, C., Poland, J., et al. (2017). Genome-wide association study of grain architecture in wild wheat Aegilops tauschii. Front. Plant Sci. 8, 886–898. doi: 10.3389/fpls.2017.00886
Arrigo, N., Felber, F., Parisod, C., Buerki, S., Alvarez, N., David, J., et al. (2010). Origin and expansion of the allotetraploid Aegilops geniculata, a wild relative of wheat. New Phytol. 187, 1170–1180. doi: 10.1111/j.1469-8137.2010.03328.x
Bachmann, A., Fernández-López, J., Ginsburg, S., Thomas, H., Bouwkamp, J. C., Solomos, T., et al. (1994). Stay-green genotypes of Phaseolus vulgaris L.: chloroplast proteins and chlorophyll catabolites during foliar senescence. New Phytol. 126, 593–600. doi: 10.1111/j.1469-8137.1994.tb02953.x
Badea, A., Eudes, F., Salmon, D., Tuvesson, S., Vrolijk, A., Larsson, C.-T., et al. (2011). Development and assessment of DArT markers in triticale. Theor. Appl. Genet. 122, 1547–1560. doi: 10.1007/s00122-011-1554-3
Baloch, F. S., Alsaleh, A., Shahid, M. Q., Çiftçi, V., Sáenz de Miera, L. E., Aasim, M., et al. (2017). A whole genome DArTseq and SNP analysis for genetic diversity assessment in durum wheat from Central Fertile Crescent. PloS One 12, e0167821. doi: 10.1371/journal.pone.0167821
Bansal, M., Kaur, S., Dhaliwal, H. S., Bains, N. S., Bariana, H. S., Chhuneja, P., et al. (2017). Mapping of Aegilops umbellulata-derived leaf rust and stripe rust resistance loci in wheat. Plant Pathol. 66, 38–44. doi: 10.1111/ppa.12549
Blondel, J. (2006). The “design” of Mediterranean landscapes: a millennial story of humans and ecological systems during the historic period. Hum. Ecol. 34, 713–729. doi: 10.1007/s10745-006-9030-4
Bolibok-Brągoszewska, H., Targońska, M., Bolibok, L., Kilian, A., Rakoczy-Trojanowska, M. (2014). Genome-wide characterization of genetic diversity and population structure in Secale. BMC Plant Biol. 14, 184–198. doi: 10.1186/1471-2229-14-184
Borrell, A. K., Hammer, G. L., Henzell, R. G. (2000). Does maintaining green leaf area in Sorghum improve yield under drought? II. Dry matter production and yield. Crop Sci. 40, 1037–1048. doi: 10.2135/cropsci2000.4041037x
Cai, S., Wu, D., Jabeen, Z., Huang, Y., Huang, Y., Zhang, G. (2013). Genome-wide association analysis of aluminum tolerance in cultivated and Tibetan wild barley. PloS One 8, e69776. doi: 10.1371/journal.pone.0069776
Christopher, J. T., Manschadi, A. M., Hammer, G. L., Borrell, A. K. (2008). Developmental and physiological traits associated with high yield and stay-green phenotype in wheat. Aust. J. Agric. Res. 59, 354–364. doi: 10.1071/ar07193
Colmer, T. D., Flowers, T. J., Munns, R. (2006). Use of wild relatives to improve salt tolerance in wheat. J. Exp. Bot. 57, 1059–1078. doi: 10.1093/jxb/erj124
Comadran, J., Russell, J. R., Booth, A., Pswarayi, A., Ceccarelli, S., Grando, S., et al. (2011). Mixed model association scans of multi-environmental trial data reveal major loci controlling yield and yield related traits in Hordeum vulgare in Mediterranean environments. Theor. Appl. Genet. 122, 1363–1373. doi: 10.1007/s00122-011-1537-4
Cseh, A., Kruppa, K., Molnár, I., Rakszegi, M., Doležel, J., Molnár-Láng, M. (2011). Characterization of a new 4BS.7HL wheat–barley translocation line using GISH, FISH, and SSR markers and its effect on the β-glucan content of wheat. Genome 54, 795–804. doi: 10.1139/g11-044
Devictor, V., Van Swaay, C., Brereton, T., Brotons, L., Chamberlain, D., Heliölö, J., et al. (2012). Differences in the climatic debts of birds and butterflies at a continental scale. Nat. Clim. Change 2, 121–124. doi: 10.1038/nclimate1347
Dulai, S., Molnár, I., Szopkó, D., Darkó, É., Vojtkó, A., Sass-Gyarmati, A. (2014). Wheat- Aegilops biuncialis amphiploids have efficient photosynthesis and biomass production during osmotic stress. J. Plant Physiol. 171, 509–517. doi: 10.1016/j.jplph.2013.11.015
Dvorak, J., Akhunov, E. D. (2005). Tempos of gene locus deletions and duplications and their relationship to recombination rate during diploid and polyploid evolution in the Aegilops-Triticum alliance. Genetics 171, 323–332. doi: 10.1534/genetics.105.041632
Edet, O. U., Gorafi, Y. S. A., Nasuda, S., Tsujimoto, H. (2018). DArTseq-based analysis of genomic relationships among species of tribe Triticeae. Sci. Rep. 8, 16397–16408. doi: 10.1038/s41598-018-34811-y
Etminan, A., Pour-Aboughadareh, A., Mehrabi, A. A., Shooshtari, L., Ahmadi-Rad, A., Moradkhani, H. (2019). Molecular characterization of the wild relatives of wheat using CAAT-box derived polymorphism. Plant Biosyst. 153, 398–405. doi: 10.1080/11263504.2018.1492993
Evanno, G., Regnaut, S., Goudet, J. (2005). Detecting the number of clusters of individuals using the software structure: a simulation study. Mol. Ecol. 14, 2611–2620. doi: 10.1111/j.1365-294X.2005.02553.x
Friebe, B., Jiang, J., Raupp, W. J., McIntosh, R. A., Gill, B. S. (1996). Characterization of wheat-alien translocations conferring resistance to diseases and pests: current status. Euphytica 91, 59–87. doi: 10.1007/BF00035277
Gawroński, P., Pawełkowicz, M., Tofil, K., Uszyński, G., Sharifova, S., Ahluwalia, S., et al. (2016). DArT markers effectively target gene space in the rye genome. Front. Plant Sci. 07, 1600–1613. doi: 10.3389/fpls.2016.01600
Hammer, Ø., Harper, D. A. T., Ryan, P. D. (2001). PAST: Paleontological statistics software package for education and data analysis. Palaeontol. Electron. 4, 4–9. doi: 10.1016/j.bcp.2008.05.025
Hickling, R., Roy, D. B., Hill, J. K., Fox, R., Thomas, C. D. (2006). The distributions of a wide range of taxonomic groups are expanding polewards. Glob. Change Biol. 12, 450–455. doi: 10.1111/j.1365-2486.2006.01116.x
Jaccoud, D., Peng, K., Feinstein, D., Kilian, A. (2001). Diversity Arrays: a solid state technology for sequence information independent genotyping. Nucleic Acids Res. 29, 1–7. doi: 10.1093/nar/29.4.e25
Janzen, D. H. (1984). Dispersal of small seeds by big herbivores: foliage is the fruit. Am. Nat. 123, 338–353. doi: 10.1016/j.compstruc.2007.04.021
Jarvis, A., Lane, A., Hijmans, R. J. (2008). The effect of climate change on crop wild relatives. Agric. Ecosyst. Environ. 126, 13–23. doi: 10.1016/j.agee.2008.01.013
Jauhar, P. P., Chibbar, R. N. (1999). Chromosome-mediated and direct gene transfers in wheat. Genome 42, 570–583. doi: 10.1139/g99-045
Jauhar, P. P. (1993). “Alien gene transfer and genetic enrichment of bread wheat,” in Biodiversity and Wheat Improvement. Ed.Damania, A. B. (Chichester, U.K:John Wiley & Sons), 103–119. Available at: www.cabdirect.org/cabdirect/abstract/19941605141 [Accessed July 5, 2019].
Jing, H.-C., Bayon, C., Kanyuka, K., Berry, S., Wenzl, P., Huttner, E. (2009). DArT markers: diversity analyses, genomes comparison, mapping and integration with SSR markers in Triticum monococcum. BMC Genomics 10, 458–474. doi: 10.1186/1471-2164-10-458
Jones, H., Gosman, N., Horsnell, R., Rose, G. A., Everest, L. A., Bentley, A. R., et al. (2013). Strategy for exploiting exotic germplasm using genetic, morphological, and environmental diversity: the Aegilops tauschii Coss. example. Theor. Appl. Genet. 126, 1793–1808. doi: 10.1007/s00122-013-2093-x
Kellogg, E. A., Appels, R., Mason-Gamer, R. J. (1996). When genes tell different stories: the diploid genera of Triticeae (Gramineae). Syst. Bot. 21, 321–347. doi: 10.2307/2419662
Kilian, B., Özkan, H., Deusch, O., Effgen, S., Brandolini, A., Kohl, J., et al. (2007). Independent wheat B and G genome origins in outcrossing Aegilops progenitor haplotypes. Mol. Biol. Evol. 24, 217–227. doi: 10.1093/molbev/msl151
Kilian, B., Mammen, K., Millet, E., Sharma, R., Graner, A., Salamini, F., et al. (2011). “Aegilops,” in Wild Crop Relatives: Genomic and Breeding Resources: Cereals. Ed. Kole, C. (Berlin: Springer-Verlag), 1–76. doi: 10.1007/978-3-642-14871-2
Kilian, A., Wenzl, P., Huttner, E., Carling, J., Xia, L., Blois, H. (2012). “Diversity Arrays Technology: A generic genome profiling technology on open platforms,” in Data Production and Analysis in Population Genomics. Eds. Pompanon, F., Bonin, A. (Totowa, NJ: Humana Press), 67–89. doi: 10.1007/978-1-61779-870-2_5
Kishii, M. (2019). An update of recent use of Aegilops species in wheat breeding. Front. Plant Sci. 10, 585–603. doi: 10.3389/fpls.2019.00585
Kobata, T., Shinonaga, M., Yoshida, H., Tomisaka, K., Akai, K. (2015). Stay-green trait assessment using the leaf incubation method to examine the maintenance of assimilation rates under high temperature conditions during the grain-filling period in rice. Plant Prod. Sci. 18, 254–266. doi: 10.1626/pps.18.254
Kumar, A., Seetan, R., Mergoum, M., Tiwari, V. K., Iqbal, M. J., Wang, Y., et al. (2015). Radiation hybrid maps of the D-genome of Aegilops tauschii and their application in sequence assembly of large and complex plant genomes. BMC Genomics 16, 800–813. doi: 10.1186/s12864-015-2030-2
Liu, W., Jin, Y., Rouse, M., Friebe, B., Gill, B., Pumphrey, M. O. (2011a). Development and characterization of wheat-Ae. searsii Robertsonian translocations and a recombinant chromosome conferring resistance to stem rust. Theor. Appl. Genet. 122, 1537–1545. doi: 10.1007/s00122-011-1553-4
Liu, W., Rouse, M., Friebe, B., Jin, Y., Gill, B., Pumphrey, M. (2011b). Discovery and molecular mapping of a new gene conferring resistance to stem rust, Sr53, derived from Aegilops geniculata and characterization of spontaneous translocation stocks with reduced alien chromatin. Chromosom. Res. 19, 669–682. doi: 10.1007/s10577-011-9226-3
Marais, G. F., McCallum, B., Marais, A. S. (2006). Leaf rust and stripe rust resistance genes derived from Aegilops sharonensis. Euphytica 149, 373–380. doi: 10.1007/s10681-006-9092-9
Marais, F., Marais, A., McCallum, B., Pretorius, Z. (2009). Transfer of leaf rust and stripe rust resistance genes Lr62 and Yr42 from Aegilops neglecta Req. ex Bertol. to common wheat. Crop Sci. 49, 871–879. doi: 10.2135/cropsci2008.06.0317
Matsuoka, Y., Takumi, S., Kawahara, T. (2008). Flowering time diversification and dispersal in central Eurasian wild wheat Aegilops tauschii Coss.: genealogical and ecological framework. PloS One 3, e3138. doi: 10.1371/journal.pone.0003138
Matsuoka, Y., Takumi, S., Kawahara, T. (2015). Intraspecific lineage divergence and its association with reproductive trait change during species range expansion in central Eurasian wild wheat Aegilops tauschii Coss. (Poaceae). BMC Evol. Biol. 15, 213–222. doi: 10.1186/s12862-015-0496-9
Meimberg, H., Hammond, J. I., Jorgensen, C. M., Park, T. W., Gerlach, J. D., Rice, K. J., et al. (2006). Molecular evidence for an extreme genetic bottleneck during introduction of an invading grass to California. Biol. Invasions 8, 1355–1366. doi: 10.1007/s10530-005-2463-7
Meimberg, H., Milan, N. F., Karatassiou, M., Espeland, E. K., McKay, J. K., Rice, K. J. (2010). Patterns of introduction and adaptation during the invasion of Aegilops triuncialis (Poaceae) into Californian serpentine soils. Mol. Ecol. 19, 5308–5319. doi: 10.1111/j.1365-294X.2010.04875.x
Mendlinger, S., Zohary, D. (1995). The extent and structure of genetic variation in species of the sitopsis group of aegilops. Heredity (Edinb). 74, 616–627. doi: 10.1038/hdy.1995.85
Mikó, P., Löschenberger, F., Hiltbrunner, J., Aebi, R., Megyeri, M., Kovács, G., et al. (2014). Comparison of bread wheat varieties with different breeding origin under organic and low input management. Euphytica 199, 69–80. doi: 10.1007/s10681-014-1171-8
Millet, E. (2007). Exploitation of Aegilops species of section Sitopsis for wheat improvement. Isr. J. Plant Sci. 55, 277–287. doi: 10.1560/ijps.55.3-4.277
Mizuno, N., Yamasaki, M., Matsuoka, Y., Kawahara, T., Takumi, S. (2010). Population structure of wild wheat D-genome progenitor Aegilops tauschii Coss.: Implications for intraspecific lineage diversification and evolution of common wheat. Mol. Ecol. 19, 999–1013. doi: 10.1111/j.1365-294X.2010.04537.x
Molnár, I., Gáspár, L., Sárvári, É., Dulai, S., Hoffmann, B., Molnár-Láng, M. (2004). Physiological and morphological responses to water stress in Aegilops biuncialis and Triticum aestivum genotypes. Biol. Funct. Plant 31, 1149–1159. doi: 10.1071/FP03143
Molnár, I., Cifuentes, M., Schneider, A., Benavente, E., Molnár-Láng, M. (2011). Association between simple sequence repeat-rich chromosome regions and intergenomic translocation breakpoints in natural populations of allopolyploid wild wheats. Ann. Bot. 107, 65–76. doi: 10.1093/aob/mcq215
Molnár-Láng, M., Molnár, I., Szakács, É., Linc, G., Bedö, Z. (2014). “Production and molecular cytogenetic identification of wheat-alien hybrids and introgression lines,” in Genomics of Plant Genetic Resources. Eds.Tuberosa, R., Graner, A., Frison, E. (Dordrecht:Springer Netherlands), 255–283. doi: 10.1007/978-94-007-7572-5_11
Monneveux, P., Zaharieva, M., Rekika, D. (2000). “The utilisation of Triticum and Aegilops species for the improvement of durum wheat,” in Durum Wheat Improvement in the Mediterranean Region: New Challenges. Eds.Royo, C., Nachit, M., Di Fonzo, N., Araus, J. L. (CIHEAM Zaragoza), 71–81. Available at: www.ciheam.org/%5Cnhttp://om.ciheam.org/.
Monostori, I., Szira, F., Tondelli, A., Árendás, T., Gierczik, K., Cattivelli, L., et al. (2017). Genome-wide association study and genetic diversity analysis on nitrogen use efficiency in a Central European winter wheat (Triticum aestivum L.) collection. PloS One 12, e0189265. doi: 10.1371/journal.pone.0189265
Monte, J. V., Nova, P. J. G., Soler, C. (2001). AFLP-based analysis to study genetic variability and relationships in the Spanish species of the genus Aegilops. Hereditas 135, 233–238. doi: 10.1111/j.1601-5223.2001.00233.x
Nagy, E. D., Molnár, I., Schneider, A., Kovács, G., Molnár-Láng, M. (2006). Characterization of chromosome-specific S-SAP markers and their use in studying genetic diversity in Aegilops species. Genome 49, 289–296. doi: 10.1139/g05-109
Nielsen, N. H., Backes, G., Stougaard, J., Andersen, S. U., Jahoor, A. (2014). Genetic diversity and population structure analysis of European hexaploid bread wheat (Triticum aestivum L.) varieties. PloS One 9, e94000. doi: 10.1371/journal.pone.0094000
Okuno, K., Ebana, K., Noov, B., Yoshida, H. (1998). Genetic diversity of Central Asian and north Caucasian Aegilops species as revealed by RAPD markers. Genet. Resour. Crop Evol. 45, 389–394. doi: 10.1023/A:1008660001263
Olivera, P. D., Steffenson, B. J. (2009). Aegilops sharonensis: origin, genetics, diversity, and potential for wheat improvement. Botany 87, 740–756. doi: 10.1139/b09-040
Olivera, P. D., Anikster, Y., Steffenson, B. J. (2010). Genetic diversity and population structure in Aegilops sharonensis. Crop Sci. 50, 636–648. doi: 10.2135/cropsci2009.04.0192
Olivera, P. D., Rouse, M. N., Jin, Y. (2018). Identification of new sources of resistance to wheat stem rust in Aegilops spp. in the tertiary genepool of wheat. Front. Plant Sci. 9, 1719–1726. doi: 10.3389/fpls.2018.01719
Olson, E. L., Rouse, M. N., Pumphrey, M. O., Bowden, R. L., Gill, B. S., Poland, J. A. (2013). Introgression of stem rust resistance genes SrTA10187 and SrTA10171 from Aegilops tauschii to wheat. Theor. Appl. Genet. 126, 2477–2484. doi: 10.1007/s00122-013-2148-z
Ostrowski, M. F., Prosperi, J. M., David, J. (2016). Potential implications of climate change on Aegilops species distribution: sympatry of these crop wild relatives with the major European crop Triticum aestivum and conservation issues. PloS One 11, 1–27. doi: 10.1371/journal.pone.0153974
Parmesan, C., Yohe, G. (2003). A globally coherent fingerprint of climate change impacts across natural systems. Nature 421, 37–42. doi: 10.1038/nature01286
Peleg, Z., Fahima, T., Abbo, S., Krugman, T., Nevo, E., Yakir, D., et al. (2005). Genetic diversity for drought resistance in wild emmer wheat and its ecogeographical associations. Plant Cell Environ. 28, 176–191. doi: 10.1111/j.1365-3040.2005.01259.x
Pestsova, E., Korzun, V., Goncharov, N. P., Hammer, K., Ganal, M. W., Röder, M. S. (2000). Microsatellite analysis of Aegilops tauschii germplasm. Theor. Appl. Genet. 101, 100–106. doi: 10.1007/s001220051456
Peters, A., Johnson, D. E., George, M. R. (1996). Barb goatgrass: a threat to California rangelands. Rangelands 18, 8–10.
Pritchard, J. K., Stephens, M., Donnelly, P. (2000). Inference of population structure using multilocus genotype data. Genetics 155, 945–959. doi: 10.1111/j.1471-8286.2007.01758.x
Qi, L., Friebe, B., Gill, B. S. (2006). Complex genome rearrangements reveal evolutionary dynamics of pericentromeric regions in the Triticeae. Genome 49, 1628–1639. doi: 10.1139/g06-123
Römermann, C., Tackenberg, O., Poschlod, P. (2005). How to predict attachment potential of seeds to sheep and cattle coat from simple morphological seed traits. Oikos 110, 219–230. doi: 10.1111/j.0030-1299.2005.13911.x
Rekika, D., Monneveux, P., Havaux, M. (1997). The in vivo tolerance of photosynthetic membranes to high and low temperatures in cultivated and wild wheats of the Triticum and Aegilops genera. J. Plant Physiol. 150, 734–738. doi: 10.1016/S0176-1617(97)80291-X
Sansaloni, C., Petroli, C., Jaccoud, D., Carling, J., Detering, F., Grattapaglia, D., et al. (2011). Diversity Arrays Technology (DArT) and next-generation sequencing combined: genome-wide, high throughput, highly informative genotyping for molecular breeding of Eucalyptus. BMC Proc. 5, 54–55. doi: 10.1186/1753-6561-5-S7-P54
Schneider, A., Molnár, I., Molnár-Láng, M. (2008). Utilisation of Aegilops (goatgrass) species to widen the genetic diversity of cultivated wheat. Euphytica 163, 1–19. doi: 10.1007/s10681-007-9624-y
Singh, N., Wu, S., Tiwari, V., Sehgal, S., Raupp, J., Wilson, D., et al. (2019). Genomic analysis confirms population structure and identifies inter-lineage hybrids in Aegilops tauschii. Front. Plant Sci. 10, 9–21. doi: 10.3389/fpls.2019.00009
Sohail, Q., Shehzad, T., Kilian, A., Eltayeb, A. E., Tanaka, H., Tsujimoto, H. (2012). Development of diversity array technology (DArT) markers for assessment of population structure and diversity in Aegilops tauschii. Breed. Sci. 62, 38–45. doi: 10.1270/jsbbs.62.38
Spano, G., Di Fonzo, N., Perrotta, C., Platani, C., Ronga, G., Lawlor, D. W., et al. (2003). Physiological characterization of “stay green” mutants in durum wheat. J. Exp. Bot. 54, 1415–1420. doi: 10.1093/jxb/erg150
Tahernezhad, Z., Zamani, M. J., Solouki, M., Zahravi, M., Imamjomeh, A. A., Jafaraghaei, M., et al. (2010). Genetic diversity of Iranian Aegilops tauschii Coss. using microsatellite molecular markers and morphological traits. Mol. Biol. Rep. 37, 3413–3420. doi: 10.1007/s11033-009-9931-6
Thomas, K. G., Bebeli, P. J. (2010). Genetic diversity of Greek Aegilops species using different types of nuclear genome markers. Mol. Phylogenet. Evol. 56, 951–961. doi: 10.1016/J.YMPEV.2010.04.041
Thomas, H., Howarth, C. J. (2000). Five ways to stay green. J. Exp. Bot. 51, 329–337. doi: 10.1093/jexbot/51.suppl_1.329
Thomas, H., Schellenberg, M., Vicentini, F., Matile, P. (1996). Gregor Mendel’s green and yellow pea seeds. Bot. Acta 109, 3–4. doi: 10.1111/j.1438-8677.1996.tb00862.x
Thomas, C. D., Cameron, A., Green, R. E., Bakkenes, M., Beaumont, L. J., Collingham, Y. C., et al. (2004). Extinction risk from climate change. Nature 427, 145–148. doi: 10.1038/nature02121
Tinker, N. A., Kilian, A., Wight, C. P., Heller-Uszynska, K., Wenzl, P., Rines, H. W., et al. (2009). New DArT markers for oat provide enhanced map coverage and global germplasm characterization. BMC Genomics 10, 39–60. doi: 10.1186/1471-2164-10-39
Tottman, D. R. (1987). The decimal code for the growth stages of cereals, with illustrations. Ann. Appl. Biol. 110, 441–454. doi: 10.1111/j.1744-7348.1987.tb03275.x
van Slageren, M. W. (1994). Wild Wheats: a Monograph of Aegilops L. and Amblyopyrum (Jaub and Spach) Eig (Poaceae). Wageningen: Wageningen Agricultural University Papers.
Vellend, M., Myers, J. A., Gardescu, S., Marks, P. L., et al. (2003). Dispersal of Trillium seeds by deer: implications for long-distance migration of forest herbs. Ecology 84, 1067–1072. doi: 10.1890/0012-9658(2003)084[1067:DOTSBD]2.0.CO;2
Wang, J., Luo, M. C., Chen, Z., You, F. M., Wei, Y., Zheng, Y. (2013). Aegilops tauschii single nucleotide polymorphisms shed light on the origins of wheat D-genome genetic diversity and pinpoint the geographic origin of hexaploid wheat. New Phytol. 198, 925–937. doi: 10.1111/nph.12164
Wenzl, P., Carling, J., Kudrna, D., Jaccoud, D., Huttner, E., Kleinhofs, A., et al.(2004). Diversity Arrays Technology (DArT) for whole-genome profiling of barley. Proc. Natl. Acad. Sci. 101, 9915–9920. doi: 10.1073/pnas.0401076101
Zaharieva, M., Monneveux, P. (2006). Spontaneous hybridization between bread wheat (Triticum aestivum L.) and its wild relatives in Europe. Crop Sci. 46, 512–527. doi: 10.2135/cropsci2005.0023
Zaharieva, M., Gaulin, E., Havaux, M., Acevedo, E., Monneveux, P. (2001a). Drought and heat responses in the wild wheat relative roth. Crop Sci. 41, 1321–1329. doi: 10.2135/cropsci2001.4141321x
Zaharieva, M., Monneveux, P., Henry, M., Rivoal, R., Valkoun, J., Nachit, M. M. (2001b). Evaluation of a collection of wild wheat relative Aegilops geniculata Roth and identification of potential sources for useful traits. Euphytica 119, 33–38. doi: 10.1023/A:1017500728227
Zaharieva, M., Prosperi, J. M., Monneveux, P. (2004). Ecological distribution and species diversity of Aegilops L. genus in Bulgaria. Biodivers. Conserv. 13, 2319–2337. doi: 10.1023/B:BIOC.0000047917.11509.a2
Zhang, P., Dundas, I. S., McIntosh, R. A., Xu, S. S., Park, R. F., Gill, B. S., et al. (2015). “Wheat–Aegilops Introgressions,” in Alien Introgression in Wheat: Cytogenetics, Molecular Biology, and Genomics. Eds. Molnár-Láng, M., Ceoloni, C., Doležel, J. (Springer International Publishing Cham), 221–243. doi: 10.1007/978-3-319-23494-6
Keywords: Aegilops biuncialis, genetic diversity, DArTseq markers, population structure, hierarchical clustering, heading time
Citation: Ivanizs L, Monostori I, Farkas A, Megyeri M, Mikó P, Türkösi E, Gaál E, Lenykó-Thegze A, Szőke-Pázsi K, Szakács É, Darkó É, Kiss T, Kilian A and Molnár I (2019) Unlocking the Genetic Diversity and Population Structure of a Wild Gene Source of Wheat, Aegilops biuncialis Vis., and Its Relationship With the Heading Time. Front. Plant Sci. 10:1531. doi: 10.3389/fpls.2019.01531
Received: 23 August 2019; Accepted: 01 November 2019;
Published: 22 November 2019.
Edited by:
Petr Smýkal, Palacký University, CzechiaReviewed by:
Shigeo Takumi, Kobe University, JapanIlaria Marcotuli, University of Bari Aldo Moro, Italy
Copyright © 2019 Ivanizs, Monostori, Farkas, Megyeri, Mikó, Türkösi, Gaál, Lenykó-Thegze, Szőke-Pázsi, Szakács, Darkó, Kiss, Kilian and Molnár. This is an open-access article distributed under the terms of the Creative Commons Attribution License (CC BY). The use, distribution or reproduction in other forums is permitted, provided the original author(s) and the copyright owner(s) are credited and that the original publication in this journal is cited, in accordance with accepted academic practice. No use, distribution or reproduction is permitted which does not comply with these terms.
*Correspondence: István Molnár, bW9sbmFyLmlzdHZhbkBhZ3Jhci5tdGEuaHU=
†These authors share first authorship