 Jose A. Vargas-Asencio
 Keith L. Perry
- Plant Pathology and Plant-Microbe Biology Section, School of Integrative Plant Science, Cornell University, Ithaca, NY, United States
Gene regulation involves the orchestrated action of multiple regulators to fine-tune the expression of genes. Hierarchical interactions and co-regulation among regulators are commonly observed in biological systems, leading to complex regulatory networks. Small RNA (sRNAs) have been shown to be important regulators of gene expression due to their involvement in multiple cellular processes. In plants, microRNA (miRNAs) and phased small interfering RNAs (phasiRNAs) correspond to two well-characterized types of sRNAs involved in the regulation of posttranscriptional gene expression, although information about their targets and interactions with other gene expression regulators is limited. We describe an extended sRNA-mediated regulatory network in Arabidopsis thaliana that provides a reference frame to understand sRNA biogenesis and activity at the genome-wide level. This regulatory network combines a comprehensive evaluation of phasiRNA production and sRNA targets supported by degradome data. The network includes ~17% of genes in the A. thaliana genome, representing ~50% annotated gene ontology (GO) functional categories. Approximately 14% of genes with GO annotations corresponding to regulation of gene expression were found to be under sRNA control. The unbiased bioinformatic approach used to produce the network was able to detect 107 PHAS loci (regions of phasiRNA production), 5,047 active phasiRNAs (~70% of which were non-canonical), and reconstruct 17 regulatory modules resulting from complex regulatory interactions between different sRNA-regulatory pathways. Known regulatory modules like miR173-TAS-PPR/TPR and miR390-TAS3-ARF/F-box were faithfully reconstructed and expanded, illustrating the accuracy and sensitivity of the methods and providing confidence for the validity of findings of previously unrecognized modules. The network presented here includes a 2X increase in the number of identified PHAS loci, a large complement (~70%) of non-canonical phasiRNAs, and the most comprehensive evaluation of sRNA cleavage activity in A. thaliana to date. Structural analysis showed similarities to networks of other biological systems and demonstrated connectivity between phasiRNA regulatory modules with extensive co-regulation of transcripts by miRNAs and phasiRNAs. The described regulatory network provides a reference that will facilitate global analyses of individual plant regulatory programs such as those that control homeostasis, development, and responses to biotic and abiotic environmental changes.
Introduction
Gene expression regulation is a cellular process that involves the orchestrated action of multiple regulators to fine-tune the expression of genes (Walczak and Tkačik, 2011). It can be thought of as the sum of interactions between regulatory factors and their substrates across multiple levels, as well as the effect of cross regulation between regulators from different levels. Regulatory levels range from DNA availability (chromatin structure, methylation status) to RNA abundance and translational efficiency (Walczak and Tkačik, 2011). This complex, multilevel process can be more adequately represented and studied using network theories (Cumbo et al., 2014). Network-based approaches allow the investigation of biological features that emerge when regulatory systems are studied from a multiscale, genomic approach (Stumpf and Wiuf, 2009). Features such as the topology and dynamics of these networks have been proposed to be informative and provide insights into the way organisms function, develop, and respond to internal and external stimuli (Cora et al., 2017). Network concepts and applications of network principles to biological systems have been thoroughly reviewed (Albert, 2005; Zhu et al., 2007; Pavlopoulos et al., 2011).
Transcription factors and small RNAs (sRNAs) are considered to be the primary levels of gene expression regulation (Cora et al., 2017). They act in combination to form genetic regulatory circuits involved in transcriptional control (Megraw et al., 2016; Cora et al., 2017). A significant body of research is dedicated to understanding how transcription factors are involved in the regulation of multiple cellular processes in Arabidopsis thaliana, one of the best studied plant model systems (Taylor-Teeples et al., 2015; González-Morales et al., 2016; Drapek et al., 2017). In contrast, broad scale studies of sRNA-mediated regulation in A. thaliana are not common and their scope is limited due to challenges posed by the high false positive rate of bioinformatic predictions of small RNA activities (Ding et al., 2012).
sRNAs have been shown to be involved in higher level regulatory interactions by controlling the expression of other regulators (transcription factors, sRNA biogenesis factors), thereby extending their regulatory contribution by affecting downstream events (Wang and Chekanova, 2016; Cora et al., 2017). Because of this and their involvement in key cellular processes, several studies propose them to be "master regulators" of gene expression and phenotype determination (Sun et al., 2010; Voorhoeve, 2010; Zhai et al., 2011).
In plants, sRNAs are the products of multiple biogenesis pathways (Borges and Martienssen, 2015). Because of their broad regulatory potential and better understood biogenesis and mode of actions (Wang and Chekanova, 2016), most reports focus on microRNAs (miRNAs) and phased interfering small RNAs (phasiRNAs). miRNAs are the better studied example, as their biogenesis and activity have been investigated intensively, and their involvement in multiple cellular processes through post transcriptional gene silencing (PTGS) has been well established (Borges and Martienssen, 2015). phasiRNAs are sRNAs produced from multiple pathways whose regulation involves regulatory cascades or modules; phasiRNAs are usually derived from a miRNA-transcript targeting event, leading to the production of additional phased small RNAs with the potential to regulate gene expression in cis and trans. sRNAs that induce phasiRNA production are referred to as "triggers," and cleavage at their target sites determines the phased register of the resulting phasiRNAs (Fei et al., 2013). A bias toward 22 nucleotide (nt) long RNAs has been observed for miRNAs that act as phasiRNA triggers; however, a two-hit mechanism has been proposed for 21 nt long miRNAs to trigger phasiRNA production [reviewed in Fei et al. (2013)].
The coding capacity of phasiRNA loci (PHAS loci; regions of phasiRNA production) has been underestimated, as demonstrated by Rajeswaran et al. (2012). Their results indicated that PHAS loci can have multiple triggers and their processing by dicer-like proteins (DCLs) can result in the production of a combination of 21 and 22 nt long phasiRNAs. Together, these features lead to new or shifted phased registers whose inclusion can greatly expand the repertoire of phasiRNAs produced from a given PHAS locus, with a commensurate increase in potential new targets (Fei et al., 2013). To highlight the recognition of shifted phased registers, we differentiate canonical and non-canonical phasiRNAs. Canonical phasiRNAs are 21 nt and produced strictly in a 21 nt register from the primary cutting site, the one giving rise to the most abundant number of phasiRNAs. Non-canonical phasiRNAs are those produced from alternative phased registers as well as all 22 nt long products. PhasiRNAs in the 21–22 nt size range act predominantly through PTGS; their role in gene regulation is currently an active field of research, and they function in development, defense, abiotic stress, and other biological processes (Wang and Chekanova, 2016).
Despite their significant regulatory potential, the understanding of miRNA- and phasiRNA-based gene regulation is limited. Genomic features or sequence signatures are not available to predict or detect PHAS loci, and current detection methods rely on sRNA expression data and the search for phased patterns in the distribution of sequenced sRNAs mapped to the genome or transcriptome (Guo et al., 2015). Expression of phasiRNAs has been shown to be inducible and dependent on specific stimuli (Komiya, 2017); therefore, a proper characterization requires an evaluation of data from multiple tissues, under different conditions and at different developmental stages.
In A. thaliana, multiple miRNA/phasiRNA modules have been described (reviewed in Fei et al., 2013; Wang and Chekanova, 2016). They are associated with cellular processes such as metabolic stress (Hu et al., 2011). However, there has been only one attempt to decipher genome-wide sRNA-mediated regulation (MacLean et al., 2010). These authors showed the potential for large scale sRNA-mediated regulatory networks, though their results were derived mostly from in silico predictions wherein the biological relevance had not been experimentally assessed. An important tool for validating predicted sRNA-transcript target interactions has been the development of degradome analyses (German et al., 2009). Degradome libraries capture the RNA products generated by sRNA targeting and cleavage of transcripts. By facilitating the experimental validation of the interactions in a high throughput manner, evaluations of sRNA activity and regulation through degradome analyses can be performed at a genome-wide level, resulting in networks of biological relevance.
The work described in this report was prompted by initial experiments designed to determine the plant sRNA-mediated response to virus infection. It became apparent that to identify changes in the plant sRNA response to virus (or any other biotic or abiotic stress), a global meta-network of interactions between sRNAs and transcribed RNA targets was required that could serve as reference for mapping changes. Changes in crop plant sRNA responses are being studied to improve crop productivity and better understand responses to drought (Zheng et al., 2019), nutritional stress (dos Santos et al., 2019), cold (Ghildiyal and Zamore, 2009; Bustamante et al., 2018; Zhu et al., 2019), and metal toxicity (Wang et al., 2019). Plant sRNAs regulate innate immunity to pathogens (Deng et al., 2018) and cross-kingdom RNA trafficking is being exploited as a crop protection strategy (Cai et al., 2018); the mechanism underlying these latter processes is sRNA-mediated RNA interference. The availability of a well-characterized network of sRNAs and transcribed RNA targets in the model plant A. thaliana will better enable progress for more applied studies in other plant species. Additionally, an expanded set of sRNA–mRNA interactions identified in studies such as this can facilitate approaches to metabolic pathway discovery using co-regulated (instead of colocalized) set of genes (Schläpfer et al., 2017). This latter suggestion stems from systems biology approaches for whole genome studies that have proven useful for the de novo identification of pathways and/or gene clusters, closing the genotype to phenotype gap (Ogura and Busch, 2016).
The objective of this study was to identify a comprehensive sRNA-mediated regulatory network at the genome-wide level in A. thaliana using a data-driven, degradome-supported bioinformatics analysis pipeline. This meta-network provides a reference frame for assessing sRNA-mediated regulation during growth, pathogenesis, and under different environmental conditions, and ultimately will reveal the role of sRNAs in the global genomic circuitry for the regulation of gene expression.
Materials and Methods
Experimental Design
Data were obtained by two methods: 1) all publicly available (NCBI) sRNA and degradome libraries from A. thaliana were compiled to provide a diverse representation of sRNA expression and regulation under varied conditions; these were derived from multiple tissues, developmental stages, and biotic and abiotic stress conditions; and 2) paired sets of sRNA-Seq and degradome data from aliquots of individual RNA extracts were produced as part of this study for 14 independent plant samples. There were four plant-virus treatments (described below) with four biological replicates per treatment for both sRNA-Seq and degradome analyses; two sRNA-seq libraries were low quality and removed. All the sRNA and degradome data from (1) and (2) were combined to identify an sRNA-mediated regulatory meta-network (described below).
Plant Growth Conditions, RNA Extraction, and Library Preparation
Two-week-old A. thaliana Col. plants grown at 22 C with a 10 h photoperiod were mechanically inoculated with Cucumber mosaic virus or rubbed without virus as mock controls. (These treatments are from a separate study and the effect of virus is not addressed in this report.) Leaf tissue was collected 10 days post-inoculation, ground in liquid nitrogen, and total RNA extracted using Trizol (Thermo-Fisher) as recommended by the manufacturer. Each resulting RNA preparation was divided into two aliquots to be used as input for sRNA-Seq and degradome libraries. sRNA libraries were prepared from 1 μg of total RNA using methods described previously (Vargas-Asencio et al., 2017). For the degradome libraries, ~40 μg of total RNA was used. Degradome libraries were constructed using the method described by Zhai et al. (2014), but with the following modifications: a) different adapters and primer sequences were used (Additional file 1: Table S1), b) the PCR clean-up step was performed using Axygen™ AxyPrep Mag™ PCR Clean-up (Fisher) instead of Agencourt AMPure XP beads (Beckman Coulter), and c) EcoP151 (NEB) was used for the restriction enzyme digestion step instead of MmeI. Sequencing was performed using an Illumina Hiseq 4000 at the Genomics Resources Core Facility, Weill Cornell, NY, to obtain single-end 51-nt reads for both sRNA (accessions: SRR6234880- SRR6234893) and degradome libraries (accessions: SRR6235006- SRR6235021).
Bioinformatics Tool for Identification of sRNA-Mediated Networks
A custom bioinformatics pipeline was implemented to identify sRNA-mediated networks. A detailed description is provided in the following sections. The overall strategy was to gather all available sRNA and degradome data, and to combine it with existing genome annotations and sRNA databases to produce a data-driven, degradome-supported network of interactions between sRNAs and transcripts. There are two types of nodes in the proposed network: sRNAs and transcripts. sRNAs include miRNA and phasiRNAs, and transcripts include miRNA precursors, PHAS loci, and mRNA transcripts targeted by sRNAs. Annotations are available for miRNAs, miRNA precursors, and potential target transcripts, while for PHAS loci, their sRNA triggers, and the resulting phasiRNAs, there are no genome-wide annotation available. The identification of these components and their interactions was therefore part of the tasks included in the pipeline. Newly generated annotations were combined with available genome and known miRNA annotations to perform a genome-wide-level search for sRNA–target interactions. Once all components and their interactions were identified and experimentally validated, they were consolidated into a network for downstream analysis.
Reference Files and Datasets
The TAIR10 version for A. thaliana provided the reference genome (Swarbreck et al., 2008). Genome annotations were obtained from Araport11 (Cheng et al., 2017). Known miRNA and precursor sequences were obtained from miRBase (Kozomara and Griffiths-Jones, 2014) release 22. Gene ontology terms were obtained from Ensembl Genomes release 37 (Kersey et al., 2017).
Fourteen sRNA and 16 degradome libraries were produced in this study. These data were complemented with all publicly available sRNA datasets representing different tissues, stress conditions (biotic and abiotic), and developmental stages in A. thaliana (Additional file 2: Table S2), as well as all available degradome datasets (Additional file 3: Table S3).
Data Processing
Reads (51 nt) from sRNA-Seq libraries were filtered using the adaptive adapter trimming function in Trim Galore (Kruger) to account for variability in library construction methodologies. Size was constrained to 20–40 nt after adapter trimming, and non-adapter containing reads were removed. Datasets were collapsed to unique sequences using the Fastx toolkit (Hannon); sequences with fewer than 50 reads were removed. Libraries containing less than 100 unique sequences were considered non-informative and removed. SRA degradome libraries were filtered using the adaptive adapter trimming function in Trim Galore with the minimum size after adapter trimming set to 18 nt. The resulting libraries were evaluated manually, and additional trimming was performed if there was evidence of remaining adapter sequences. For the libraries produced in this study, the first 6 nt derived from the library preparation process were removed. The Fastx toolkit was used to convert reads to fasta format.
miRNA-PHAS loci-phasiRNA Annotation and Trigger Identification
PHAS loci detection was performed for each dataset using PhaseTank (Guo et al., 2015). Locus extension was set to zero, and the top 15% of regions with the highest accumulation of mapped reads (described as relative small RNA production regions in Guo et al., 2015) were analyzed for phasiRNA production. Results for all datasets were combined to produce PHAS loci with maximum length from overlapped results. Potential PHAS loci detected in less than 3 of the 902 libraries were discarded. The resulting loci were then extended by 220 nt on each side to perform a search for sRNA triggers associated with phasiRNA production.
PhasiRNA production triggers were searched using the degradome data. Thirty-nine degradome libraries were independently analyzed using CleaveLand4 (Addo-Quaye et al., 2009). Sequences from both strands of the extended PHAS loci were evaluated using known miRNAs as queries. A weighted scoring system (deg_score) to compile the independent degradome analysis results was developed as follows: cleavage events with degradome category zero per CleaveLand4 were given a score of 5, cleavage events with degradome category one were given a score of 4, cleavage events with degradome category two were given a score of 0.5. The scores for each event were added across all 39 degradome libraries. The highest scoring event per PHAS locus was selected as the initial phasiRNA triggering site; a minimum score of 10 was set to assigned triggers. When triggers were found, the polarity of the loci was set to the strand complementary to the triggers.
To identify the phasiRNAs produced by each PHAS locus sRNA reads from each library were mapped to the extended PHAS loci independently. No mismatches were allowed, sRNAs of 21 and 22 nt were accepted, counts for reads mapping to multiple locations were divided between the number of locations, reads with more than 10 mapping locations were removed, and reads mapping outside the original region (before extension) were not considered. Mapped reads were assigned to bins from 1 to 21 (phases) according to their mapping positions from the 5' end. Positions of reverse reads were shifted (+2) due to 3' overhang, to match forward read bin positions. The mapping was performed on each strand of the PHAS loci independently. A scoring system was developed to rank bins by read abundance for each locus across all sRNA libraries. The three most abundant bins per locus per library were used. The most abundant bin was given a score of 5, the second most abundant was given a score of 2, and the third most abundant was given a score of 0.5. The resulting scores from all libraries were added for each bin to produce a ranking of sRNA bins for each PHAS locus.
PhasiRNAs derived from miRNA triggering events were found by matching the phase register set by the degradome-confirmed miRNA triggering events to bin assignments. PhasiRNAs from immediately adjacent bins (-1, +1) were also collected. For the PHAS loci where no trigger was found, sRNAs from the most abundant bin and immediately adjacent bins were collected.
Resulting phasiRNAs were pooled with all known miRNAs to produce a new set of queries to search for phasiRNA production triggers using the degradome-based ranking strategy described above. To identify secondary and/or tertiary triggers, sRNAs whose cleavage events matched the polarity of the primary trigger (highest ranked, with score >10) were kept. The potential secondary/tertiary triggers were evaluated by matching their slicing site coordinates to those corresponding to the three most abundant sRNA bins per PHAS locus. Because 22-nt sRNAs were included in the analysis, which can alter the 21 nt phasing, the bins immediately adjacent (-1,+1) were also considered. In the cases where a match was found, the sRNAs were considered additional phasiRNA triggers. The assignment of secondary/tertiary triggers was further evaluated by determining if the phasiRNAs contained in the matched bins were biologically active (described below). PhasiRNAs derived from secondary and/or tertiary sRNA triggering events were found by matching the phase register set by the degradome-derived sRNA triggering events to bin assignments. The resulting phasiRNAs were pooled with known miRNAs to produce a final set of queries to search for phasiRNA production triggers using the strategy described above in this paragraph.
Corresponding trigger, PHAS locus and phasiRNA sets were evaluated and confirmed manually to produce a miRNA-PHAS loci-phasiRNA annotation. A novel nomenclature is proposed for phasiRNAs in order to provide consistent and detailed information about their biogenesis. To assign a PHAS loci to a gene ID, the PHAS loci with polarity assigned based on confirmed sRNA triggers were compared to the araport11 genome annotation, and if the locus had significant overlap (>70%) and matching polarity to annotated features (genes, transposons), the locus was assigned to the feature. If more than one feature matched a locus. If no trigger was found but the PHAS locus overlapped with an annotation, a tentative assignation notated with lowercase was used; if the PHAS locus did not match any annotation, the forward genomic orientation was kept and the loci were named using their coordinates. For phasiRNAs, they were named using the PHAS locus from which they derived, followed by up to four descriptors: 1) the number of registers (21 nt) from the 5' end of the transcript; 2) in parenthesis, offset to main phased register, if any; 3) polarity, a “+” was used if the phasiRNA derived from the mRNA strand or “-” if derived from the complementary sense strand; and 4) size was indicated in the case of 22 nt long phasiRNAs by adding “_22” to the end.
Evaluation of PHAS Loci Characterization
To determine if the selection of canonical and non-canonical phased registers within phasi loci was adequate, all sRNAs (>50 copies per library) of 21 and 22 nt produced in this study that mapped to the A. thaliana genome were mapped to the regions where PHAS loci were detected. The mapped reads were evaluated according to whether their position corresponded to sites described in the resulting annotation.
Proportion of sRNAs Identified Using the miRNA-PHAS Loci-phasiRNA Annotation
To evaluate the improvement in identification of sRNAs from sRNA-Seq datasets, all sRNAs of presumed biological relevance (e.g., with >50 copies per library) were identified using the annotation produced in this study. The relative abundance of the distinct types of sRNAs under consideration was evaluated based on the abundance of unique and total reads.
Target Transcript Search and Characterization
The miRNA-PHAS loci-phasiRNA annotation was used to identify and quantify miRNAs and phasiRNAs as described above; an arbitrary threshold of 50 combined raw count was established to select candidates for transcript targets. Degradome datasets were analyzed independently using CleaveLand4 (Addo-Quaye et al., 2009) to find target transcripts for selected sRNAs. A custom scoring system (target_deg_score) was developed to evaluate the confidence and repeatability of sRNA–target transcript interactions. The following weighted scores were assigned to the degradome categories described in CleaveLand4 (Addo-Quaye et al., 2009): category 0 hits were given a score of 5, category 1 were given a score of 4, and category 2 were given a score of 0.5. Categories 3 and 4 were not considered informative. The scores were summed across all libraries for each cleavage event detected. An empirical cumulative distribution analysis was performed for the target_deg_scores and an arbitrary threshold of 15 was established to select for the 1% most reliable (high quality, most repeatable) sRNA–target transcript interactions.
For the curated set of sRNA–transcript pairs, the location of the target site in the transcript was converted to genomic coordinates using the GET map/cdna/:id/:region API from Ensembl Genomes (Kersey et al., 2017). Genomic features overlapping the resulting genomic coordinates were extracted and tabulated according to their abundance.
Network Analysis and Visualization
For the sRNA-mediated regulatory meta-network, a bipartite directed meta-network was constructed by obtaining sRNAs, transcripts, and their interactions from a combination of existing miRNA and transcript annotations, the newly developed miRNA-PHAS loci-phasiRNA annotation, and the degradome search results from all datasets. Cytoscape (Shannon et al., 2003) was used for visualization and structural analysis. A functional characterization was performed using Bingo (Maere et al., 2005) to determine the representation of GO Slim categories of the genes included in the network as compared to the genome as a whole.
Results
PHAS Loci Detection
Currently there are no genomic features or sequence signatures that allow the identification of PHAS loci (regions of phasiRNA production) from a genome sequence; instead their detection depends on a search for phased patterns in sRNA-Seq data. Because of the observed variability in size between sRNA libraries and the assumption that phasiRNA expression may depend on specific environmental queues, the strategy used to identify PHAS loci was to independently evaluate sRNA-Seq datasets and then merge overlapping results to produce PHAS loci with maximum length. The number of consensus PHAS loci detected was variable, ranging from zero to more than 120 per library (Figure 1A).
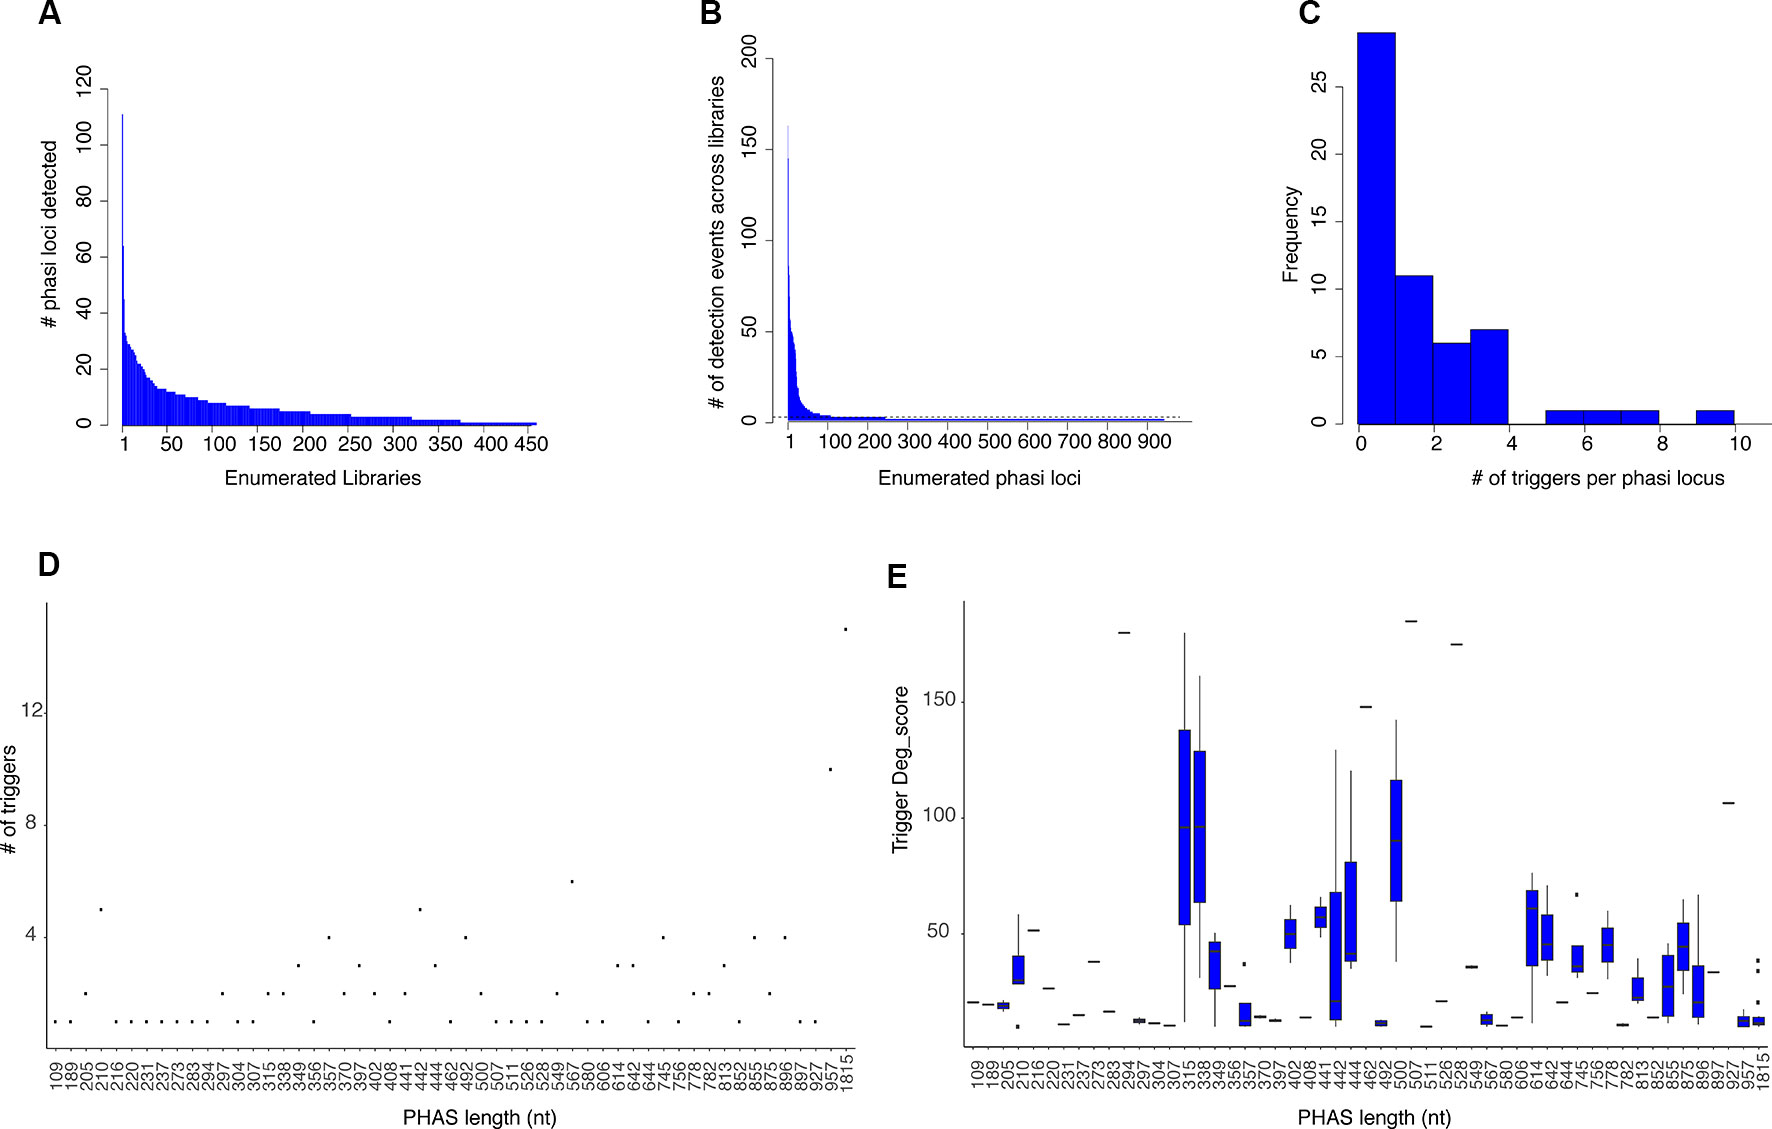
Figure 1 PHAS loci and phasiRNA triggers. (A) Histogram showing the number of PHAS loci detected per sRNA library across all libraries. Libraries are enumerated in the x axis; 902 libraries were evaluated and only those in which PHAS loci were found (n=426) are shown. The y axis shows the number of PHAS loci detected per library. (B) Histogram summarizing of recognition events (detection) of bona fide PHAS loci across all libraries. PHAS loci are enumerated in the x axis. The y axis shows the number of libraries in which a given PHAS locus was detected. Dotted line indicates the three detection events threshold utilized. (C) Distribution of number of phasiRNA production triggers in PHAS loci. (D) Degradome supported sRNA triggers. A Dot plot representation of the relationship between the number of degradome supported sRNA triggers and the length in nucleotides of the PHAS loci. (E) Boxplot representation of the degradome scores (deg_score) of identified sRNA triggers per PHAS loci length.
A total of 942 PHAS loci were identified from the combined libraries (n=902; Additional file 4: Table S4). The consistency of PHAS loci detection was evaluated by determining the number of recognition events for each locus across all libraries. To remove spurious results, only PHAS loci detected in at least three libraries were included. The number of recognition events varied, with 107 PHAS loci independently detected in at least three libraries (Figure 1B). A failure to detect any given locus in a specific library could be due to expression limited to specific experiment conditions, e.g., stress, developmental stage, or tissue type or to a limitation in sensitivity.
PhasiRNA Trigger Search
Once PHAS loci had been identified, a recursive method was designed to identify triggers by extending a search up and downstream of the detected PHAS loci, followed by searches for secondary or tertiary triggers that would explain the production of non-canonical phasiRNAs (22 nt long or derived from an alternative phased register). sRNAs were considered triggers if their predicted targeted position on the PHAS locus was consistent with the distribution of sRNAs and was supported by degradome data according to the quantitative criteria (deg_score) detailed in Materials and Methods. For the 107 PHAS loci evaluated, triggers were assigned for 57 of them. From the 108 unique sRNAs triggers identified, 16 corresponded to miRNAs and 92 were phasiRNAs; in some cases, sRNAs were assigned to multiple PHAS loci (Additional file 5: Table S5). Among the triggers, there were 16 canonical phasiRNA; 45 were 22 nt long, 64 were from a secondary phased register; 33 were both 22 nt long and derived from a secondary phased register. Consistent with Rajeswaran et al. (2012), multiple triggers per PHAS locus were detected in some cases (Figure 1C). The length of the PHAS locus was positively correlated with the number of putative triggers (R2 = 0.59, t = 5.54, df = 55, p < 0.01, Figure 1D); however, the magnitude of degradome support for putative triggers only showed a weak negative correlation with PHAS locus length (R2= -0.199, t = -2.8093, df = 190, p < 0.01, Figure 1E). Together these results indicate that even though more putative triggers were found for larger PHAS loci, the degradome support for sRNA triggers in larger PHAS loci was essentially retained.
Genomic Features Assignment for PHAS Loci
To identify the genes or genome features corresponding to PHAS loci, regions containing PHAS loci were compared to the Araport11 (Cheng et al., 2017) genome annotation. An sRNA trigger acts on the transcribed strand of the PHAS locus, and when available, the polarity of the transcripts was inferred from the trigger assignments described in Additional file 5: Table S5. Knowledge of the transcript's polarity increased the confidence in the identification of the corresponding gene or feature and helped to resolve situations where annotated features existed for both genomic strands. Ninety-two of the 107 PHAS loci overlapped with annotated genomic locations, of which 49 were specifically assigned to genes based on their location and inferred strand polarity (Table 1). Six of the PHAS regions overlapped with two genomic features (when genes are present at the + and - strands) for a total of 98 genomic features that overlapped with the identified PHAS loci. These included: i) 41 PHAS loci overlapping with gene types previously shown to be involved in phasiRNA production, including six TAS genes, 20 (one pseudogene) Pentatricopeptide repeat/Tetratricopeptide repeat (PPR/TPR) protein genes, six F-box containing /Auxin response genes (ARFs), five (one pseudogene) nucleotide binding site-leucine rich repeat (NBS-LRR) domain containing genes (two PHAS loci were found in AT5G38850) (Wang and Chekanova, 2016), AGO1, a cation exchanger, a basic helix-loop-helix (bHLH) transcription factor and a Curculin-like (mannose-binding) lectin family protein (Chen et al., 2007; Xia et al., 2015); ii) six genes involved in gene expression regulation including DCL1, three GRAS family transcription factors, one LOB domain-containing transcription factor, and a DNA methyl transferase were found to produce phasiRNAs; iii) 24 genes involved in metabolism, structure, and other functions, with no previous connections to phasiRNAs; iv) 14 detected PHAS loci overlapping with 12 transposable elements (three PHAS loci were found in AT1TE51040); and v) a mixture of 13 overlapping sites, including five annotated as “long non-coding RNA,” four “Novel transcribed regions,” one “Other RNA,” and three with “natural antisense transcript”; these regions of phasiRNA production can be re-annotated as PHAS loci based on these results. There were 15 additional PHAS loci located in unannotated regions of the A. thaliana genome.
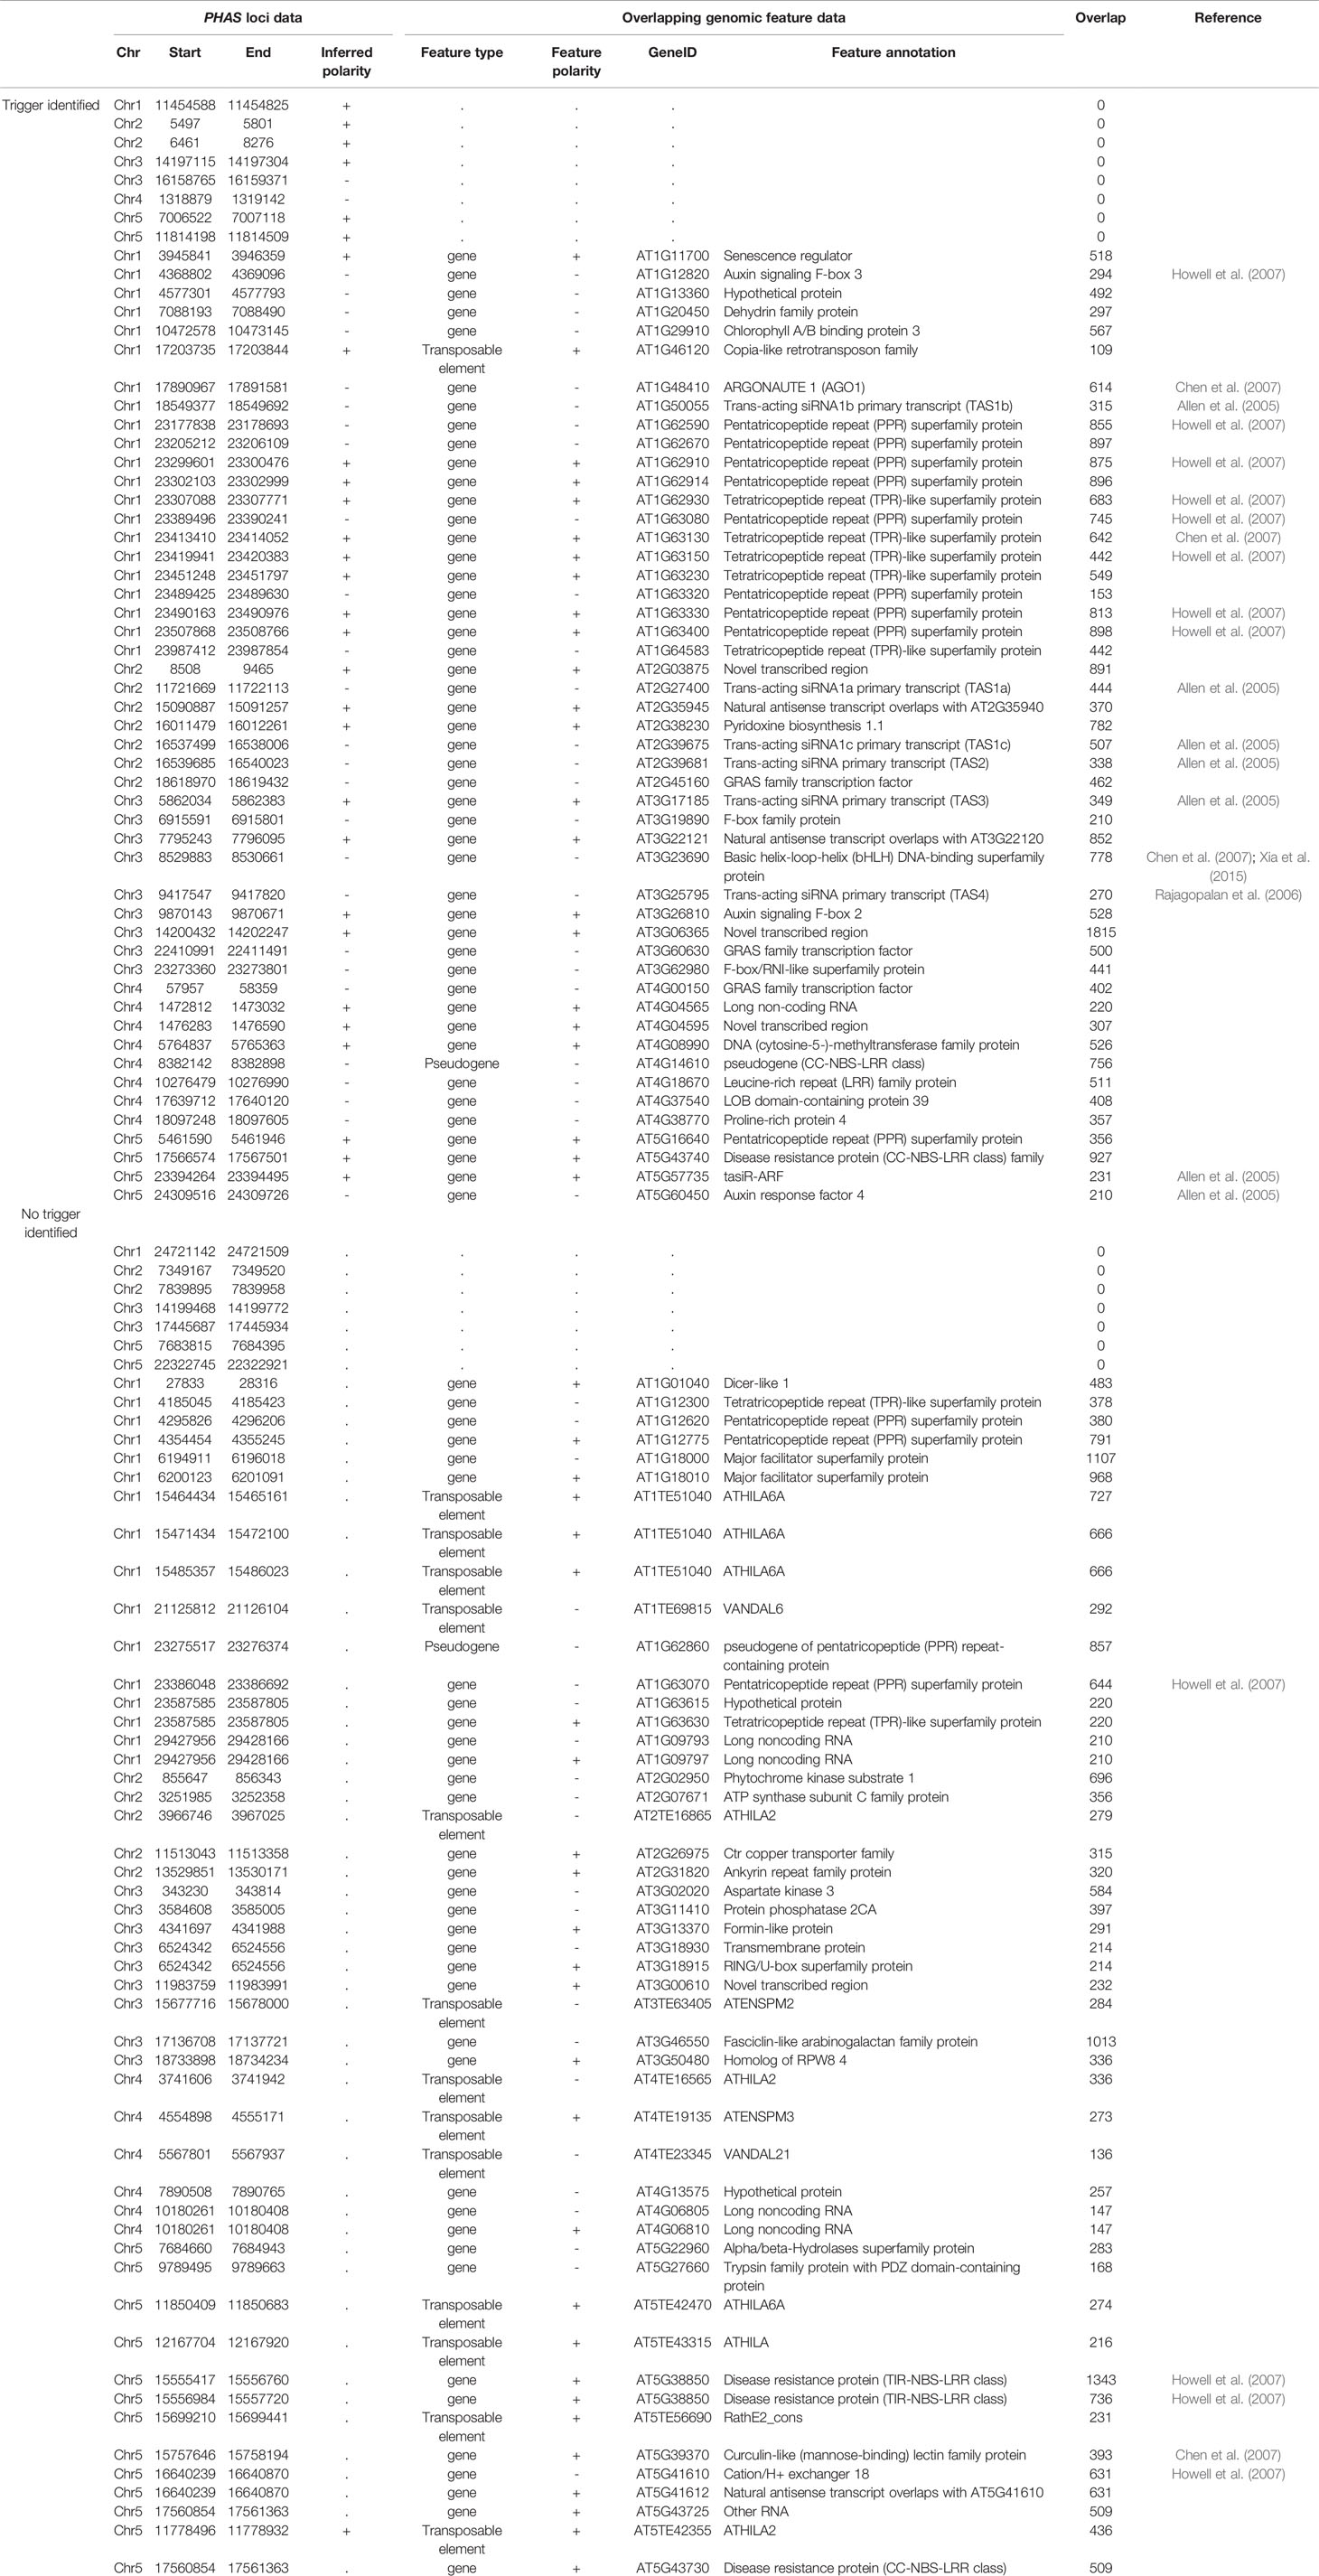
Table 1 Overlap of detected phasiRNA loci to genomic features (n=107).
Interactions Between PHAS Regions
PhasiRNAs have the capacity to act as triggers to induce phasiRNA production in cis and/or trans by targeting their progenitor transcripts or unrelated transcripts, respectively, leading to regulatory modules that can involve multiple PHAS loci with the potential to integrate the regulation of phasiRNA production. Though a number of interactions of this kind (referred to herein as high-level interactions) have been described (Rajeswaran et al., 2012; Xia et al., 2017), a genome-level evaluation is not available.
To better understand these high-level interactions between PHAS loci, regulatory modules were constructed from PHAS loci connected by the phasiRNA triggering events tabulated in Additional file 5: Table S5. Seventeen regulatory modules of varying size and complexity were identified and are shown in Figure 2. Specific details on any component of the network can be found by cross-referencing Figure 2 with the tabulated information in Additional file 5: Table S5. Consistent with the validity of the methodological approaches taken, the results included previously described interactions such as miR173-TAS1-TAS2-PPR/TPR (Allen et al., 2005; Howell et al., 2007), miR161-PPR (Howell et al., 2007), mir390-TAS3-ARF (Ozerova et al., 2013; Xia et al., 2017), miR393-AFB (Si-Ammour et al., 2011), miR828-TAS4 (Rajagopalan et al., 2006), miR472-NBS-LRR (Boccara et al., 2014), and miR168-AGO1 (Mallory and Vaucheret, 2009). The genome-wide approach used in this study allowed an extension of some of these modules. The miR173-TAS1/2-PPR/TPR was found to include seven additional PPR/TPR genes, a connection to miR161.2 and to interact with phasiRNAs-producing non-coding RNAs. A Basic helix-loop-helix (bHLH) type transcription factor and one non-coding RNA were linked to the miR393-AFB-F-box module, suggesting the existence of complex hormone-sRNA-TF regulatory interactions. The miR168-AGO1 (Mallory and Vaucheret, 2009) was extended to include interactions with non-coding RNAs, chlorophyll A/B binding proteins, and Proline-rich proteins 4. The miR2939-F-box module makes the third example of F-box containing regulatory modules, indicating an important connection between hormone and sRNA-mediated regulation. Two previously undescribed modules involving important transcriptional level regulators were identified. miR170-miR171-GRAS TF-F-box-LOB and miR773-DNA-MET provide further evidence for a direct connection between transcriptional and post-transcriptional regulation. Eight additional modules included combinations of non-coding RNAs, unannotated regions, and other genes not previously reported to produce phasiRNAs.
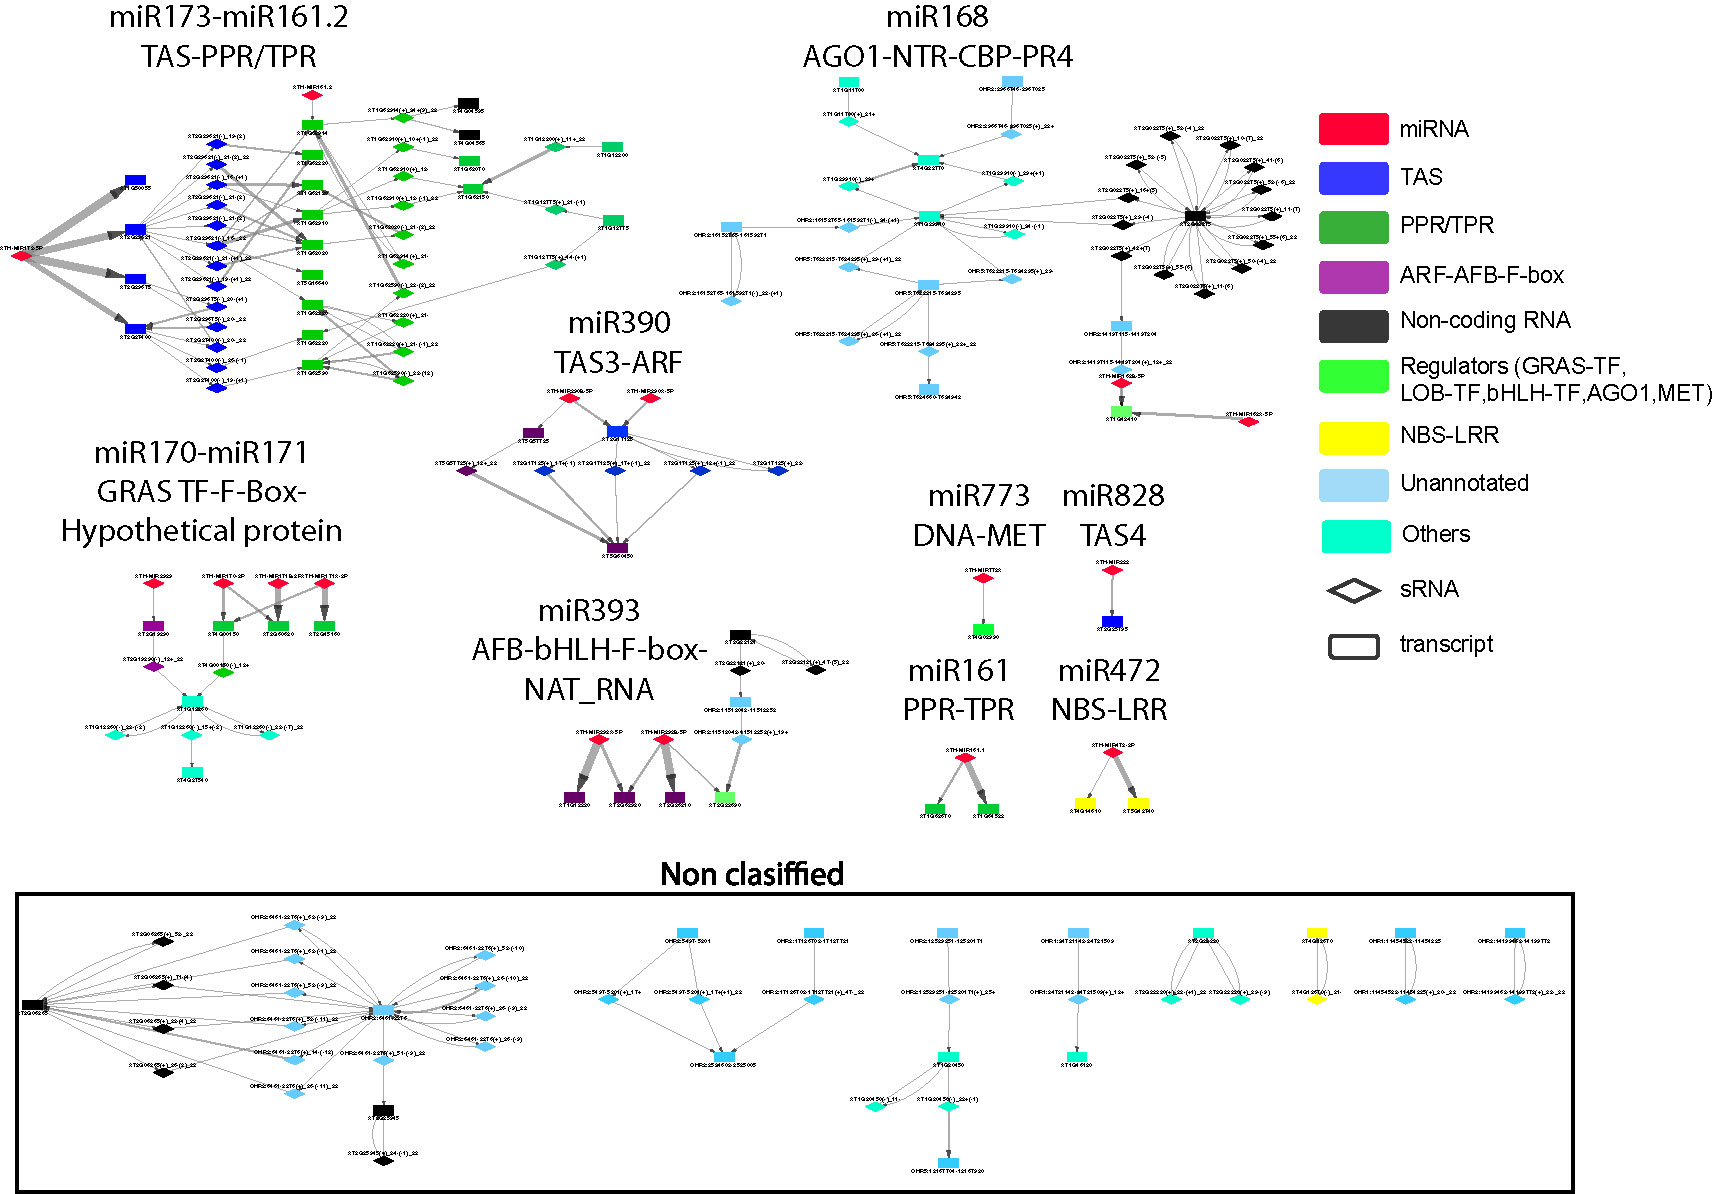
Figure 2 Network representation of interactions between phased interfering small RNA producing loci (PHAS) and small RNA (sRNA). PHAS loci connected by sRNA triggers were grouped into modules. Gene families previously reported as associated to PHAS loci and sRNA derived from these loci were colored as follows: miRNA (micro RNA) = red; TAS (Trans-acting small interfering RNAs) = dark blue, PPR/TPR (Pentatricopeptide/Tetratricopeptide repeat-like superfamily) = dark green; ARF-AFB-F-box (Auxin response factor/F-box containing protein) = purple, Non-coding RNA=black, Regulators=light green, NBS-LRR (Nucleotide binding leucine rich repeat protein) = yellow, genes/regions not previously associated to phasiRNA production or unannotated = light blue, Others=cyan. Diamonds represent sRNAs; rectangles represent PHAS loci. Non-coding RNAs include novel transcribed regions, natural antisense RNA, and long non-coding RNAs. Other acronyms are: GRAS TF=GRAS family transcription factor, AGO1=Argonaute 1 protein, MET= DNA (cytosine-5-)-methyltransferase family protein, LOB-TF= LOB domain-containing transcription factor, bHLH-TF= Basic helix-loop-helix (bHLH) DNA-binding superfamily protein transcription factor, CBP=chlorophyll A/B binding protein, NTR=novel transcribed region. The edge thickness between sRNAs and PHAS loci represents the degradome support for each interaction. Details for all of the node names in very small font can be in found in Additional file 5: Table S5, where they are listed individually within each of the 17 regulatory modules; alternatively they can be read within the (enlarged) online version.
Evaluation of PHAS Loci Characterization
The identification of phased registers in PHAS loci is complicated by the possibility of multiple phasiRNA producing triggers and the presence of shift-inducing 22 nt long phasiRNAs. To evaluate the accuracy in phased register selection within PHAS loci, the relative abundance of reads mapping to the PHAS loci regions that match the selected phased registers was evaluated; assuming the abundance of sRNAs is indicative of biological activity, a high proportion of recalled sRNAs would indicate the correct registers were selected. Over 75% of all reads mapping to regions where PHAS loci were detected belong to the registers included in the annotation (Figure 3A). These results indicate that the annotation produced from a composite analysis of all available sRNAs libraries in A. thaliana resulted in an adequate representation of PHAS regions that can be used to successfully identify phasiRNAs in individual libraries.
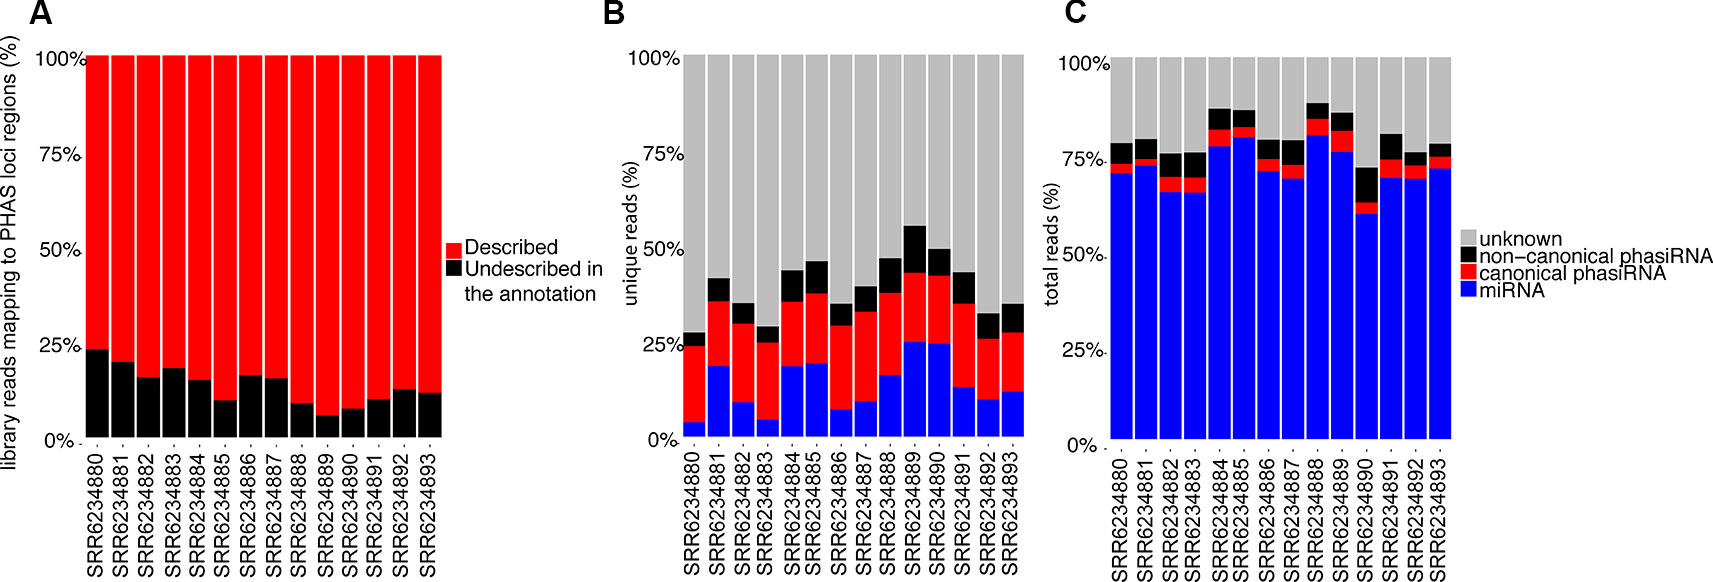
Figure 3 (A) Relative abundance of reads (>50 copies) mapping to PHAS loci that matched annotated phased registers. The category “Described in the annotation” indicates percentage of all reads mapping to regions where PHAS loci were detected that belong to the registers indicated in the annotation. (B) Relative abundance of unique 21 and 22 nt long sRNAs (>50 copies) based on their type, showing the relative proportion of sRNA types among unique reads. (C) Relative abundance of total 21 and 22 nt long sRNAs (>50 copies) based on their type, showing the sRNA types among all reads.
Proportion of sRNA Identified Using the miRNA-PHAS Loci-PhasiRNA Annotation
Multiple classes of sRNAs are known in A. thaliana, but an adequate annotation is only available for miRNAs (n=428); phasiRNAs have been reported sparsely, with Rajeswaran et al. (2012) providing the only case where phasiRNAs derived from the TAS1c locus are reported with details of their origin and phased register allowing their identification. Using the resulting miRNA-PHAS loci-phasiRNA annotation from our bioinformatics analysis, ~30 to 50% of all unique 21 and 22 nt long sRNAs from the sRNA-Seq datasets produced in this study were identified (Figure 3B); this nearly doubles in most cases the number of unique sequences identified, though a significant number remained unidentified. Evaluation of the total reads (Figure 3C) indicates that miRNAs make up the large majority of sRNA reads. There are ~10% of reads corresponding to phasiRNAs, both canonical and non-canonical, and ~15% of reads that remained unassigned.
Experimental Support for sRNA Cleavage Activity
In plants, sRNAs act mainly through cleavage of their transcripts, yet there are examples of other mechanisms such as translational repression (Borges and Martienssen, 2015; Wang and Chekanova, 2016). Also, it has been shown that not all phasiRNAs produced from a PHAS locus are active; instead only some of them appear to be competent for loading into argonaute (AGO) containing complexes where they exert their activities (Fei et al., 2013). Therefore, in this study known miRNAs and phasiRNAs derived from the detected PHAS loci (including non-canonical phasiRNAs) were evaluated for biological activity using degradome data.
For A. thaliana, a limited number of degradome libraries are publicly available (Additional file 3: Table S3), including 11 datasets corresponding to inflorescence tissue, 6 to leaf tissue, 5 to seedling tissue, and 1 whole plant (Addo-Quaye et al., 2008; Creasey et al., 2014; Thatcher et al., 2015; Hou et al., 2016; Lin et al., 2017). Sixteen new degradome libraries from Cucumber mosaic virus-infected leaf tissue were produced as part of this study (accessions: SRR6235006-SRR6235021) and all available libraries were evaluated based on their yield (Figure 4). The data produced in this study represented a significant increase (~20%) in the total amount of degradome data available for A. thaliana in the NCBI SRA database.
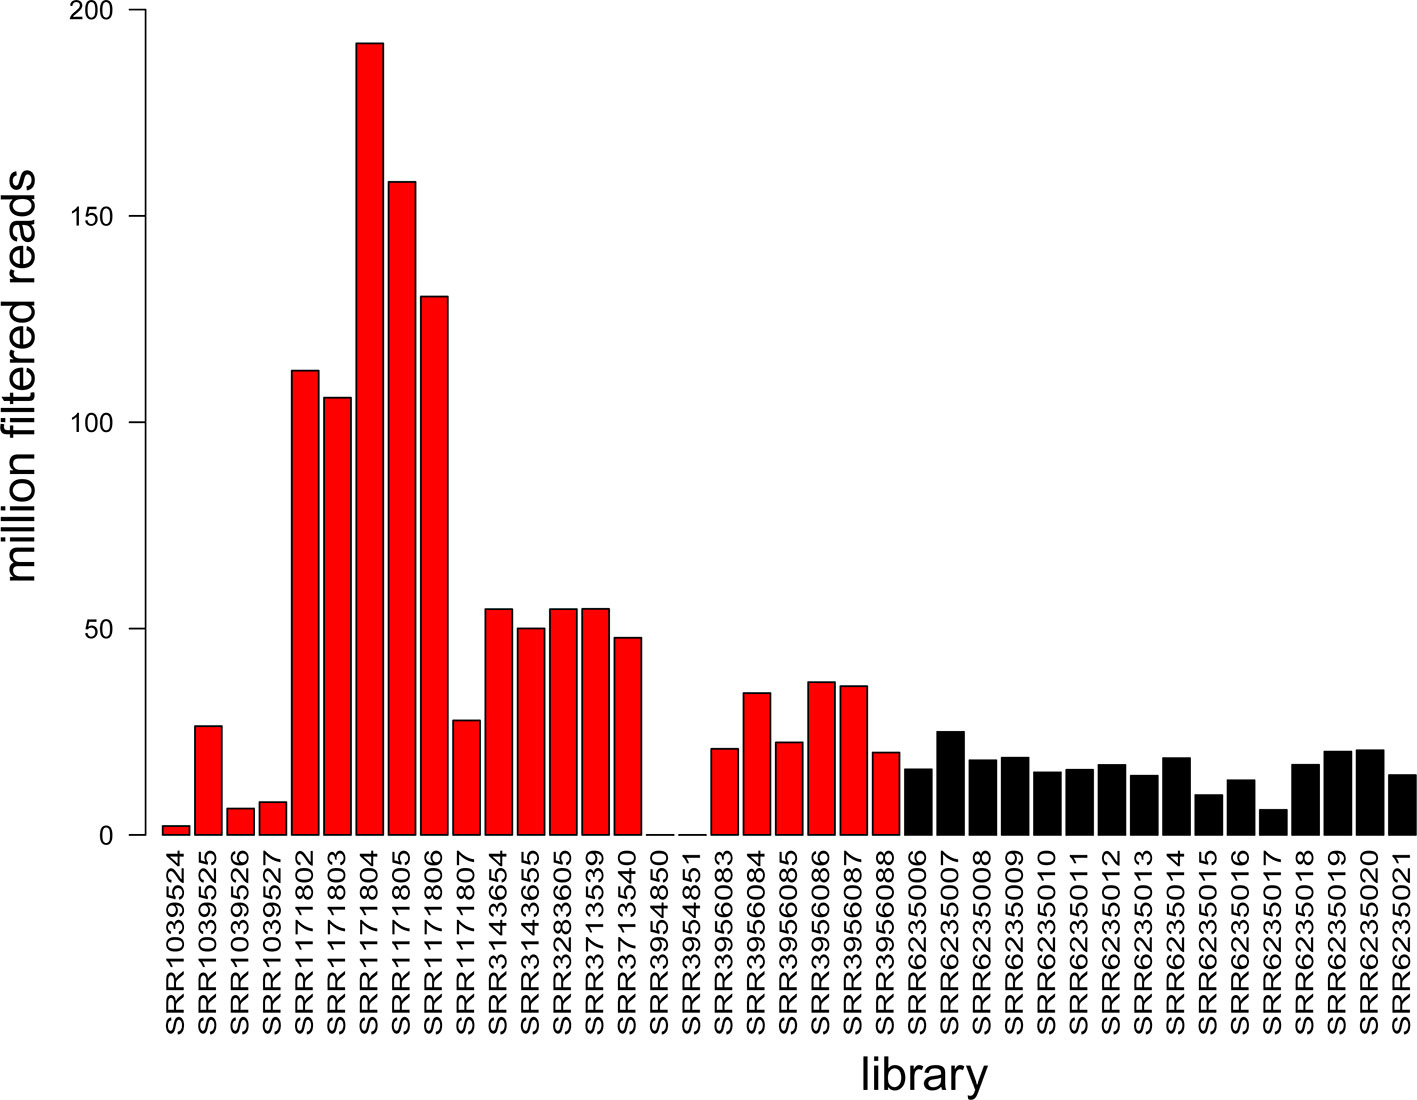
Figure 4 Summary of information available in degradome libraries. The histogram shows library yield as the number of million filtered reads for each of the 39 libraries. Colors: black refers to data produced in this study (16 libraries) and red refers to NCBI SRA data (23 libraries).
To select for high confidence degradome supported sRNA–transcript interactions, quality and repeatability was evaluated using a custom scoring system (deg_score). The distribution of deg_scores for cleavage events was evaluated across all degradome libraries. Only the top 1% set of interactions (deg_score > 15) was considered for downstream analysis (Figure 5).
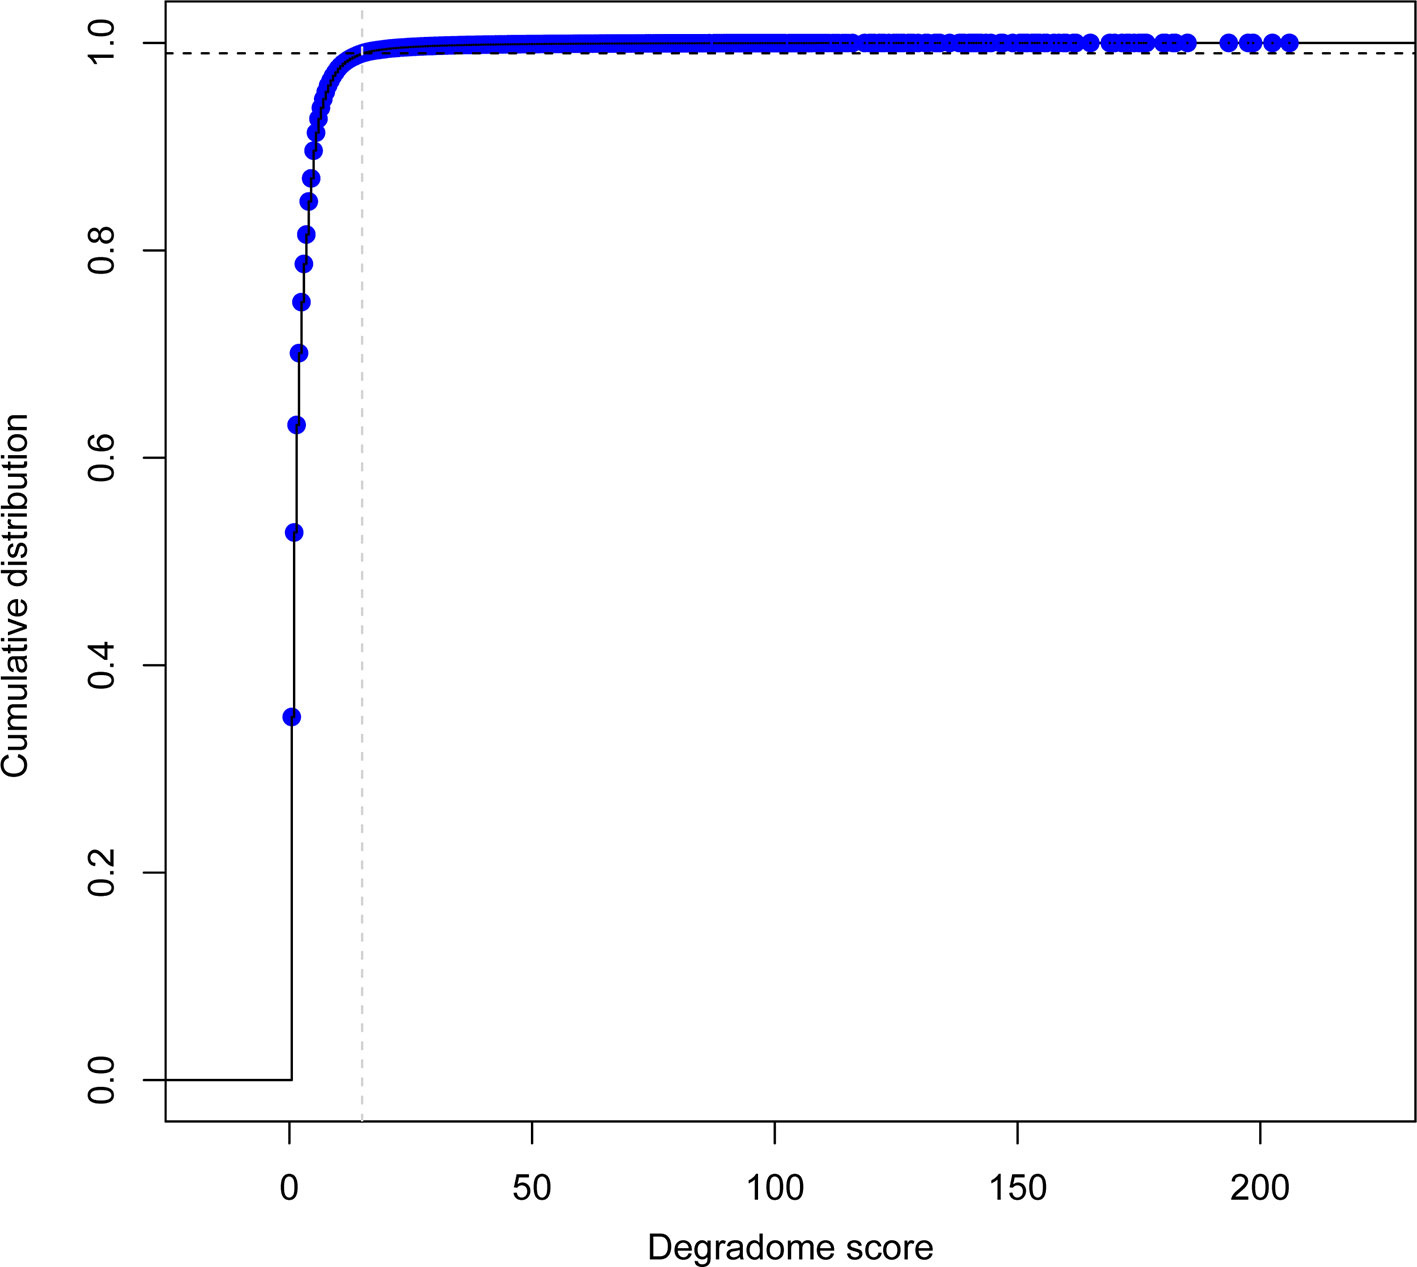
Figure 5 Empirical cumulative distribution function of degradome detection events per sRNA-transcript pair across all degradome libraries (n=39). Gray dashed line indicates the location for the degradome score (deg_score) value of 15; black dashed line indicates the corresponding 99% threshold.
sRNAs were annotated as active if at least one of their predicted targets was confirmed (Additional file 6: Table S6). Experimental support was found for the targeting and cleavage activity of 201 out of 428 of annotated miRNAs, and the number of targets per active miRNA ranged from 1 to 46. In the case of phasiRNAs, 5047 out of 28,464 (~18%) were found to be active, and the number of targets per active phasiRNA ranged from 1 to 39.
Previous studies on smaller datasets had reported the presence of sRNA targets in the 5'UTR (untranslated region), CDS (coding sequence), and 3'UTR regions of the genes (Kamthan et al., 2015). Given the significantly larger number of sRNA target sites identified here, the distribution of sites per region in the genes of target transcripts was evaluated to determine if there is a bias towards specific regions. CDS regions had the highest number of sRNA target sites, followed by 3' UTR and 5' UTRs (Figure 6). It should be noted that these results were not weighted to match the length of these gene features, and the observed distribution could be proportional to the total size of these features in the genome. A very small fraction (~0.03%) of target sites resided in non-coding RNAs.
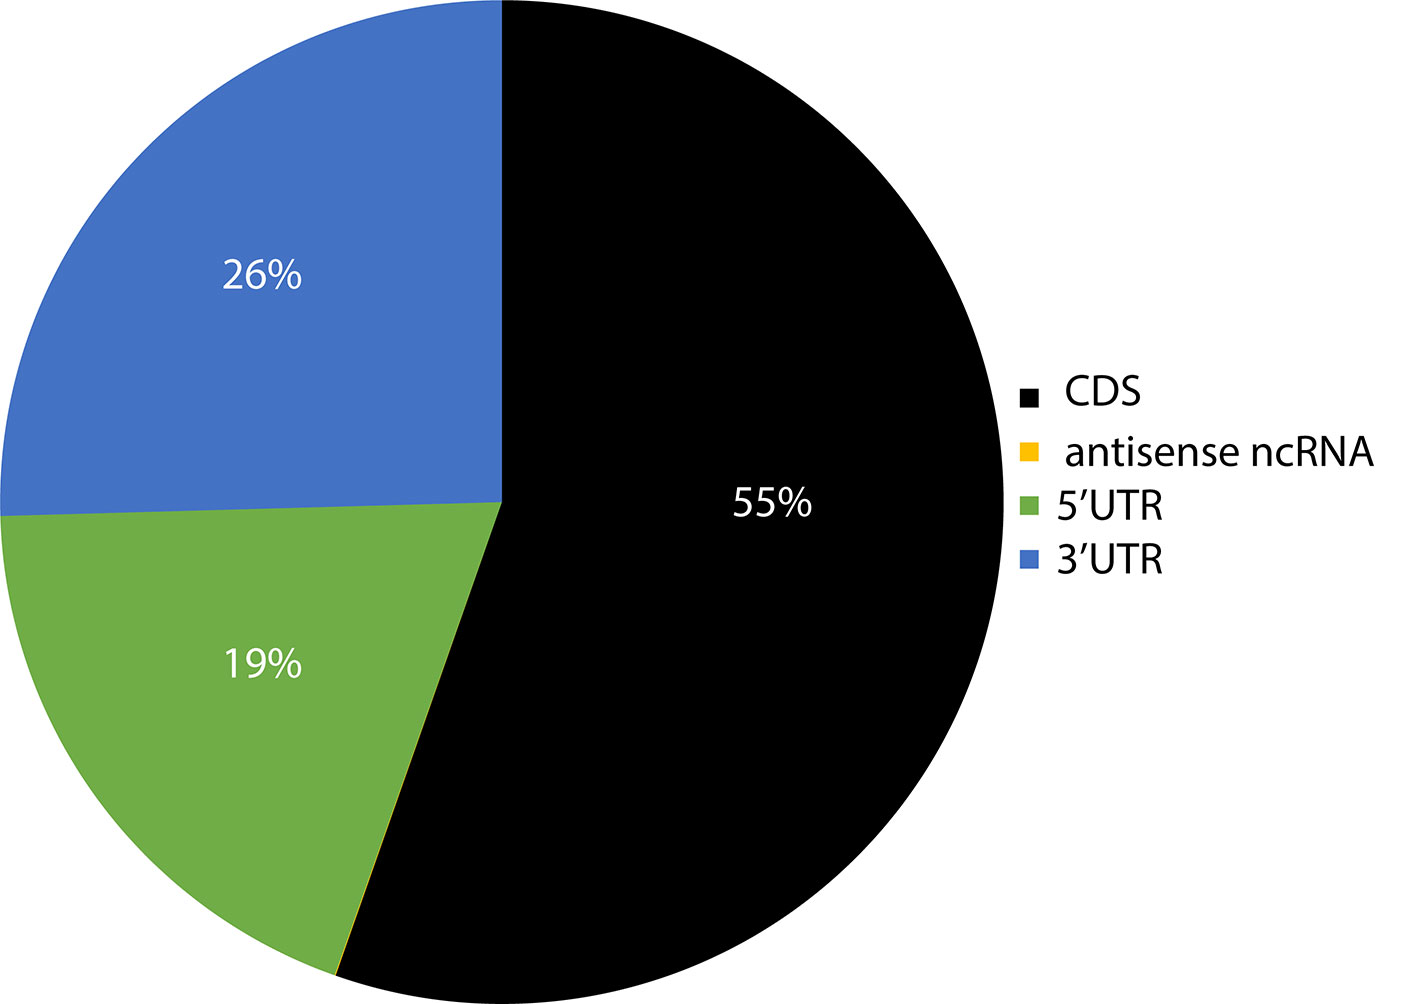
Figure 6 Pie chart representation of the relative abundance of sRNA target sites within different regions of their target's genes. The number in parenthesis indicates the total number of target counts for the respective region. CDS, coding sequence; UTR, untranslated region; ncRNA, non-coding RNA; lncRNA, long non-coding RNA; uORF, upstream open reading frame; snoRNA, small nucleolar RNA; snRNA, small nuclear RNA.
With the additional degradome data from this study (Figure 4), this is the most comprehensive evaluation of sRNA cleavage activity to date for A. thaliana.
Active PhasiRNA Characterization
phasiRNAs whose activities were experimentally validated were evaluated based on their sizes and phased registers. Based on their size, a majority of active phasiRNAs were 21 nt long (~71%), with the remainder being 22 nt long phasiRNAs (Figure 7). phasiRNAs derived from non-canonical registers represent a significant majority in both size categories indicating the relevance of these sRNAs (Figure 7).
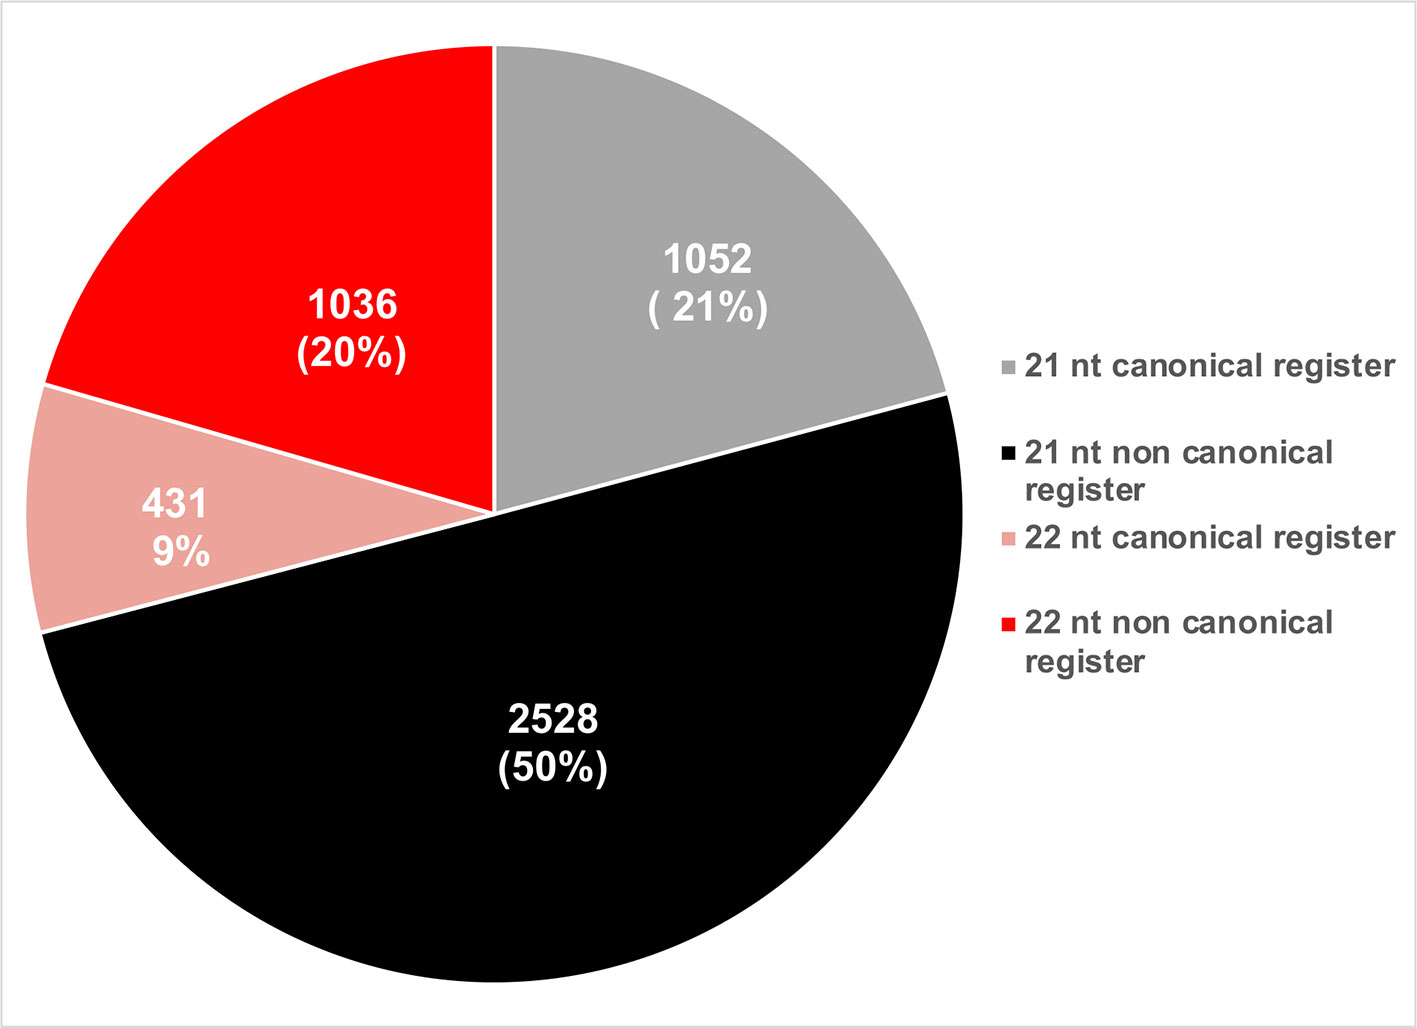
Figure 7 Pie chart representation of the relative abundance of phasiRNAs based on their size and phased register.
Network Identification
To integrate datasets and describe the A. thaliana sRNA-mediated regulatory network, a bipartite, directed network was constructed. To differentiate between the theoretical and functional (biologically relevant) components of the network, the network was restricted to the components identified in the miRNA-PHAS loci-phasiRNA annotation and interactions validated by degradome data. sRNA nodes (miRNAs and phasiRNAs) were restricted to those with known precursors and validated targets identified in degradome analysis. Transcript nodes included only those transcripts annotated as precursors (pre-miRNAs, PHAS loci) or validated in the degradome analysis to be direct targets of active sRNAs. The resulting network contained a total of 11,156 nodes, composed of 5,475 sRNA nodes (428 miRNAs and 5047 phasiRNAs) and 5,680 transcript nodes (325 miRNA precursors, 107 PHAS loci, and 5248 target transcripts). These nodes were connected by 13,160 edges; 5,602 of these were involved in the biogenesis of sRNAs and 7,558 edges were involved in sRNA cleavage of transcripts (Figure 8, Additional file 7: Table S7, Additional file 8: Table S8).
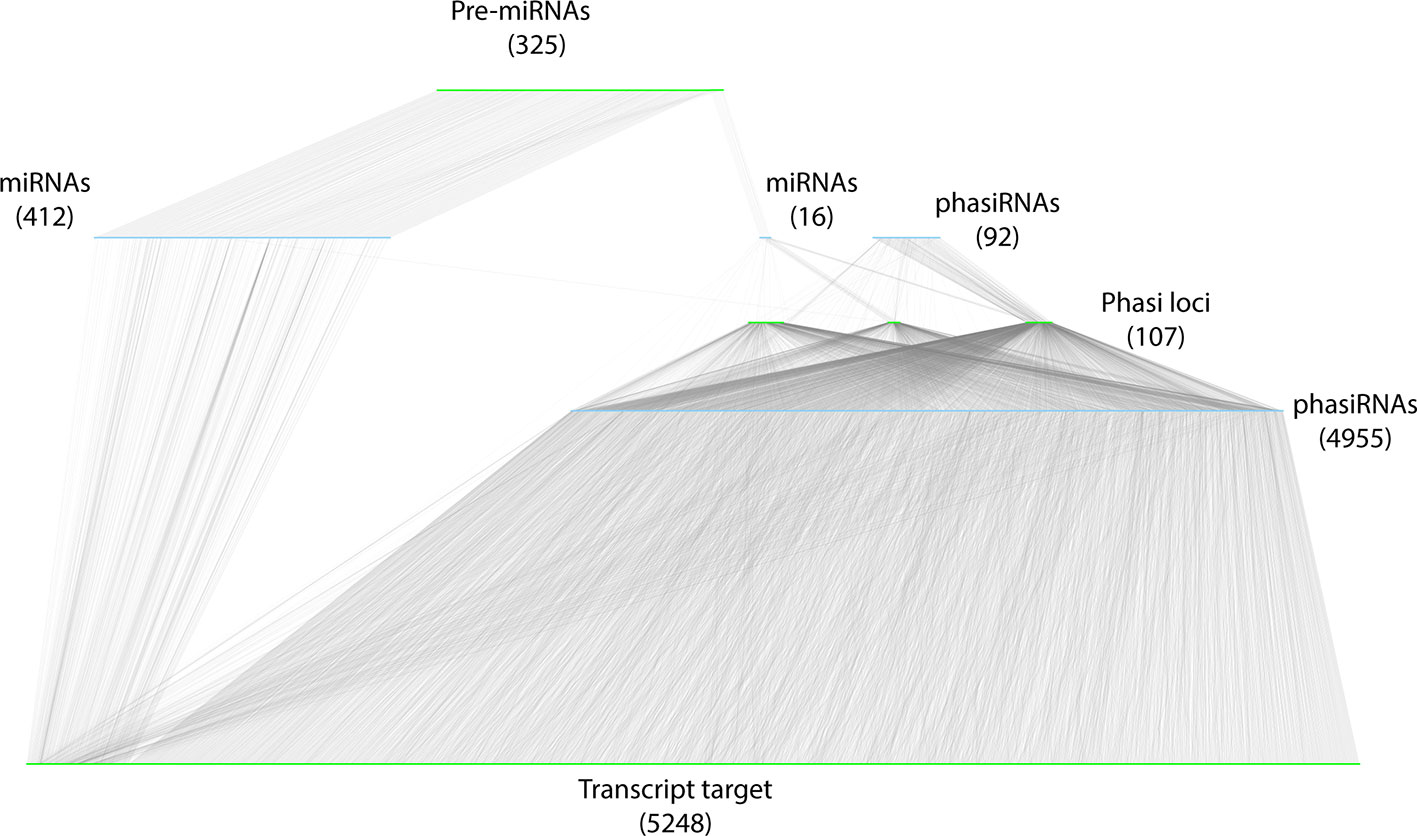
Figure 8 Representation of the resulting sRNA-mediated regulatory network. sRNA nodes are colored in light blue, transcripts are colored green, and edges are gray. The type and abundance are mentioned for each class of nodes. The network has been manually organized to reflect the biogenesis of sRNAs. Two sets of miRNAs (and numbers) are diagrammed: the miRNAs (412) that do not induce phasiRNA production, and those that induce phasiRNA production (15).
Determination of the Regulatory Contribution of the sRNA-Mediated Network
Three metrics were used to assess the regulatory contribution of the resulting sRNA-mediated network. The proportion, function, and regulatory roles of the genes included in the network were evaluated. There are 33,341 A. thaliana genes defined in the araport11 genome annotation (Cheng et al., 2017). The proportion of annotated genes with degradome data to support interactions with sRNAs was about ~17% (n=5,624) of the total annotated genes. The networks regulatory role was assessed at a functional level using the GO annotations of the genes under sRNA control (i.e., with degradome supported interactions with sRNAs) to determine the biological processes in which sRNAs exert their control. Go slim annotations give a broad overview of the ontology content; using these terms, 22 of 45 functional categories under the biological processes domain were found to be disproportionally enriched in the network (versus a random distribution of categories among annotated genes) (Figure 9). Translation and RNA binding were the only terms out of 45 under the biological processes domain that were found to be underrepresented in the sRNA-mediated regulatory network (corrected p-value= 2.6977E-9 and 5.6680E-12, respectively).
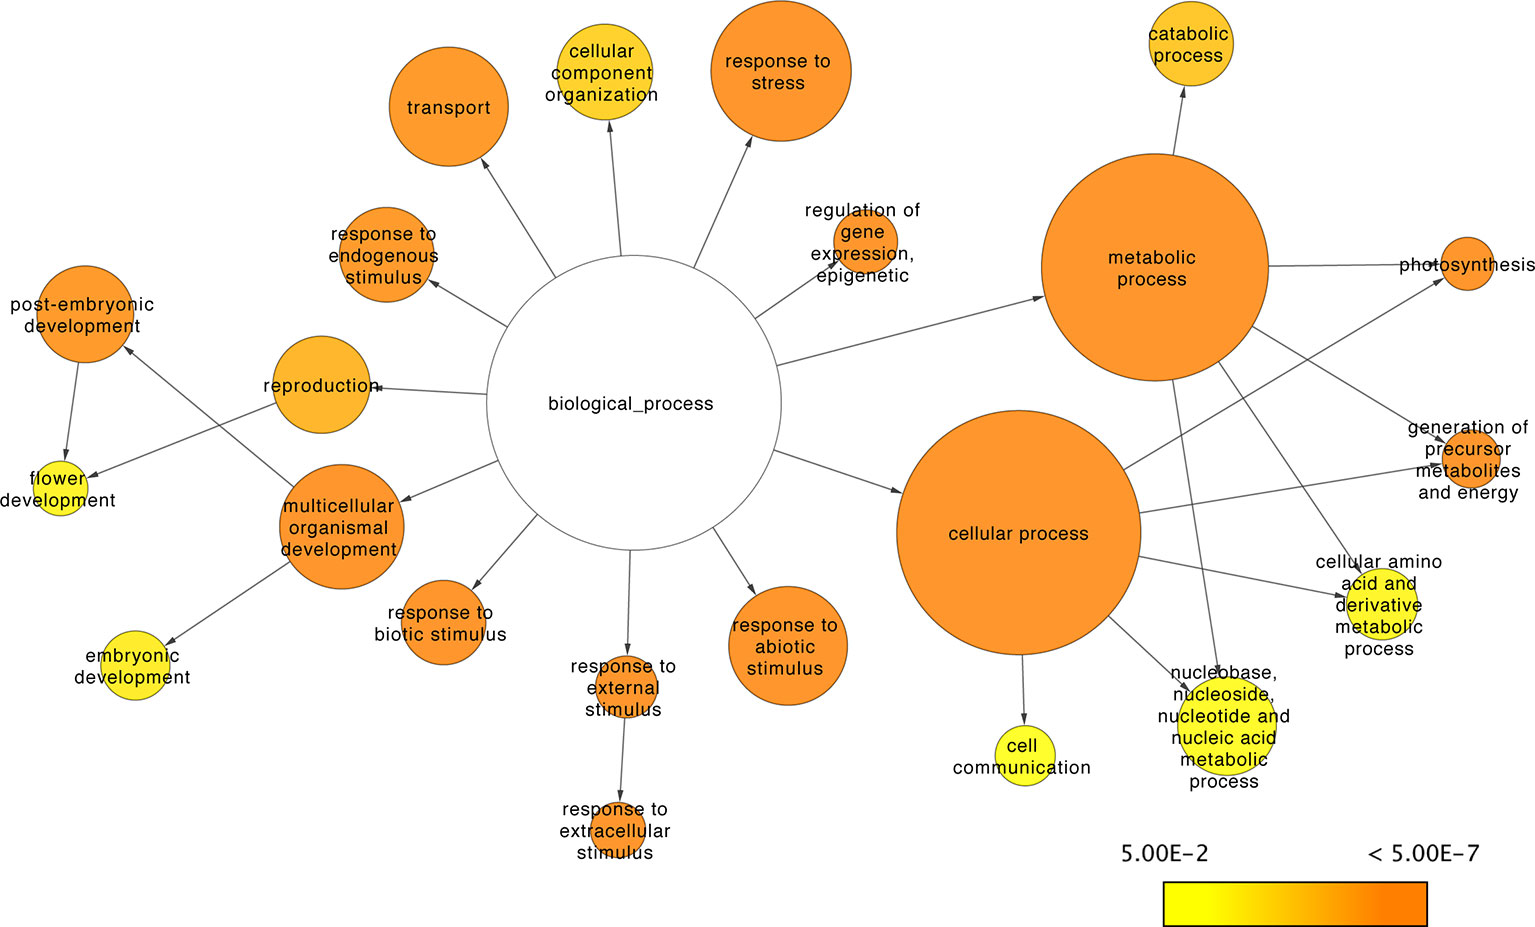
Figure 9 sRNA-mediated network functional analysis. Network representation of GO Slim categories showing enrichment for genes under sRNA regulation. Size of the nodes is proportional to the total amount of genes in the category; color scale indicates the corrected p-values for the enrichment test as described in Maere et al. (2005). Non-colored nodes are not significantly enriched (corrected p-value > 0.05).
Lastly, to assess the regulatory roles of the genes included in the network, the proportion of genes annotated to be involved in gene expression regulation (GO term: GO: GO:0003700) were evaluated for regulatory interactions with sRNAs. Based on GO annotation from Ensembl genomes release 37 (Kersey et al., 2017), 14% of genes (n=1039) involved in gene expression regulation are under sRNA control, including 21% (n=371) of annotated transcription factors (GO term: GO:0003700). Based on the proportion of total genes (~17%) interacting with sRNAs, the enrichment in the network of most categories under the biological processes domain (22/45), and the proportion of regulatory genes under sRNA control (14%), our results are consistent with the notion that sRNAs play a key regulatory role in plants.
Structural Analysis of the sRNA-Mediated Regulatory Network
Networks structure analysis allows a multiscale study of complex biological systems such as for the sRNA-mediated regulatory network presented here; global and local features can be identified and compared to related systems. To better understand properties of the resulting sRNA-mediated regulatory network and to determine the interconnectivity between miRNA and phasiRNA, structural features were analyzed. The sRNA-mediated regulatory network consisted of 192 disconnected components, or groups of connected nodes. Given the directed nature of the networks, each one of these corresponded to weakly connected components. The distribution of the number of nodes per component was uneven, with the largest component containing ~96% of the nodes, and the remainder consisting of 15 or less nodes. Network density, a measure of the ratio of the observed number of edges to the maximum number of edges, in this case was very low (<0.001), consistent with results from studies on other biological networks (Leclerc, 2008). By contrast, the clustering coefficient, a measure showing the tendency of a graph to be divided into clusters, was very low (<0.001), whereas in biological systems, higher values are usually observed (Pavlopoulos et al., 2011). In totality, the node degree showed a heavy-tailed distribution, both for indegree and outdegree (Figure 10A), describing a limited number of nodes with high degree while the majority have low degree. However, the bipartite nature of the network warrants a separate evaluation of the different types of interactions. Degree distributions for sRNAs and transcripts (lRNAs) were evaluated separately (Figure 10B). Negative correlations were found between node degree and abundance, except for the case of sRNA indegree as this indegree distribution is restricted by the nature of sRNA biogenesis and does not allow for testing.
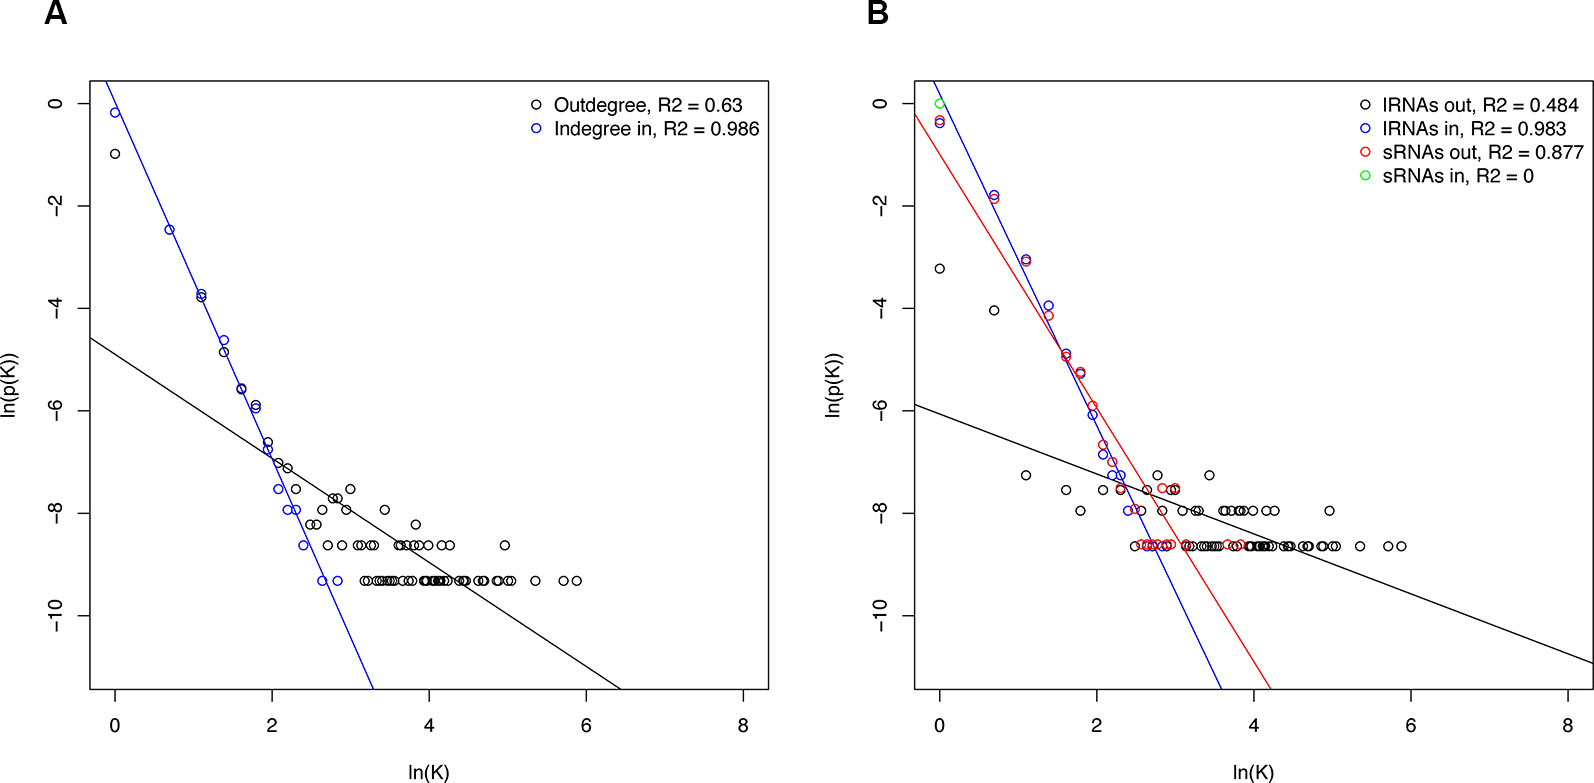
Figure 10 Degree distributions of sRNA-mediated network components. (A) Total degree distribution. (B) Degree distribution of the individual sRNA-mediated network components. Degree is represented by K and p(K) and is the number of nodes with degree K divided by total nodes. Regression lines for statistically significant correlations are shown. lRNA, long RNA (=transcripts).
Discussion
The objective of this work was to identify a comprehensive, experimentally supported sRNA-mediated regulatory network at a genome-wide level. This required identifying the network components (pre-miRNA, miRNAs, PHAS loci, phasiRNAs and target transcripts) and the interactions between them, i.e., the nodes and edges of the network. MacLean et al. (2010) provided the first description of a broad level sRNA regulatory network in plants. Following this model and significant advancements in an understanding of sRNA biogenesis and activity (Rajeswaran et al., 2012; Fei et al., 2013; Wang and Chekanova, 2016), it became possible to investigate sRNA networks from a genomic view point, using only biologically relevant (experimentally supported) interactions. The miRBase database (Kozomara and Griffiths-Jones, 2014) and the araport11 genome annotation (Cheng et al., 2017) represent rich resources for mining miRNA precursors and mature sequences, gene transcripts, and PHAS loci. Using the existing model of sRNA biogenesis (Fei et al., 2013) and published bioinformatics tools (Guo et al., 2015), in combination with additional biogenesis features described by Rajeswaran et al. (2012), we designed an experimental approach and a bioinformatics analysis tool to perform a genome-wide identification of PHAS loci, their triggers, and resulting phasiRNAs. To account for the fact that sRNA production tends to be inducible and the expression can vary under different circumstances, a combination of libraries was employed. These included all sRNA libraries from the NCBI SRA database representing A. thaliana from multiple developmental stages, different tissues, and plants grown under varied biotic and abiotic stress conditions. The libraries produced in this study included plants with and without a biological stress (i.e., virus infection), conditions that will give rise to a varied sRNA response. Finally, to obtain a better view of sRNA cleavage activity on targeted transcripts, the degradome data available at NCBI for wild type A. thaliana was substantially expanded (~20%) with the libraries produced in this study. This allowed for the most comprehensive evaluation of the sRNA cleavage activity in A. thaliana to date, followed by the development of a genome-wide, experimentally supported sRNA-mediated regulatory network.
In order to accurately identify network components and their interactions, a number of factors were critical: a broader detection of PHAS loci at a genome-wide level, identification of non-canonical phasiRNAs, a newly designed strategy to assign PHAS triggers, and a significantly larger degradome dataset. The results from PHAS loci detection across combined sets of sRNA libraries made evident the need for the combinatorial approach used here in order to address the high levels of variability (Figure 1A). It was clear that individual libraries would fail to provide a representative view of PHAS loci, and that some regions only produced phasiRNAs under specific circumstances (Figure 1B). One hundred and seven PHAS loci were detected in at least three libraries, increasing the confidence of their assignment and resulting in a better definition of the 5' and 3' ends by combining overlapping loci into a maximum-length locus. Detection of previously described PHAS loci (Fei et al., 2013) was an indication of the accuracy of this strategy. Beyond the expected types of phasiRNA producing genes (TAS, PPRs, ARFs, and disease resistance), 69 new phasiRNA producing genes and non-annotated regions of the genome were detected as PHAS loci (Table 1), and these findings can be used to update and refine annotations for these regions. Three regions matched locations of natural antisense transcripts (AT2G35945, AT3G22121, AT5G41612), which have been reported to produce natural antisense small interfering RNAs (NAT-siRNAs) in a phased fashion (Borges and Martienssen, 2015).
As proposed by Rajeswaran et al. (2012) and using the biogenesis features described in their work, the inclusion of non-canonical phasiRNAs resulted in an expanded more comprehensive detection of miRNA–phasiRNA biogenesis cascades. Nearly 80% of the validated phasiRNAs were derived from an alternative phased register or were 22 nt long. Not all non-canonical phasiRNAs are novel; the most prominent case is a TAS1c derived phasiRNA, AT2G39675(-)_20-(+1) (described as “athTAS1c-D6(-)”), which has been shown to target its progenitor transcripts and trigger the productions of secondary phasiRNAs (Rajeswaran et al., 2012); it also acts in trans on other TAS transcripts. Despite the relevance of AT2G39675(-)_20-(+1) within the TAS-derived phasiRNA production cascades, it is not often appreciated that its location is shifted 1 nt with respect to the main 21 nt phased register set by the miR173 cleavage site. Moreover, the location is shifted by the production of a 22 nt phasiRNA in the previous register (Rajeswaran et al., 2012). Together, consideration of non-canonical phasiRNAs in this study provided a more accurate and comprehensive view of sRNA activity and regulatory potential.
Although there are limited reference points to determine the accuracy of assignment of secondary and tertiary triggers (Howell et al., 2007; Rajeswaran et al., 2012), the assignments of primary triggers in this study were consistent with previous reports (Howell et al., 2007; Fei et al., 2013). The composite use of degradome data allowed the identification of potential phasiRNA production triggers that act via cleavage of PHAS transcripts. One means of validating the bioinformatic approach taken in this study is to examine the extent to which these methods recapitulate recognized sRNA–PHAS loci interactions for which other published experimental evidence is available. The resulting network included the following previously reported examples: i) TAS1c-derived AT2G39675(-)_20-(+1) [described as “TAS1c 3'D6(-)”] triggering of phasiRNAs in TAS1a (AT2G27400) (Rajeswaran et al., 2012); ii) TAS2-derived AT2G27400(-)_19-(+1) [described as “TAS1a D9(-)”] triggering of phasiRNAs in PPR gene AT1G62590 (Howell et al., 2007); iii) TAS2-derived AT2G39681(-)_16-(+1), AT2G39681(-)_19-(2), and AT2G39681(-)_21-(2) [described as TAS2 3'D6(-), TAS2 3'D9(-), and TAS2 3'D11(-), respectively] triggering of phasiRNAs in 12 PPR/TPR genes (Table 1; Howell et al., 2007); and iv) TAS3-derived AT3G17185(+)_17+(-1) and AT3G17185(+)_18+(-1)_22 [described as atTAS3a-5'D8(+) and atTAS3a-5'D7(+), respectively] triggering of phasiRNAs in ARF4 (AT5G60450) (Allen et al., 2005). In most of these cases, both the 21 and 22 nt forms were identified as potential triggers (Table 2). Failure to detect previously reported interactions such as AT2G39675(-)_20-(+1) triggering in TAS1b (AT1G50055) and TAS1c (AT2G39675) (Rajeswaran et al., 2012) could be due to a non-cleavage based triggering or insufficient degradome evidence.
Beyond these previously reported examples, additional interactions were identified (Additional file 5: Table S5), including a TAS1a-derived AT2G27400(-)_20-(+1) triggering of phasiRNAs in TAS2 (AT2G39681), which represents a novel mechanism for the regulation of phasiRNA production in the TAS cascade. Of particular interest was the demonstration of the potential for connections between individual cascades wherein phasiRNAs from specific cascades can interact with other PHAS loci and trigger the production of downstream phasiRNAs, referred to herein as high-level interactions (Figure 2).
Due to the lack of reference in most cases, the validity of these triggers was additionally evaluated by testing the activity of their corresponding phasiRNAs. phasiRNAs produced by these secondary and tertiary triggers were shown to be functional. Degradome data was used to confirm their activity (discussed below), and additionally, non-canonical phasiRNAs were found to function as phasiRNA triggers, furthering the depth of the regulatory cascades. As described above, AT2G39675(-)_20-(+1), provides the best example of secondary triggers giving rise to phasiRNAs that then function as triggers anew. For the remaining 47% of PHAS loci with no assigned triggers, a number of them were found to overlap with regions annotated to produce NAT-siRNAs. The NAT-siRNA pathway has been shown to result in phased sRNAs, and this biogenesis mechanism (reviewed in Fei et al., 2013) is a likely explanation for some of the PHAS loci for which no sRNA trigger was found. Alternatively, the triggers were below the sensitivity of the methods used in this study and deeper sequencing and higher representation will be needed to find them.
To optimize the accuracy of the newly developed annotation of miRNA-phasiRNAs and produce a regulatory network of biological relevance, the biological activity of miRNAs and the expanded set of phasiRNAs was evaluated using degradome analysis. Using this enlarged dataset, targets were validated for ~47% of the predicted, annotated A. thaliana miRNAs. Approximately 17% of the detected phasiRNAs were found to be active. More than half of the degradome-validated phasiRNAs corresponded to non-canonical phasiRNAs further validating the accuracy of secondary and tertiary trigger assignments described above, and highlighting the relevance of these commonly overlooked phasiRNAs.
Restricting the network to interactions that were experimentally supported eliminated the problems associated with false positives in computational predictions, and provided a reference frame for functional, comparative, and structural analyses of biological relevance and applicability. The stringency and effectiveness of this approach is reflected by the significant reduction of the size of the network compared to MacLean et al. (2010); the number of sRNA nodes was reduced from ~40,000 to 5,475. Similarly, the number of transcripts [long RNAs (lRNA) in their study] was reduced from ~18,000 to 5,680. The number of edges was also reduced from ~38,000 “source” and ~140,000 target edges reported in MacLean et al. (2010) to 5,602 “source” (biogenesis related) edges, and 7,558 “target” (cleavage related) edges in this study, respectively. Contrary to network inference studies that mainly rely on co-expression patterns (see Albert, 2005 for review) and may be prone to false positives, a big data approach was taken in this study by aggregating all of the existing sRNA-Seq and degradome datasets to search for providing experimental evidence of sRNA and mRNA interactions. Given the uniqueness of this study and the limited number of positive controls, a conservative approach with very stringent thresholds was selected to filter interactions (see Materials and Methods for details), likely resulting in false negatives. We expect that this initial effort to define sRNA-based regulation will be revised and improved as more sequence information becomes available and complementary studies are conducted. Evaluation of this validated set of cleavage-related edges permitted an initial exploration of co-regulation between miRNA and phasiRNAs. miRNAs and phasiRNAs were found to be involved in co-regulation of ~8% of the target transcripts identified (Figure 8).
Cell functioning, behavior, and fate are controlled by the topology and dynamics of regulatory gene expression networks. Transcription factors and sRNAs appear to be the primary regulators in these networks (Cora et al., 2017), and technological and conceptual advances are making the study of gene regulation at this level possible. Yet in order to integrate these different regulatory systems, their individual roles and contributions must be established. In this study, limiting the sRNA-mediated network to validated interactions allowed for a realistic evaluation of its regulatory contribution. The evaluation of the network's regulatory contribution was performed at three different levels based on: i) the number of genes involved in the network, ii) the biological function of these genes, and iii) the interactions between sRNA and other gene expression regulators.
Close to 17% of A. thaliana genes were found to be under sRNA control in this study (Figure 8). Given the stringency of the analysis and assuming that neither the sRNA nor degradome dataset provided a complete representation of sRNAs and evidence of cleavage, it is reasonable to suggest that the network presented here should be considered a baseline representation of sRNA-mediated regulation that should be updated and revised as more data becomes available. Additionally, it should be noted that in the interest of considering only experimentally supported interactions, only cleavage-based regulation by sRNAs was considered here. Given that this appears to be the main mode of actions of sRNAs involved in PTGS in plants (Li et al., 2012; Borges and Martienssen, 2015; Wang and Chekanova, 2016), the presentation of regulatory interactions is likely to be representative. Research into alternative mechanisms of action can be expected to provide a better estimation of the regulatory contribution of sRNAs.
To further assess the regulatory contribution of the network, it was evaluated using the GO annotations of the genes included. At a GO slim level, ~50% of the biological processes were found to be disproportionally enriched in the network. These results are consistent with previous reports of sRNA regulatory roles in diverse processes such as response to stress (Liang et al., 2014), development (Nogueira et al., 2006), defense (Zhai et al., 2011), and other activities (Fei et al., 2013; Borges and Martienssen, 2015; Wang and Chekanova, 2016). While most biological processes were enriched in the network, we performed a search to determine if the opposite were true, whether some processes were underrepresented. Surprisingly, genes related to translation and RNA binding appear to have little to no regulation via sRNAs. While an explanation for this is not apparent, it suggests that there has been selection for the regulation of some biological processes by sRNA-independent mechanisms or at least with limited sRNA interactions.
sRNAs are known to be part of higher level regulatory circuits involving other factors involved in regulation at the transcriptional and posttranscriptional level (Walczak and Tkačik, 2011; Cora et al., 2017). These interactions were confirmed in this study, as ~14% of genes annotated to have a role in gene expression regulation were found to be under sRNA control. In particular, miRNA and transcription factors have been shown to act in coordination in other systems (Cui et al., 2007; Croft et al., 2012; Lin et al., 2012) to regulate common targets, as well as each other (), and transcription factors were well represented (21%) in the sRNA-mediated network. These results support the notion of crosstalk between regulatory factors and provide a reference frame to further investigate the regulatory circuits that control gene expression in plants. Quantitative estimates for the role of sRNAs in gene regulation in this study are consistent with the notion of sRNAs as “master regulators”.
The network representation of the sRNA-based expression regulation allows for a systematical characterization of its structural properties using complex network theory. Network topology analysis can be used to better understand the functional organization, underlying design principles, and organizing principles of biological networks (Steuer and López, 2007). Evaluation of network properties and topological features of empirically obtained biological networks revealed interesting commonalities between very distinct regulatory systems (Albert, 2005; Zhu et al., 2007; Pavlopoulos et al., 2011). As observed in other biological networks, the network was found to be sparsely connected, a feature that has been proposed to be evolutionarily selected to preserved robustness (Leclerc, 2008). Metabolic networks have been found to display, on average, higher clustering than random networks, reflecting their modular organization (Ravasz et al., 2002). Conversely, the sRNA-mediated network showed a low clustering coefficient. The bipartite nature of the network may obscure the detection of modules or more closely connected regions, and further characterization will be required to confirm observations on clustering. The degree distribution refers to the distribution of the number of edges connected to a node, and several examples of biological networks display heavy-tailed distributions (Albert, 2005). Overall the sRNA network node's degree showed heavy-tailed distributions, and negative correlations were found between node degree and abundance; this is a common situation in biological networks where highly connected nodes (main regulators or hubs) are rare, resulting in systems that display higher robustness towards random perturbations (see Albert, 2005 for review). These results are consistent with the previous study in A. thaliana using an in silico approach to model the interactions between sRNA and transcripts (MacLean et al., 2010). Given current models of sRNA biogenesis, their mode of action, and their function as part of a network, degree distributions should be further evaluated. The indegree distribution for sRNAs is restricted by their biogenesis; miRNAs and phasiRNAs are derived from specific precursors, which leads to an indegree fixed to one. The degree distribution of transcripts is also restrained: miRNA precursors often produced a single miRNA limiting their outdegree, while target transcripts are inherently terminal nodes with zero outdegree. Altogether, the resulting sRNA-mediated network showed similar structural features to other biological networks.
Conclusions
Individual phasiRNA cascades have been studied in some detail (Allen et al., 2005; Rajagopalan et al., 2006; Rajeswaran et al., 2012), but a genome-wide view to determine if these cascades correspond to independent modules or if they act together within a larger regulatory network remains an open question. Detailed descriptions of the TAS cascade system provided an indication of the potential for interconnectivity. In this work, the construction of a genome-level network of interactions between sRNAs and transcripts that includes phasiRNA biogenesis and sRNA cleavage activity allowed a visualization of high-level interactions of phasiRNA regulatory cascades. Additionally, a coregulation of transcripts by multiple sRNAs from different sources became apparent. Using a network approach on sRNA biogenesis, a high level of interconnectivity was observed between cascades, resulting in large regulatory modules with potential cross regulation of phasiRNA production. At the transcript targeting level, it was found that a large proportion of sRNA–transcript interactions (>95%) were part of a major (weakly) connected network, indicating a considerable level of connectivity; this suggests that miRNAs and multiple phasiRNA cascades act in coordination in the co-regulation of gene expression.
Data Availability Statement
Publicly available datasets were analyzed in this study. This data can be found here: https://www.ncbi.nlm.nih.gov/sra.
Author Contributions
JV-A designed the project, performed all the experiments, performed the computational analysis, data analysis and interpretation, and wrote the manuscript. KP contributed to design of the project, data interpretation, manuscript writing, and critical revision. All authors read and approved the final manuscript.
Funding
Funding for this research was provided by the College of Agriculture and Life Sciences, Cornell University.
Conflict of Interest
The authors declare that the research was conducted in the absence of any commercial or financial relationships that could be construed as a potential conflict of interest.
Acknowledgments
We would like to acknowledge Jeremy Thompson as a key source for suggestions and advice for all aspects of this project. Zhangjun Fei was instrumental in the design and testing of computational methods for data analysis. We thank Andrew Grimson for assistance with experimental methods. We thank Chris Myers for insightful input on network theory and analysis. We are grateful to Rajendran Rajeswaran and Mikhail Pooggin for review of an early draft of the manuscript. Heather McLean provided valuable technical support.
Abbreviations
DCLs, Dicer-like proteins; GO, gene ontology; miRNA, microRNA; phasiRNAs, phased small interfering RNAs; PHAS, phasiRNA loci; sRNA, small RNA.
Supplementary Materials
The Supplementary Material for this article can be found online at: https://www.frontiersin.org/articles/10.3389/fpls.2019.01710/full#supplementary-material
References
Addo-Quaye, C., Eshoo, T. W., Bartel, D. P., Axtell, M. J. (2008). Endogenous siRNA and miRNA targets identified by sequencing of the Arabidopsis degradome. Curr. Biol. 18, 758–762. doi: 10.1016/j.cub.2008.04.042
Addo-Quaye, C., Miller, W., Axtell, M. J. (2009). CleaveLand: a pipeline for using degradome data to find cleaved small RNA targets. Bioinformatics 25, 130–131. doi: 10.1093/bioinformatics/btn604
Albert, R. (2005). Scale-free networks in cell biology. J. Cell Sci. 118, 4947–4957. Available at: http://jcs.biologists.org/content/118/21/4947.abstract. doi: 10.1242/jcs.02714
Allen, E., Xie, Z., Gustafson, A. M., Carrington, J. C. (2005). microRNA-directed phasing during trans-acting siRNA biogenesis in plants. Cell 121, 207–221. doi: 10.1016/j.cell.2005.04.004
Boccara, M., Sarazin, A., Thiébeauld, O., Jay, F., Voinnet, O., Navarro, L., et al. (2014). The Arabidopsis miR472-RDR6 silencing pathway modulates PAMP- and effector-triggered immunity through the post-transcriptional control of disease resistance genes. PloS Pathog. 10, e1003883. doi: 10.1371/journal.ppat.1003883
Borges, F., Martienssen, R. A. (2015). The expanding world of small RNAs in plants. Nat. Rev. Mol. Cell Biol. 16, 727–741. doi: 10.1038/nrm4085
Bustamante, A., Marques, M. C., Sanz-Carbonell, A., Mulet, J. M., Gomez, G. (2018). Alternative processing of its precursor is related to miR319 decreasing in melon plants exposed to cold. Sci. Rep. 8, 15538. doi: 10.1038/s41598-018-34012-7
Cai, Q., He, B., Kogel, K.-H., Jin, H. (2018). Cross-kingdom RNA trafficking and environmental RNAi—nature's blueprint for modern crop protection strategies. Curr. Opin. Microbiol. 46, 58–64. doi: 10.1016/j.mib.2018.02.003
Chen, H.-M., Li, Y.-H., Wu, S.-H. (2007). Bioinformatic prediction and experimental validation of a microRNA-directed tandem trans-acting siRNA cascade in Arabidopsis. Proc. Natl. Acad. Sci. 104, 3318–3323. doi: 10.1073/pnas.0611119104
Cheng, C.-Y., Krishnakumar, V., Chan, A., Schobel, S., Town, C. D. (2017). Araport11: a complete reannotation of the Arabidopsis thaliana reference genome. Plant J. 89, 789–804. Available at: http://biorxiv.org/content/early/2016/04/05/047308.abstract. doi: 10.1111/tpj.13415
Cora, D., Re, A., Caselle, M., Bussolino, F. (2017). MicroRNA-mediated regulatory circuits: outlook and perspectives. Phys. Biol. 14, 045001. doi: 10.1088/1478-3975/aa6f21
Creasey, K. M., Zhai, J., Borges, F., Van Ex, F., Regulski, M., Meyers, B. C., et al. (2014). miRNAs trigger widespread epigenetically activated siRNAs from transposons in Arabidopsis. Nature 508, 411–415. doi: 10.1038/nature13069
Croft, L., Szklarczyk, D., Jensen, L. J., Gorodkin, J. (2012). Multiple independent analyses reveal only transcription factors as an enriched functional class associated with microRNAs. BMC Syst. Biol. 6, 90. doi: 10.1186/1752-0509-6-90
Cui, Q., Yu, Z., Pan, Y., Purisima, E. O., Wang, E. (2007). MicroRNAs preferentially target the genes with high transcriptional regulation complexity. Biochem. Biophys. Res. Commun. 352, 733–738. doi: 10.1016/j.bbrc.2006.11.080
Cumbo, F., Paci, P., Santoni, D., Paola, L., Giuliani, A. (2014). GIANT: a cytoscape plugin for modular networks. PloS One 9, 1–7. doi: 10.1371/journal.pone.0105001
Deng, Y., Wang, J., Tung, J., Liu, D., Zhou, Y., He, S., et al. (2018). A role for small RNA in regulating innate immunity during plant growth. PloS Pathog. 14, e1006756. doi: 10.1371/journal.ppat.1006756
Ding, J., Zhou, S., Guan, J. (2012). Finding MicroRNA targets in plants: current status and perspectives. Genomics Proteomics Bioinf. 10, 264–275. doi: 10.1016/j.gpb.2012.09.003
dos Santos, T. B., Soares, J. D. M., Lima, J. E., Silva, J. C., Ivamoto, S. T., Baba, V. Y., et al. (2019). An integrated analysis of mRNA and sRNA transcriptional profiles in Coffea arabica L. roots: insights on nitrogen starvation responses. Funct. Integr. Genomics 19, 151–169. doi: 10.1007/s10142-018-0634-8
Drapek, C., Sparks, E. E., Benfey, P. N. (2017). Uncovering gene regulatory networks controlling plant cell differentiation. Trends Genet. 33, 529–539. doi: 10.1016/j.tig.2017.05.002
Fei, Q., Xia, R., Meyers, B. C. (2013). Phased, secondary, small interfering RNAs in posttranscriptional regulatory networks. Plant Cell Online 25, 2400–2415. doi: 10.1105/tpc.113.114652
German, M. A., Luo, S., Schroth, G., Meyers, B. C., Green, P. J. (2009). Construction of Parallel Analysis of RNA Ends (PARE) libraries for the study of cleaved miRNA targets and the RNA degradome. Nat. Protocols 4, 356–362. doi: 10.1038/nprot.2009.8
Ghildiyal, M., Zamore, P. D. (2009). Small silencing RNAs: an expanding universe. Nat. Rev. Genet. 10, 94–108. doi: 10.1038/nrg2504
González-Morales, S. I., Chávez-Montes, R. A., Hayano-Kanashiro, C., Alejo-Jacuinde, G., Rico-Cambron, T. Y., de Folter, S., et al. (2016). Regulatory network analysis reveals novel regulators of seed desiccation tolerance in Arabidopsis thaliana. Proc. Natl. Acad. Sci. 113, E5232–E5241. doi: 10.1073/pnas.1610985113
Guo, Q., Qu, X., Jin, W. (2015). PhaseTank: genome-wide computational identification of phasiRNAs and their regulatory cascades. Bioinformatics 31, 284–286. doi: 10.1093/bioinformatics/btu628
Hannon, G. FASTX-Toolkit, Available at: http://hannonlab.cshl.edu/fastx_toolkit [Accessed October 21, 2017].
Hou, C., Lee, W., Chou, H., Chen, A., Chou, S., Chen, H. (2016). Global analysis of truncated RNA ends reveals new insights into ribosome stalling in plants. Plant Cell 28, 2398–2416. Available at: http://www.plantcell.org/content/28/10/2398.abstract. doi: 10.1105/tpc.16.00295
Howell, M. D., Fahlgren, N., Chapman, E. J., Cumbie, J. S., Sullivan, C. M., Givan, S. A., et al. (2007). Genome-wide analysis of the RNA-DEPENDENT RNA POLYMERASE6/DICER-LIKE4 pathway in Arabidopsis reveals dependency on miRNA- and tasiRNA-directed targeting. Plant Cell Online 19, 926–942. doi: 10.1105/tpc.107.050062
Hu, Q., Hollunder, J., Niehl, A., Kãrner, C. J., Gereige, D., Windels, D., et al. (2011). Specific impact of tobamovirus infection on the Arabidopsis small RNA profile. PloS One 6, 19549. doi: 10.1371/journal.pone.0019549
Kamthan, A., Chaudhuri, A., Kamthan, M., Datta, A. (2015). Small RNAs in plants: recent development and application for crop improvement. Front. Plant Sci. 6, 208. doi: 10.3389/fpls.2015.00208
Kersey, P. J., Allen, J. E., Allot, A., Barba, M., Boddu, S., Bolt, B. J., et al. (2017). Ensembl Genomes 2018: an integrated omics infrastructure for non-vertebrate species. Nucleic Acids Res. 46 gkx1011–gkx1011. doi: 10.1093/nar/gkx1011
Komiya, R. (2017). Biogenesis of diverse plant phasiRNAs involves an miRNA-trigger and Dicer-processing. J. Plant Res. 130, 17–23. doi: 10.1007/s10265-016-0878-0
Kozomara, A., Griffiths-Jones, S. (2014). miRBase: annotating high confidence microRNAs using deep sequencing data. Nucleic Acids Res. 42, D68–D73. doi: 10.1093/nar/gkt1181
Kruger, F. TrimGalore, Available at: https://github.com/FelixKrueger/TrimGalore [Accessed May 10, 2018].
Leclerc, R. D. (2008). Survival of the sparsest: robust gene networks are parsimonious. Mol. Syst. Biol. 4, 213. doi: 10.1038/msb.2008.52
Li, R., Gao, S., Hernandez, A. G., Wechter, W. P., Fei, Z., Ling, K.-S. (2012). Deep sequencing of small RNAs in tomato for virus and viroid identification and strain differentiation. PloS One 7, e37127. doi: 10.1371/journal.pone.0037127
Liang, C., Liu, X., Sun, Y., Yiu, S.-M., Lim, B. L. (2014). Global small RNA analysis in fast-growing Arabidopsis thaliana with elevated concentrations of ATP and sugars. BMC Genomics 15, 116. doi: 10.1186/1471-2164-15-116
Lin, C.-C., Chen, Y.-J., Chen, C.-Y., Oyang, Y.-J., Juan, H.-F., Huang, H.-C. (2012). Crosstalk between transcription factors and microRNAs in human protein interaction network. BMC Syst. Biol. 6, 18. doi: 10.1186/1752-0509-6-18
Lin, M.-C., Tsai, H.-L., Lim, S.-L., Jeng, S.-T., Wu, S.-H. (2017). Unraveling multifaceted contributions of small regulatory RNAs to photomorphogenic development in Arabidopsis. BMC Genomics 18, 559. doi: 10.1186/s12864-017-3937-6
MacLean, D., Elina, N., Havecker, E. R., Heimstaedt, S. B., Studholme, D. J., Baulcombe, D. C. (2010). Evidence for large complex networks of plant short silencing RNAs. PloS One 5, e9901. doi: 10.1371/journal.pone.0009901
Maere, S., Heymans, K., Kuiper, M. (2005). BiNGO: a Cytoscape plugin to assess overrepresentation of gene ontology categories in biological networks. Bioinformatics 21, 3448–3449. doi: 10.1093/bioinformatics/bti551
Mallory, A. C., Vaucheret, H. (2009). ARGONAUTE 1 homeostasis invokes the coordinate action of the microRNA and siRNA pathways. EMBO Rep. 10, 521–526. Available at: http://embor.embopress.org/content/10/5/521.abstract. doi: 10.1038/embor.2009.32
Megraw, M., Cumbie, J. S., Ivanchenko, M. G., Filichkin, S. A. (2016). Small genetic circuits and MicroRNAs: big players in polymerase II transcriptional control in plants. Plant Cell 28, 286–303. Available at: http://www.plantcell.org/content/28/2/286.abstract. doi: 10.1105/tpc.15.00852
Nogueira, F., Sarkar, A. K., Chitwood, D. H., Timmermans, M. C. P. (2006). Organ polarity in plants is specified through the opposing activity of two distinct small regulatory RNAs. Cold Spring Harb. Symp. Quant. Biol. 71, 157–164. doi: 10.1101/sqb.2006.71.045
Ogura, T., Busch, W. (2016). Genotypes, Networks, Phenotypes: Moving Toward Plant Systems Genetics. Annu. Rev. Cell Dev. Biol. 32, 103–126. doi: 10.1146/annurev-cellbio-111315-124922
Ozerova, L. V., Krasnikova, M. S., Troitsky, A. V., Solovyev, A. G., Morozov, S. Y. (2013). TAS3 Genes for small ta-siARF RNAs in plants belonging to subtribe Senecioninae: occurrence of prematurely terminated RNA precursors. Mol. Gen. Mikrobiol. Virusol. 2, 33–36. doi: 10.3103/S0891416813020043
Pavlopoulos, G. A., Secrier, M., Moschopoulos, C. N., Soldatos, T. G., Kossida, S., Aerts, J., et al. (2011). Using graph theory to analyze biological networks. BioData Min. 4, 10. doi: 10.1186/1756-0381-4-10
Rajagopalan, R., Vaucheret, H., Trejo, J., Bartel, D. P. (2006). A diverse and evolutionarily fluid set of microRNAs in Arabidopsis thaliana. Genes Dev. 20, 3407–3425. doi: 10.1101/gad.1476406
Rajeswaran, R., Aregger, M., Zvereva, A. S., Borah, B. K., Gubaeva, E. G., Pooggin, M. M. (2012). Sequencing of RDR6-dependent double-stranded RNAs reveals novel features of plant siRNA biogenesis. Nucleic Acids Res. 40, 6241–6254. doi: 10.1093/nar/gks242
Ravasz, E., Somera, A. L., Mongru, D. A., Oltvai, Z. N., Barabási, A.-L. (2002). Hierarchical organization of modularity in metabolic networks. Science 297, 1551–1555. Available at: http://science.sciencemag.org/content/297/5586/1551.abstract. doi: 10.1126/science.1073374
Schläpfer, P., Zhang, P., Wang, C., Kim, T., Banf, M., Chae, L., et al. (2017). Genome-wide prediction of metabolic enzymes, pathways, and gene clusters in plants. Plant Physiol. 173, 2041–2059. doi: 10.1104/pp.16.01942
Shannon, P., Markiel, A., Ozier, O., Baliga, N. S., Wang, J. T., Ramage, D., et al. (2003). Cytoscape: a software environment for integrated models of biomolecular interaction networks. Genome Res. 13, 2498–2504. doi: 10.1101/gr.1239303
Si-Ammour, A., Windels, D., Arn-Bouldoires, E., Kutter, C., Ailhas, J., Meins, F., et al. (2011). miR393 and secondary siRNAs regulate expression of the TIR1/AFB2 Auxin receptor clade and Auxin-related development of Arabidopsis leaves. Plant Physiol. 157, 683–691. doi: 10.1104/pp.111.180083
Steuer, R., López, G. Z. (2007). “Global network properties,” in Analysis of biological networks (Hoboken, NJ: John Wiley & Sons, Inc.), 29–63. doi: 10.1002/9780470253489.ch3
Stumpf, M. P. H., Wiuf, C. (2009). “Front Matter,” in Statistical and evolutionary analysis of biological networks (London, UK: Imperial college press), i–viii. doi: 10.1142/9781848164345_fmatter
Sun, W., Julie Li, Y.-S., Huang, H.-D., Shyy, J. Y.-J., Chien, S. (2010). microRNA: a master regulator of cellular processes for bioengineering systems. Annu. Rev. Biomed. Eng. 12, 1–27. doi: 10.1146/annurev-bioeng-070909-105314
Swarbreck, D., Wilks, C., Lamesch, P., Berardini, T. Z., Garcia-Hernandez, M., Foerster, H., et al. (2008). The Arabidopsis Information Resource (TAIR): gene structure and function annotation. Nucleic Acids Res. 36, D1009–D1014. doi: 10.1093/nar/gkm965
Taylor-Teeples, M., Lin, L., de Lucas, M., Turco, G., Toal, T. W., Gaudinier, A., et al. (2015). An Arabidopsis gene regulatory network for secondary cell wall synthesis. Nature 517, 571–575. doi: 10.1038/nature14099
Thatcher, S. R., Burd, S., Wright, C., Lers, A., Green, P. J. (2015). Differential expression of miRNAs and their target genes in senescing leaves and siliques: insights from deep sequencing of small RNAs and cleaved target RNAs. Plant Cell Environ. 38, 188–200. doi: 10.1111/pce.12393
Vargas-Asencio, J., Wojciechowska, K., Baskerville, M., Gomez, A. L. A. L., Perry, K. L. K. L., Thompson, J. R. (2017). The complete nucleotide sequence and genomic characterization of grapevine asteroid mosaic associated virus. Virus Res. 227, 82–87. doi: 10.1016/j.virusres.2016.10.001
Voorhoeve, P. M. (2010). MicroRNAs: Oncogenes, tumor suppressors or master regulators of cancer heterogeneity? Biochim. Biophys. Acta - Rev. Cancer 1805, 72–86. doi: 10.1016/j.bbcan.2009.09.003
Walczak, A., Tkačik, G. (2011). Information transmission in genetic regulatory networks: a review. J. Phys. Condens. Matter 23, 153102. Available at: http://stacks.iop.org/0953-8984/23/i=15/a=153102. doi: 10.1088/0953-8984/23/15/153102
Wang, H.-L. V., Chekanova, J. A. (2016). Small RNAs: essential regulators of gene expression and defenses against environmental stresses in plants. Wiley Interdiscip. Rev. RNA 7, 356–381. doi: 10.1002/wrna.1340
Wang, B., Cheng, D., Chen, Z., Zhang, M., Zhang, G., Jiang, M., et al. (2019). Bioinformatic Exploration of the Targets of Xylem Sap miRNAs in Maize under Cadmium Stress. Int. J. Mol. Sci. 20, 1474. doi: 10.3390/ijms20061474
Xia, R., Xu, J., Arikit, S., Meyers, B. C. (2015). Extensive families of miRNAs and PHAS Loci in Norway spruce demonstrate the origins of complex phasiRNA networks in seed plants. Mol. Biol. Evol. 32, 2905–2918. doi: 10.1093/molbev/msv164
Xia, R., Xu, J., Meyers, B. C. (2017). The emergence, evolution, and diversification of the miR390-TAS3-ARF pathway in land plants. Plant Cell. 29, 1232–1247 doi: 10.1105/tpc.17.00185
Zhai, J., Jeong, D.-H., De Paoli, E., Park, S., Rosen, B. D., Li, Y., et al. (2011). MicroRNAs as master regulators of the plant NB-LRR defense gene family via the production of phased, trans-acting siRNAs. Genes Dev. 25, 2540–2553. doi: 10.1101/gad.177527.111
Zhai, J., Arikit, S., Simon, S. A., Kingham, B. F., Meyers, B. C. (2014). Rapid construction of parallel analysis of RNA end (PARE) libraries for Illumina sequencing. Methods 67, 84–90. doi: 10.1016/j.ymeth.2013.06.025
Zheng, J., Zeng, E., Du, Y., He, C., Hu, Y., Jiao, Z., et al. (2019). Temporal Small RNA Expression Profiling under Drought Reveals a Potential Regulatory Role of Small Nucleolar RNAs in the Drought Responses of Maize. Plant Genome 12, 1–15. doi: 10.3835/plantgenome2018.08.0058
Zhu, X., Gerstein, M., Snyder, M. (2007). Getting connected: analysis and principles of biological networks. Genes Dev. 21, 1010–1024. doi: 10.1101/gad.1528707
Keywords: Arabidopsis, miRNA, phasiRNA, network, regulation, degradome
Citation: Vargas-Asencio JA and Perry KL (2020) A Small RNA-Mediated Regulatory Network in Arabidopsis thaliana Demonstrates Connectivity Between phasiRNA Regulatory Modules and Extensive Co-Regulation of Transcription by miRNAs and phasiRNAs. Front. Plant Sci. 10:1710. doi: 10.3389/fpls.2019.01710
Received: 02 April 2019; Accepted: 05 December 2019;
Published: 29 January 2020.
Edited by:
Seungchan Kim, Prairie View A&M University, United StatesCopyright © 2020 Vargas-Asencio and Perry. This is an open-access article distributed under the terms of the Creative Commons Attribution License (CC BY). The use, distribution or reproduction in other forums is permitted, provided the original author(s) and the copyright owner(s) are credited and that the original publication in this journal is cited, in accordance with accepted academic practice. No use, distribution or reproduction is permitted which does not comply with these terms.
*Correspondence: Keith L. Perry, a2xwM0Bjb3JuZWxsLmVkdQ==