 Samuel Knapp1,2
 Thomas F. Döring3,4
 Hannah E. Jones5
 John Snape1
 Luzie U. Wingen1Martin S. Wolfe3†Michelle Leverington-Waite1
 Simon Griffiths1*
- 1John Innes Centre, Norwich Research Park, Norwich, United Kingdom
- 2Plant Nutrition, Technical University of Munich, Freising, Germany
- 3The Organic Research Centre, Hamstead Marshall, United Kingdom
- 4Agroecology and Organic Farming Group, University of Bonn, Bonn, Germany
- 5The School of Agriculture, Policy and Development, University of Reading, Reading, United Kingdom
Most of our crops are grown in monoculture with single genotypes grown over wide acreage. An alternative approach, where segregating populations are used as crops, is an exciting possibility, but outcomes of natural selection upon this type of crop are not well understood. We tracked allelic frequency changes in evolving composite cross populations of wheat grown over 10 generations under organic and conventional farming. At three generations, each population was genotyped with 19 SSR and 8 SNP markers. The latter were diagnostic for major functional genes. Gene diversity was constant at SSR markers but decreased over time for SNP markers. Population differentiation between the four locations could not be detected, suggesting that organic vs. non-organic crop management did not drive allele frequency changes. However, we did see changes for genes controlling plant height and phenology in all populations independently and consistently. We interpret these changes as the result of a consistent natural selection towards wild-type. Independent selection for alleles that are associated with plant height suggests that competition for light was central, resulting in the predominance of stronger intraspecific competitors, and highlighting a potential trade-off between individual and population performance.
Introduction
Successful crop production depends on varieties that are well adapted to a target environment (Cooper and Hammer, 1996; Atlin et al., 2017) but sufficiently widely adapted so that breeding and seed production is economically viable. As a result, a large proportion of the harvested area is occupied by a few major inbreeding crops (e.g. wheat, barley, rice) and within any one farm, large blocks of each crop comprise single genotypes. This bears risks of vulnerability to diseases (Brown and Hovmøller, 2002) and limited adaptability to local conditions (Mercer and Perales, 2010).
A potential response to these drawbacks is the use of genetically diverse populations instead of clonal crops (Litrico and Violle, 2015). Crop populations can be created by mixing different varieties (Finckh and Wolfe, 2006) or by inter-crossing varieties and mixing the progenies (Suneson, 1956), which, in combination with harvesting and re-sowing each generation, is called evolutionary plant breeding (Suneson, 1956; Döring et al., 2011). Genotypes better adapted to local conditions should have more progeny and thus increase in frequency and over time could result in better locally adapted genotypes and increased grain yield (Döring et al., 2011).
Early wheat studies describe yield increases, with reported rates of genetic gain comparable to those of mainstream breeding (Suneson, 1956). Similar results were reported by Allard (1988) and for biotic stress, Le Boulc’h et al. (1994) found increased resistance to powdery mildew as did Paillard et al. (2000). Furthermore, it was found that diverse winter wheat populations across France showed a differentiation in phenological development (Rhoné et al., 2010). Populations grown over several generations in Northern France with colder winters flowered later than populations grown in Southern France with risk of drought at the end of the growing season. Recently, Bertholdsson et al. (2016) showed that seedling traits of winter wheat composite cross populations (CCPs) were differentially selected in organic vs. conventional management systems, with the populations maintained under organic management showing an increase in seedling root length and root weight, while populations under conventional management showed no such increase. This suggests that the selection CCPs are subjected to can lead to adaptation to locally prevailing conditions and management systems.
These positive results were achieved in spite of the trade-off between individual plant fitness and population performance (Weiner et al., 2010; Denison, 2012; Anten and Vermeulen, 2016). Natural selection acts on individuals but population performance is the central variable in crop production. Individual fitness in a population strongly depends on competition-related traits such as plant height, but investment by individual plants in competition may reduce their potential for grain yield (Weiner et al., 2010). Accordingly, harvest index in cereals, i.e. the proportion of grain yield in total biomass, decreases with increasing intra-specific competition among crop plants with increasing density (Weiner and Freckleton, 2010). However, under no-herbicide conditions of organic farming, where weeds are often more abundant than in conventional cropping systems (Gabriel et al., 2013), the same competition-related traits may be of advantage.
At the genetic level, a small number of major genes have been deployed in modern breeding. Gain of function mutations and alien introgressions that are absent in wild wheat, possessing the wild-type alleles, now occur at high allele frequency in elite bread wheat. These include Rht-1 (Peng et al., 1999), Ppd-1 (Beales et al., 2007), and the 1B/1R rye introgression (Schlegel and Korzun, 1997). It is not well understood how these mutations, selected in the 20th century under monoculture agronomy, and their corresponding wild-type alleles, might influence the overall performance of a segregating population and respond to natural selection.
Our first objective was to find out whether selection can lead to genetic differentiation reflecting adaptation to different management conditions, and if the signature of this selection can be detected for a set of genes with particular importance for competition. Secondly, we investigated if the observed selection of certain alleles can be explained through their phenotypic effect on plant height, heading date, yield, and yield components in individual plants within the population (mixed stand). Thirdly, to investigate possible trade-offs between individual and population performance we compared these phenotypic effects within individual plants and in pure stands. We conducted this investigation on CCPs of winter wheat grown with minimal artificial selection for 10 generations in four locations, two organically and two conventionally managed, in Southern England.
Besides advancing the basic understanding of evolutionary principles, this study has important implications for the deployment of diversity in crop production. If natural selection is counteracting population performance, natural selection will not produce crop populations that are superior in yield, quality, or other agronomic traits. This understanding is crucial for the role and design of plant breeding. However, if the direction of selection occurs predictably it may be possible to pre-select populations using marker-assisted selection, so that fewer generations of on-farm selection are required. Furthermore, alleles that would increase in frequency, but be detrimental to crop performance, could be removed before allowing for natural selection.
Material and Methods
Creation of Populations and Description of Locations
The CCPs were created by inter-crossing two sets of wheat varieties: eight feed varieties and 11 milling varieties, plus the variety Bezostaya which was in both sets (Figure 1 and Table S1). Nineteen of the 20 varieties were chosen for a previous field assessment with the aim to represent successful varieties or parents of successful varieties in Western Europe and to obtain a high level of genetic diversity (Jones et al., 2010). They differed in major phenotypic characteristics like plant height, earliness, vernalization requirement, and baking quality. F1 plants were self-fertilized, the number of F2 seeds from each cross was recorded, and all seeds from each cross were subsequently pooled, i.e. not in equal proportion. Seeds from 93 successful crosses (mean of 957 seeds per cross and range: 37 to 2,569), entered the pooled founding population, subsequently termed FND. The pooled seeds were separated and sown by hand at each of the four locations in October 2003 in single plots (Figure 1 and see also Döring et al., 2015). In subsequent generations, the populations were grown in a randomized complete block design (RCBD) with other varieties and populations with three replications (see Döring et al. (2015)). The average plot size was 25 m2 and the target plant density 425 plants/m2, giving an average demographic populations size of around 32,000 plants. Each year the seeds from all three replicates within a location were pooled, and a proportion was sampled for resowing the next generation without any artificial selection. Until the last sampling of seeds for this study, populations evolved for 10 generations.
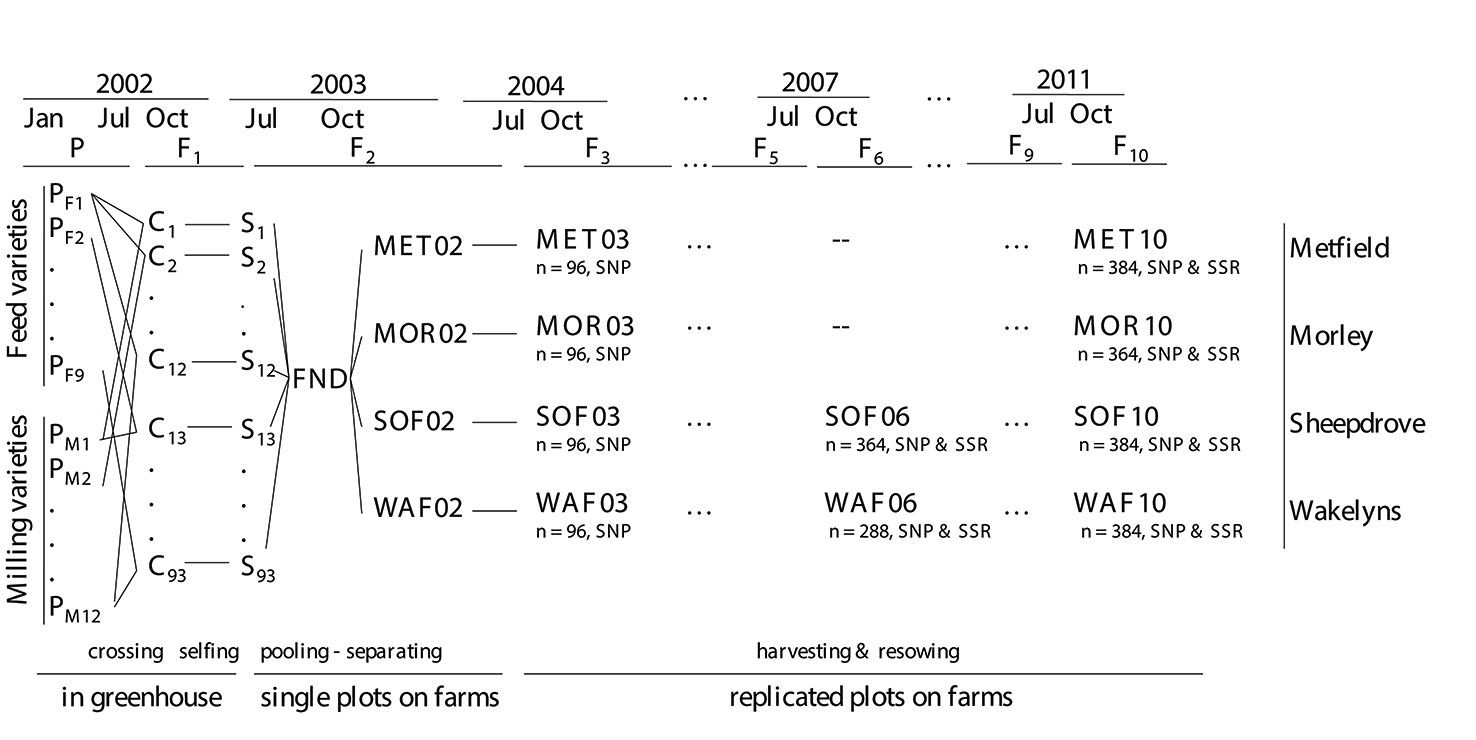
Figure 1 Schematic overview of the crossing scheme of the composite cross populations (CCP) and of the sampled populations (bold fonts). The number of sampled individuals (n) and the sets of markers that were analyzed are shown below each population.
CCPs were grown at four locations: two organically managed: Wakelyns Agroforestry (WAF) in Suffolk (52° 39′N, 1° 17′E) and Sheepdrove Organic Farm (SOF) in Berkshire (51° 31′N, 1° 30′W); and two conventionally managed: Metfield Hall Farm (MET), directly adjacent to WAF in Suffolk (52° 41′N, 1° 29′E) and Morley Research Station (MOR) in Norfolk (52° 56′N, 1° 10′E). Fertilizer, pesticide, and growth regulator applications at MET and MOR followed commercial practice. At the organic locations, WAF and SOF, no pesticides were applied and weeds were controlled mechanically and through rotational design. As the experiments were integrated in the local crop rotation, the trials were moved within the crop rotation at each location. Therefore, the preceding crop remained constant over the course of the experiment (legume–grass mixtures at the organic locations, winter wheat at MET, and winter rape seed at MOR). For detailed descriptions of climatic and soil conditions see Jones et al. (2010) and Döring et al. (2015).
Sampling of Plant Material and Phenotyping
At the organic locations, SOF and WAF, in generation 6 and 10, a total of 501 individual plants in equal proportions from each of the three replicate plots were tagged in the field, and plant height and heading date (day when ear was half-way emerged from flag leaf) were recorded. Sampling of individual plants was carried out only at the organic locations due to the proximity of these locations to the research infrastructure. Individual plants were harvested, threshed, and grain yield of the whole plant was determined. From the plants that had produced seeds, plants for DNA extraction were sampled randomly (see Figure 1 for the final numbers of plants). From these plants three random seeds were germinated and leaf tissue from one seedling was sampled for DNA extraction. At generation 3, from each location 150 seeds, and at generation 10 from MET and MOR, 500 seeds were sampled from pooled plot harvests for genotyping, germinated, and DNA was extracted from leaf tissue of the seedlings (final sample number given in Figure 1). As the genotype of the parental lines was crucial for the generation of the virtual FND population (see below), DNA was extracted from five different seedlings per parental variety.
To evaluate the effect of the markers on pure stand performance, common plot trials with 19 of the total 20 parental varieties (except Norman) were assessed at the same four locations for plant height, obtained from 10 randomly chosen plants per plot, grain yield, and yield components. These trials were conducted in three consecutive years (2005–2007) in a RCBD design with three replicates. For more detailed descriptions see Jones et al. (2010).
Genotyping
After running a set of 70 publicly available SSR markers on the parental varieties and assessing the number of alleles and amplification quality, a subset of 18 SSR markers was chosen: 15 markers from Röder et al. (1998) (gwm44, gwm46, gwm165, gwm186, gwm190, gwm213, gwm234, gwm325, gwm337, gwm469, gwm539, gwm583, gwm610, and gwm626, of which gwm44 and gwm165 produced two loci), two markers from Stephenson et al. (1998) (psp3100 and psp3103) and each one marker from Edwards et al. (1996) (wmc56) and Somers et al. (2004) (barc134). As two markers produced two loci, all-in-all 20 SSR loci were used for the genotype analysis.
Additionally, eight SNP markers were included, which were shown to be diagnostic for major genes involved in plant height (Rht-B1 and Rht-D1), vernalization requirement (Vrn-A1), photoperiod response (Ppd-A1, Ppd-B1, Ppd-D1, and Ppd-D1(D2)), and one marker linked to the 1B/1R chromosome translocation from rye (Schlegel and Korzun, 1997). Information on the SNP markers can be found at http://www.cerealsdb.uk.net/cerealgenomics/CerealsDB/kasp_download.php.
Statistical Analysis
Creation of a Virtual Founding Population
As no seeds were kept from the original pooled founding population, the genotypic composition of this population could not be determined directly. Instead, we generated a virtual founding population (FND) by creating the heterozygous genotypes of each cross, based on the genotype of the parental varieties. Subsequently we added the genotypes of each cross to the FND containing in total 10,000 individuals, proportionally to the recorded number of seeds that went into the “real” founding population (see above). The final number of the genotype from the cross of line i and line j in the FND is thus where sij is the number of seeds from the cross of line i and line j, ∑sij is the sum of seeds from all crosses, and nij was rounded to the nearest integer. We compared this approach to using the weight instead of the number of seeds (sij as the weight of seeds) and to mixing parental genotypes instead of the genotypes of the crosses proportionally where si is the number of seeds of each parental variety. The approach based on the weight of the seeds had a very small impact on the resulting allele frequencies with a mean absolute difference of 0.005. The latter approach of mixing parental genotypes proportionally showed no difference in allele frequencies. For this reason, we created the FND based on the number of seeds of each cross.
Treatment of SSR Markers
At the SSR loci, alleles that were absent in parental genotypes (due to mutation or migration) were removed from the dataset, as the focus was on the assessment of allele frequencies. Mutations and migrations were considered as random and thus assumed to have no biased effect on allele frequencies. To avoid further assumptions in the mathematical treatment of multi-allelic markers (Goldringer and Bataillon, 2004; Meirmans and Hedrick, 2010) and to be able to relate changes in allele frequencies to phenotypic effects of the alleles by reducing effects to only one allele, the marker data of the SSR markers were changed to bi-allelic markers. For each locus, the most frequent allele in FND was set as the first and all other alleles were pooled into the second allele. The number of alleles and parental genotypes carrying the most frequent allele are shown in Table S1.
Gene Diversity
As a measure of genetic diversity within populations, we estimated Nei’s gene diversity (He), which equals the expected heterozygosity under Hardy–Weinberg equilibrium (Nei, 1973). We calculated He for each locus and subsequently averaged over loci. Ninety-five percent confidence intervals (CIs) were generated by bootstrapping over loci with 5,000 bootstraps, thereby avoiding specific assumptions about the distribution of the estimated parameters. Gene diversity was calculated with the R-package hierfstat (Goudet, 2005).
Effective Population Size and Genetic Differentiation
Assessment of changes in allele frequencies requires an understanding of genetic drift, which is the random change of allele frequencies resulting from sampling of gametes in finite populations (Hedrick, 2005). Genetic drift depends on the effective population size (Ne), which is the number of outcrossing individuals in an ideal Wright–Fisher population undergoing the same rate of genetic change (Wright, 1969). As pure genetic drift can also result in genetic differentiation, genetic differentiation is in turn related to the level of expected heterozygosity (Beaumont and Nichols, 1996; Excoffier et al., 2009a). Using data from all marker loci from generation 10, we employed the function to detect loci under selection in the Arlequin package (Excoffier et al., 2009b), to simulate the expected FST null distribution under genetic drift, dependent on the expected heterozygosity with 20,000 simulations with 100 demes. The remaining loci were assumed to be neutral regarding differential selection. Ne was then calculated from observed FST, based on Hedrick (2005, p. 502) and the modification, that FST is sampled from pairs of populations (see Supplementary Method M1):
FST was estimated by Weir and Cockerham’s FST (Weir and Cockerham, 1984) as implemented in hierfstat. As FST was estimated in generation 10, and populations were separated in generation 2 (see Figure 1), we used t = 8. 95% CIs for Ne were calculated using CIs for FST from the boot.vc function in hierfstat.
To compare observed versus expected changes in allele frequency under genetic drift, we calculated the 95% CIs of the allele frequency for each locus after t generations of genetic drift (Waples, 1989) as
where pFND is the allele frequency of the frequent allele in FND and Ne the effective population size. Significance of changes was then assessed visually, if observed allele frequencies were smaller or greater than the CI expected under drift. We furthermore compared this method to the temporal method as first proposed by Waples (1989), which is based on allele frequencies at two different generations (see Supplementary Method M2). For this approach, only the SSR markers were used, as the SNP were more likely to be under selection.
Phenotypic Effects
To investigate the phenotypic effects of the selected alleles, we carried out an association analysis with two sets of data: (1) phenotypic assessments on single plants in mixed stands, i.e. within the diverse populations described so far, and (2) phenotypic assessments in pure stands of single genotypes. The latter reflects common crop stands of single genotypes and was assessed in standard plot field trials. Whereas in mixed stands every plant is surrounded by different genotypes, in pure stands the whole plot or field consists of one single genotype.
The effects of the marker loci in single plants in mixed stands were assessed on the tagged plants (see above) at SOF and WAF in generation 6 and 10, i.e. in four field trials in total. Data were analyzed with a mixed model for each marker locus separately:
where yijk is the response of the i-th plant, carrying the j-th allele, in the k-th trial, μ the grand mean, mj the effect of the j-th allele, tk the effect of the k-th trial, mtjk the allele–trial interaction, and eijk are the residuals. The effects of the trial, allele–trial interaction, and the residuals were considered as random. As we aimed to calculate additive allele effects, only homozygous individuals for the respective marker were included.
The effects of the marker loci in pure stands, i.e. from the CCPs’ parent varieties, were assessed in common plot trials (3 years × 4 locations yielding overall 12 trials). First, LS-means were calculated with the mixed model
where yjln is the response of the l-th variety in the n-th replicate block in the j-th trial, μ the grand mean, trjn is the effect of the n-th replicate block nested in the j-th trial, vl is the effect of l-th variety, tj is the effect of the j-th trial, vtlj the variety–trial interaction, and ejln are the residuals. All effects except the variety effect were taken as random. Subsequently, the marker effect was assessed on the estimated LS-means with the following fixed model, where again one model was run for each marker locus:
where ylj is the response of the l-th variety carrying the j-th allele, mj the effect of the j-th allele, and ejl are the residuals.
Significance of the marker effects (model 1 and 3) were tested by an F-test with Satterthwaite degrees of freedom in the mixed model. Additive allele effects of the frequent alleles were calculated as half of the estimated coefficient for the frequent allele.
To identify phenotypic traits responsible for selection and to investigate the different role in mixed and pure stand, we performed Pearson correlation between the changes in allele frequency from FND to generation 10 and the additive allele effects over all marker loci. Significance of the correlation was tested with a t-test.
The statistical analysis was performed in R, version 3.5.0 (R Core Team, 2018). Bootstrapping was performed with the boot package (Canty and Ripley, 2016), mixed models were fit with the lme4 package (Bates et al., 2015), LS-means were calculated with the emmeans package (Lenth, 2018), and ANOVA of the marker effects was conducted with the lmerTest package (Kuznetsova et al., 2017).
Results
Gene Diversity
All alleles that were present in the FND were also found in all sampled populations, so none of the alleles were eliminated over 10 generations. The two marker types show different levels of gene diversity (Figure 2). However, as this measure depends on the allele frequencies, the marker types cannot be directly compared. While diversity in the SSR set remained constant at 0.44, it decreased from 0.28 to 0.20 in the SNP marker set (Figure 2). Estimates within generations did not differ between locations, indicating that the populations underwent similar changes at the four different locations.
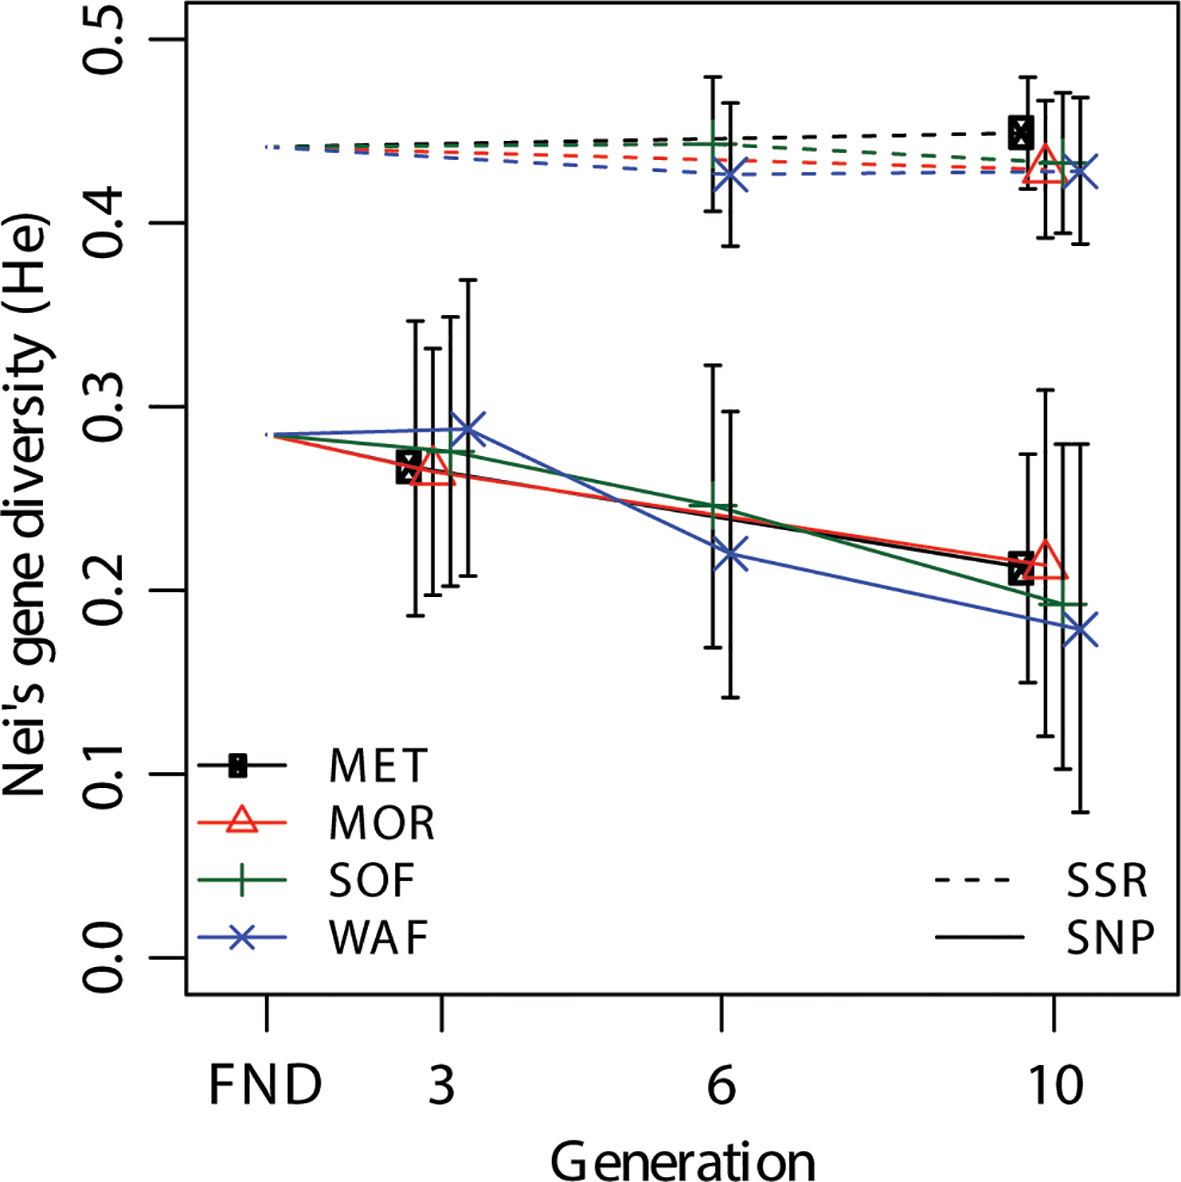
Figure 2 Change of Nei’s gene diversity (He) over generations for the SNP and SSR marker sets at the four different locations Metfield (MET), Morley (MOR), Sheepdrove Organic Farm (SOF), and Wakelyns Agroforestry (WAF). FND indicates the founding population. Error bars are 95% CIs from bootstrapping over loci.
Genetic Differentiation
To investigate if the populations underwent a differential selection at the four locations, we estimated Weir and Cockerham’s FST. FST of zero indicates no differentiation and one represents fixation. The overall differentiation at generation 10 using all marker loci was FST = 0.013 (95% CI: 0.008–0.018). Pairwise estimates (Table 1) ranged between FST = 0.006 and FST = 0.018. Both organically managed locations showed a lower estimate of FST = 0.006 and a similarly small differentiation was found between SOF and MOR. To further test the differentiation due to management, we compared differentiation between both organically managed locations against both conventionally managed locations and compared this estimate to the pairwise groupings. The differentiation between management systems was higher [0.010 (0.005–0.015)] than both other groupings [WAF & MET vs. SOF & MOR: 0.005 (0.002–0.011) and SOF & MET vs. WAF & MOR: 0.005 (0.002–0.011)].
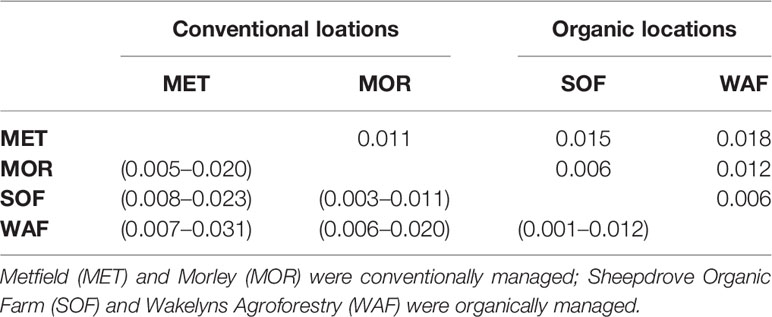
Table 1 Pairwise genetic differentiation at generation 10, measured by Weir and Cockerham’s FST (above diagonal) with 95% CIs from bootstrapping over loci in parentheses (below diagonal).
Effective Population Size
Effective population size (Ne) was estimated using the overall genetic differentiation in generation 10 and marker loci not under differential selection. These excluded three loci (Ppd-B1, gwm165-4B, and gwm46-7B), which were identified to be under differential selection (P < 0.05 and FST higher than average, also see Figure S1). Using the remaining loci, the overall genetic differentiation was estimated as FST = 0.009 (0.006–0.013), resulting in Ne = 221 (153–332). The temporal method produced an estimate of Ne = 140, averaged across all comparisons for the SSR maker loci (Table S2). Here, we report only the estimate from the SSR markers, as the investigation on gene diversity already indicates that selection took place in the SNP marker set, and absence of selection is a prerequisite for the temporal method.
Changes in Allele Frequency
Given two estimates for Ne, we inspected visually if the observed changes in allele frequency were greater than expected under pure genetic drift for Ne = 150 and Ne = 250 (Figure 3). Instead of using only one final estimate, we used these two boundaries which allows comparisons of the size of expected genetic drift under different Ne.
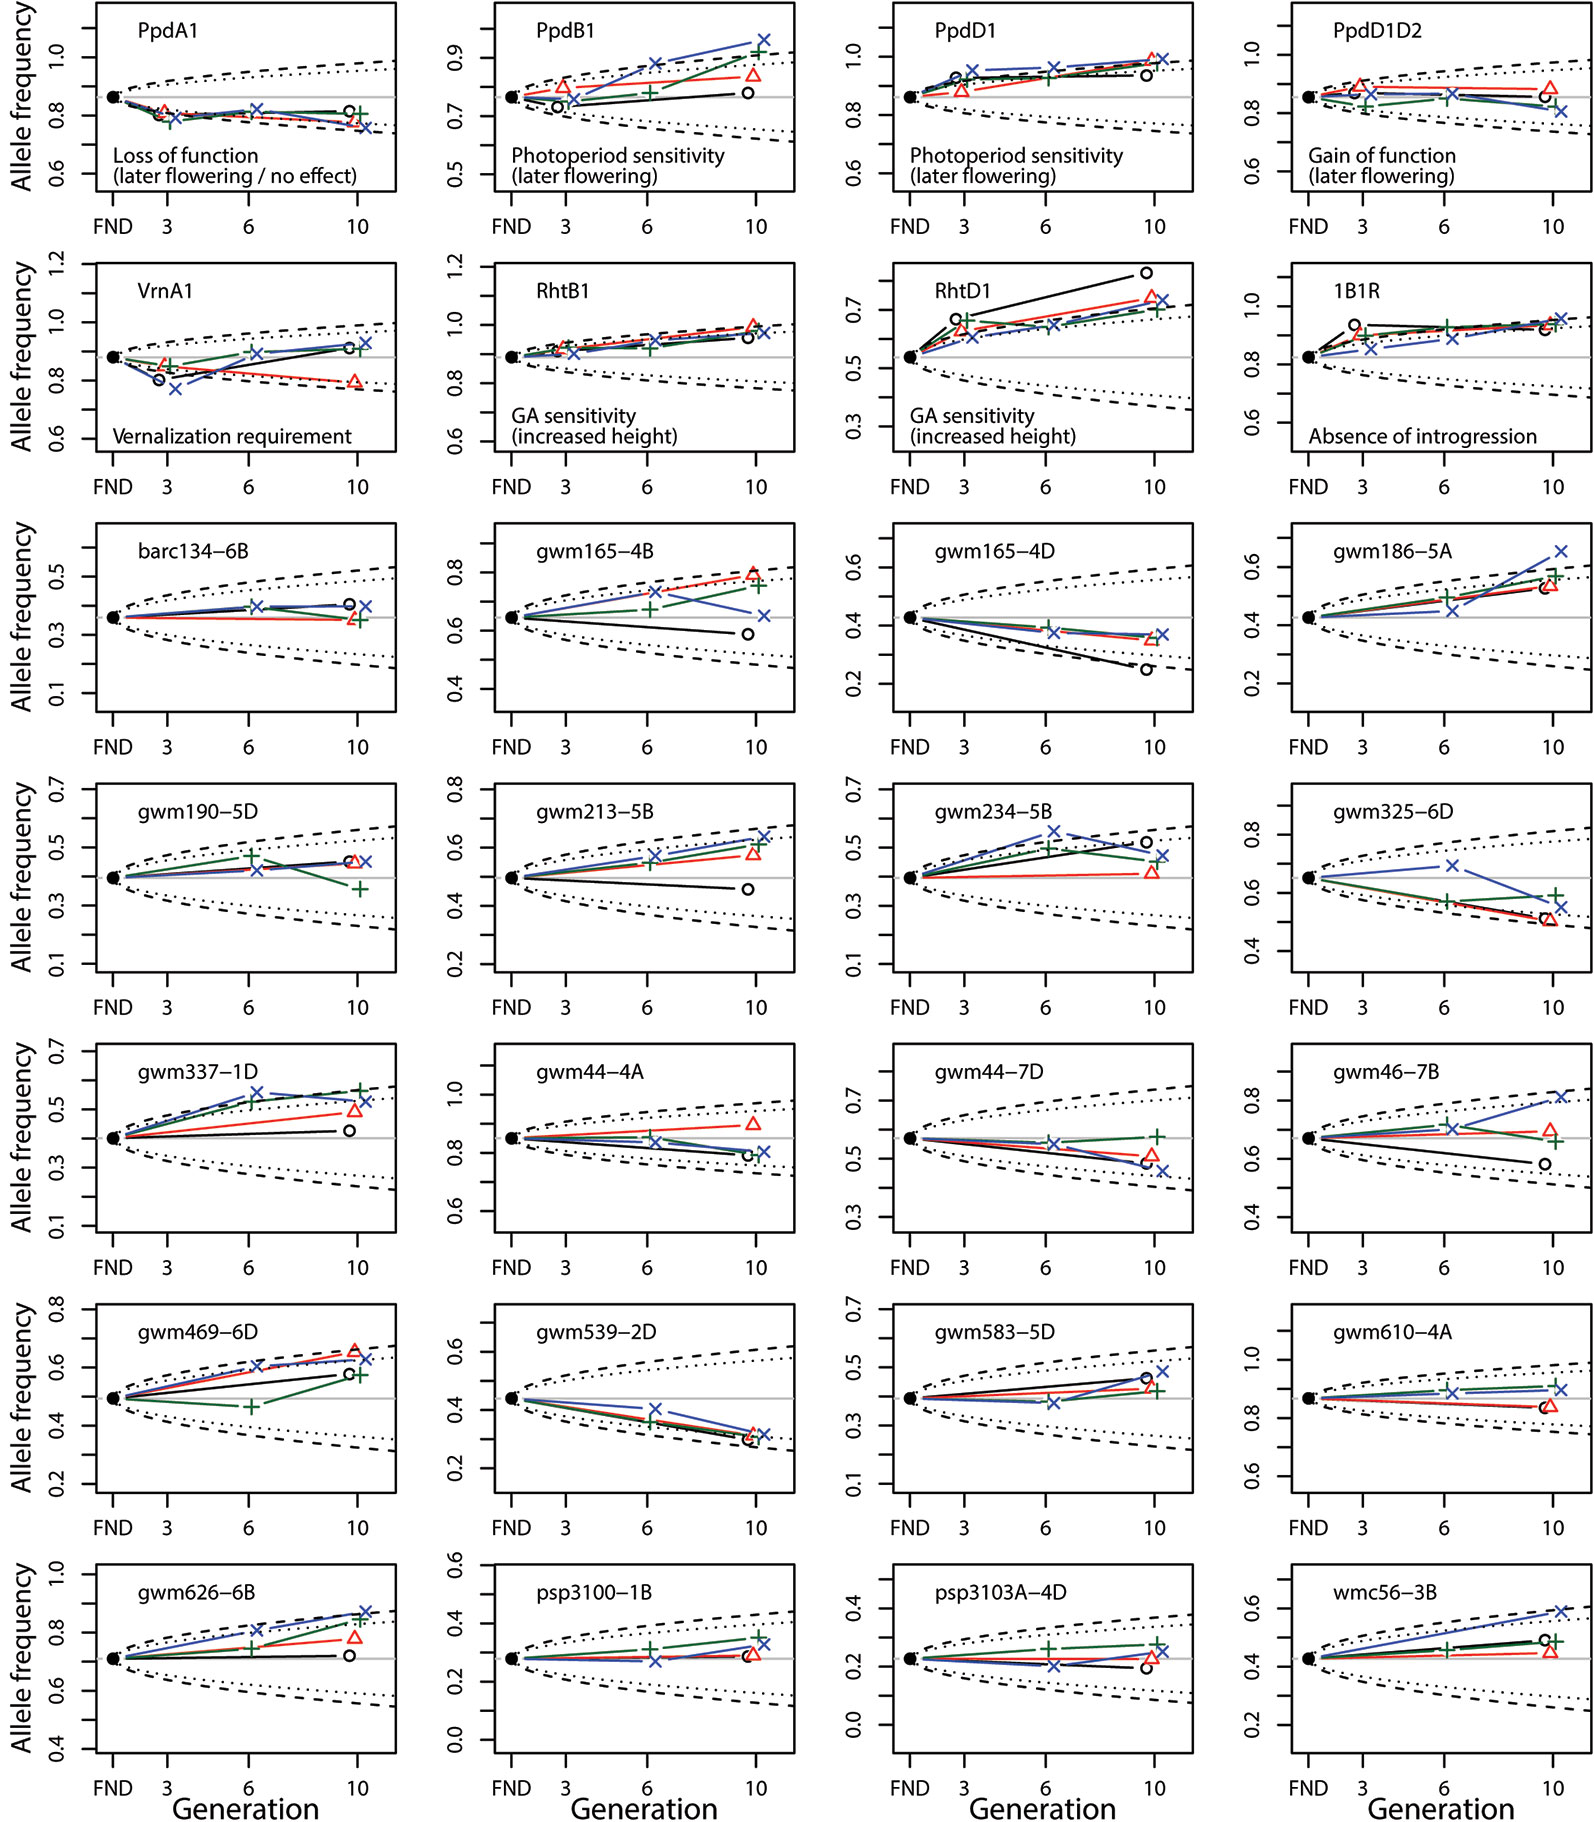
Figure 3 Change of allele frequency in the composite cross populations (CCP) starting from the estimated allele frequency of the virtual founding population (FND). The allele frequency is shown for the frequent allele in the FND population. The different colors denote the allele frequencies in the populations at the different locations (black: MET, red: MOR, green: SOF, blue: WAF). The dashed and dotted lines indicate the 95% CI of the allele frequency expected under pure genetic drift given an Ne = 150 and Ne = 250, respectively. For the SNP marker loci (top two rows), the function of the frequent allele is given.
Overall, the observed changes of allele frequency have could occured due to genetic drift alone, even for the smaller Ne = 150. However, six of the gene-based markers (Ppd-A1, Ppd-B1, Ppd-D1, Rht-B1, Rht-D1, and 1B.1R) showed consistent changes over generations, which were greater than expected under genetic drift. Except for Ppd-B1, the direction of selection was the same across locations and towards the wild-type (WT) allele.
For Ppd-B1 selection was only found at SOF and WAF. Furthermore, many SSR marker loci also showed similar selection for the same allele at all four locations (most notably gwm165-4D, gwm186-5A, gwm539-2D). The two loci which were identified to be under differential selection, gwm165-4B and gwm46-7B, showed the greatest variation at generation 10, with selection at MET being different to the other locations.
To test if selection was generally towards the similar direction at all four locations, we correlated the changes in allele frequency between FND and generation 10 at the different locations. Table 2 shows that the changes were highly correlated (P < 0.001) between the different locations. The strongest correlation (r = 0.82) was between SOF and WAF, the two organically managed locations.

Table 2 Pearson correlation coefficients (above diagonal) of the difference of allele frequency between generation 10 at the different locations and the founding population (FND), with significance level indicated below the diagonal (***P < 0.001, based on a t-test with df = 26) for the four different locations Metfield (MET), Morley (MOR), Sheepdrove Organic Farm (SOF), and Wakelyns Agroforestry (WAF).
Phenotypic Effects of the Selected Alleles
To investigate the phenotypic effects of the selected alleles, we correlated the changes of allele frequency with the additive allele effect in the mixed crop stands. Only plant height showed a significant correlation (P < 0.01) to the overall changes of allele frequency between FND and generation 10 (Table 3 and Figure 4). This relation indicates that height increasing alleles were under positive selection. This was true at both Rht homoeoloci. Interestingly, also Ppd-A1 and Ppd-D1 showed a significant effect on plant height (see F-Test for marker trait associations in Tables S3 and S4), again with the height increasing allele under positive selection (Figure 4). Furthermore, at three SSR marker loci (gwm165-4D, gwm325-6D, and gwm539-2D), where there was consistent selection for the rare allele at all locations, the rare allele had a significant and increasing effect on plant height.
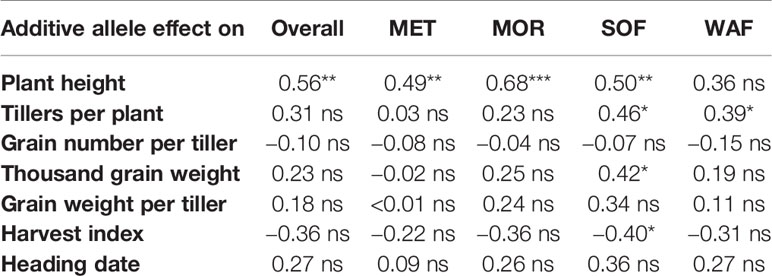
Table 3 Pearson correlations coefficient between the additive allele effects for the named traits measured in single plants in mixed stands and the change in allele frequency from FND to the average allele frequency at generation 10 (overall), and to the allele frequency at each location; *, **, *** denote significant correlation at P < 0.05, P < 0.01, and P < 0.001, respectively; ns indicates non-significance (P > 0.05).
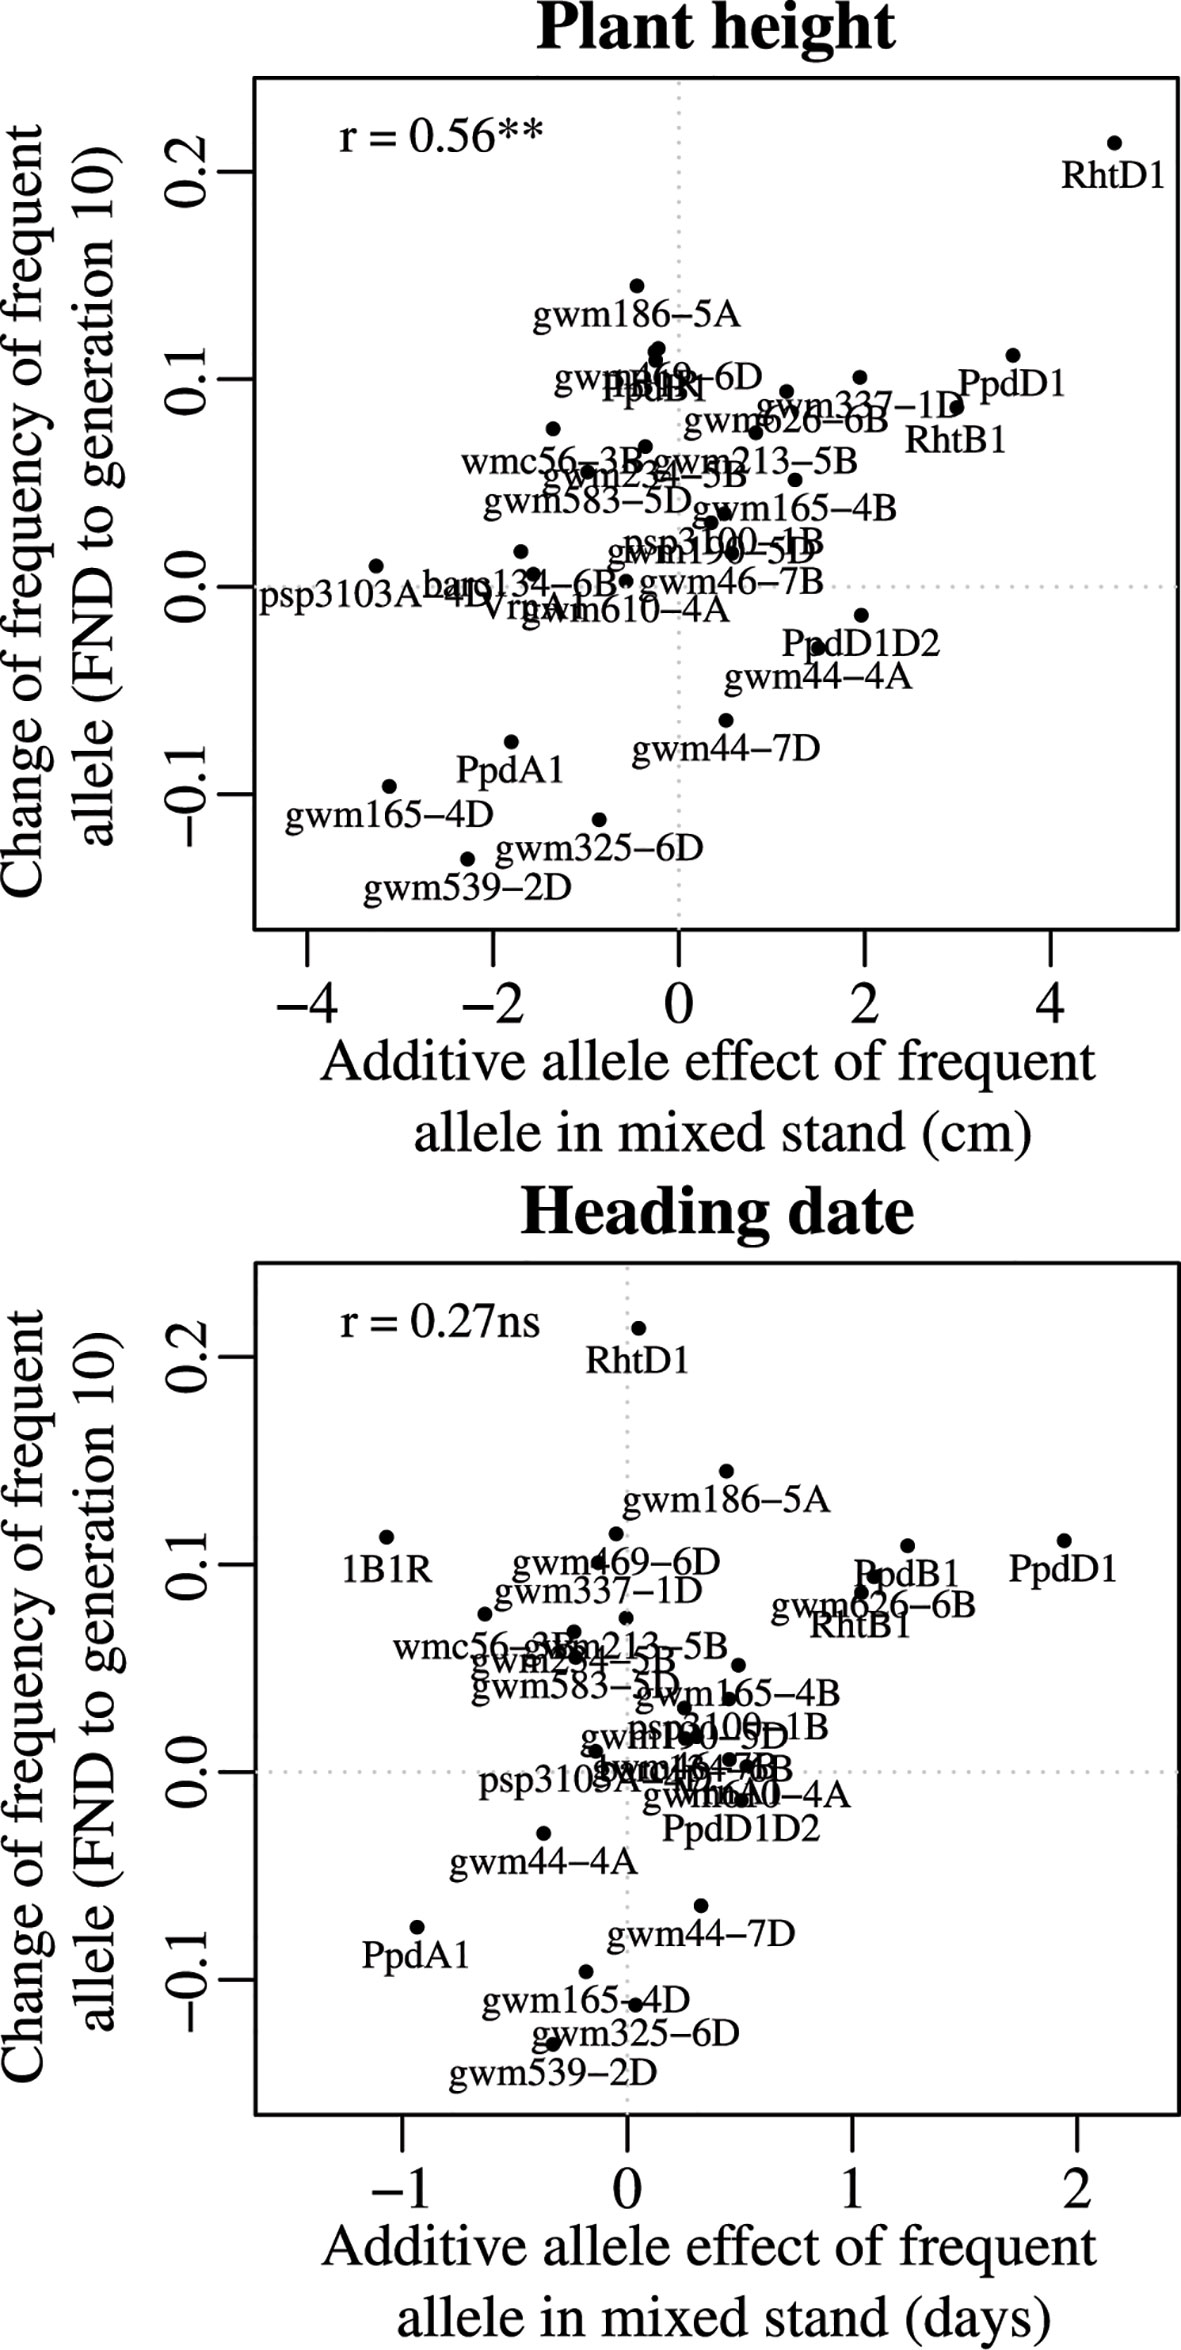
Figure 4 Relationship between the additive allele effect on plant height and on heading date and the temporal change in allele frequency from the virtual founding population (FND) to the allele frequency at generation 10 (averaged over all four locations). For plant height, the significant correlation indicates that those genes with a stronger effect on plant height (such as Rht-D1) tended to have a more pronounced selection over time, demonstrated by the high change in allele frequency.
The relation between the additive allele effect on plant height and the change of allele frequency was also significant (P < 0.01) at each location except at WAF (Table 3). At both organic locations, SOF and WAF, the change in allele frequency was significantly correlated with an increasing additive effect of the selected alleles on the number of tillers per plant (Table 3 and Figure S2). However, it is difficult to identify single markers which are responsible for this significant correlation (Figure S2).
Relationships between the additive allele effects and yield components (grain number per tiller, thousand grain weight, and grain weight per tiller) were not significant, neither were harvest index and heading date (Table 3).
Alleles often have pleiotropic effects, which can also result in the correlation between traits. As an example, we calculated the correlations between plant height and various agronomically important traits. We compared these correlations among different traits for single plants in mixed stands compared to pure stands (Table 4). Increased plant height was associated with decreased grain number per tiller in pure stands, while this effect was not significant in the mixed stand. Similarly, plant height was negatively associated with grain weight per tiller in pure stands, while in mixed stands the relation was reversed, though not significant. For all three yield components (tillers per plant, grain number per tiller, and thousand grain weight), the correlation with plant height was smaller (i.e. more negative or less positive) for the pure stands than for the mixed stands. In the mixed stands, where different genotypes directly competed, plant height was needed more to generate yield than in the pure stands.
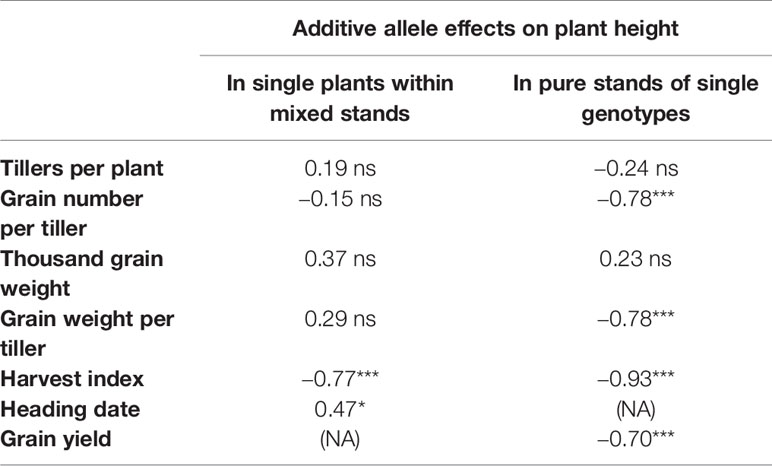
Table 4 Correlations between the additive allele effects on plant height and allele additive effects on various yield components and heading date, for single plants within mixed stand and for pure stands of single genotypes; (NA): data not available; * and *** denote significant correlations at P < 0.05 and P < 0.001, respectively; ns indicates non-significance (P > 0.05).
Further analysis showed that grain yield (the product of the three yield components) in pure stand was mostly dependent on grain number per tiller (data not shown). However, natural selection acted towards a decreased grain number per tiller (Table 3).
Discussion
Gene Diversity
While gene diversity did not decrease at the SSR markers in all four independent populations, gene diversity decreased at the SNP markers, with equal magnitude in all populations (Figure 2). The fact that gene diversity remained constant at the SSR markers indicates that little or no selection had taken place on loci tracked by these markers. In contrast, the decrease in gene diversity at the SNP markers suggests that selection on these functional markers did take place, and that selection, overall, was of similar magnitude and direction at all locations. As absolute values of He were dependent on the genetic composition, they cannot be directly compared to other studies where populations of different composition were used. However, Raggi et al. (2016) using 22 SSR markers also found no decrease in He in a CCP of barley that had evolved for 13 years. More generally, our results confirm that overall genetic diversity in evolving wheat populations appears to be maintained to a large degree unless there is a strong specific selection force [e.g. (Paillard et al., 2000)].
Effective Population Size
Estimation of effective population size (Ne) is crucial for the identification of loci with changes in allele frequency greater than expected under pure drift. The method based on the genetic differentiation (FST) produced a higher estimate than the temporal method, using only the SSR markers (220 vs. 140, Table S2). The estimates from the temporal method based on the SNP markers showed an even smaller estimate (50, averaged over all comparisons), which is most likely due to selection taking place on these loci. As selection also took place on some of the SSR loci, the estimate from the temporal method also appears biased towards low estimates.
The values estimated in our study are higher than those reported by Rhoné et al. (2010) for different wheat populations grown over several generations in France, where estimates for Ne were 33, 114, and 118 at three locations. Other estimates from wheat populations in France, with Ne = 311 (Thépot et al., 2015) and Ne = 42 to Ne = 208 (Enjalbert et al., 1999) were closer to the values estimated here.
Differentiation Between Locations
One of our main aims was to evaluate whether genetic differentiation occurred over 10 generations for wheat CCPs grown in contrasting environments with very different management. To assess the strength of population differentiation we took values between 0 and 0.05 as a general convention for little differentiation (Wright, 1978; Hartl and Clark, 1997). According to this convention, the values observed in this study are very low, sometimes not even significantly different from zero. Even when investigating FST values for the single loci, FST values were still below 0.05 (data not shown).
Although the locations in our study differed in management (organic vs. conventional), resulting in strong variation in average yield level (around 9.5 t/ha at the conventional locations, and 5.3 t/ha at the organic locations (Jones et al., 2010; Döring et al., 2015)), no consistent genetic differentiation regarding the management practices could be detected. In fact, pairwise comparisons between locations showed low values for genetic differentiation (Table 1), and selection was similar between locations, as indicated by the highly significant correlations between changes of allele frequencies (Table 2). In addition, markers diagnostic for genes of known function such as plant height and photoperiod sensitivity were not affected differently at the four studied locations (Figure 3).
Four possible reasons for this lack of consistent genetic differentiation between the four locations are: 1) the number of generations was not sufficient to allow selection to exert a measurable effect on the genetic composition of the CCPs; 2) some loci did exhibit environment specific selection but markers to detect these changes were not included in this study; 3) even though management is different between the locations, effective environmental conditions might be quite similar; and 4) yearly weather fluctuations superimposed the environmental conditions at the specific locations. Regarding the number of generations required to observe adaption to local conditions, Allard (1988) found that first changes in their populations took place within the first 5 to 10 generations. Thus, such changes should have been observable in our experiment. A higher marker density could have possibly identified loci that were under differential selection, which could be used in future to detect loci for local adaption. However, yearly weather fluctuations leading to yearly variation in disease pressure and nutrient availability could probably superimpose local differences in growing conditions and hinder local adaption.
Differentiation Over Time Across All Locations
The more exciting outcome of our analysis was the detection of a clear selection signature in terms of temporal differentiation. At all four locations, genetic changes were observed in the same direction, in particular for the alleles linked to increased plant height and later flowering time (Table 3). These changes over time without any population differentiation can be summarized for most cases as selection towards wild-type. At the five loci for which significant changes of allele frequencies could be detected, there was selection for the wild-type alleles and against the mutant alleles that were introduced during the twentieth century through the implementation of systematic wheat breeding.
The two loci that have undergone the greatest change of allele frequencies were genes controlling height (Rht-B1 and Rht-D1) (Figures 3 and 4), suggesting that plant height has been a driving force in the evolutionary process of the investigated CCPs. This observation is supported by a study by Raquin et al. (2008), who found an increase of Rht-B1 allele frequency in an experimental population of winter wheat from 0.66 in the initial generation to near-complete extinction of the dwarfing allele after 17 generations. The semi-dwarfing alleles at both loci were of major importance during the Green Revolution (Borlaug, 1983). Currently, 58% of all European winter wheat varieties contain the Rht-D1b allele and 7% contain the Rht-B1b allele (Zanke et al., 2014). The selection for increased height can independently be observed in several other markers as well (Figure 4 and Table 3). These genetic effects confirm and explain the phenotypic observations on the same populations, which, in an earlier study, led to the conclusion that already in the third year of development, the wheat CCPs were almost 10 cm taller than the mean of the parents (Döring et al., 2015).
The selection for increased height may mainly be explained by competition for light. At the population level, competition in a genetically diverse plant stand selects for taller intra-specific competitors. It is therefore expected that genotypes with increased height are selected over time, and this is confirmed by our study. However, competition for light may not be the only driver for selection against the so-called dwarfing genes. In particular, the dwarfing genes Rht-B1b and Rht-D1b confer effects of reduced early vigor through shorter coleoptiles and reduced vigor in young plants. More generally, the selection observed in this study can be characterized as going towards more vegetative growth and more competitive ability, which could reduce yield potential (Denison, 2012).
The observed selection for increased height suggests that adaptation took place towards growing in a mixed stand population rather than to environmental conditions. This is because the dwarf genotypes, when grown together with taller neighbors will produce a reduced number of progenies, and thus be selected against over time. Thus, while the performance of a single plant in a mixed stand is determined by its competition with its neighbors (e.g. through plant height), this is not the case in the pure stand.
The selection for the wild-type alleles at the genes Ppd-B1 and Ppd-D1 restores photoperiod sensitivity, as the mutant allele at both genes cause insensitivity to photoperiod (day length neutrality) and early heading. Again, these genes and alleles were very important for the Green Revolution (Borlaug, 1983), allowing wide adaptation. Thus, also for the two Ppd-1 genes, selection seems to have happened towards wild-type and against alleles that are important in modern agricultural production. It should be noted also that the majority of UK wheat varieties are photoperiod sensitive so these results are also a reversion to UK type. Interestingly, the mutant allele of Ppd-1 is also responsible for a further shortening of plant height, due to the temporal shortening of vegetative growth (Börner et al., 1993). Accordingly, we observed a significant correlation between allele effects on plant height and heading date (Table 4 and Figure 4). Because of the pleiotropic effects it remains still open what the driving factor for the changes in allele frequency of the Ppd genes were in the wheat CCPs. In particular, it remains open whether later flowering itself conveyed a fitness advantage to individuals within the evolving wheat populations.
The selection for the wild-type form can also be hypothesized for the 1B/1R marker. This marker identifies the translocation from rye into wheat, which is widespread in many breeding programs, and mostly originates from the rye variety Petkus (Schneider and Molnár-Láng, 2009). In the studied populations, selection occurred against the translocation, even though it is assumed that the introgression confers increased disease resistance (Heslop-Harrison et al., 1990) and should thus also lead to improved fitness under disease pressure.
As our observation is that the major pattern of selection is the result of selection for wild-type alleles, it may be suggested that evolutionary plant breeding approaches can be improved by fixing these alleles, so that negative selection cannot occur. Consequently, individual plants within the diverse population would not invest resources on competitive behavior and selection would then be directed towards prevailing local growing conditions. However, traits that are linked to the competitive ability of the plant, such as plant height, are governed by a large number of genes (Zanke et al., 2014). It is therefore unlikely that competition within a population can be fixed genetically without substantially reducing genetic diversity. Since it seems impossible to create populations that are completely free of any trade-offs, future research will be needed to address the question which trade-offs show the greatest opportunities for developing multifunctional, and potentially adaptive, CCPs.
Data Availability Statement
All datasets generated for this study are included in the Supplementary Material.
Author Contributions
SK performed data analysis and led writing of manuscript. TD organized field work and contributed to manuscript. HJ contributed to early experimental plans. MW and JS conceived project and won funding. LW supported data analysis. ML-W carried out molecular analysis. SG organized project, molecular work, and contributed to writing of manuscript.
Funding
The work was funded under the LINK scheme with financial support from the UKs Department of Environment Food and Rural Affairs (Defra), the Biotechnology and Biological Sciences Research Council (BBSRC), and the Agriculture and Horticulture Development Board (AHDB). The project title was: Adaptive winter wheat populations: development, genetic characterization and application (LK0999).
Conflict of Interest
The authors declare that the research was conducted in the absence of any commercial or financial relationships that could be construed as a potential conflict of interest.
Acknowledgments
This paper is dedicated to the memory of Martin Wolfe who sadly passed away in March 2019. Martin was an inspirational scientist whose determination and drive to promote environmentally sustainable agricultural practices led to the initiation of this work.
Supplementary Material
The Supplementary Material for this article can be found online at: https://www.frontiersin.org/articles/10.3389/fpls.2019.01757/full#supplementary-material
Presentation 1 | Supplementary Figures and Tables
Presentation 2 | Supporting Method M1
Datasheet 1 | All data generated for this study, as used in the analysis
References
Allard, R. W. (1988). Genetic changes associated with the evolution of adaptedness in cultivated plants and their wild progenitors. J. Hered. 79 (4), 225–238. doi: 10.1093/oxfordjournals.jhered.a110503
Anten, N. P. R., Vermeulen, P. J. (2016). Tragedies and crops: understanding natural selection to improve cropping systems. Trends In Ecol. Evol. 31 (6), 429–439. doi: 10.1016/j.tree.2016.02.010
Atlin, G. N., Cairns, J. E., Das, B. (2017). Rapid breeding and varietal replacement are critical to adaptation of cropping systems in the developing world to climate change. Global Food Secur. 12, 31–37. doi: 10.1016/j.gfs.2017.01.008
Börner, A., Worland, A. J., Plaschke, J., Schumann, E., Law, C. N. (1993). Pleiotropic effects of genes for reduced height (Rht) and Day-length insensitivity (Ppd) on yield and its components for wheat grown in Middle Europe. Plant Breed. 111 (3), 204–216. doi: 10.1111/j.1439-0523.1993.tb00631.x
Bates, D., Maechler, M., Bolker, B., Walker, S. (2015). Fitting linear mixed-effects models using lme4. J. Stat. Software 67 (1), 1–48. doi: 10.18637/jss.v067.i01
Beales, J., Turner, A., Griffiths, S., Snape, J., Laurie, D. (2007). A pseudo-response regulator is misexpressed in the photoperiod insensitive Ppd-D1a mutant of wheat (Triticum aestivum L.). TAG Theor. Appl. Genet. 115 (5), 721–733. doi: 10.1007/s00122-007-0603-4
Beaumont, M. A., Nichols, R. A. (1996). Evaluating loci for use in the genetic analysis of population structure. Proc. R. Soc Lond. B 263 (1377), 1619–1626. doi: 10.1098/rspb.1996.0237
Bertholdsson, N. O., Weedon, O., Brumlop, S., Finckh, M. R. (2016). Evolutionary changes of weed competitive traits in winter wheat composite cross populations in organic and conventional farming systems. Eur. J. Agron. 79, 23–30. doi: 10.1016/j.eja.2016.05.004
Borlaug, N. E. (1983). Contributions of conventional plant breeding to food production. Science 219 (4585), 689–693. doi: 10.1126/science.219.4585.689
Brown, J. K. M., Hovmøller, M. S. (2002). Aerial dispersal of pathogens on the global and continental scales and its impact on plant disease. Science 297 (5581), 537–541. doi: 10.1126/science.1072678
Canty, A., Ripley, B. (2016). boot: Bootstrap R (S-Plus) Functions. R package version 1 3–18. https://CRAN.R-project.org/package=boot
Cooper, M., Hammer, G. L. (1996). “Synthesis of strategies for crop improvement,” in Plant adaptation and crop improvement. Eds. Cooper, M., Hammer, G. L. (Wallingford, UK: CAB International), 591–623.
Döring, T. F., Knapp, S., Kovacs, G., Murphy, K., Wolfe, M. S. (2011). Evolutionary plant breeding in cereals—into a new era. Sustainability 3 (10), 1944–1971. doi: 10.3390/su3101944
Döring, T. F., Annicchiarico, P., Clarke, S., Haigh, Z., Jones, H. E., et al. (2015). Comparative analysis of performance and stability among composite cross populations, variety mixtures and pure lines of winter wheat in organic and conventional cropping systems. Field Crops Res. 183, 235–245. doi: 10.1016/j.fcr.2015.08.009
Denison, R. F. (2012). Darwinian agriculture: how understanding evolution can improve agriculture (Princeton, New Jersey: Princeton University Press).
Edwards, K., Barker, J., Daly, A., Jones, C., Karp, A. (1996). Microsatellite libraries enriched for several microsatellite sequences in plants. Biotechniques 20 (5), 758. doi: 10.2144/96205bm04
Enjalbert, J., Goldringer, I., Paillard, S., Brabant, P. (1999). Molecular markers to study genetic drift and selection in wheat populations. J. Exp. Bot. 50 (332), 283–290. doi: 10.1093/jxb/50.332.283
Excoffier, L., Hofer, T., Foll, M. (2009a). Detecting loci under selection in a hierarchically structured population. Heredity 103 (4), 285–298. doi: 10.1038/hdy.2009.74
Excoffier, L., Laval, G., Schneider, S. (2009b). Arlequin: an integrated software package for population genetics data analysis, version 3.5 (University of Berne, Berne, Switzerland: Institute of Zoology).
Finckh, M. R., Wolfe, M. S. (2006). “Diversification strategies,” in The epidemiology of plant diseases. Eds. Cooke, B. M., Jones, D. G., Kaye, B. (Netherlands: Springer), 269–307.
Gabriel, D., Sait, S. M., Kunin, W. E., Benton, T. G. (2013). Food production vs. biodiversity: comparing organic and conventional agriculture. J. Appl. Ecol. 50 (2), 355–364. doi: 10.1111/1365-2664.12035
Goldringer, I., Bataillon, T. (2004). On the distribution of temporal variations in allele frequency. Genetics 168 (1), 563–568. doi: 10.1534/genetics.103.025908
Goudet, J. (2005). hierfstat, a package for R to compute and test hierarchical F-statistics. Mol. Ecol. Notes 5 (1), 184–186. doi: 10.1111/j.1471-8286.2004.00828.x
Hartl, D. L., Clark, A. G. (1997). Principles of population genetics (Inc, Sunderland, MA: Sinauer Associates).
Hedrick, P. W. (2005). Genetics of populations (Sudbury, Massachusettes: Jones and Bartlett Publishers).
Heslop-Harrison, J. S., Leitch, A. R., Schwarzacher, T., Anamthawat-Jonsson, K. (1990). Detection and characterization of 1B/1R translocations in hexaploid wheat. Heredity 65 (3), 385–392. doi: 10.1038/hdy.1990.108
Jones, H., Clarke, S., Haigh, Z., Pearce, H., Wolfe, M. (2010). The effect of the year of wheat variety release on productivity and stability of performance on two organic and two non-organic farms. J. Agric. Sci. 148 (03), 303–317. doi: 10.1017/S0021859610000146
Kuznetsova, A., Brockhoff, P. B., Christensen, R. H. B. (2017). lmerTest: tests in linear mixed effects models. J. Stat. Softw. 82 (13), 1–26. doi: 10.18637/jss.v082.i13
Le Boulc’h, V., David, J. L., Brabant, P., de Vallavieille-Pope, C. (1994). Dynamic conservation of variability: responses of wheat populations to different selective forces including powdery mildew. Genet. Sel. Evol. 26 (S1), S221. doi: 10.1186/1297-9686-26-S1-S221
Lenth, R. (2018). emmeans: estimated marginal means, aka least-squares means. R package version 1.3.0. https://CRAN.R-project.org/package=emmeans
Litrico, I., Violle, C. (2015). Diversity in plant breeding: a new conceptual framework. Trends In Plant Sci. 20 (10), 604–613. doi: 10.1016/j.tplants.2015.07.007
Meirmans, P. G., Hedrick, P. W. (2010). Assessing population structure: FST and related measures. Mol. Ecol. Resour. 11 (1), 5–18. doi: 10.1111/j.1755-0998.2010.02927.x
Mercer, K. L., Perales, H. R. (2010). Evolutionary response of landraces to climate change in centers of crop diversity. Evol. Appl. 3 (5–6), 480–493. doi: 10.1111/j.1752-4571.2010.00137.x
Nei, M. (1973). Analysis of gene diversity in subdivided populations. Proc. Natl. Acad. Sci. United States America 70 (12), 3321–3323. doi: 10.1073/pnas.70.12.3321
Paillard, S., Goldringer, I., Enjalbert, J., Doussinault, G., de Vallavieille-Pope, C., et al. (2000). Evolution of resistance against powdery mildew in winter wheat populations conducted under dynamic management. I—Is specific seedling resistance selected? TAG Theor. Appl. Genet. 101 (3), 449–456. doi: 10.1007/s001220051502
Peng, J. R., Richards, D. E., Hartley, N. M., Murphy, G. P., Devos, K. M., Flintham, J. E., et al. (1999). ‘Green revolution’ genes encode mutant gibberellin response modulators. Nature 400 (6741), 256–261. doi: 10.1038/22307
R Core Team (2018). R: a language and environment for statistical computing (Vienna, Austria: R Foundation for Statistical Computing).
Röder, M. S., Korzun, V., Wendehake, K., Plaschke, J., Tixier, M.-H., et al. (1998). A microsatellite map of wheat. Genetics 149 (4), 2007–2023.
Raggi, L., Ceccarelli, S., Negri, V. (2016). Evolution of a barley composite cross-derived population: an insight gained by molecular markers. J. Agric. Sci. 154 (01), 23–39. doi: 10.1017/S0021859614001269
Raquin, A.-L., Brabant, P., Rhoné, B., Balfourier, F., Leroy, P., et al. (2008). Soft selective sweep near a gene that increases plant height in wheat. Mol. Ecol. 17 (3), 741–756. doi: 10.1111/j.1365-294X.2007.03620.x
Rhoné, B., Vitalis, R., Goldringer, I., Bonnin, I. (2010). Evolution of flowering time in experimental wheat populations: a comprehensive approach to detect genetic signatures of natural selection. Evolution 64 (7), 2110–2125. doi: 10.1111/j.1558-5646.2010.00970.x
Schlegel, R., Korzun, V. (1997). About the origin of 1RS.1BL wheat–rye chromosome translocations from Germany. Plant Breed. 116 (6), 537–540. doi: 10.1111/j.1439-0523.1997.tb02186.x
Schneider, A., Molnár-Láng, M. (2009). Detection of the 1RS chromosome arm in Martonvásár wheat genotypes containing 1Bl.1Rs or 1Al.1Rs translocations using SSR and STS markers. Acta Agron. Hung. 57 (4), 409–416. doi: 10.1556/AAgr.57.2009.4.3
Somers, D. J., Isaac, P., Edwards, K. (2004). A high-density microsatellite consensus map for bread wheat (Triticum aestivum L.). Theor. Appl. Genet. 109, 1105–1114. doi: 10.1007/s00122-004-1740-7
Stephenson, P., Bryan, G., Kirby, J., Collins, A., Devos, K., et al. (1998). Fifty new microsatellite loci for the wheat genetic map. TAG Theor. Appl. Genet. 97, 946–949. doi: 10.1007/s001220050975
Suneson, C. A. (1956). An evolutionary plant breeding method. Agron. J. 48 (4), 188–191. doi: 10.2134/agronj1956.00021962004800040012x
Thépot, S., Restoux, G., Goldringer, I., Hospital, F., Gouache, D., et al. (2015). Efficiently tracking selection in a multiparental population: the case of earliness in wheat. Genetics 199 (2), 609–623. doi: 10.1534/genetics.114.169995
Waples, R. S. (1989). A generalized approach for estimating effective population size from temporal changes in allele frequency. Genetics 121 (2), 379–391.
Weiner, J., Freckleton, R. P. (2010). Constant final yield. Annu. Rev. Ecol. Evol. Syst. 41 (1), 173–192. doi: 10.1146/annurev-ecolsys-102209-144642
Weiner, J., Andersen, S. B., Wille, W. K.-M., Griepentrog, H. W., Olsen, J. M. (2010). Evolutionary agroecology: the potential for cooperative, high density, weed-suppressing cereals. Evol. Appl. 3 (5–6), 473–479. doi: 10.1111/j.1752-4571.2010.00144.x
Weir, B., Cockerham, C. (1984). Estimating F-statistics for the analysis of population structure. Evolution 38 (6), 1358–1370. doi: 10.2307/2408641
Wright, S. (1969). Evolution and the genetics of populations: volume 2, the theory of gene frequencies (Chicago: University of Chicago Press).
Wright, S. (1978). Evolution and the genetics of population, variability within and among natural populations (Chicago: University of Chicago Press).
Keywords: cropping system, evolution, genetic diversity, natural selection, plant height
Citation: Knapp S, Döring TF, Jones HE, Snape J, Wingen LU, Wolfe MS, Leverington-Waite M and Griffiths S (2020) Natural Selection Towards Wild-Type in Composite Cross Populations of Winter Wheat. Front. Plant Sci. 10:1757. doi: 10.3389/fpls.2019.01757
Received: 02 September 2019; Accepted: 16 December 2019;
Published: 25 February 2020.
Edited by:
Nina Rønsted, National Tropical Botanical Garden, United StatesReviewed by:
Kristin Mercer, The Ohio State University, United StatesAgata Gadaleta, University of Bari Aldo Moro, Italy
Pasquale De Vita, Council for Agricultural and Economics Research, Italy
Copyright © 2020 Knapp, Döring, Jones, Snape, Wingen, Wolfe, Leverington-Waite and Griffiths. This is an open-access article distributed under the terms of the Creative Commons Attribution License (CC BY). The use, distribution or reproduction in other forums is permitted, provided the original author(s) and the copyright owner(s) are credited and that the original publication in this journal is cited, in accordance with accepted academic practice. No use, distribution or reproduction is permitted which does not comply with these terms.
*Correspondence: Simon Griffiths, c2ltb24uZ3JpZmZpdGhzQGppYy5hYy51aw==
†Deceased March 10, 2019