 Do Yoon Hyun*†
 Raveendar Sebastin†Kyung Jun Lee
 Gi-An LeeMyoung-Jae ShinSeong Hoon KimJung-Ro LeeGyu-Taek Cho
- National Agrobiodiversity Center, National Institute of Agricultural Sciences, Rural Development Administration, Jeonju, South Korea
Wheat (Triticum spp.) has been an important staple food crop for mankind since the beginning of agriculture. The genus Triticum L. is composed of diploid, tetraploid, and hexaploid species, majority of which have not yet been discriminated clearly, and hence their phylogeny and classification remain unresolved. Genotyping-by-sequencing (GBS) is an easy and affordable method that allows us to generate genome-wide single nucleotide polymorphism (SNP) markers. In this study, we used GBS to obtain SNPs covering all seven chromosomes from 283 accessions of Triticum-related genera. After filtering low-quality and redundant SNPs based on haplotype information, the GBS assay provided 14,188 high-quality SNPs that were distributed across the A (71%), B (26%), and D (2.4%) genomes. Cluster analysis and discriminant analysis of principal components (DAPC) allowed us to distinguish six distinct groups that matched well with Triticum species complexity. We constructed a Bayesian phylogenetic tree using 14,188 SNPs, in which 17 Triticum species and subspecies were discriminated. Dendrogram analysis revealed that the polyploid wheat species could be divided into groups according to the presence of A, B, D, and G genomes with strong nodal support and provided new insight into the evolution of spelt wheat. A total of 2,692 species-specific SNPs were identified to discriminate the common (T. aestivum) and durum (T. turgidum) wheat cultivar and landraces. In principal component analysis grouping, the two wheat species formed individual clusters and the SNPs were able to distinguish up to nine groups of 10 subspecies. This study demonstrated that GBS-derived SNPs could be used efficiently in genebank management to classify Triticum species and subspecies that are very difficult to distinguish by their morphological characters.
Introduction
Wheat (Triticum spp.) is the most widely cultivated food crop worldwide. The large amount of wheat accessions in the world’s genebanks has reflects the importance of wheat as a world crop (FAO, 2010). Currently available data clarify the economic importance of wheat as the total world wheat production has increased substantially from 521 million tons (mt) in 1987 to 751 mt in 2016 (FAOSTAT, 2016). The European Union (EU) was the largest producer of wheat (144 mt), followed by China (129 mt) and the Former Soviet Union (FSU) with 83 mt. Similarly, among food crops worldwide, wheat also reveals the greatest range in its area of cultivation, from 67°N in Scandinavia and Russia to 45°S in Argentina, including regions in the tropics and subtropics, with different varieties sown according to the climate (Feldman, 1995). Furthermore, there is an increasing global demand for wheat products based on the consumption in new markets beyond its region of climatic adaptation. Hence, modern plant breeders are challenged to make novel varieties suitable to various climatic conditions in order to increase crop yield.
Wheat that evolved from wild grasses is characteristically polyploidic in nature, with four (A, B, D, and G) basic genomes (Gill and Friebe, 2002). The major wheat species grown throughout the world is T. aestivum, a hexaploid species usually called common wheat. However, in total world wheat production, T. turgidum var. durum, a tetraploid species considered suitable variety for hot dry climatic conditions of the world regions, contributed about 35–40 mt. To improve wheat production, various efforts have been taken over the decades to find the genomic variation in the wheat population (Dvorak and Zhang, 1990). Various molecular methods have also been developed for genetic analysis of wheat populations (Khan et al., 2014). Landjeva et al. (2007) extensively reviewed the potential generation of molecular markers and their contribution in wheat breeding programs. Globally, ∼ 850,000 wheat accessions including landraces and synthetic derivatives were preserved in germplasm banks as reservoirs of useful alleles, but their sustainable utilization in breeding programs needs to be improved (FAO, 2010).
The efficient introgression of novel genes from wild relatives to cultivar genotypes greatly depends on accurate identification of the wild species. Despite having standard procedures in genebanks such as the genebank management system (GMS) for efficient management of plant genetic resources, incorrect classification is not uncommon. Misidentification of species has been reported in crops, including rice (Orjuela et al., 2014), yams (Girma et al., 2012), Brassica spp. (Mason et al., 2015), and also in other wild species (Blanca et al., 2017). Various genotyping methods based on molecular markers have been developed and implemented in species authentication (Semagn et al., 2012; Frey et al., 2013; Ertiro et al., 2015; Chen et al., 2016). Species discriminating markers have also been reported (Balasaravanan et al., 2006; Cullingham et al., 2013; Curk et al., 2015), which have great potential to apply in genebank management where numerous species misidentifications have often occurred around the globe (Rodrigues et al., 2014; Mason et al., 2015).
In genebanks, large accessions of the common wheat (T. aestivum) and their progenitor durum wheat (T. turgidum) are almost indistinguishable morphologically, making classification difficult. Different genes from nuclear and chloroplast genomes are utilized to identify the phylogenetic relationships existing between plant species including wheat (Doi et al., 2002; Raveendar et al., 2019). In recent years, numerous marker systems have also been developed and used in assessing genetic variability, population structure, and phylogenetic analysis of plant species (Doi et al., 2002; Jaaska, 2005). Similarly, many barcoding based studies have also been employed to improve the accuracy of germplasm characterization (Blattner, 2004; Gregory, 2005; Awad et al., 2017; Osman and Ramadan, 2019); however, most have failed due to lack of efficient species-specific markers. Recent technological developments in next-generation sequencing (NGS) methods have enabled the screening of plant germplasm in a feasible and cost-effective manner (Lemmon and Lemmon, 2013). Moreover the availability of high-quality reference genome sequences (IWGSC, 2014) enabled the large-scale discovery of single nucleotide polymorphisms (SNPs) by comparing whole-genome shotgun sequences of individuals. SNPs represent the most frequent type of genetic polymorphism which allows the development species-specific markers (Cullingham et al., 2013).
High-throughput SNP discovery pipelines have been developed and applied to identify SNPs on the diploid wheat genome progenitor Ae. tauschii (You et al., 2011). Recently, Allen et al. (2013) identified 95,266 putative SNPs from a wheat exome using targeted resequencing of 8 bread wheat varieties. Similarly, SNP array methods were used to genotype a wheat population (Cavanagh et al., 2013; Rimbert et al., 2018; You et al., 2018). Genotyping-by-sequencing (GBS) is one such genome-wide but reduced representation method that generates a large number of sequence variants (SNPs) with a large population (Elshire et al., 2011; Beissinger et al., 2013). When compared with other methods such as Reduced Representation Libraries (RRLs) and Restriction site Associated DNA (RAD) sequencing, the GBS method is ideal for wheat genotypes, as the two-enzyme approach reduces genome complexity simply by avoiding repetitive regions of large genomes (Poland et al., 2012). GBS methods have been successfully applied in a wide range of crops including wheat (Lu et al., 2015; Alipour et al., 2017; Elbasyoni et al., 2018). Moreover, GBS has also been used to infer the phylogenic classification of wild species (Bajaj et al., 2015; Wong et al., 2015).
This study aimed to characterize the collection of wheat accession currently conserved in the National Genebank of the Republic of Korea and implement the barcode system in the GMS for efficient management of germplasm. To improve the understanding of our existing germplasm, we examined the phylogenetic relationships and population structure of the genus Triticum. We also verified the authenticity of all the accessions and evaluated the reproducibility of GBS results in species classification and accession identification.
Materials and Methods
Plant Material and DNA Extraction
We collected a total 283 accessions representing 17 Triticum species and subspecies along with an Aegilops species as an outgroup from the United States Department of Agriculture (USDA) germplasm collection and National Agrobiodiversity Center at the National Institute of Agricultural Sciences, Rural Development Administration (RDA), Republic of Korea (Supplementary Table S1). Among the 283 accessions, a total 114 Triticum accessions, which include all 17 Triticum species and subspecies, were chosen for species discrimination. Three common wheat cultivars such as geumgang, jogyoung, and woori were included in the study to verify the accuracy of the species discrimination. A total of 169 common/durum wheat (T. aestivum/T. turgidum) cultivars and landraces were specifically used to find species-specific SNPs markers. Fresh leaf tissue was harvested from 3-week-old germinated seedling and total DNA was extracted using the DNeasy® Plant Mini kit (Qiagen, Valencia, CA, United States) according to the manufacturer’s instructions.
GBS Library Preparation
The extracted DNA was quantified and normalized to 12.5 ng/μL using the standard procedure of Quant-iT PicoGreen dsDNA Assay Kit (Molecular Probes, Eugene, OR, United States) with Synergy HTX Multi-Mode Reader (Biotek, Winooski, VT, United States). The normalized DNA was codigested with the restriction enzymes (New England Biolabs) PstI (CTGCAG) and MspI (CCGG) at 37°C for 3 h and then the GBS libraries were constructed according to the protocols described previously (Elshire et al., 2011; De Donato et al., 2013). After restriction digestion, the DNA samples were ligated with adapters using T4 DNA ligase (New England Biolabs) at 22°C for 2 h that contain different barcodes for tagging individual samples.
The ligated samples were pooled and purified with NucleoSpin® Gel using the PCR Clean-up Kit (MACHEREY-NAGEL GmbH & Co., KG). The purified samples were polymerase chain reaction (PCR) amplified with 25 pmol of primer (Lee et al., 2019) in a 50-μL reaction using AccuPower Pfu PCR Premix (Bioneer). The distribution of fragment sizes in the PCR product was evaluated with BioAnalyzer 2100 (Agilent Technologies) and GBS libraries were sequenced on Illumina NextSeq500 (Illumina, San Diego, CA, United States) with a length of 150 bp reads.
Genotyping and SNP Calling
The Illumina-produced raw reads were processed with Stacks v. 2.0, FastQC v. 0.11.7, and Cutadapt v. 1.9.1 software (Andrews, 2010; Martin, 2011; Catchen et al., 2013). Initially, demultiplexing was performed by bcl2fastq software in BaseSpace1 with one mismatch per index in the sample sheet and the sequence reads were subjected to Stacks v. 2.0, process_radtags module to confirm the demultiplexed reads with the restriction enzyme site. The demultiplexed reads were quality filtered based on per-base quality of reads in FastQC and subject to adapter sequences removal by Cutadapt. Quality-filtered reads were mapped to the reference genome (Wheat IWGSC RefSeq v. 1.0) using Bowtie2 (Langmead and Salzberg, 2012; Tello-Ruiz et al., 2018). Command-line Picard tools v. 2.1.02 were used for removal of the duplicate reads and generation of quality matrices on mapping.
Local recalibration and realignment were conducted using the Genome Analysis Toolkit (GATK; v. 3.7) to correct misalignments due to the presence of indels (RealignerTargetCreator and IndelRealigner arguments) (McKenna et al., 2010). The HaplotypeCaller and SelectVariants arguments were used for calling candidate SNPs aligned to Wheat IWGSC RefSeq v. 1.0 reference genome. After raw variants were obtained, variants were filtered with the filterVariant module in GATK to filter out according to quality score (QUAL < 30), quality depth (QD < 5), Fisher score (FS > 200) and with VCFtools v. 0.1.15 to restrict the missing rate (–max-missing 0.95), minor allele frequency (–maf 0.05), number of alleles (–min-alleles 2, –max-alleles 2), and mean read depth for an SNP locus (–min-meanDP 5) (McKenna et al., 2010). Nucleotide diversities for each of the six groups were performed using VCFtools (Danecek et al., 2011).
Population Structure
The filtered SNPs in the VCF file was converted to plink format using PLINK v. 1.9 software (Purcell et al., 2007). Two different methods were used to detect population structure: discriminant analysis of principal components (DAPC) (Jombart et al., 2010) and the Bayesian clustering algorithm of ADMIXTURE (Pritchard et al., 2000; Falush et al., 2003; Alexander et al., 2009). Discriminant analysis of principal components was implemented in R v. 3.1.1 (R core Team, 2014) using adegenet v. 1.4-2 (Jombart, 2008). We used the find.clusters function to estimate K with default parameters, which retains all principal components (PCs). To determine the optimal number of PCs to retain in the discriminant analysis, we used the cross-validation function (xval.dapc) to confirm the correct number of PCs to be retained (Jombart et al., 2010). The resultant clusters were plotted in a scatterplot of the first and second linear discriminants of DAPC.
To investigate the population structure, admixture analysis was performed on 114 individuals using the ADMIXTURE tool3 (Alexander et al., 2009). The admixture-linux-1.3.0 was run with default parameters with eight threads in unsupervised mode with K = 1–21. The cross-validation error for each K computed using the -cv option (10-fold) identified K = 5 and eight as the most suitable modeling choices.
Phylogenetic Relationships
All SNPs were concatenated into a single alignment. PAUP 4.0b10 was used to calculate score for the substitution of SNPs and Bayesian analyses were conducted with the GTR + G nucleotide substitution model using MrBayes v. 3.2.6. The GTR + G model was chosen in both AIC and hLRTs models for the model estimation. The model was estimated by MrModelTest v. 2.4 using the calculated score as the input value (Swofford, 2002). The tree was sampled every 1,000 generations until the average deviation of split frequencies fell below 0.01 using MrBayes (Ronquist et al., 2012). Bayesian posterior probabilities (PPs) were used to assess node stability. Although generally higher than bootstrap support values, posterior probabilities above the standard 95% threshold can be taken as indicative of strong node stability (Simmons et al., 2004). A maximum likelihood (ML) phylogenetic tree for each A, B, and D genome with 1,000 rapid bootstrap inference was also constructed by using MEGA6 (Tamura et al., 2013). The analysis of molecular variance (AMOVA) and the pairwise genetic differentiation (PhiPT) between and among Triticum genotypes were estimated with the modified Excoffier et al. (1992) approach using four-way comparisons of the clusters with VCFtools v. 0.1.15 (Danecek et al., 2011).
Identification of Species-Specific SNPs
Initially to find the species-specific markers, fine SNPs were filtered from the raw variants to discriminate the common/durum wheat cultivar and landraces. The dataset excludes all other wheat genotypes. Further species-specific SNPs were filtered with four different levels to discriminate subspecies. Pearson’s chi-squire test was performed to identify the significant SNPs that discriminate species and subspecies at each level. Principal component analysis (PCoA) was performed to characterize the genotypes between common and durum wheat, which classified T. aestivum/T. turgidum accession at the species level. PCoA of genetic variation among species groups was performed using GCTA software (Yang et al., 2011).
Results
Genotyping
Illumina NextSeq500 generated a total of 1,259,242,576 raw single-end sequence reads from seven GBS runs for 283 samples (Supplementary Table S1). The number of raw sequence reads with barcode identifier for each accession ranged from 1,651,370 to 10,077,587, with an average of 3,169,552. After quality filtering, 866,147,723 (96.5%) processed high-quality reads (with an average of 3,060,592) were obtained for all 283 accessions. Of these high-quality sequence reads, 784,024,368 (90.5%) were mapped to the Wheat IWGSC RefSeq v. 1.0 reference genome (Supplementary Table S2).
The combined Haplotag analysis generated a total of 1,542,332 SNPs from the raw variants, and a total of 52,186 SNPs were called after filtering out duplicated reads (Supplementary Figure S1). Among them, a total 14,395 SNPs at 80% missing level was selected for Triticum species discrimination, which includes 114 accessions. After filtering for missing values, physical distance, and minor allele frequency, a total of 14,188 final SNPs were distributed among the seven chromosomes (Table 1). Among the three wheat genomes, the average number of SNPs per chromosome was 676, ranging from 23 on chromosome 4D to 2,004 on chromosome 7A. The average SNP density was 0.95 SNPs per mega base pair (Mbp), with a lowest number of 0.05 SNPs on chromosome 4D and a highest number of 2.72 SNPs on chromosome 7A (Table 1). The transitions (Ts) were more frequent than the transversions (Tv) that composed slightly more than one-half in an average of 62.3% of all the identified SNPs. A higher frequency of C/T followed by G/A transitions and G/C transversions were evident in all seven chromosomes. The overall Ts/Tv ratio was observed to be higher (1.93) in the A genome followed by the B genome with 1.74 (Table 1).
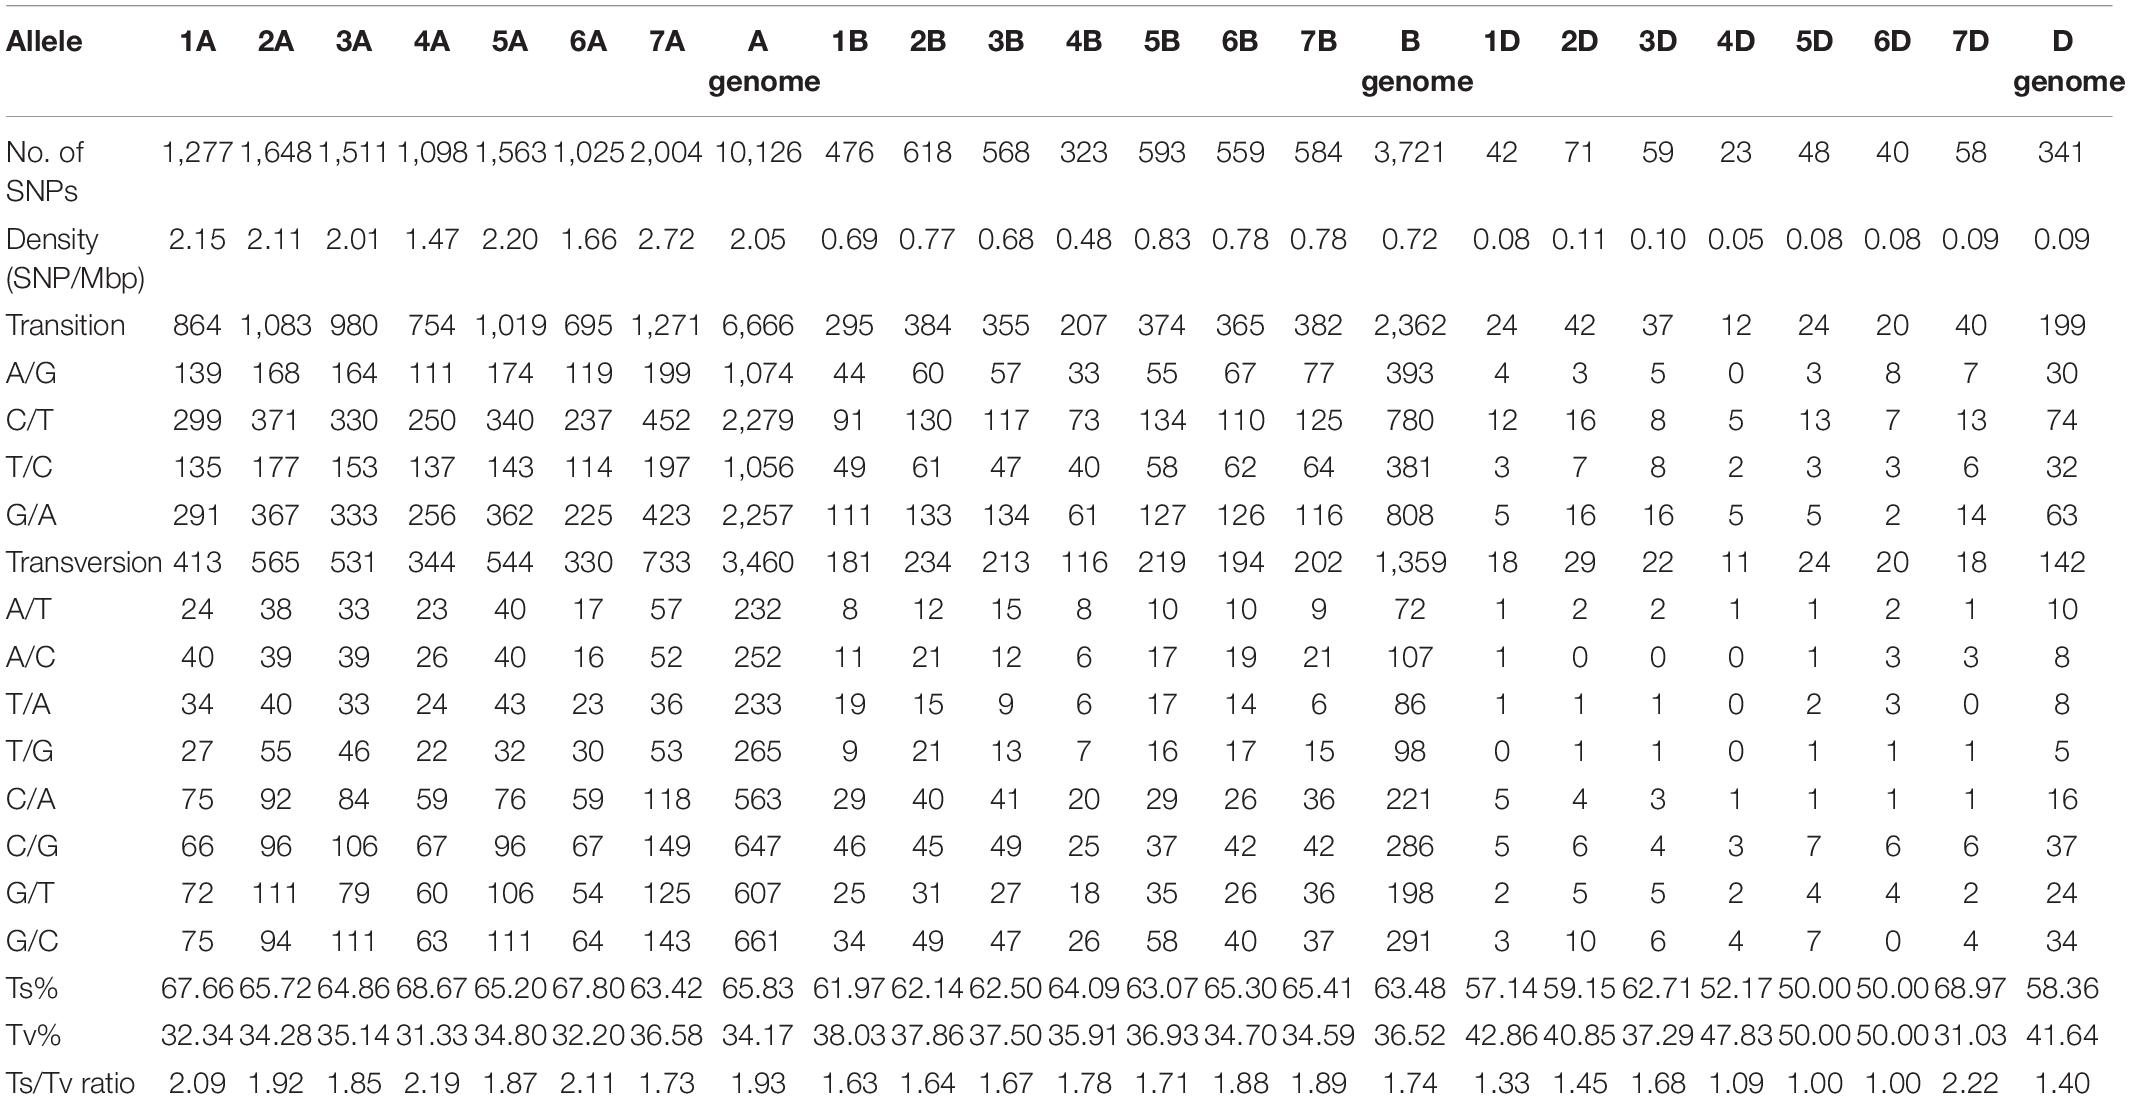
Table 1. Summary of SNPs used in the Triticum species differentiation based on three homologous wheat genomes with reference to Wheat IWGSC RefSeq v. 1.0.
Population Genetics in the Triticum Species
To understand the genetic structure in the panel of 283 genotypes, the complementary ordination analysis by DAPC and Bayesian clustering analysis in ADMIXTURE was performed. To find the suitable K value in ADMIXTURE, the number of clusters (K) was plotted against ΔK, which showed a sharp peak at K = 5 or K = 8 (Figure 1). Remarkably, a continuous-gradual increase was observed in the assessed log likelihood [LnP(D)] with the increase of K (Figure 1) and the best number of K, which clearly defined the number of populations was K = 5, indicating that five subpopulations could include all the 114 wheat genotypes with the highest probability. Populations 1, 2, 3, 4, and 5 consisted of 26, 40, 18, 13, and 17 accessions, respectively, and each cluster contains different Triticum species, where the subspecies were also represented by the respective clusters.
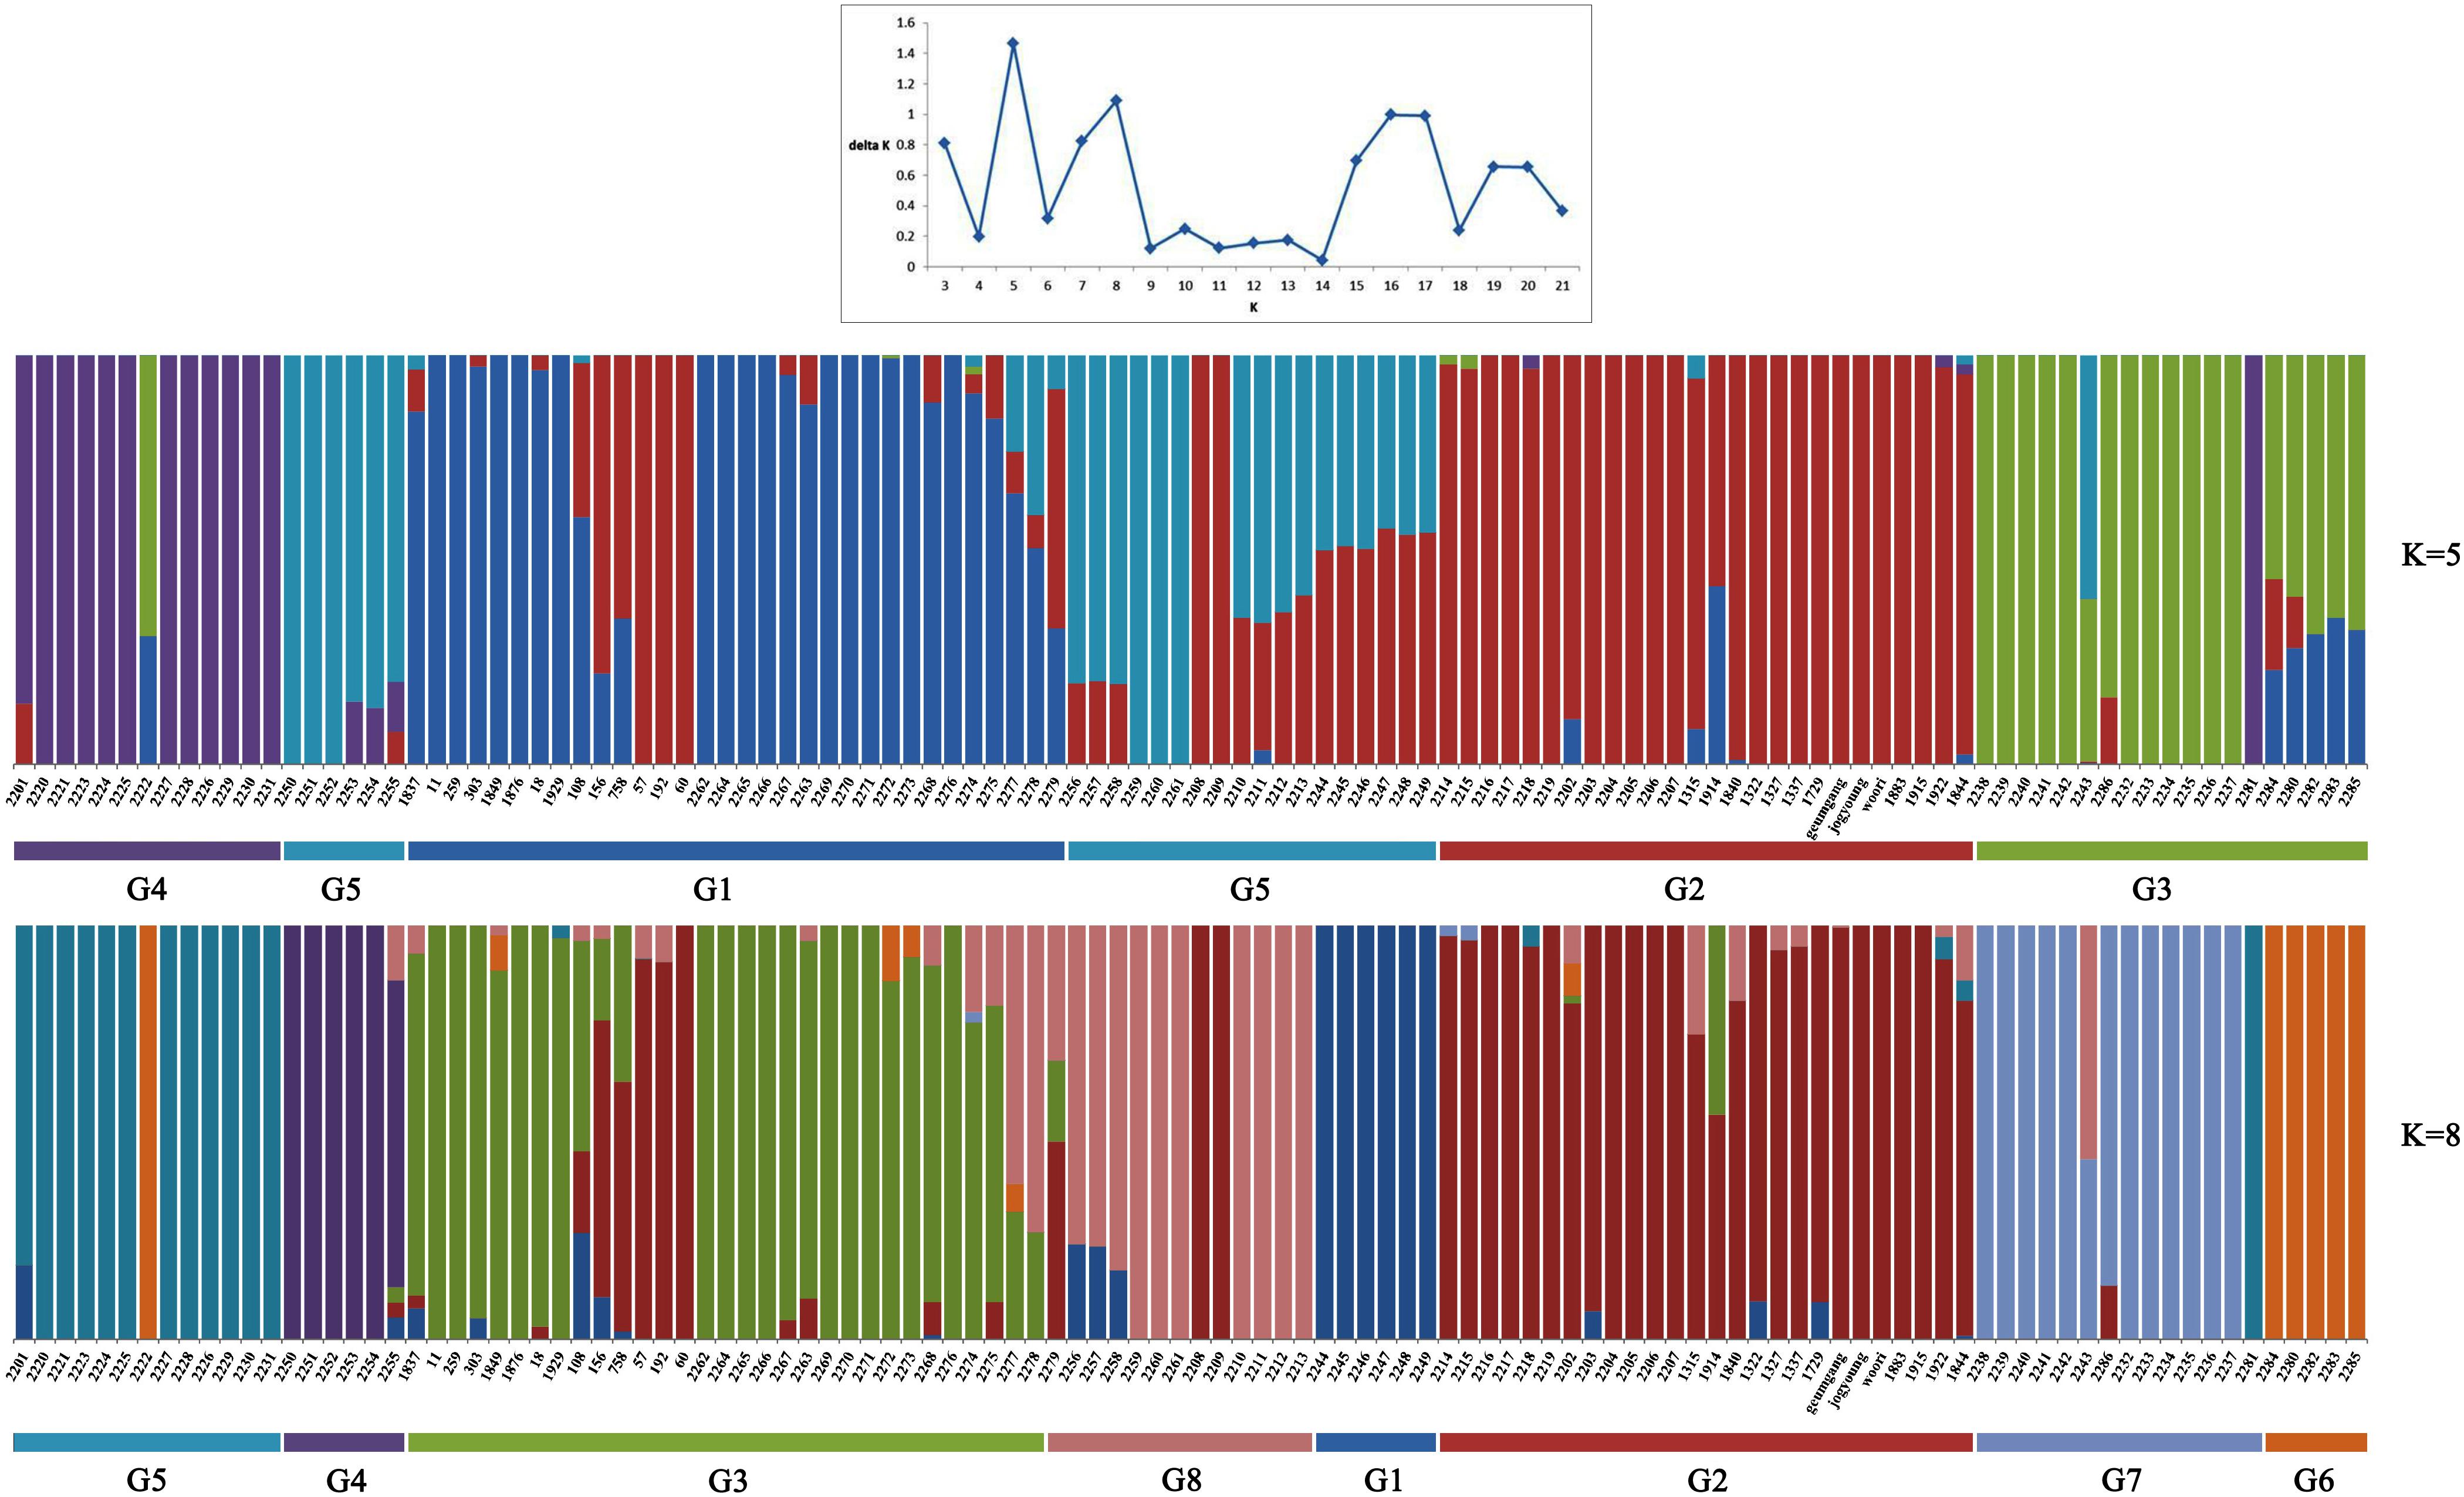
Figure 1. ADMIXTURE results assuming five and eight ancestral populations. Colors represent ancestry components. Stacked bars represent samples. Samples are arranged according to taxonomy as indicated in the x-axis.
Similarly, DAPC analysis was carried out to detect the possible number of clusters that include all 283 accessions (Figure 2). The number of detected clusters was six, which was in concordance with the lowest BIC value obtained using the find.clusters function. Total 30 first PCs (52% of variance conserved) of PCA and five discriminant eigenvalues were retained. These values were confirmed by cross-validation analysis. Population clusters 1, 2, 3, 4, 5, and 6 consisted of 182, 61, 12, 9, 13, and 6 accessions, respectively (Figure 2). Each cluster was represented by different Triticum species in which the major T. aestivum and T. turgidum accessions were present in cluster 1 and 2, respectively. However, all the T. turgidum subsp. carthlicum accessions were found in cluster 1 and some T. turgidum subspecies (subsp. dicoccoides and subsp. dicoccon) were clustered individually in cluster 4. Similarly, the fewer accessions of T. monococcum, T. timopheevii, and T. urartu were present in cluster 3, 5, and 6, respectively. As expected, T. zhukovskyi accession was found in cluster 5 along with T. timopheevii. Distribution of molecular variance among and within population clusters was estimated using AMOVA. Results revealed that based on pairwise PhiPT values, the genetic variability between (67%) clusters was greater than the variability within (33%) clusters (Table 2). Pairwise PhiPT genetic distances (Table 3) ranged from 0.055 (cluster 1/cluster 2) to 0.469 (cluster 3/cluster 1) with mean PhiPT value of 0.671 indicated significantly high variation among population clusters (Table 2).
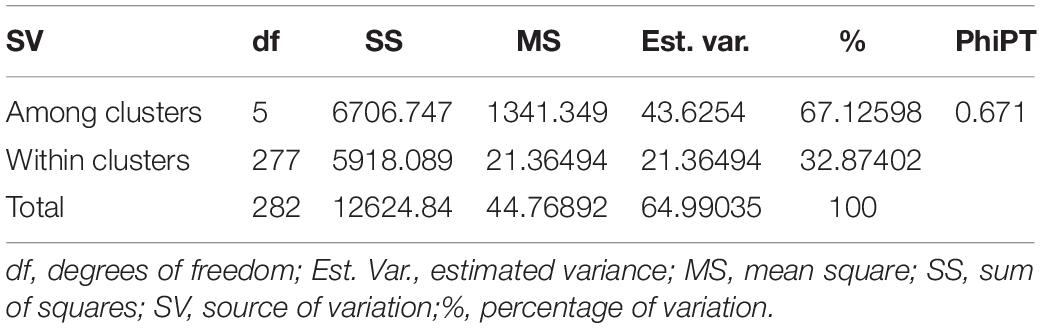
Table 2. Analysis of molecular variance (AMOVA) within and among the groups of 283 wheat accessions identified by the DAPC clustering.
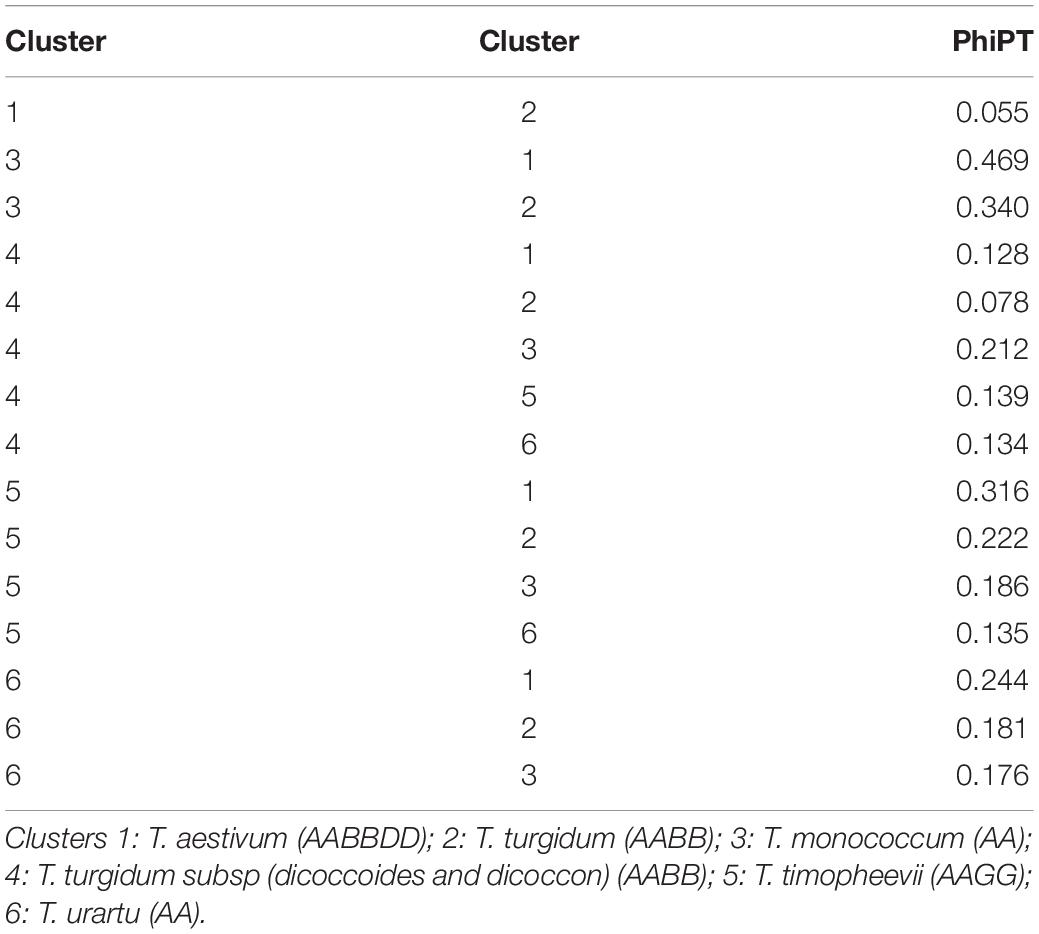
Table 3. Pairwiese genetic differentiation values (PhiPT) between clusters of 283 Triticum accessions.
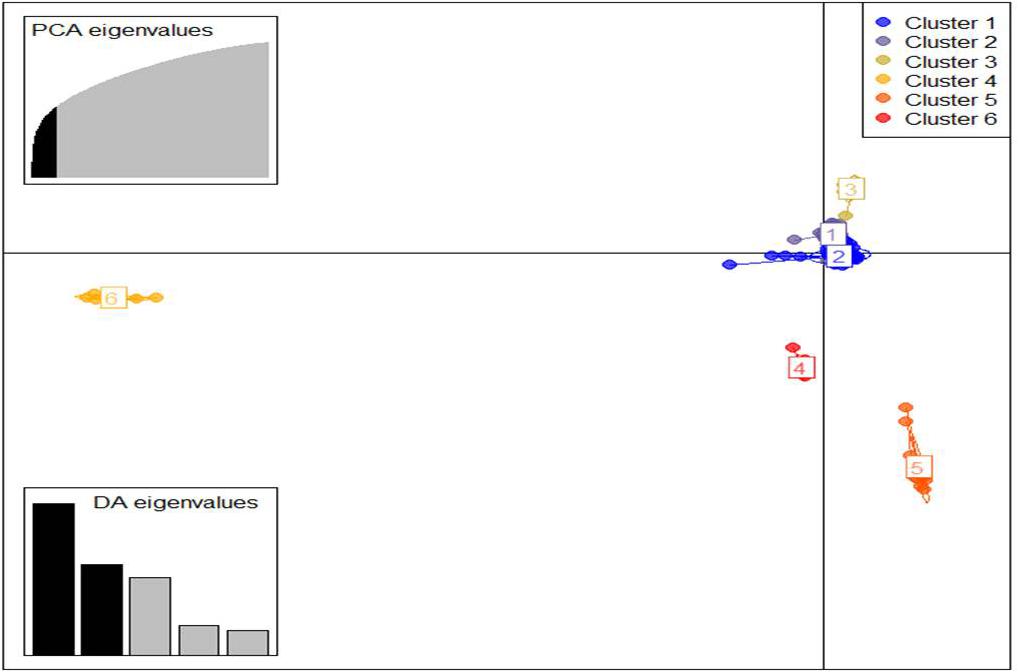
Figure 2. Discriminant analysis of principal components (DAPC) for 283 Triticum accessions using a 52,186 SNP set. Total 30 first PCs and five discriminant eigenvalues were retained during analyses, to describe the relationship between the clusters. The axes represent the first two linear discriminants (LDs). Each circle represents a cluster and each dot represents an individual. Numbers represent the different subpopulations identified by DAPC analysis.
Triticum Species Discrimination
A total of 114 Triticum accessions were chosen for species discrimination among all six Triticum species and subspecies: T. monococcum (AA genome), T. urartu (AA genome), T. turgidum (AABB genome), T. timopheevii (AAGG genome), T. aestivum (AABBDD genome), and T. zhukovskyi (AAAAGG genome). The ML tree of an individual genome such as the A, B, and D showed a highly resolved phylogeny with high bootstrap support (Supplementary Figure S2). The ML tree of the A genome showed that T. urartu is clustered with the AABB genome before T. timopheevii and T. monococcum. On the basis of the B genome tree, T. timopheevii (AAGG genome) is clustered more closely with the AABB(DD) lineage. All the Triticum species such as T. aestivum, T. turgidum, T. monococcum, T. timopheevii, T. urartu, and T. zhukovskyi were identified successfully. However, the individual genomes failed to differentiate the Triticum subspecies successfully on the ML tree of the A, B, and D genome. Hence, the Bayesian phylogenetic tree for all the 114 accessions along with Aegilops accessions was constructed for a better visualization of their relationships. The Bayesian phylogenetic reconstruction of Triticum species showed a highly resolved phylogeny with higher >50% nodal support (Figure 3). In the Bayesian tree, all the 16 Triticum species and subspecies formed an individual cluster where a single T. zhukovskyi accession clustered together with the T. timopheevii clade and an Aegilops outgroup, which was similar to the results of the ADMIXTURE (Figure 1). The phylogenetic tree provided 100% nodal support for the polyphyletic relationship among the five major Triticum species: T. aestivum, T. turgidum, T. monococcum, T. urartu, and T. timopheevii/T. zhukovskyi. As expected, all the examined species exhibited the greatest genetic distance from each other, while T. aestivum/T. turgidum species was the closest. Similarly, all subspecies groups were further separated into their respective taxa. It was clearly visualized that the wheat species and subspecies are divided into groups according to the presence of A, B, D, and G genomes (Figure 3). However, in the Bayesian tree, few durum wheat accessions were clustered together with other Triticum species. Similarly, individual accessions of T. monococcum and T. urartu were positioned in opposite clades of one another. Moreover, T. aestivum subsp. spelta (spelt wheat) (AABBDD) was located on two different clades, with four European accessions tied to T. turgidum (AABB) and two Asian to T. aestivum (AABBDD) clade, suggested that the evolution of European and Asian spelt wheat may be different.
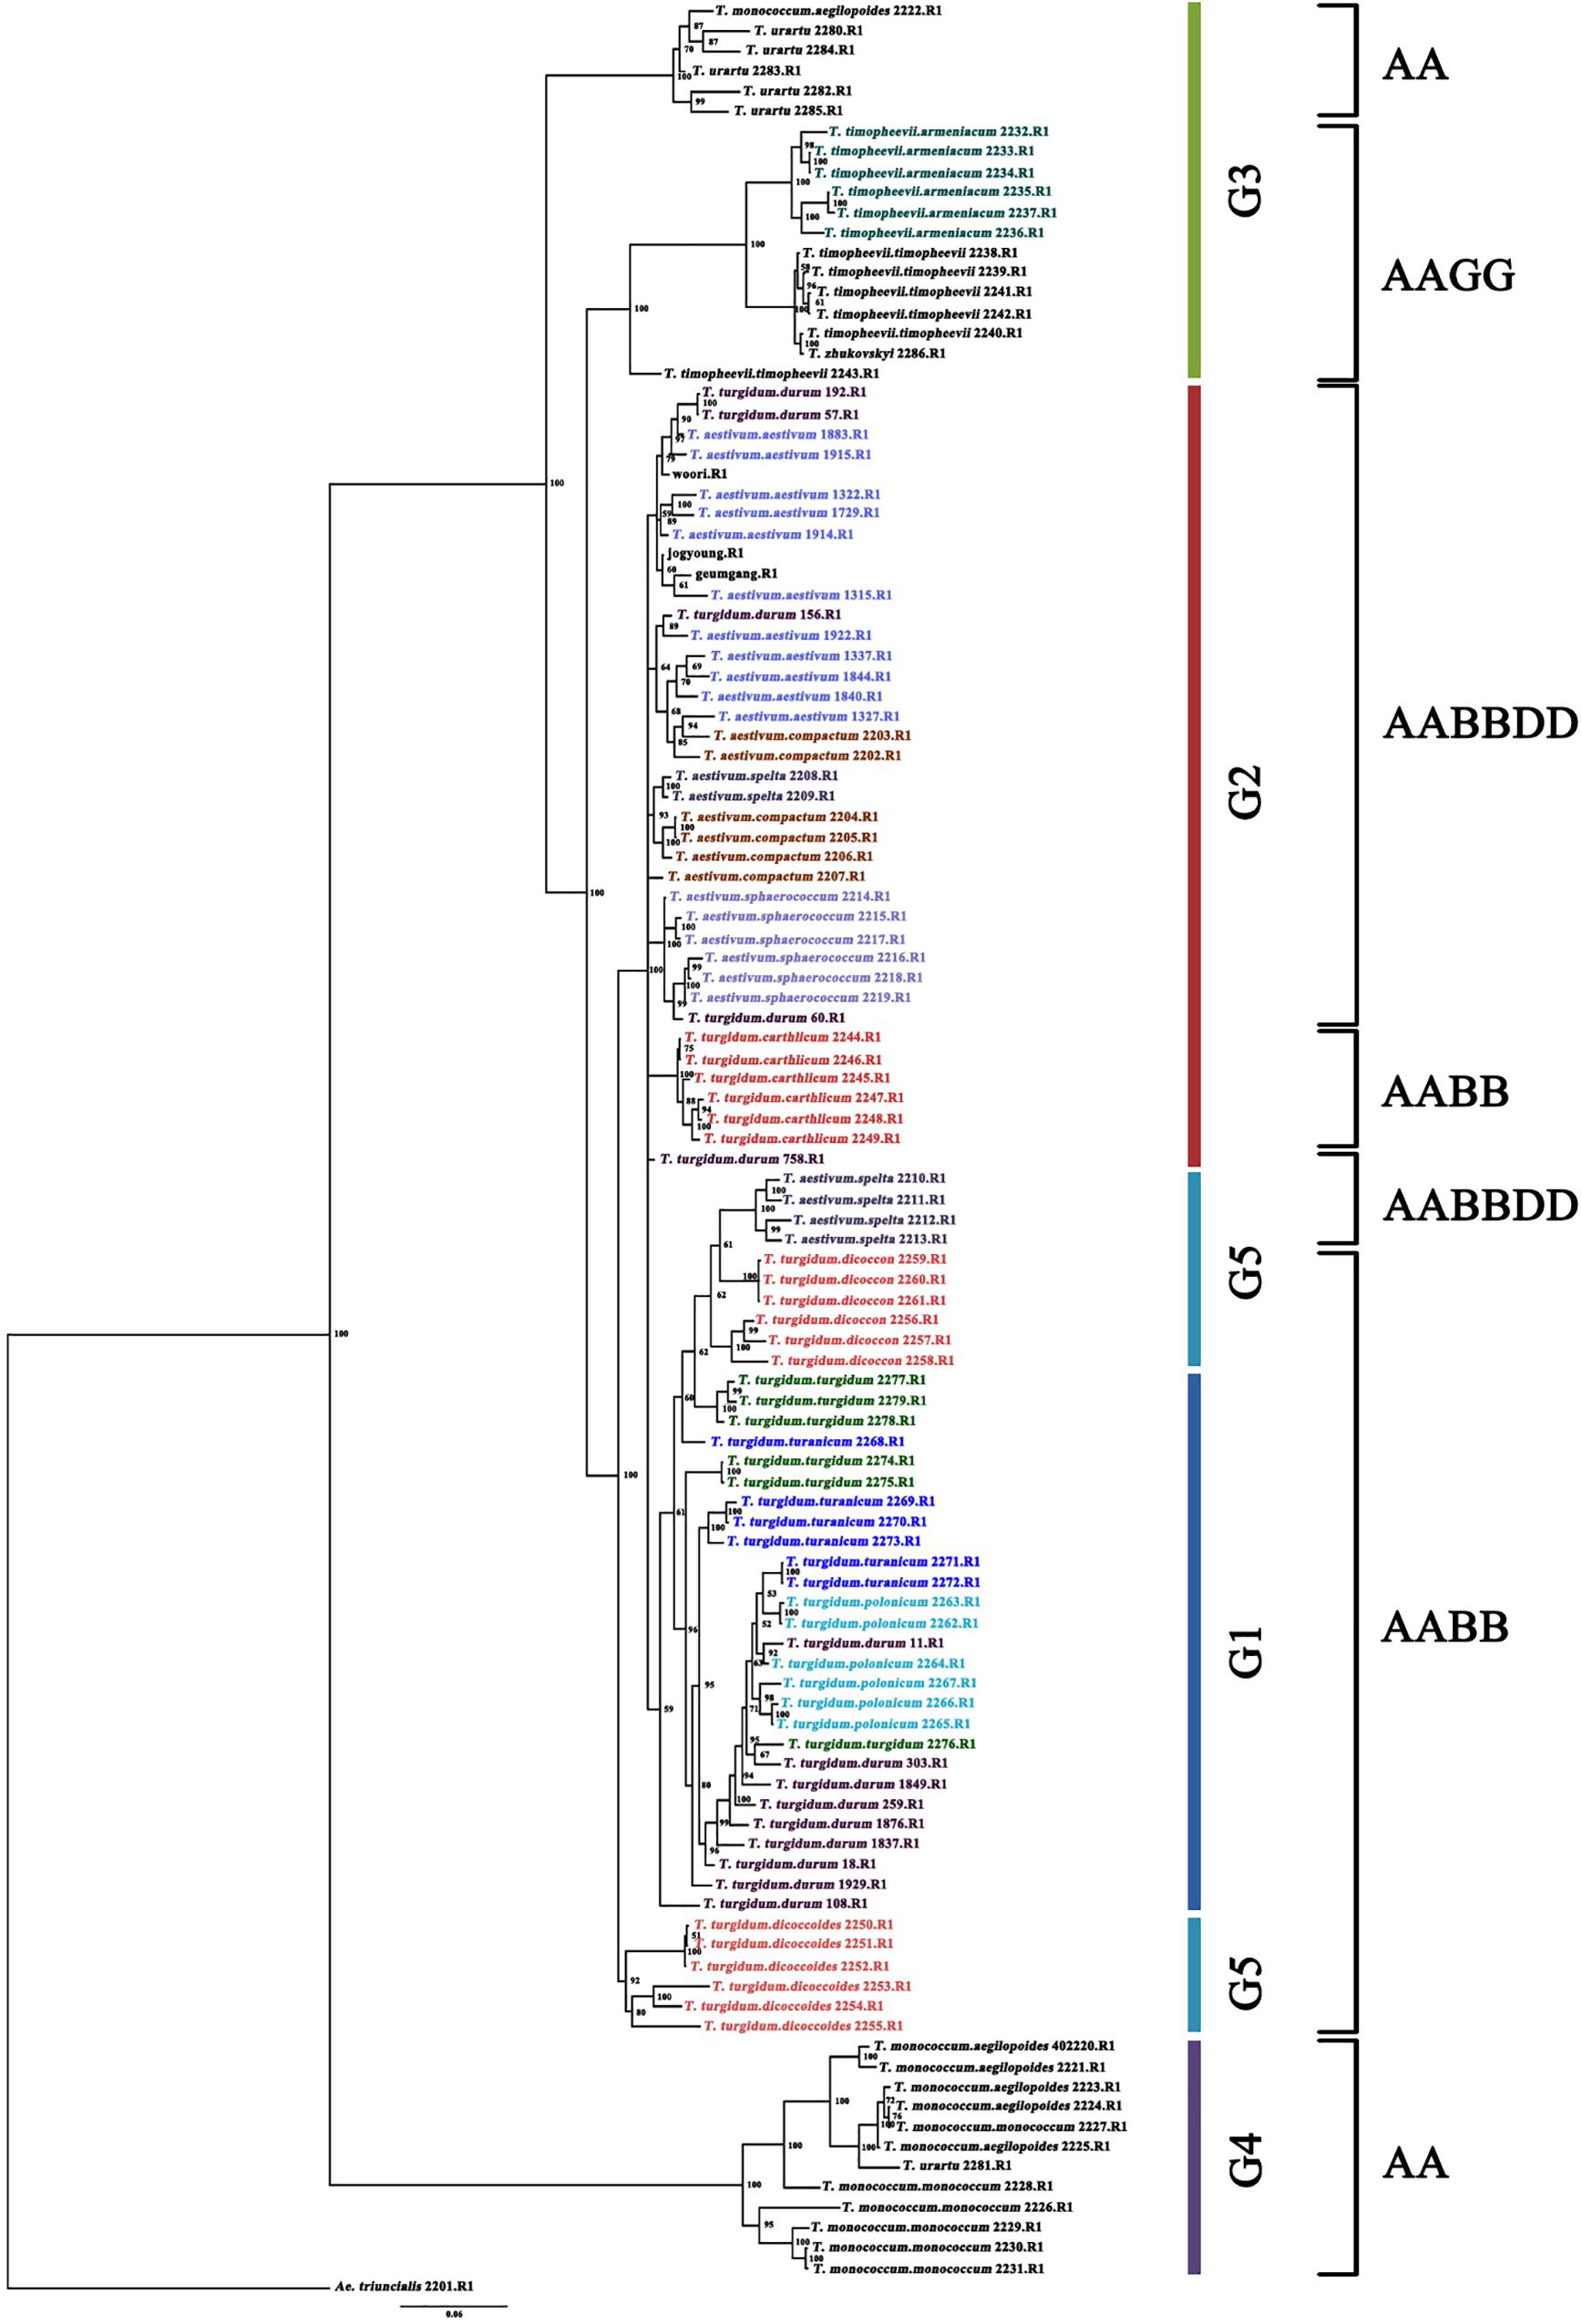
Figure 3. Bayesian phylogenetic tree of 114 accessions of the Triticum species and subspecies using 14,188 SNPs (80% missing level) obtained by GBS. Numbers in nodes are Bayesian posterior probabilities (×100). Only values above 50% are included. When a value is not included, the corresponding node was either present with lower support or unresolved. The accessions grouping in the color bar is identical to admixture ancestry coefficient (K = 5) of 114 accessions. The outgroup taxon is Ae. triuncialis.
Species-Specific Marker for Common Wheat Discrimination
The species boundary between T. aestivum (AABBDD genome) and its wild progenitor T. turgidum (AABB genome) was found to be difficult to distinguish because of their paraphyletic relationship. Initially, a total of 8,269 fine SNPs were filtered from the raw variants to discriminate the common/durum wheat cultivar and landraces. Further, in Pearson’s chi-square test, a total of 2,692 species-specific SNPs were detected at each level. In PCoA grouping, the two wheat species formed individual clusters and the SNPs were able to divide up to 9 groups of 10 subspecies (Figure 4).
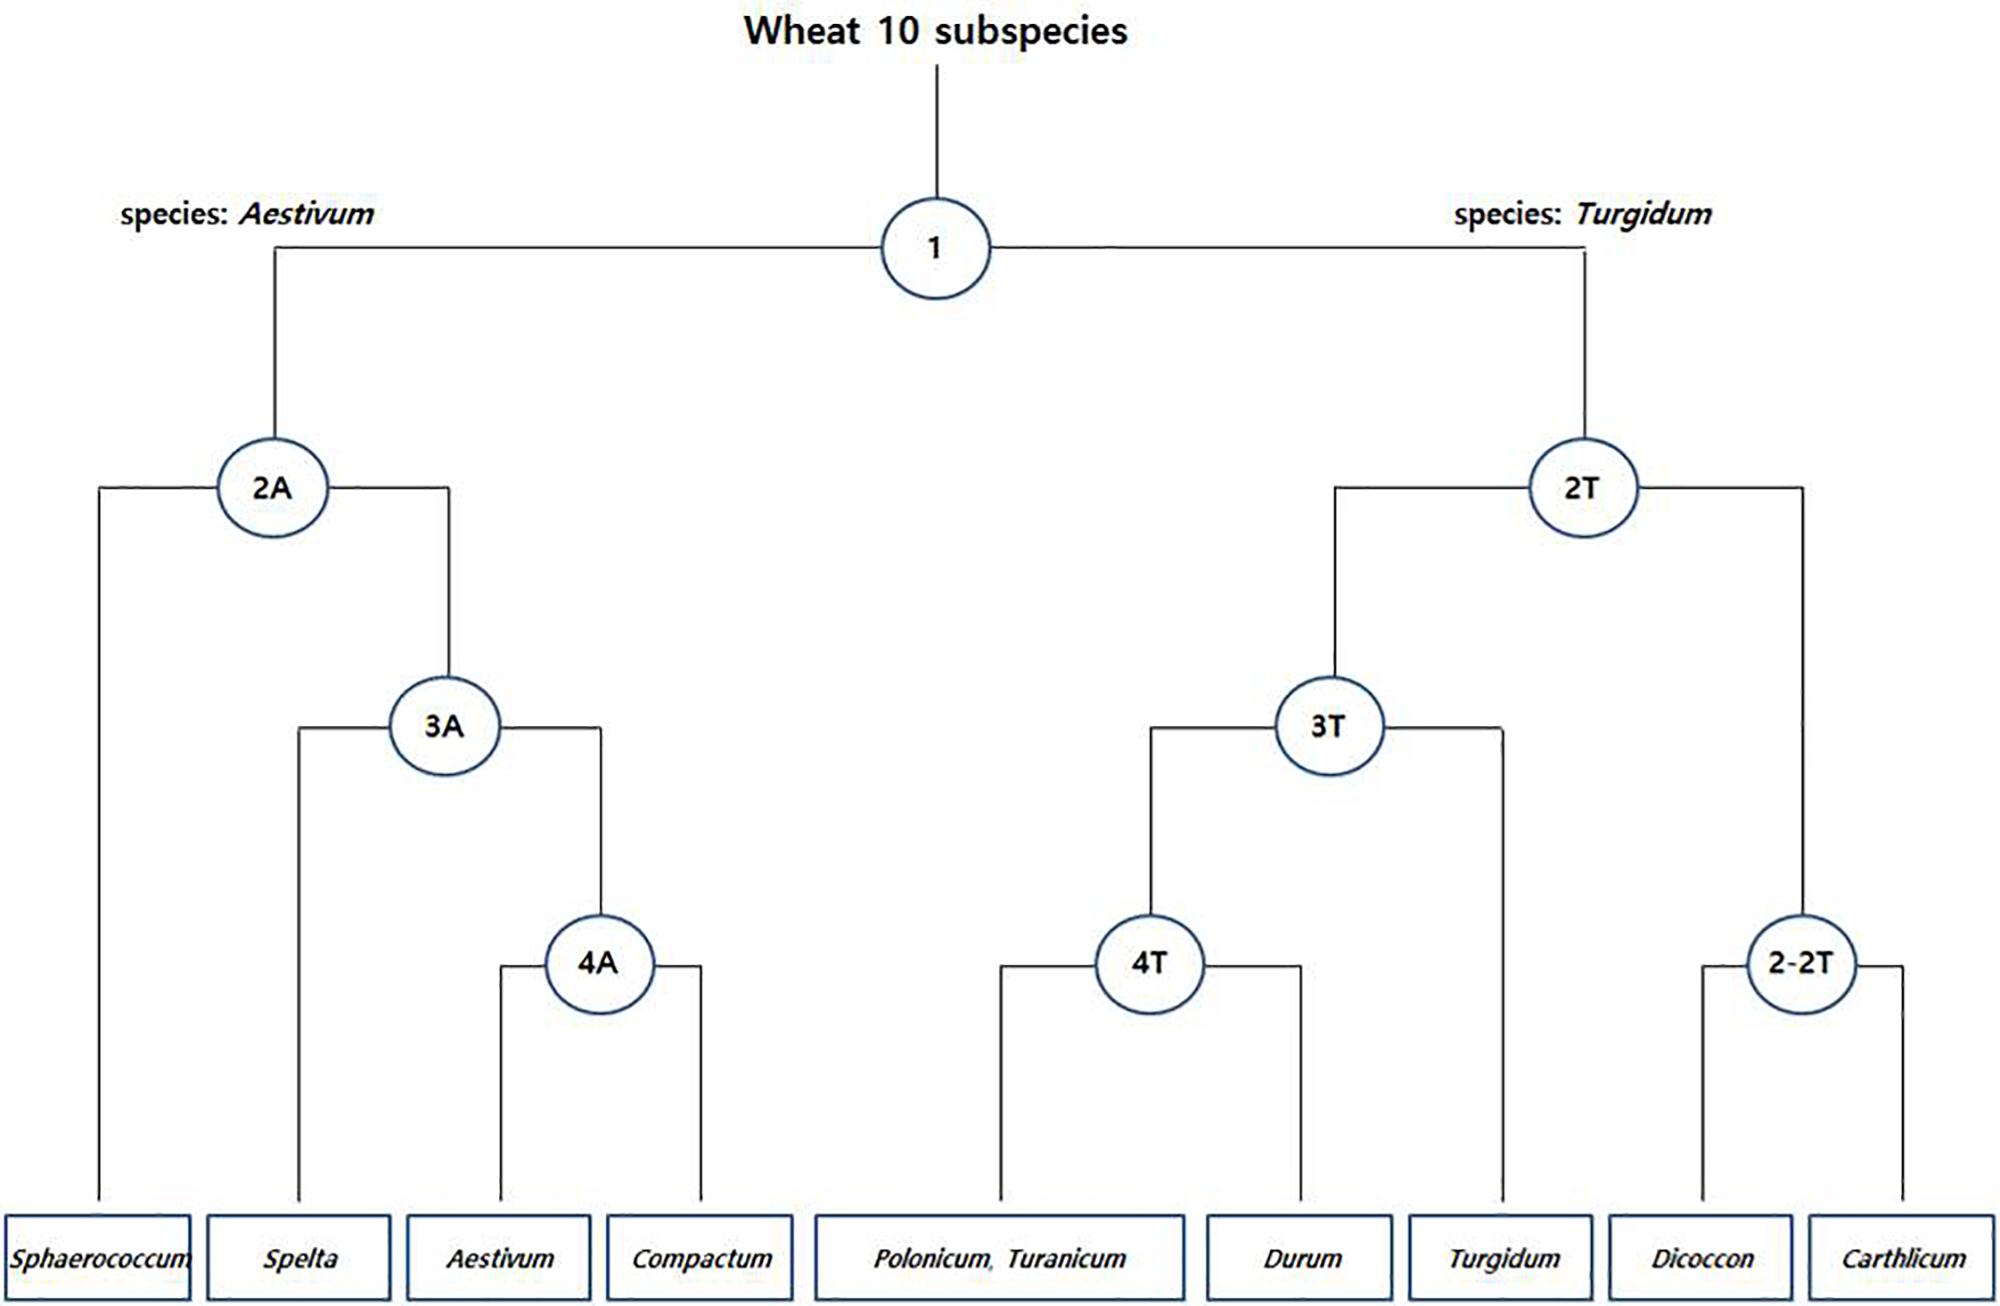
Figure 4. Species-specific SNP-based clustering of common [T. aestivum (A)] and durum [T. turgidum (T)] wheat accessions. Each node represents the number of species-specific SNPs (Supplementary Table S3).
In the first step (node 1), a total of 776 species-specific SNPs between the common (T. aestivum; AABBDD genome) and durum wheat (T. turgidum; AABB genome) accessions were detected and varied from three on chromosome 4D to 86 on chromosome 5A (Supplementary Table S3). The first two principal components (FTPCs) accounted for 12.5 and 9.3% of total variability, respectively (Supplementary Figure S3). The population can be divided into two different clusters: one comprising all common wheat (T. aestivum; AABBDD genome) accessions and a second composed exclusively of durum wheat (T. turgidum; AABB genome) accessions.
In the second step (node 2), we searched species-specific SNPs that discriminate subspecies within common and durum wheat accessions. We found 15.4 and 8.5% of total variability in FTPCs of 2A (Supplementary Figure S3). A total of 573 SNPs (Supplementary Table S3) differentiate T. aestivum subsp. sphaerococcum from other subspecies. Similarly, 13 and 10.4% of total variability were shown in FTPCs of 2T (Supplementary Figure S3). In this node a total of 575 SNPs (Supplementary Table S3) discriminate T. turgidum subsp. carthlicum and T. turgidum subsp. dicoccon from other subspecies. Moreover, a total 266 SNPs (Supplementary Table S3) in 2–2T are able to distinguish the two subspecies (dicoccon/carthlicum) and the FTPC holds 43.7 and 27.6% of total variability (Supplementary Figure S3).
Further, in the third step (node 3), a total of 275 SNPs (Supplementary Table S3) in 3A with 15.9 and 7.8% of total variability (Supplementary Figure S3) discriminate T. aestivum subsp. spelta from other two subspecies and a total of 166 SNPs (Supplementary Table S3) in 3T with 12.2 and 9.3% of total variability (Supplementary Figure S3) discriminate T. turgidum subsp. turgidum from other three subspecies. Finally, in the fourth step (node 4), 11 and 10.5% of total variability in FTPC of 4A were detected (Supplementary Figure S3) with 37 SNPs (Supplementary Table S3). The SNPs are able to distinguish the subspecies between T. aestivum subsp. aestivum and T. aestivum subsp. compactum. Similarly, 24 SNPs (Supplementary Table S3) in 4T with 15 and 8.2% of total variability in FTPC (Supplementary Figure S3) differentiate T. turgidum subsp. durum from other two subspecies, where no species-specific SNP was found between T. turgidum subsp. polonicum and T. turgidum subsp. turanicum. This could be expected because of the high genetic similarity between the two subspecies.
Discussion
Genotyping Assay
GBS is one of the most efficient and cost-effective method in NGS to develop genome-wide datasets that provide an opportunity to resolve the phylogenetic problems that exist in closely related species (Elshire et al., 2011). Many researchers reported that species discrimination always failed when using chloroplast or nuclear specific markers with limited number of samples in phylogenic study of very closely related species (van Velzen et al., 2012; Li et al., 2014; Stallman et al., 2019). In this study, we investigated the utility of GBS to resolve the classification of the Triticum complex by developing genome-wide SNP datasets. As expected, GBS identified abundant genome-wide SNPs, with varying missing levels. The missing SNP datasets have been reported as a central drawback in low coverage genome sequencing such as Diversity Array Technology (DArT), GBS, etc. (Wong et al., 2015; Edet et al., 2018). Various studies reported the impact of missing datasets on phylogenetic analyses (Philippe et al., 2004; Xi et al., 2015) and concluded that the missing data can be addressed with a statistical method (Alipour et al., 2019; Schurz et al., 2019). Therefore, to explore further the utility of missing SNP datasets on phylogenetic analysis, we employed missing rates of 20, 50, and 80%, which revealed that decreasing the missing rates leads to reduction of SNPs.
In the present study, a total of 52,186 GBS-derived high-quality SNPs were obtained from 114 Triticum genotypes, whereas only 14,188 SNPs were used for species discrimination. The number of SNPs located on the A, B, and D genomes showed that the A genome had the highest number of SNPs, followed by the B and D genomes (Supplementary Figure S1). Generally, in previous studies, the number of SNPs in the A or B genome is two (Iehisa et al., 2014; Alipour et al., 2017) to five (Allen et al., 2013; Cavanagh et al., 2013) times higher than in the D genome, which was in agreement with the present study. Dubcovsky and Dvorak (2007) reported the hexaploid wheat was found to have a larger portion of the natural gene diversity from its tetraploid ancestor (AABB) than the diversity found in the Aegilops tauschii (DD). Similarly, the identification of a relatively higher frequency of SNPs showing transition substitutions (62.3%) than transversions is consistent with previous genome-wide SNP discovery studies in crop plants, including wheat (Parida et al., 2012; Lai et al., 2015; Rimbert et al., 2018; Alipour et al., 2019). The present study showed that the GBS-derived SNPs hold potential variation among genomes, which has to be explored further by analyzing the genomic variation of Triticum genotypes.
Population Genomic Differentiation
The DAPC analysis generally separated the lineages of the Triticum genotypes in individual clusters; all 283 Triticum accessions were clustered based on their species complex (Figure 2). Similar to the DAPC analysis, ADMIXTURE results showed five and eight populations (Figure 1). ADMIXTURE (Pritchard et al., 2000) and BAPS (Corander et al., 2008) are most widely used in inference of population structure with Bayesian clustering methods under an explicit population genetics model. In contrast, DAPC does not rely on a particular population genetics model, which makes it useful for a variety of organisms, irrespective of their ploidy and rate of genetic recombination (Jombart et al., 2010). In general, the DAPC analysis divided the population into well-defined clusters based on their genetic structure, ploidy, taxonomy, and their associated provenance of the collected population (Deperi et al., 2018). Similarly, in this study DAPC analysis clearly divided the Triticum accessions according to their species complexity as compared to ADMIXTURE analysis. Several molecular approaches have been used to assess the population structure in the polyploid wheat population (Eltaher et al., 2018; Bhatta et al., 2019; Rufo et al., 2019; Kumar et al., 2020). However, the use of DAPC to evaluate the population structure showed better performance and provided a well-defined genotypic cluster similar to other studies (Deperi et al., 2018).
AMOVA analysis results on the basis of the wheat genotypes indicated a higher genetic variation between (67%) rather than within (33%) clusters. These variations were significant according to the partitioning value (p < 0.001). The possible explanation for high variation between clusters is the inclusion of different wheat genotypes. According to Wright (1978) the pairwise genetic differentiation of six clusters was very high (PhiPT = 0.67). However, a low PhiPT value (0.055) was found between cluster 1 and cluster 2, indicating low genetic differentiation between these genotypes. The possible explanation for low variation between these two clusters could be visualized from T. aestivum and its wild progenitor T. turgidum genotypes presenting in the respective clusters. The largest PhiPT value was observed between clusters 1 (T. aestivum) and 3 (T. monococcum), indicating genetic variability between these two species is the greatest and genetic structure is most different. In the lineage of common wheat, it is well known that the A genome originated from T. urartu. There was no sharing genome between T. monococcum and T. aestivum in the wheat hybridization process from diploid to hexaploid, resulting in distinct genetic variability between these two species. Moreover, the results showed all the T. turgidum subsp. carthlicum accessions were found in the T. aestivum cluster (cluster 1).
Laido et al. (2013) reported very low genetic diversity in the subsp. carthlicum and it was initially classified as a hexaploid species (Bushuk and Kerber, 1978). Similarly, subsp. carthlicum showed a very distinct group from the other tetraploid wheats, such as the subsp. durum, subsp. turgidum, subsp. turanicum, and subsp. polonicum, which is in agreement with the present study. The cluster analysis of hexaploid wheat genotypes showed the subsp. carthlicum was more similar to common wheat than to subsp. dicoccoides (Bushuk and Kerber, 1978; Kuckuck, 1979), which coincides with the present study, as the T. turgidum subspecies (subsp. dicoccoides and subsp. dicoccon) were clustered individually in cluster 4. Meanwhile, the pairwise PhiPT value (0.078) indicates slightly higher variation within the subspecies of T. turgidum (cluster 4/cluster 2) when compared with the two wheat species (0.055) of T. aestivum/T. turgidum (cluster 1/cluster 2). Generally, there are more cultivars and landraces in common and durum wheat, which are used mainly for cultivation and breeding programs. Other T. turgidum subspecies, on the other hand, are not often used. This may be one reason that the genetic diversity of these species is maintained.
The DAPC and ADMIXTURE analysis revealed the absolute population differentiation based on A, B, and D genomes (Table 3 and Figure 1). The clusters were well represented by their genomic information, as the reference genome was available for all the Triticum species and subspecies except T. timopheevii and T. zhukovskyi. Though the T. timopheevii and T. zhukovskyi accessions formed an individual (cluster 5) cluster representing their genomic differences from other species, the present study has some limitation owing to lack of complete genomic information of the G genome. As sequence read alignment to the reference genome is a fundamental step in genomic studies (Alipour et al., 2019), unavailability of the reference genome may hinder the accuracy of biological data. Hence, further studies need to be conducted on these species once the reference genome is made available for the G genome. Although the population genomic analyses can differentiate Triticum species, the resolution was too low to discriminate closely related species or subspecies. Hence, we preferred phylogenetic analysis with different Triticum species.
Triticum Species Discrimination
The first classification of Triticum was made by Linnaeus (1753) based on a number of clearly discernible characters. The presence of different wheat classifications and use of illegitimate species names continue to cause confusion within the wheat research community. Moreover, numerous artificial amphiploids have been produced to obtain new plant species with useful agronomic characters. A rigorous classification of the genus Triticum will be very important not only for understanding its phylogeny, but also for collecting variants to extend the biodiversity (Goncharov, 2002).
Thus, the ultimate aim of this study is to discriminate the Triticum genotypes where efficient molecular markers for species identification are lacking so far. The phylogenetic stratification of this study identified 16 genotypic clusters based on their species and subspecies (Figure 3). In general, the genus Triticum consists of six species with different genomic backgrounds: T. monococcum (AA genome), T. urartu (AA genome), T. turgidum (AABB genome), T. timopheevii (AAGG genome), T. aestivum (AABBDD genome), and T. zhukovskyi (AAAAGG genome). Of these species, T. urartu exists only in its wild form, whereas T. aestivum and T. zhukovskyi exist only as cultivated forms. The other species, T. monococcum, T. turgidum, and T. timopheevii, have both a wild and a domesticated form (Matsuoka, 2011). More interestingly, the phylogenetic tree (Figure 3) clearly indicates the genotypic relationship based on the species’ genomic structure from diploid to polyploid complex.
The diploid AA genome lineages T. monococcum and T. urartu were clustered individually, as the species are believed to have diverged less than 1 million years ago (Huang et al., 2002). In the Bayesian tree, two AA genomes are located at both ends of the phylogeny and T. urartu is found closer to the AABB genome than T. monococcum, which confirms T. urartu was the A genome progenitor of common wheat. Also, T. urartu is closer to T. turgidum subsp. dicoccoides than to other T. turgidum species, suggesting that T. urartu (AA genome) was hybridized with Ae. speltoides Tausch (SS genome) in the initial stage of the wheat hybridization event, resulting in the genesis of wild emmer wheat (T. turgidum subsp. dicoccoides). Similarly, T. aestivum and its wild progenitor T. turgidum genotypes were clustered closer to each other. T. aestivum (AABBDD genome) is thought to have arisen through hybridization of T. turgidum with the wild wheat species Ae. tauschii Coss. (DD genome) (Kihara, 1944; McFadden and Sears, 1944). Conversely, T. timopheevii accessions were clustered separately next to T. urartu as the tetraploid T. timopheevii (AAGG genome) species are believed to have evolved less than 0.5 million years ago through hybridization between T. urartu and a species that belonged to the lineage of the current wild wheat species, Ae. speltoides Tausch (SS genome) (Dvorak and Zhang, 1990; Miyashita et al., 1994; Huang et al., 2002; Kilian et al., 2007). As expected, T. zhukovskyi (AAAAGG genome) accession was clustered together with T. timopheevii (AAGG genome) accessions. T. zhukovskyi originated through hybridization of T. timopheevii with the cultivated einkorn T. monococcum in the Transcaucasus. Our molecular study based on the GBS-derived SNPs demonstrated that the T. timopheevii lineage is closer to the AABB(DD) lineage than the AA genome species on the basis of the B genome tree, in which T. timopheevii was clustered with T. aestivum species before T. urartu, although there is no B genome in both T. timopheevii and T. urartu (Supplementary Figure S2). This result might be due to Ae. speltoides-like (SS genome) species, which is believed as a common progenitor for the B and G genomes of T. turgidum and T. timopheevii, respectively, and these genomes can recombine at a frequency of 30% (Feldman, 1966).
More interestingly, the Triticum subsp. spelta (AABBDD) was clustered in two different positions showing polyphylesis in the Bayesian tree and also in the ML tree of the A and B genomes (Figure 3 and Supplementary Figure S2). There are two controversial scenarios for the origin of European spelt wheat; one is the result of the independent hybridization of tetraploid wheat and Ae. tauschii, and the other is derived from hulled ancestor of bread wheat. Any concept on the origin of spelt wheat, however, could not explain the phylogeny results. In the Bayesian tree, while two Asian spelt wheat accessions from Afghanistan were clustered with the T. aestivum clade, four other European spelt wheat accessions from Spain were clustered together with accessions of T. turgidum subsp. dicoccon. The ML tree of the A and B genomes showed similar results, where Asian and European spelt wheat were polyphyletic, whereas the D genome demonstrated monophylesis, indicating they might have originated from a common ancestor of the D genome. Dvorak et al. (2012) also reported monophylesis of the D genome for all subspecies of T. aestivum including Asian and European spelt wheat. The possible concept for the spelt wheat evolution is shown in Figure 5. T. aestivum subsp. spelta and T. aestivum subsp. aestivum diverged from primitive hexaploid wheat, and then Asian spelt wheat evolved from the ancestral T. aestivum subsp. spelta. Meanwhile European spelt wheat originated by a cross of common wheat (T. aestivum subsp. aestivum) and emmer wheat (T. turgidum subsp. dicoccon), resulting in the diversification of the A and B genomes (Figure 5). The discrepancy of the archaeological record where bread wheat was ahead of spelt wheat (Nesbitt and Samuel, 1996) would also be explained by this concept. Recently, Abrouk et al. (2018) reported the European spelt markedly differed from Asian spelt/bread wheat and various reports suggested the European spelt wheat diverged from bread wheat by hybridization with tetraploid emmer wheat (Blatter et al., 2002, 2004). Several morphological and molecular studies also suggested the polyphyletic nature of European and Asian spelt wheat (Dvorak et al., 2012). Our results have clearly demonstrated the close relationship between European spelt wheat and emmer wheat (T. turgidum subsp. dicoccon) and the polyphyletic nature of spelt wheat, as mentioned in previous reports.
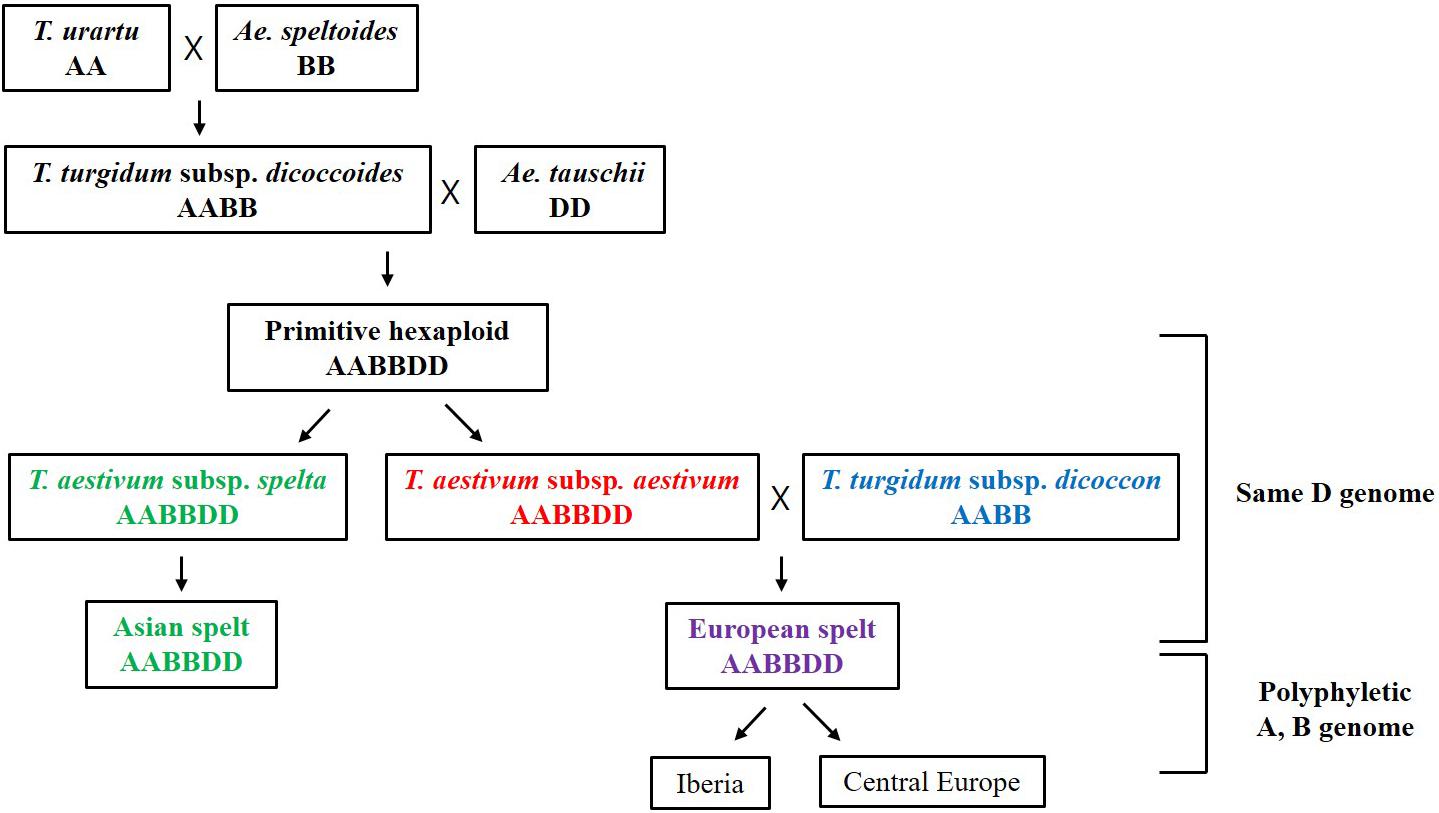
Figure 5. The possible concept for the evolution of spelt wheat complex. The Asian and European spelt wheat are monophyletic in the D genome whereas they are polyphyletic in A and B genome.
The Bayesian phylogenetic tree, however, showed that some durum wheat accessions were clustered with other Triticum species, which could be misclassified or misidentified accessions. Similarly, based on GBS-derived SNPs, T. monococcum and T. urartu accessions were found to be misclassified in the genebank management system, which needs to be considered for further evaluation. Recently, Czajkowska et al. (2019) suggested that GBS is an efficient approach to identify the misclassified accession. Similarly, the present study revealed that clustering genome-wide differences among the group of accessions provides accurate identification of wheat species which have the A, B, D, and G genome set.
Species-Specific Markers for Genebank Management
Various markers from nuclear and chloroplast genomes have been reported for deducing the phylogenetic relationships in wheat species (Hsiao et al., 1995; Gornicki et al., 2014; Awad et al., 2017; Osman and Ramadan, 2019). However, species discrimination with a combination of nuclear- and chloroplast-specific DNA barcodes failed to discriminate T. aestivum and T. turgidum species (Raveendar et al., 2019). Moreover, unfortunately relatively few evolutionary studies have been performed on wheat species discrimination and none of the studies so far reported the efficient identification of wheat genotypes, as all other studies have only reported on genetic diversity in the landrace or cultivars (Alipour et al., 2017; Eltaher et al., 2018; Rimbert et al., 2018; Bhatta et al., 2019; Rufo et al., 2019). In the present study, Bayesian analysis revealed that the polyploid wheat species are divided into groups according to the presence of A, B, D, and G genomes (Figure 3), in which all 17 Triticum species and subspecies could be discriminated. However, the results revealed species and subspecies of common and durum wheat accessions were found to be difficult to distinguish owing to their paraphyletic relationship. Hence species-specific SNP markers need to be developed to discriminate them efficiently.
The allopolyploid wheat species contains two genomes (T. turgidum, AABB) or three genomes (T. aestivum, AABBDD); however, they were reported as very closely related species with only a low level of sequence diversity. It is generally accepted that the synthetic wheat T. aestivum (AABBDD genome) was derived through intergeneric hybridizations that occurred between species of Triticum and Aegilops (Kihara, 1944; McFadden and Sears, 1944). Several types of analysis have provided evidence or insight into the ancestry of the allopolyploid species (Zhang et al., 2002). Phylogenetic reconstruction in the tribe Triticeae was started with analyses of their morphological and anatomical characters (Baum, 1983). Later molecular information was acquired from the genomic and chloroplast region, which has recently provided the basis for phylogenetic reconstruction of Triticum species (Miyashita et al., 1994; Hsiao et al., 1995). However, there were no reports or methods for efficient classification of wheat species and subspecies.
RDA Genebank holds a large number of common/durum wheat accessions and it is very difficult to discriminate each other wheat species. Several SNP arrays have been used to evaluate population structure, genetic variation, selection, and genome-wide association mapping for agronomic traits in wheat (Ganal et al., 2014; Rimbert et al., 2018; You et al., 2018). All these high-throughput arrays contain mainly gene-derived SNPs. In general, multiple copies of genes present in the allohexaploid genomes and interchromosomal duplications were more common (IWGSC, 2014; Glover et al., 2015). Thus, gene-specific genotyping is considered more complicated in wheat than in other diploid species (Ganal et al., 2014). Hence, in this study, we performed GBS for genome-wide SNP analysis to maximize the genome coverage.
DAPC, ADMIXTURE, and phylogenetic analysis revealed the species and subspecies of durum wheat (T. turgidum) genotypes could not be classified efficiently, as they were found closer to common wheat (T. aestivum) accessions. However, in this study, we identified a total of 2,692 species specific SNPs (Supplementary Table S3) that are able to classify common/durum wheat accession at subspecies level (Figure 4 and Supplementary Figure S3). Using chromosomal position, minor allele frequency, and polymorphic information content as selection criteria, Ndjiondjop et al. (2018) recommended a subset of 332 diagnostic SNPs for routine QC genotyping in rice. Similarly, Cavanagh et al. (2013) reported first a large genotyping array through transcriptome sequencing of wheat varieties and accessions, where 6,305 SNP markers were mapped on a set of hexaploid wheat populations collected worldwide. NGS technology is now rapidly becoming the main source for inferring phylogenetic relationships of land plants that hold problematic evolutionary footprints (Lemmon and Lemmon, 2013). Hence, the SNP markers derived from this study based on GBS could be efficient enough to identify the misclassified accession in order to manage the large collection of accessions in genebanks.
Conclusion
In summary, we collected a total of 283 Triticum accessions that were conserved at the RDA Genebank in Korea and performed high-throughput GBS genotyping to explore the utility of SNP markers for efficient management of wheat genotypes. The results showed a high level of genetic variation between 17 Triticum species and subspecies but a very low level of genetic differentiation between the common (T. aestivum) and durum (T. turgidum) wheat species and subspecies, as expected. DAPC and population structure analysis revealed that there are six groups that can be further classified based on their genotypes (17 in total). The Bayesian and maximum likelihood (ML) phylogenetic reconstruction of Triticum species and subspecies showed a highly resolved phylogeny, with more than 50% nodal support. The dendrogram revealed the polyploid wheat species could be divided into groups according to the presence of A, B, D, and G genomes. A total of 2,692 GBS-derived SNPs were able to identify the hexaploid wheat from their wild relatives, which will help with accurate classifications of genebank accession. The study has proved that the GBS is a useful and reliable tool for the identification of high-quality SNPs, which clearly enhanced the phylogenetic resolution of the Triticum species. This study could be a first step toward genome-wide mapping for the identification of SNP markers in plants having complex genomes with numerous species and subspecies. Finally, this study also allowed us to identify a few misclassified accessions from the genebank collection, where the majority of wheat accessions are identified in an individual cluster. Further development of species-specific SNP-based barcodes could be useful for rapid and precise identification of germplasm resources for the wheat breeding program.
Data Availability Statement
The datasets presented in this study can be found in online repositories. The names of the repository/repositories and accession number(s) can be found below: NCBI, Accession number PRJNA601245, https://www.ncbi.nlm.nih.gov/bioproject/PRJNA601245.
Author Contributions
DH conceived and designed the experiments. RS, G-AL, and KL performed the experiments and analyzed the data. M-JS and SK conducted project coordination and analysis. J-RL and G-TC contributed materials. RS and KL drafted the manuscript and figures. DH reviewed and edited the final draft. All authors contributed to the revision of the final manuscript.
Conflict of Interest
The authors declare that the research was conducted in the absence of any commercial or financial relationships that could be construed as a potential conflict of interest.
Acknowledgments
This work was carried out with the support of “Research Program for Agricultural Science & Technology Development” (Project No. PJ01491905), National Institute of Agricultural Sciences, Rural Development Administration, Republic of Korea.
Supplementary Material
The Supplementary Material for this article can be found online at: https://www.frontiersin.org/articles/10.3389/fpls.2020.00688/full#supplementary-material
FIGURE S1 | Total number of SNPs identified from the wheat genomes based on Wheat IWGSC RefSeq v1.0.
FIGURE S2 | Phylogenetic analysis of Triticum species and subspecies based on A, B, and D wheat genome. The ML tree was developed using the Jukes–Cantor model on concatenated SNPs. Numbers next to the branches are the ML bootstrap support values.
FIGURE S3 | Principal coordinate analysis (PCoA) of common and durum wheat, which classified T. turgidum/T. aestivum accession at the species level based on 2,692 SNPs markers. Each node represents the individual cluster.
TABLE S1 | Sampling information and RDA accession numbers of Triticum species.
TABLE S2 | Demultiplexing and Read mapping.
TABLE S3 | The number of species-specific SNPs on each chromosome for discrimination of durum/common wheat species.
Footnotes
- ^ https://basespace.illumina.com
- ^ https://broadinstitute.github.io/picard/
- ^ Available from: http://software.genetics.ucla.edu/admixture/index.html
References
Abrouk, M., Stritt, C., Müller, T., Keller, B., Roulin, A. C., and Krattinger, S. G. (2018). High-throughput genotyping of the spelt gene pool reveals patterns of agricultural history in Europe. bioRxiv [preprint]. doi: 10.1101/481424
Alexander, D. H., Novembre, J., and Lange, K. (2009). Fast model-based estimation of ancestry in unrelated individuals. Genome Res. 19, 1655–1664. doi: 10.1101/gr.094052.109
Alipour, H., Bai, G., Zhang, G., Bihamta, M. R., Mohammadi, V., and Peyghambari, S. A. (2019). Imputation accuracy of wheat genotyping-by-sequencing (GBS) data using barley and wheat genome references. PLoS One 14:e0208614. doi: 10.1371/journal.pone.0208614
Alipour, H., Bihamta, M. R., Mohammadi, V., Peyghambari, S. A., Bai, G., and Zhang, G. (2017). Genotyping-by-sequencing (GBS) revealed molecular genetic diversity of iranian wheat landraces and cultivars. Front. Plant Sci. 8:1293. doi: 10.3389/fpls.2017.01293
Allen, A. M., Barker, G. L., Wilkinson, P., Burridge, A., Winfield, M., Coghill, J., et al. (2013). Discovery and development of exome-based, co-dominant single nucleotide polymorphism markers in hexaploid wheat (Triticum aestivum L.). Plant Biotechnol. J. 11, 279–295. doi: 10.1111/pbi.12009
Andrews, S. (2010). FastQC: A Quality Control Tool for High Throughput Sequence Data. Available online at: http://www.bioinformatics.babraham.ac.uk/projects/fastqc (accessed October 29, 2018).
Awad, M., Fahmy, R. M., Mosa, K. A., Helmy, M., and El-Feky, F. A. (2017). Identification of effective DNA barcodes for Triticum plants through chloroplast genome-wide analysis. Comput. Biol. Chem. 71, 20–31. doi: 10.1016/j.compbiolchem.2017.09.003
Bajaj, D., Das, S., Badoni, S., Kumar, V., Singh, M., Bansal, K. C., et al. (2015). Genome-wide high-throughput SNP discovery and genotyping for understanding natural (functional) allelic diversity and domestication patterns in wild chickpea. Sci. Rep. 5:12468.
Balasaravanan, T., Chezhian, P., Kamalakannan, R., Yasodha, R., Varghese, M., Gurumurthi, K., et al. (2006). Identification of species-diagnostic ISSR markers for six eucalyptus species. Silvae Genet. 55, 119–122. doi: 10.1515/sg-2006-0017
Baum, B. R. (1983). phylogenetic analysis of the tribe Triticeae (Poaceae) based on morphological characters of the genera. Can. J. Bot. 61, 518–535. doi: 10.1139/b83-059
Beissinger, T. M., Hirsch, C. N., Sekhon, R. S., Foerster, J. M., Johnson, J. M., Muttoni, G., et al. (2013). Marker density and read depth for genotyping populations using genotyping-by-sequencing. Genetics 193, 1073–1081. doi: 10.1534/genetics.112.147710
Bhatta, M., Shamanin, V., Shepelev, S., Baenziger, P. S., Pozherukova, V., Pototskaya, I., et al. (2019). Genetic diversity and population structure analysis of synthetic and bread wheat accessions in Western Siberia. J. Appl. Genet. 60, 283–289. doi: 10.1007/s13353-019-00514-x
Blanca, G., Cueto, M., and Fuentes, J. (2017). Linaria becerrae (Plantaginaceae), a new endemic species from the southern Spain, and remarks on what Linaria salzmannii is and is not. Phytotaxa 298, 261–268.
Blatter, R., Jacomet, S., and Schlumbaum, A. (2002). Spelt-specific alleles in HMW glutenin genes from modern and historical European spelt (Triticum spelta L.). Theor. Appl. Genet. 104, 329–337. doi: 10.1007/s001220100680
Blatter, R. H. E., Jacomet, S., and Schlumbaum, A. (2004). About the origin of European spelt (Triticum spelta L.): allelic differentiation of the HMW Glutenin B1-1 and A1-2 subunit genes. Theor. Appl. Genet. 108, 360–367. doi: 10.1007/s00122-003-1441-7
Blattner, F. R. (2004). Phylogenetic analysis of Hordeum (Poaceae) as inferred by nuclear rDNA ITS sequences. Mol. Phylogenet. Evol. 33, 289–299. doi: 10.1016/j.ympev.2004.05.012
Bushuk, W., and Kerber, E. R. (1978). The role of Triticum carthlicum in the origin of bread wheat based on gliadin electrophorograms. Can. J. Plant Sci. 58, 1019–1024. doi: 10.4141/cjps78-155
Catchen, J., Hohenlohe, P. A., Bassham, S., Amores, A., and Cresko, W. A. (2013). Stacks: an analysis tool set for population genomics. Mol. Ecol. 22, 3124–3140. doi: 10.1111/mec.12354
Cavanagh, C. R., Chao, S., Wang, S., Huang, B. E., Stephen, S., Kiani, S., et al. (2013). Genome-wide comparative diversity uncovers multiple targets of selection for improvement in hexaploid wheat landraces and cultivars. Proc. Natl. Acad. Sci. U.S.A. 110, 8057–8062. doi: 10.1073/pnas.1217133110
Chen, J., Zavala, C., Ortega, N., Petroli, C., Franco, J., Burgueño, J., et al. (2016). The development of quality control genotyping approaches: a case study using elite maize lines. PLoS ONE 11:e0157236. doi: 10.1371/journal.pone.0157236
Corander, J., Marttinen, P., Sirén, J., and Tang, J. (2008). Enhanced Bayesian modelling in BAPS software for learning genetic structures of populations. BMC Bioinformatics 9:539. doi: 10.1186/1471-2105-9-539
Cullingham, C. I., Cooke, J. E. K., Dang, S., and Coltman, D. W. (2013). A species-diagnostic SNP panel for discriminating lodgepole pine, jack pine, and their interspecific hybrids. Tree Genet. Genomes 9, 1119–1127. doi: 10.1007/s11295-013-0608-x
Curk, F., Ancillo, G., Ollitrault, F., Perrier, X., Jacquemoud-Collet, J.-P., Garcia-Lor, A., et al. (2015). Nuclear species-diagnostic SNP markers mined from 454 amplicon sequencing reveal admixture genomic structure of modern citrus varieties. PLoS One 10:e0125628. doi: 10.1371/journal.pone.0125628
Czajkowska, B. I., Oliveira, H. R., and Brown, T. A. (2019). A discriminatory test for the wheat B and G genomes reveals misclassified accessions of Triticum timopheevii and Triticum turgidum. PLoS One 14:e0215175. doi: 10.1371/journal.pone.0215175
Danecek, P., Auton, A., Abecasis, G., Albers, C. A., Banks, E., Depristo, M. A., et al. (2011). The variant call format and VCFtools. Bioinformatics 27, 2156–2158. doi: 10.1093/bioinformatics/btr330
De Donato, M., Peters, S. O., Mitchell, S. E., Hussain, T., and Imumorin, I. G. (2013). Genotyping-by-sequencing (GBS): a novel, efficient and cost-effective genotyping method for cattle using next-generation sequencing. PLoS ONE 8:e62137. doi: 10.1371/journal.pone.0062137
Deperi, S. I., Tagliotti, M. E., Bedogni, M. C., Manrique-Carpintero, N. C., Coombs, J., Zhang, R., et al. (2018). Discriminant analysis of principal components and pedigree assessment of genetic diversity and population structure in a tetraploid potato panel using SNPs. PLoS One 13:e0194398. doi: 10.1371/journal.pone.0194398
Doi, K., Kaga, A., Tomooka, N., and Vaughan, D. A. (2002). Molecular phylogeny of genus Vigna subgenus Ceratotropis based on rDNA ITS and atpB-rbcL intergenic spacer of cpDNA sequences. Genetica 114, 129–145.
Dubcovsky, J., and Dvorak, J. (2007). Genome plasticity a key factor in the success of polyploid wheat under domestication. Science 316, 1862–1866. doi: 10.1126/science.1143986
Dvorak, J., Deal, K. R., Luo, M. C., You, F. M., von Borstel, K., and Dehghani, H. (2012). The origin of spelt and free-threshing hexaploid wheat. J. Hered. 103, 426–441. doi: 10.1093/jhered/esr152
Dvorak, J., and Zhang, H. B. (1990). Variation in repeated nucleotide sequences sheds light on the phylogeny of the wheat B and G genomes. Proc. Natl. Acad. Sci. U.S.A. 87, 9640–9644. doi: 10.1073/pnas.87.24.9640
Edet, O. U., Gorafi, Y. S. A., Nasuda, S., and Tsujimoto, H. (2018). DArTseq-based analysis of genomic relationships among species of tribe Triticeae. Sci. Rep. 8, 16397–16397.
Elbasyoni, I. S., Lorenz, A. J., Guttieri, M., Frels, K., Baenziger, P. S., Poland, J., et al. (2018). A comparison between genotyping-by-sequencing and array-based scoring of SNPs for genomic prediction accuracy in winter wheat. Plant Sci. 270, 123–130. doi: 10.1016/j.plantsci.2018.02.019
Elshire, R. J., Glaubitz, J. C., Sun, Q., Poland, J. A., Kawamoto, K., Buckler, E. S., et al. (2011). A robust, simple genotyping-by-sequencing (GBS) approach for high diversity species. PLoS One 6:e19379. doi: 10.1371/journal.pone.0019379
Eltaher, S., Sallam, A., Belamkar, V., Emara, H. A., Nower, A. A., Salem, K. F. M., et al. (2018). Genetic diversity and population structure of F3:6 nebraska winter wheat genotypes using genotyping-by-sequencing. Front. Genet. 9:76. doi: 10.3389/fgene.2018.00076
Ertiro, B. T., Ogugo, V., Worku, M., Das, B., Olsen, M., Labuschagne, M., et al. (2015). Comparison of Kompetitive Allele Specific PCR (KASP) and genotyping by sequencing (GBS) for quality control analysis in maize. BMC Genomics 16:908. doi: 10.1186/s12864-015-2180-2
Excoffier, L., Smouse, P. E., and Quattro, J. M. (1992). Analysis of molecular variance inferred from metric distances among DNA haplotypes: application to human mitochondrial DNA restriction data. Genetics 131, 479–491.
Falush, D., Stephens, M., and Pritchard, J. K. (2003). Inference of population structure using multilocus genotype data: linked loci and correlated allele frequencies. Genetics 164, 1567–1587.
FAO (2010). The Second Report on the State of the World’s Plant Genetic Resources for Food and Agriculture. Rome: FAO.
Feldman, M. (1966). The effect of chromosomes 5B, 5D, and 5A on chromosomal pairing in Triticum aestivum. Proc. Natl. Acad. Sci. U.S.A. 55, 1447–1453. doi: 10.1073/pnas.55.6.1447
Feldman, M. (1995). “Wheats,” in Evolution of Crop Plants, eds J. Smartt and N. W. Simmonds (Harlow: Longman Scientific and Technical), 185–192.
Frey, J. E., Guillén, L., Frey, B., Samietz, J., Rull, J., and Aluja, M. (2013). Developing diagnostic SNP panels for the identification of true fruit flies (Diptera: Tephritidae) within the limits of COI-based species delimitation. BMC Evol. Biol. 13:106. doi: 10.1186/1471-2148-13-106
Ganal, M. W., Wieseke, R., Luerssen, H., Durstewitz, G., Graner, E.-M., Plieske, J., et al. (2014). “High-throughput SNP profiling of genetic resources in crop plants using genotyping arrays,” in Genomics of Plant Genetic Resources: Volume 1. Managing, sequencing and mining genetic resources, eds R. Tuberosa, A. Graner, and E. Frison (Dordrecht: Springer), 113–130. doi: 10.1007/978-94-007-7572-5_6
Gill, B. S., and Friebe, B. (2002). “Cytogenetics, phylogeny and evolution of cultivated wheats,” in Bread Wheat: Improvement and Production, eds B. C. Curtis, S. Rajaram, and H. Gomez Macpherson (Rome: FAO), 71–88.
Girma, G., Korie, S., Dumet, D., and Franco, J. (2012). Improvement of accession distinctiveness as an added value to the global worth of the yam (dioscorea spp) genebank. Int. J. Conserv. Sci. 3, 199–206.
Glover, N. M., Daron, J., Pingault, L., Vandepoele, K., Paux, E., Feuillet, C., et al. (2015). Small-scale gene duplications played a major role in the recent evolution of wheat chromosome 3B. Genome Biol. 16:188.
Goncharov, N. P. (2002). Comparative Genetics of Wheats and their Related Species. Novosibirsk: Siberian Branch Press.
Gornicki, P., Zhu, H., Wang, J., Challa, G. S., Zhang, Z., Gill, B. S., et al. (2014). The chloroplast view of the evolution of polyploid wheat. New Phytol. 204, 704–714. doi: 10.1111/nph.12931
Gregory, T. R. (2005). DNA barcoding does not compete with taxonomy. Nature 434, 1067–1067. doi: 10.1038/4341067b
Hsiao, C., Chatterton, N. J., Asay, K. H., and Jensen, K. B. (1995). Phylogenetic relationships of the monogenomic species of the wheat tribe, Triticeae (Poaceae), inferred from nuclear rDNA (internal transcribed spacer) sequences. Genome 38, 211–223. doi: 10.1139/g95-026
Huang, S., Sirikhachornkit, A., Su, X., Faris, J., Gill, B., Haselkorn, R., et al. (2002). Genes encoding plastid acetyl-CoA carboxylase and 3-phosphoglycerate kinase of the Triticum/Aegilops complex and the evolutionary history of polyploid wheat. Proc. Natl. Acad. Sci. U.S.A. 99, 8133–8138. doi: 10.1073/pnas.072223799
Iehisa, J. C., Shimizu, A., Sato, K., Nishijima, R., Sakaguchi, K., Matsuda, R., et al. (2014). Genome-wide marker development for the wheat D genome based on single nucleotide polymorphisms identified from transcripts in the wild wheat progenitor Aegilops tauschii. Theor. Appl. Genet. 127, 261–271. doi: 10.1007/s00122-013-2215-5
IWGSC (2014). A chromosome-based draft sequence of the hexaploid bread wheat (Triticum aestivum) genome. Science 345:1251788.
Jaaska, V. (2005). Isozyme variation and phylogenetic relationships in Vicia subgenus Cracca (Fabaceae). Ann. Bot. 96, 1085–1096. doi: 10.1093/aob/mci260
Jombart, T. (2008). adegenet: a R package for the multivariate analysis of genetic markers. Bioinformatics 24, 1403–1405. doi: 10.1093/bioinformatics/btn129
Jombart, T., Devillard, S., and Balloux, F. (2010). Discriminant analysis of principal components: a new method for the analysis of genetically structured populations. BMC Genet. 11:94. doi: 10.1186/1471-2156-11-94
Khan, M. K., Pandey, A., Choudhary, S., Hakki, E. E., Akkaya, M. S., and Thomas, G. (2014). From RFLP to DArT: molecular tools for wheat (Triticum spp.) diversity analysis. Genet. Resour. Crop Evol. 61, 1001–1032. doi: 10.1007/s10722-014-0114-5
Kihara, H. (1944). Discovery of the DD-analyser, one of the ancestors of Triticum vulgare (abstract) (in Japanese). Agric. Hortic. 19, 889–890.
Kilian, B., Ozkan, H., Deusch, O., Effgen, S., Brandolini, A., Kohl, J., et al. (2007). Independent wheat B and G genome origins in outcrossing Aegilops progenitor haplotypes. Mol. Biol. Evol. 24, 217–227. doi: 10.1093/molbev/msl151
Kuckuck, H. (1979). On the origin of Triticum carthlicum Neyski (=Triticum persicum Vav.). Wheat Inf. Serv. 50, 1–5.
Kumar, D., Chhokar, V., Sheoran, S., Singh, R., Sharma, P., Jaiswal, S., et al. (2020). Characterization of genetic diversity and population structure in wheat using array based SNP markers. Mol. Biol. Rep. 47, 293–306. doi: 10.1007/s11033-019-05132-8
Lai, K., Lorenc, M. T., Lee, H. C., Berkman, P. J., Bayer, P. E., Visendi, P., et al. (2015). Identification and characterization of more than 4 million intervarietal SNPs across the group 7 chromosomes of bread wheat. Plant Biotechnol. J. 13, 97–104. doi: 10.1111/pbi.12240
Laido, G., Mangini, G., Taranto, F., Gadaleta, A., and Blanco, A. (2013). Genetic diversity and population structure of tetraploid wheats (Triticum turgidum L.) estimated by SSR, DArT and pedigree data. PLoS One 8:e67280. doi: 10.1371/journal.pone.0067280
Landjeva, S., Korzun, V., and Börner, A. (2007). Molecular markers: actual and potential contributions to wheat genome characterization and breeding. Euphytica 156, 271–296. doi: 10.1007/s10681-007-9371-0
Langmead, B., and Salzberg, S. L. (2012). Fast gapped-read alignment with Bowtie 2. Nat. Methods 9, 357–359. doi: 10.1038/nmeth.1923
Lee, K. J., Lee, J.-R., Sebastin, R., Shin, M.-J., Kim, S.-H., Cho, G.-T., et al. (2019). Genetic diversity assessed by genotyping by sequencing (GBS) in watermelon germplasm. Genes 10:822. doi: 10.3390/genes10100822
Lemmon, E. M., and Lemmon, A. R. (2013). High-throughput genomic data in systematics and phylogenetics. Annu. Rev. Ecol. Evol. Syst. 44, 99–121. doi: 10.1146/annurev-ecolsys-110512-135822
Li, Y., Feng, Y., Wang, X.-Y., Liu, B., and Lv, G.-H. (2014). Failure of DNA barcoding in discriminating Calligonum species. Nord. J. Bot. 32, 511–517.
Linnaeus, C. (1753). Species Plantarum, Exhibentes Plantas Rite Cognitas, ad Genera Relatas, cum Differentiis Specificus, Nominibus Trivialibus, Synonymis Selectis, Locis Natalibus, Secundum Systema Sexuale Digestas. T. 1. Holmiae: Impensis Laurentii Salvii.
Lu, F., Romay, M. C., Glaubitz, J. C., Bradbury, P. J., Elshire, R. J., Wang, T., et al. (2015). High-resolution genetic mapping of maize pan-genome sequence anchors. Nat. Commun. 6:6914.
Martin, M. (2011). Cutadapt removes adapter sequences from high-throughput sequencing reads. EMBnet J. 17, 10–12.
Mason, A. S., Zhang, J., Tollenaere, R., Vasquez Teuber, P., Dalton-Morgan, J., Hu, L., et al. (2015). High-throughput genotyping for species identification and diversity assessment in germplasm collections. Mol. Ecol. Res. 15, 1091–1101. doi: 10.1111/1755-0998.12379
Matsuoka, Y. (2011). Evolution of polyploid triticum wheats under cultivation: the role of domestication, natural hybridization and allopolyploid speciation in their diversification. Plant Cell Physiol. 52, 750–764. doi: 10.1093/pcp/pcr018
McFadden, E. S., and Sears, E. R. (1944). The artificial synthesis of Triticum spelta. Rec. Genet. Soc. Am. 13, 26–27.
McKenna, A., Hanna, M., Banks, E., Sivachenko, A., Cibulskis, K., Kernytsky, A., et al. (2010). The Genome Analysis Toolkit: a MapReduce framework for analyzing next-generation DNA sequencing data. Genome Res. 20, 1297–1303. doi: 10.1101/gr.107524.110
Miyashita, N. T., Mori, N., and Tsunewaki, K. (1994). Molecular variation in chloroplast DNA regions in ancestral species of wheat. Genetics 137, 883–889.
Ndjiondjop, M. N., Semagn, K., Zhang, J., Gouda, A. C., Kpeki, S. B., Goungoulou, A., et al. (2018). Development of species diagnostic SNP markers for quality control genotyping in four rice (Oryza L.) species. Mol. Breed. 38:131.
Nesbitt, M., and Samuel, D. (1996). “From stable crop to extinction? The archaeology and history of the hulled wheats,” in Hulled Wheats. Proceedings of the 1st International Workshop on Hulled Wheats, eds S. Padulosi, K. Hammer, and J. Heller (Itali: Castelvecchio Pascoli), 41–100.
Orjuela, J., Sabot, F., Chéron, S., Vigouroux, Y., Adam, H., Chrestin, H., et al. (2014). An extensive analysis of the African rice genetic diversity through a global genotyping. Theor. Appl. Genet. 127, 2211–2223. doi: 10.1007/s00122-014-2374-z
Osman, S. A., and Ramadan, W. A. (2019). DNA barcoding of different Triticum species. Bull. Natl. Res. Centre 43:174.
Parida, S. K., Mukerji, M., Singh, A. K., Singh, N. K., and Mohapatra, T. (2012). SNPs in stress-responsive rice genes: validation, genotyping, functional relevance and population structure. BMC Genomics 13:426. doi: 10.1186/1471-2164-13-426
Philippe, H., Snell, E. A., Bapteste, E., Lopez, P., Holland, P. W. H., and Casane, D. (2004). Phylogenomics of eukaryotes: impact of missing data on large alignments. Mol. Biol. Evol. 21, 1740–1752. doi: 10.1093/molbev/msh182
Poland, J. A., Brown, P. J., Sorrells, M. E., and Jannink, J.-L. (2012). Development of high-density genetic maps for barley and wheat using a novel two-enzyme genotyping-by-sequencing approach. PLoS One 7:e32253. doi: 10.1371/journal.pone.0032253
Pritchard, J. K., Stephens, M., and Donnelly, P. (2000). Inference of population structure using multilocus genotype data. Genetics 155, 945–959.
Purcell, S., Neale, B., Todd-Brown, K., Thomas, L., Ferreira, M. A. R., Bender, D., et al. (2007). PLINK: a tool set for whole-genome association and population-based linkage analyses. Am. J. Hum. Genet. 81, 559–575. doi: 10.1086/519795
R core Team (2014). R: A language and environment for statistical computing. Vienna: R Foundation for statistical computing. Available online at: https://www.R-project.org/.
Raveendar, S., Lee, G.-A., Lee, K. J., Shin, M.-J., Kim, S. H., Lee, J.-R., et al. (2019). DNA barcoding for efficient identification of Triticum subspecies: evaluation of four candidate loci on phylogenetic relationships. Plant Breed. Biotech. 7, 220–228. doi: 10.9787/pbb.2019.7.3.220
Rimbert, H., Darrier, B., Navarro, J., Kitt, J., Choulet, F., Leveugle, M., et al. (2018). High throughput SNP discovery and genotyping in hexaploid wheat. PLoS One 13:e0186329. doi: 10.1371/journal.pone.0186329
Rodrigues, R., Veiga, I., Marreiros, A., Rocha, F., and Leitão, J. (2014). Correction of the misclassification of species in the Portuguese collection of Cucurbita pepo L. using DNA markers. Plant Genet. Resour. 12, S160–S163.
Ronquist, F., Teslenko, M., Van Der Mark, P., Ayres, D. L., Darling, A., Höhna, S., et al. (2012). MrBayes 3.2: efficient Bayesian phylogenetic inference and model choice across a large model space. Syst. Biol. 61, 539–542. doi: 10.1093/sysbio/sys029
Rufo, R., Alvaro, F., Royo, C., and Soriano, J. M. (2019). From landraces to improved cultivars: assessment of genetic diversity and population structure of Mediterranean wheat using SNP markers. PLoS One 14:e0219867. doi: 10.1371/journal.pone.0219867
Schurz, H., Müller, S. J., Van Helden, P. D., Tromp, G., Hoal, E. G., Kinnear, C. J., et al. (2019). Evaluating the accuracy of imputation methods in a five-way admixed population. Front. Genet. 10:34. doi: 10.3389/fgene.2019.00034
Semagn, K., Beyene, Y., Makumbi, D., Mugo, S., Prasanna, B. M., Magorokosho, C., et al. (2012). Quality control genotyping for assessment of genetic identity and purity in diverse tropical maize inbred lines. Theor. Appl. Genet. 125, 1487–1501. doi: 10.1007/s00122-012-1928-1
Simmons, M. P., Pickett, K. M., and Miya, M. (2004). How meaningful are Bayesian support values? Mol. Biol. Evol. 21, 188–199. doi: 10.1093/molbev/msh014
Stallman, J. K., Funk, V. A., Price, J. P., and Knope, M. L. (2019). DNA barcodes fail to accurately differentiate species in Hawaiian plant lineages. Bot. J. Linn. Soc. 190, 374–388. doi: 10.1093/botlinnean/boz024
Swofford, D. L. (2002). PAUP/: Phylogenetic Analysis Using Parsimony (∗and OtherMethods). Sunderland, MA: Sinauer Associates.
Tamura, K., Stecher, G., Peterson, D., Filipski, A., and Kumar, S. (2013). MEGA6: molecular evolutionary genetics analysis version 6.0. Mol. Biol. Evol. 30, 2725–2729. doi: 10.1093/molbev/mst197
Tello-Ruiz, M. K., Naithani, S., Stein, J. C., Gupta, P., Campbell, M., Olson, A., et al. (2018). Gramene 2018: unifying comparative genomics and pathway resources for plant research. Nucleic Acids Res. 46, D1181–D1189.
van Velzen, R., Weitschek, E., Felici, G., and Bakker, F. T. (2012). DNA barcoding of recently diverged species: relative performance of matching methods. PLoS One 7:e30490. doi: 10.1371/journal.pone.0030490
Wong, M. M., Gujaria-Verma, N., Ramsay, L., Yuan, H. Y., Caron, C., Diapari, M., et al. (2015). Classification and characterization of species within the genus lens using genotyping-by-sequencing (GBS). PLoS One 10:e0122025. doi: 10.1371/journal.pone.0122025
Wright, S. (1978). Evolution and the Enetics of Opulations. In Variability Within and Among Natural Populations. Chicago, IL: University of Chicago Press.
Xi, Z., Liu, L., and Davis, C. C. (2015). The impact of missing data on species tree estimation. Mol. Biol. Evol. 33, 838–860. doi: 10.1093/molbev/msv266
Yang, J., Lee, S. H., Goddard, M. E., and Visscher, P. M. (2011). GCTA: a tool for genome-wide complex trait analysis. Am. J. Hum. Genet. 88, 76–82. doi: 10.1016/j.ajhg.2010.11.011
You, F., Huo, N., Deal, K., Gu, Y., Luo, M.-C., Mcguire, P., et al. (2011). Annotation-based genome-wide SNP discovery in the large and complex Aegilops tauschii genome using next-generation sequencing without a reference genome sequence. BMC Genomics 12:59. doi: 10.1186/1471-2164-12-59
You, Q., Yang, X., Peng, Z., Xu, L., and Wang, J. (2018). Development and applications of a high throughput genotyping tool for polyploid crops: single nucleotide polymorphism (SNP) array. Front. Plant Sci. 9:104. doi: 10.3389/fpls.2018.00104
Keywords: genebank, genotyping-by-sequencing, phylogenetic analysis, species discrimination, spelt wheat, Triticum, wheat
Citation: Hyun DY, Sebastin R, Lee KJ, Lee G-A, Shin M-J, Kim SH, Lee J-R and Cho G-T (2020) Genotyping-by-Sequencing Derived Single Nucleotide Polymorphisms Provide the First Well-Resolved Phylogeny for the Genus Triticum (Poaceae). Front. Plant Sci. 11:688. doi: 10.3389/fpls.2020.00688
Received: 10 January 2020; Accepted: 30 April 2020;
Published: 17 June 2020.
Edited by:
Tingshuang Yi, Chinese Academy of Sciences, ChinaReviewed by:
Antonio Blanco, University of Bari Aldo Moro, ItalyEric Wade Linton, Central Michigan University, United States
Anna Maria Mastrangelo, Council for Agricultural and Economics Research (CREA), Italy
Copyright © 2020 Hyun, Sebastin, Lee, Lee, Shin, Kim, Lee and Cho. This is an open-access article distributed under the terms of the Creative Commons Attribution License (CC BY). The use, distribution or reproduction in other forums is permitted, provided the original author(s) and the copyright owner(s) are credited and that the original publication in this journal is cited, in accordance with accepted academic practice. No use, distribution or reproduction is permitted which does not comply with these terms.
*Correspondence: Do Yoon Hyun, ZHloeXVuQGtvcmVhLmty
†These authors have contributed equally to this work