 Anrong Luo1
 Shaozhong Kang
- 1Center for Agricultural Water Research in China, China Agricultural University, Beijing, China
- 2UR 1115 Plantes et Systèmes de Culture Horticoles, INRA, Avignon, France
- 3UMR 1287 EGFV, Bordeaux Sciences Agro, INRA, Université de Bordeaux, ISVV, Villenave d’Ornon, France
Carbohydrate concentrations in fruit are closely related to the availability of water and mineral nutrients. Water stress and minerals alter the assimilation, operation, and distribution of carbohydrates, thereby affecting the fruit quality. The SUGAR model was used to investigate the carbon balance in tomato fruit during different growth stages when available water was varied and potassium added. Further, we quantitatively studied the distribution of photoassimilates such as structural carbohydrates, soluble sugars, and starch in fruit and evaluated their response to water and potassium supply. The results revealed that the carbon allocation and transformation dynamically changed during the all growth stages; in fact, variation in carbon content showed similar trends for different water along with potassium treatments, carbon allocation during the early development stages was mainly to starch and structural carbon compounds. The relative rate of carbon conversion of soluble sugars to structural carbon compounds (k3) and of soluble sugars to starch (k5m) peaked during the initial stage and then dropped during fruit growth and development stages. Carbon was primarily allocated as soluble sugars and starch was converted to soluble sugars at fruit maturation. k3(t) and k5m(t) approached zero at the end of the growth stage, mainly due to sugar accumulation. Potassium application can significantly raise carbon flows imported (Csupply) from the phloem into the fruit and thus increased carbon allocation to soluble sugars over the entire growth period. Potassium addition during the fruit maturation stage decreased the content of starch and other carbon compounds. Water deficit regulated carbon allocation and increased soluble sugar content but reduced structural carbon content, thereby improving fruit quality.
Introduction
The quality of agricultural products is an important indicator of evaluating water-saving and efficient agricultural production (Boyd and Barnett, 2011). Carbohydrates formed by photosynthesis play a vital role in fruit production since they are not only the raw materials for fruit growth but also the major determinants of fruit quality (Georgelis et al., 2004; Keller et al., 2008). Furthermore, carbohydrates formed by photosynthesis are closely related to the most basic physiological metabolism of plants, i.e., carbon metabolism (Winter and Huber, 2000). Water and mineral nutrients are important factors affecting fruit carbon metabolism (Buttery et al., 1998). Water stress has been found to be beneficial to the accumulation of hexose, which improves fruit quality (Praxedes et al., 2006). As the element with the largest total absorption into tomatoes, potassium has a wide impact on sugar metabolism in fruits. Fruit soluble sugar content is positively correlated with soil potassium, so increasing the supply of potassium increases sugar accumulation (Zushi and Matsuzoe, 1998); also, potassium is beneficial for increasing the dry matter content and improving fruit quality under drought stress (Manzoor et al., 2018). Potassium can also enhance the transport efficiency of photosynthetic products and thus increase soluble sugar content, thereby upgrading fruit quality (Almeselmani et al., 2009). Interaction between water and potassium promotes sugar accumulation in fruits and so increases fruit sweetness (Feng et al., 2017). Most studies have analyzed the combined effects of water along with potassium on various quality indicators, but there has been little research into how water and potassium together affect carbon allocation and conversion of photoassimilates.
Based on the fruit carbon balance, in 1996, Génard and Souty at French INRA, developed a dynamic simulation of fruit sugar, i.e., the SUGAR model, by considering the physiological mechanisms and the characteristics of fruit sugar metabolism. SUGAR was initially used to describe carbohydrate metabolism by modeling the processes that created and distributed sugar in peach fruit (Génard and Souty, 1996). SUGAR parameters were subsequently modified by Génard to quantitively distinguish the effects of the three physiological processes of assimilate import, sugar metabolism, and water dilution of the sugar content in peach fruit (Génard et al., 2003).
The SUGAR model has been improved since its inception, especially in the areas of estimating sugar content and quantitively modeling carbon allocation in fruit. Dai et al. (2009) used SUGAR to analyze variation in sugar accumulation in response to changes in the source–sink ratio and differences in water supply in grapes. Prudent et al. (2011) used SUGAR with quantitative trait locus analysis (QTL) to identify the basic processes that determined fruit sugar concentration in tomatoes. Wu et al. (2012) also screened a variety of high glucose-to-fructose ratios by the SUGAR model. Dai et al. (2016) identified factors that affect fruit size by investigating the effects of various carbon conversion coefficients.
SUGAR is a widely used model. There have been few studies of the effects of water and mineral nutrients on carbon metabolism. In this study, we analyzed and compared the effects of water and potassium supply on carbon conversion and photoassimilate allocation in tomato fruit. The conclusions of this study provide a theoretical basis for subsequent research into sugar accumulation and improved fruit quality.
Materials and Methods
Plant Materials and Growth Conditions
The experiments were conducted in a greenhouse at the Shiyanghe Experimental Station, Gansu Province, Northwest China, from April to August 2017. The greenhouse, 76 × 8 m, was a steel frame construction covered with 0.2 mm thick polyethylene. There was no artificial heating or cooling. A ventilation system on the roof controlled the interior daytime temperature in summer. An indeterminate pink tomato (Lycopersicon esculentum Miller cv. Jinpeng 11), which is a commonly planted tomato cultivar in local agriculture, was grown. The temperature of the Shiyanghe experimental station site (37°52′N, 102°50′E, 1581 m elevation) was in the range 14.8–29.1°C from April to August. Precipitation over the period was 164.4 mm, pan evaporation was 2000 mm, and sunshine duration was 3000 h.
At the third to fourth leaf stage, the seedlings were transplanted into plastic containers (top diameter 33 cm, bottom diameter 25 cm, depth 28 cm). Cheesecloth and 1 kg of small gravel were packed at the bottom of each container to prevent soil loss, and the containers were filled with 17 kg of air-dried sandy loam soil (<5 mm) with bulk density 1.3 ± 0.5 g/cm3. Volumetric field capacity was 0.25 (cm3/cm3). Each container was buried up to its top edge in the ground to maintain a soil temperature similar to that in the surrounding field. The soil surface of each container was covered with white polyethylene film to prevent soil water evaporation. The tomato plants were transplanted on 2017-04-26 and harvested on 2017-08-15. The entire growth period, lasting for 111 days, was divided into four growth stages: the vegetative growth stage (2017-04-26–2017-05-13), the flowering and fruit-bearing stage (2017-05-14–2017-06-15), the fruit-swelling stage (2017-06-16–2017-07-13), and the fruit maturation stage (2017-07-14–2017-08-15).
The 240 tomato plants were divided into four groups for the experiment, one control group and three treatment groups, each consisting of 60 plants. The plants in each group were arranged in six north–south rows of ten plants. The plants in each group were given a water treatment and a potassium treatment.
The plants in the control group CK were well-watered in each of the three growth stages. The plants in each of the other three groups Ti, i = 1,2,3, were well-watered in two of the three growth stages; in one stage, different for each group, they were subjected to deficit irrigation. Group T1 was given half the sufficient water amount in the flowering and fruit-bearing stage (Stage I, 2017-05-14–2017-06-15), group T2 was given half the sufficient water amount in the fruit-swelling stage (Stage II, 2017-06-16–2017-07-13), and group T3 was given half the sufficient water amount in the fruit maturation stage (Stage III, 2017-07-14–2017-08-15).
In each group, three alternate rows were given a potassium treatment as follows. On 2017-06-01 and 2017-06-05, during the flowering and fruit-bearing Stage I, an amount of potassium was applied to each of the 30 selected pots. The amount of potassium to be applied for optimum fruit development was determined from previous literature to be 0.46 g/kg (K2O:soil) per application (Han et al., 2012; Feng et al., 2017). Thus the entire K2O application per plant was 15.64 g, and half the plants (30 plants/group, 120 altogether) received this amount of potassium in total. Plants in the control group that were treated with potassium were identified as CKK and plants in the treatment group Ti that were treated with potassium were identified as TiK.
The details of the experimental site and layout of the greenhouse are shown in (Supplementary Figure 1).
Test Items and Methods
Irrigation Amount
A 5TE sensor (Decagon Devices, Inc., United States) was installed at 15 cm depth in three randomly selected containers in every treatment to measure soil water content (SWC; cm3/cm3). The data were collected every 30 min by an EM50 data logger (Decagon Devices, Inc., United States). The sensors were calibrated gravimetrically using sensor-measured data for volumetric water content. When the water content in the containers decreased to 70% of field capacity θf (Agbenin and Tiessen, 1995), which was determined using the cutting ring method (Hu et al., 2011), irrigation was about 95% of field capacity. The amount of irrigation water was calculated using the equation:
where W (cm3) is the irrigation amount; θt1 and θt2 (cm3/cm3) are, respectively, the upper limits of soil water content and the measured soil water content before irrigation; and V (cm3) is the pot soil volume. To prevent irrigation water leakage from the pots, irrigation should occur over a short period, and the irrigation amount should not exceed field capacity. Irrigation amounts and potassium quantities applied during all the growth stages are given in Table 1.
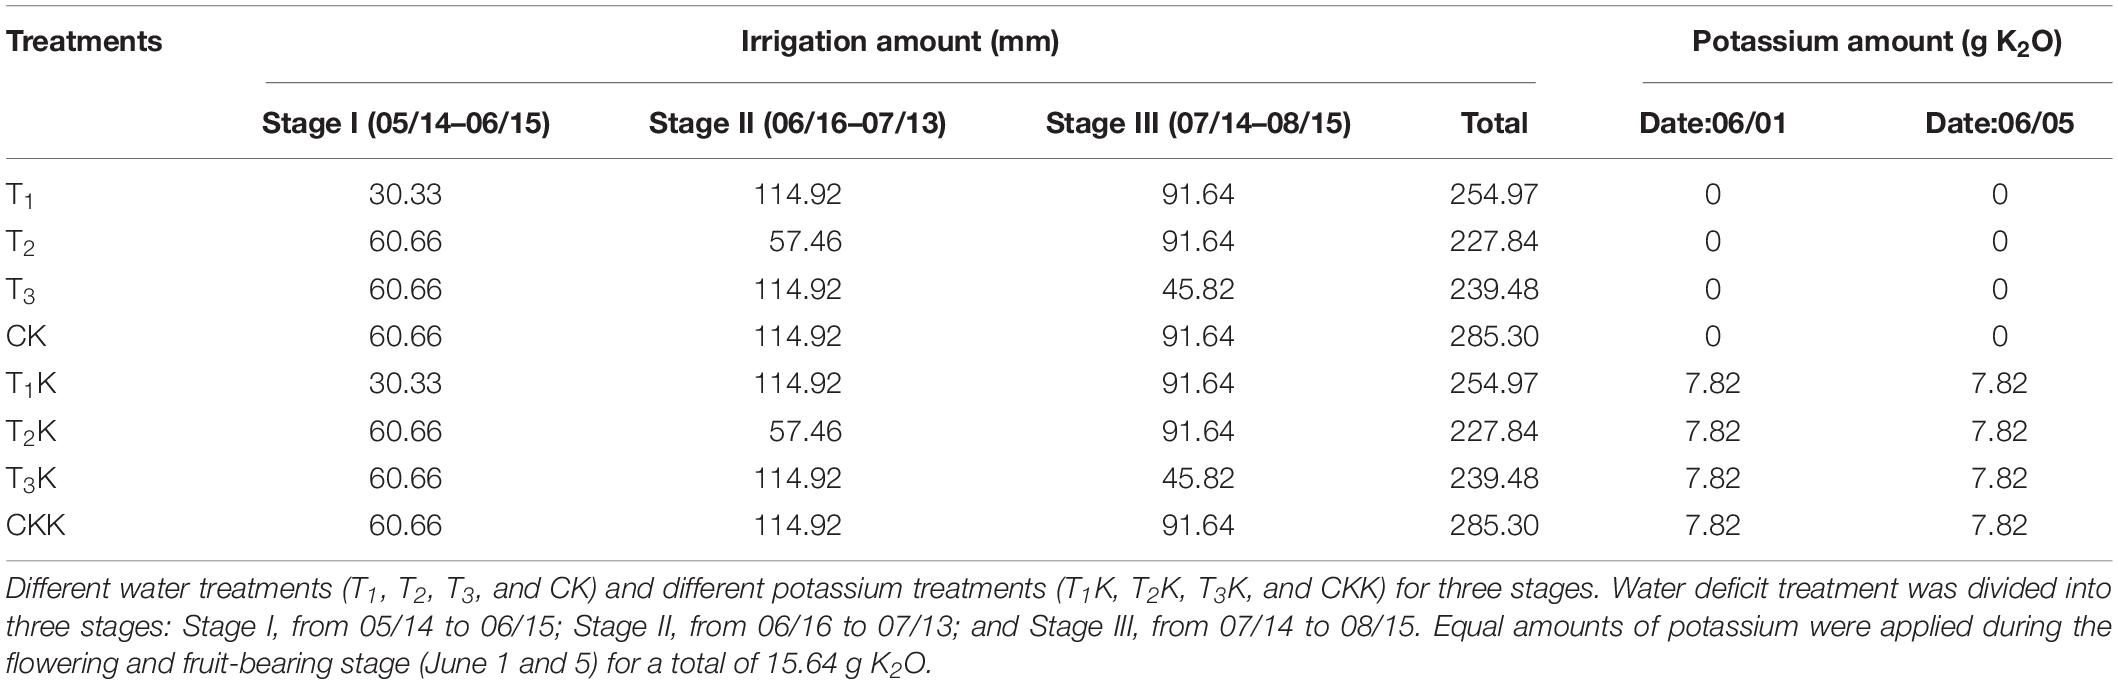
Table 1. Details of irrigation amount and potassium application rate for water and potassium treatments during three growth stages.
Index Measurement
Fruits from the first to fourth trusses of the tomato plants were sampled in the experiments, and each treatment was replicated three times. Fruits were picked at 34 days after anthesis (DAA) of the first truss; 37, 48, and 57 DAA of the second truss; 58 and 65 DAA of the third truss; and 66 and 73 DAA of the fourth truss. Since sugar in the fruit is mainly in the form of starch during the early development stage, experimentally measured data from 34 to 73 DAA was used, which included data from stage II (34–57 DAA) and stage III (58–73 DAA). Potassium content was determined by atomic absorption spectrophotometry (Xue et al., 2006). Soluble sugars were extracted using the procedures described in Gomez et al. (2002) and assayed by HPLC analysis. Starch content was determined enzymatically using the method described in Gomez et al. (2003).
Statistical Analyses and Drawing
Three-way analysis of variance was performed using R studio version 3.6.1 (Robert, 2016) to evaluate the effects of the three factors irrigation, potassium addition and fruit development stage, and any interactive effects, on the quality index and carbon allocation of tomato fruit. A total of 4 water treatments levels, in which T1, T2, and T3 were water-deficit treatments in comparison to control CK; potassium treatments contained 2 levels: with potassium and without potassium; and two growth stages, stage II and stage III. Moreover, there were two factors during the fruit maturation stage: water and potassium, 4 levels of water and 2 levels of potassium, respectively. Mean values were used (shown by different letters) for water treatments, and the least significant difference (LSD) multiple range test was used to calculate differences between treatments at the confidence level P = 0.05. Multiple linear regression, non-linear regression and the Kruskal–Wallis test were all carried out using R, and the ggplot2-based plots were drawn using R package ggpubr (Alboukadel, 2017).
Simplified SUGAR Model Description
The simplified SUGAR model, which was used to describe the main physiological processes of carbon metabolism in a tomato fruit, is shown in Figure 1. Carbon is mainly supplied to the tomato fruit as sucrose transported by the phloem. Carbon is lost through respiration as CO2 derived from the soluble sugars that provide energy and from compounds that form the cellular structure of the fruit (structural carbon) during fruit growth. Remaining carbon is stored in the fruit through carbon metabolism as soluble sugars, starches, and structural carbon compounds such as organic acids, proteins, and cell wall materials. To maintain carbon balance, the conversion of carbon between soluble sugars, starch, and structural carbon compounds must be considered, and compartmentalization of starch in the tomato fruit must be explicitly described (Chen, 2016). In the simplified SUGAR model, only functions k3(t), k5(t), and k5m(t) were used to control the conversion of carbon within the fruit, thereby increasing the applicability of the model. The function k6(t) is the fruit respiration rate, which can be directly calculated and is not used as a model parameter. The simplified SUGAR model is represented by the following set of differential equations:
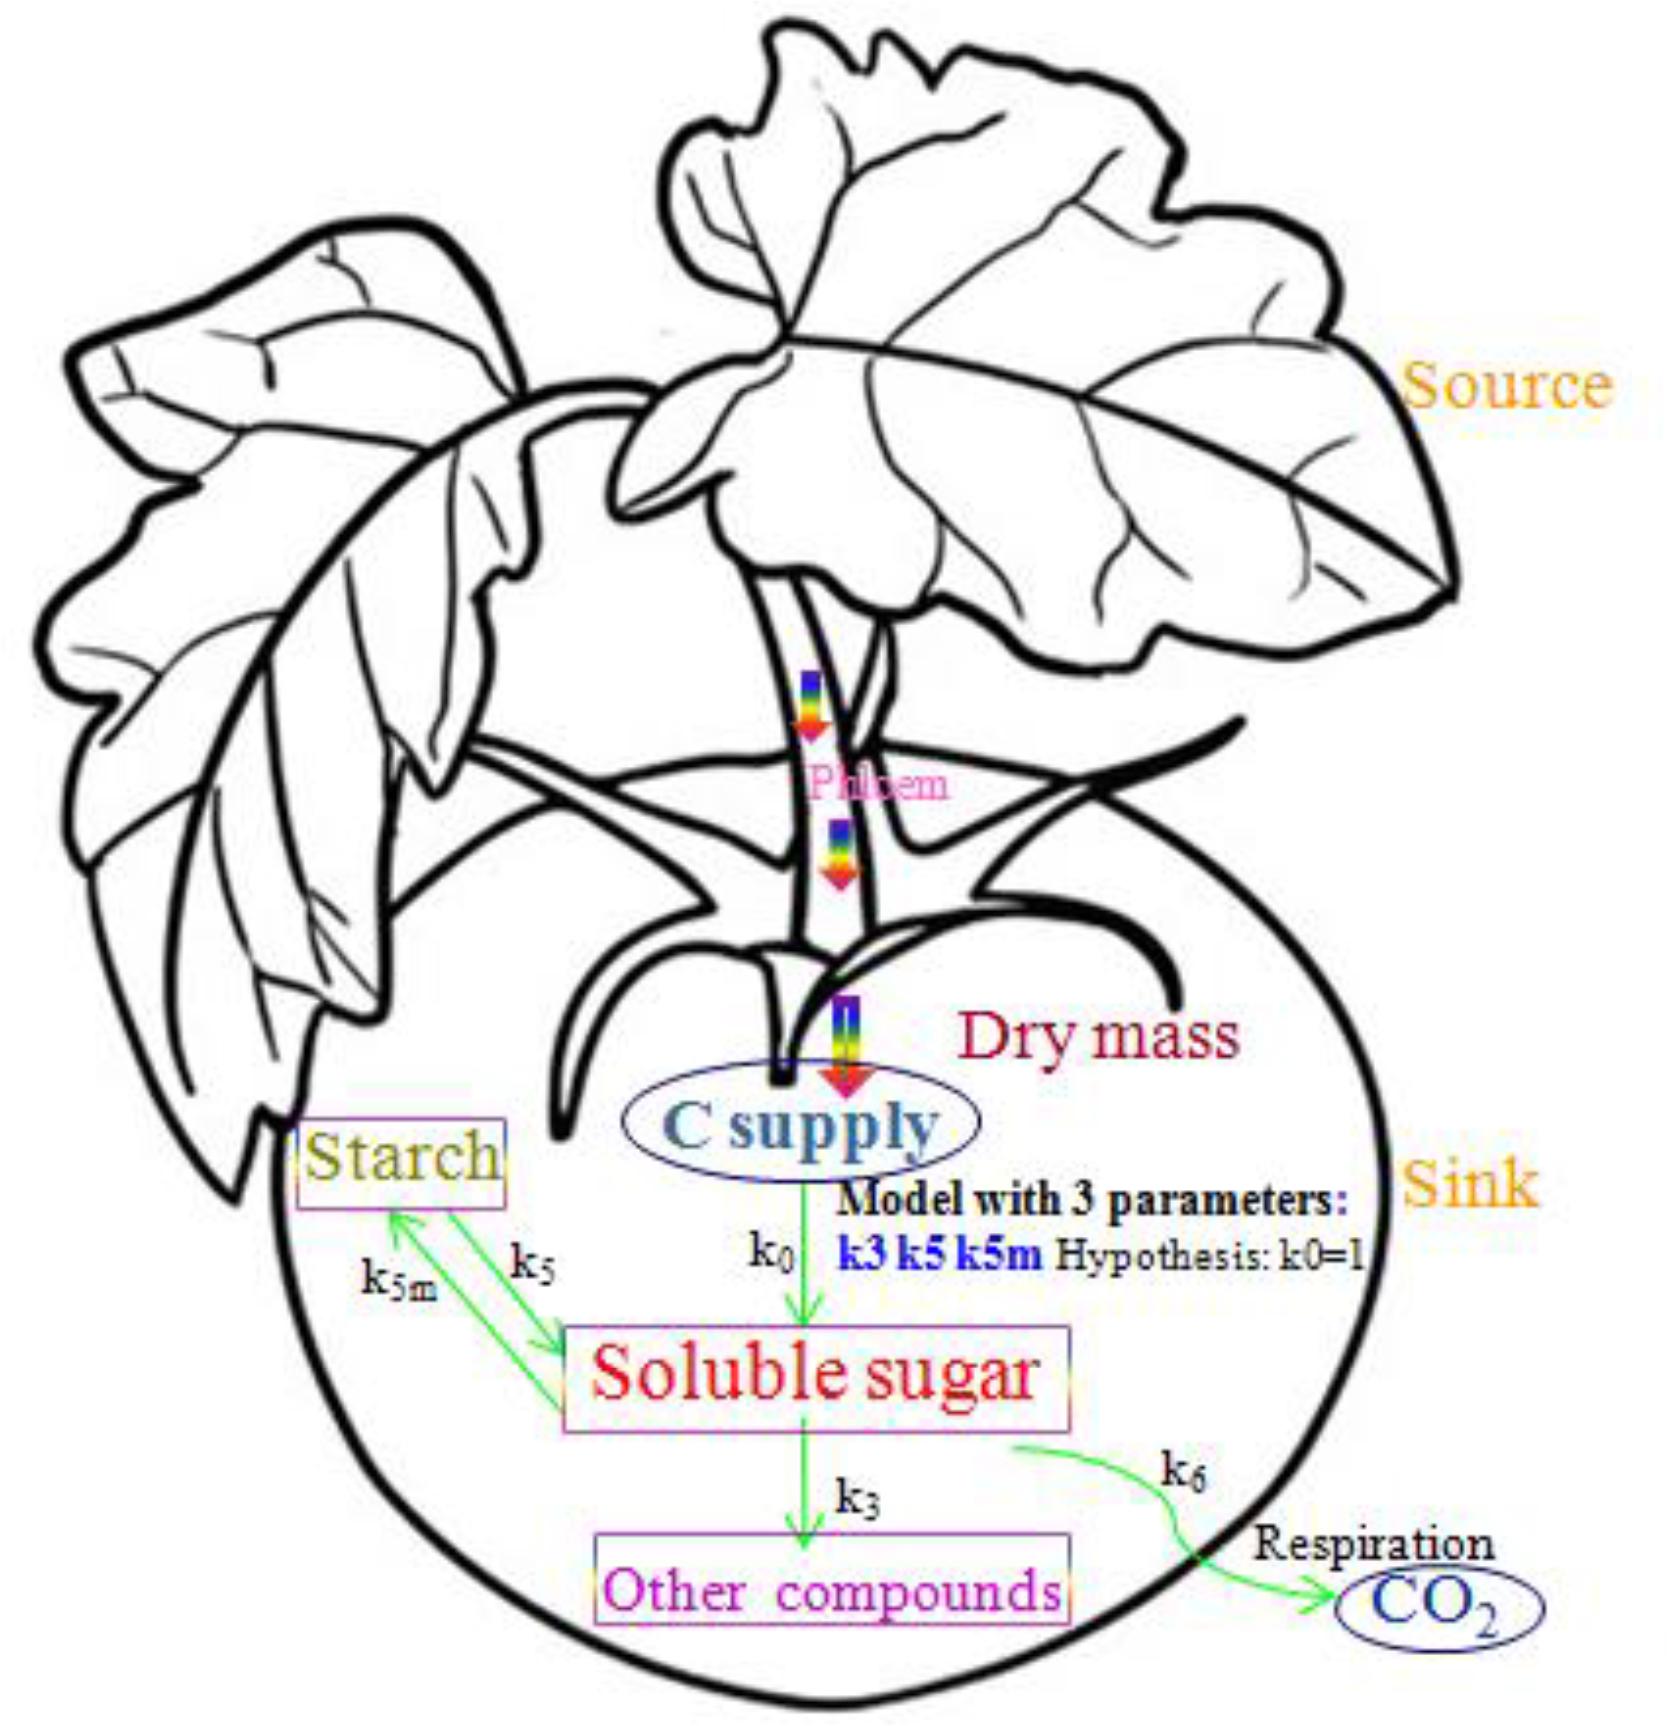
Figure 1. A schematic of the simplified SUGAR model showing sugar metabolism and carbon balance in the tomato fruit. Arrows represent carbon flows. The parameters k3(t), k5(t), and k5m(t) are the relative rates of carbon conversion for soluble sugars, starch, and other carbon compounds. Rectangles identify the three major types of carbon compounds in the fruit, and the two ellipses show carbon supply and loss through respiration.
According to the law of conservation of mass, we obtained:
Where:
where Csol, Csta, and Cstr (g), respectively, represent the quantities of carbon as soluble sugars, starches, and other structural carbon compounds; dCsup/dt and dCrep/dt are the carbon flows (g/h) into the fruit (transported by the phloem) and out of the fruit (by respiration); cDW (g/g C:DW) is the amount of carbon per unit gram of dry mass, which is 0.44 for a tomato fruit (Gary et al., 1998); DW (g) is the dry weight of the fruit; qg is the growth respiration coefficient, which is 0.088 (g/g C:DW) (Gary et al., 1998); qm is the maintenance respiration coefficient at 20°C and is 0.000 168 (g/g/h C:DW) (Bertin and Heuvelink, 1993); Q10 is the temperature ratio of maintenance respiration and is 1.4; T (°C) is temperature (Bertin and Heuvelink, 1993); k0 is a dimensionless parameter denoting the assimilates of the fruit that are mainly imported from the phloem as sucrose, assumed to be 1 for a tomato fruit (Bertin and Heuvelink, 1993); k3(t), k5(t), and k5m(t), respectively, represent the relative rates of carbon conversion from soluble sugars into other structural carbon compounds, from starch into soluble sugars, and from soluble sugars into starch.
The carbon conversion coefficients k3(t), k5(t), and k5m(t) are closely related to the metabolic activity that occurs during the growth and development of the fruit. The rate of starch synthesis is variable, whereas the rate of breakdown is relatively constant (Nguyen-Quoc and Foyer, 2001). This result is supported by the fact that the activity of the enzymes breaking down starch (amylase and starch phosphorylase) varies little during tomato fruit development (Yelle et al., 1988). Therefore, k5(t), which is the rate of conversion of starch to soluble sugars, was considered to be constant (k5) during fruit growth. Given the dynamic equations for carbon conversion to the three forms (soluble sugars, starch, and structural carbon compounds) equations can be derived from Eqs 3 and 4 to determine k3(t) and k5 m(t):
The carbon amounts (Csol, Csta, and Cstr) and their variation rates (dCstr/dt and dCsta/dt) were calculated by local regression using the data from the experimental measurements. Since k5(t) and k5m(t) are functions of each other, the value of k5 was arbitrarily set when estimating the variation of k5m. Based on the model parameter values obtained from the experimental data, k5 was 0.296 517 337 and used to calculate k5m(t). All parameter values of the SUGAR model were calculated using R functions nls() and optim().
Results
Variation of Tomato Fruit Growth and Sugar Concentration
Fruit fresh weight (FW) increased gradually as days after anthesis (DAA) increased and reached a maximum at fruit maturation (Figure 2). Mean FW for the water-deficit treatments (T1, T2, and T3) was lower than that for well-watered CK, showing that water had a great effect on FW. The mean FW in potassium treatments (K1) was greater than that of the water treatments (K0), showing that the potassium had a great effect on FW (Table 2). During the ripening stage, there were considerable differences in FW that corresponded to different water treatments, and similarly, differences in potassium treatments were related to FW. The interactive effects of water along with potassium can be clearly seen in Table 2.
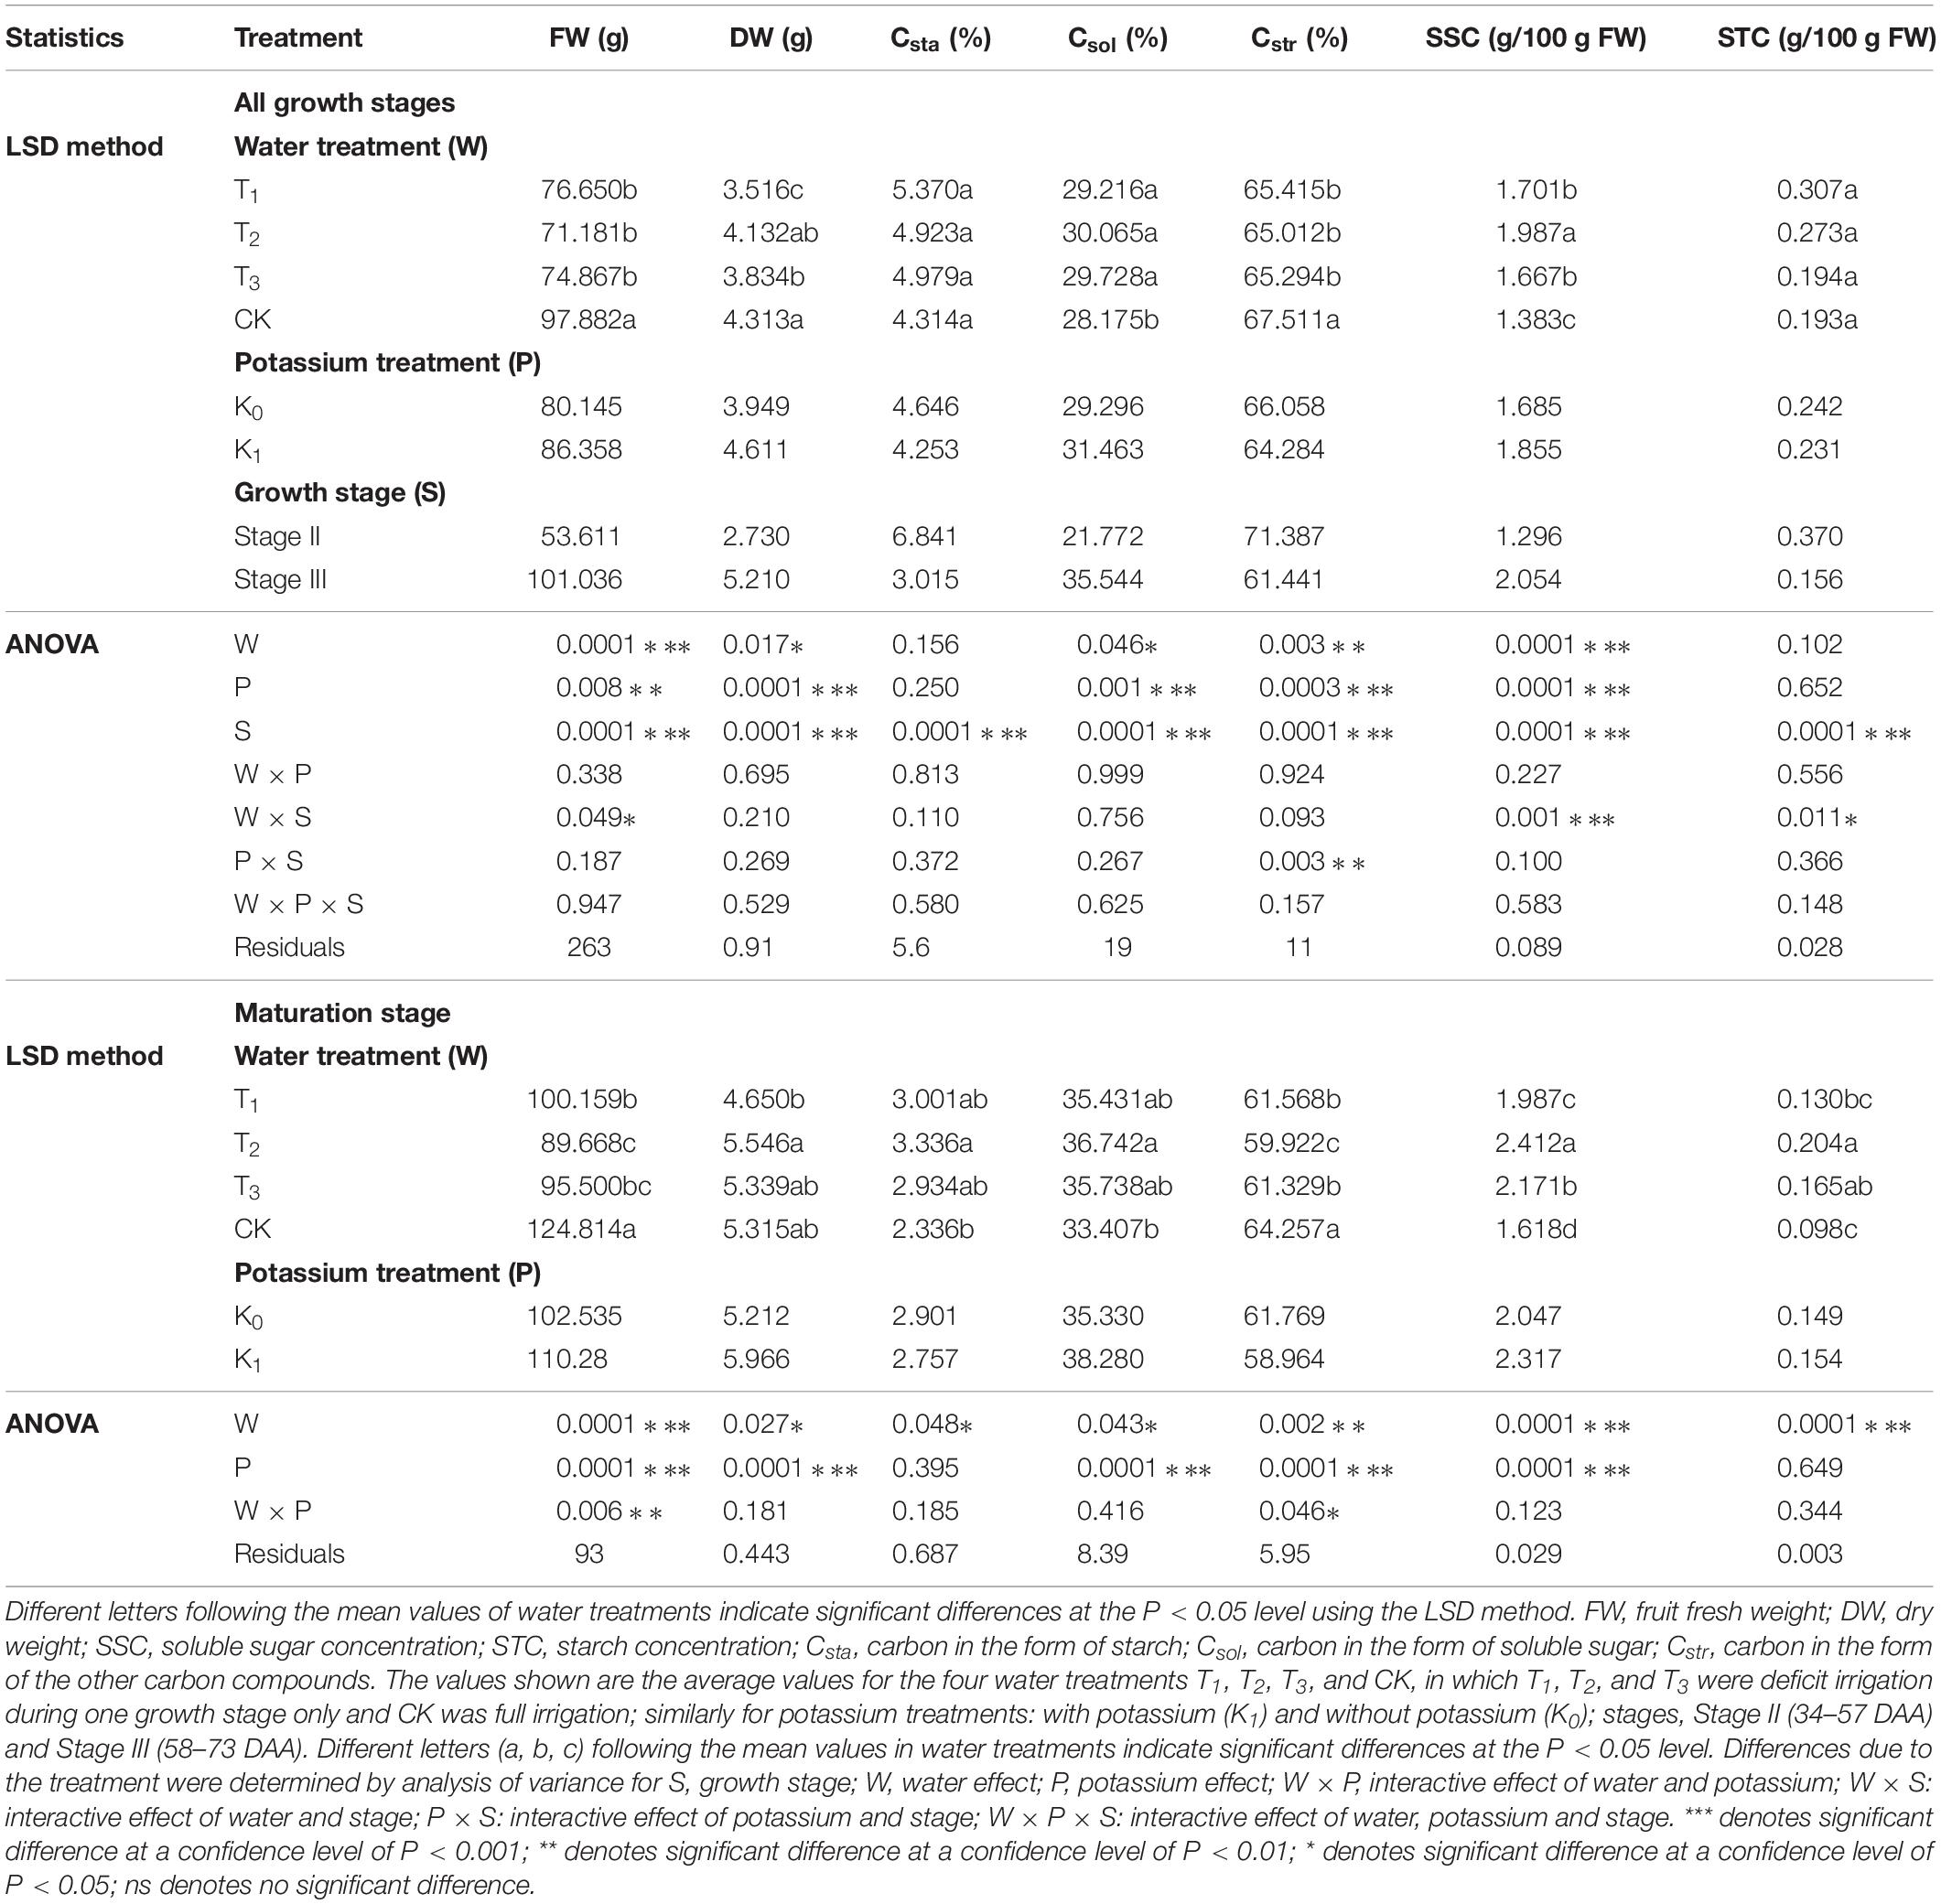
Table 2. Three-way analysis of variance of FW, DW, SSC, STC, Csta, Csol, and Cstr was performed to evaluate the individual and interactive effects of water (4 levels: T1, T2, T3, and CK), potassium (2 levels: K0, K1) and growth stage (2 levels: stage II and III) on the tomato fruits during the all growth stages and the maturation stage.
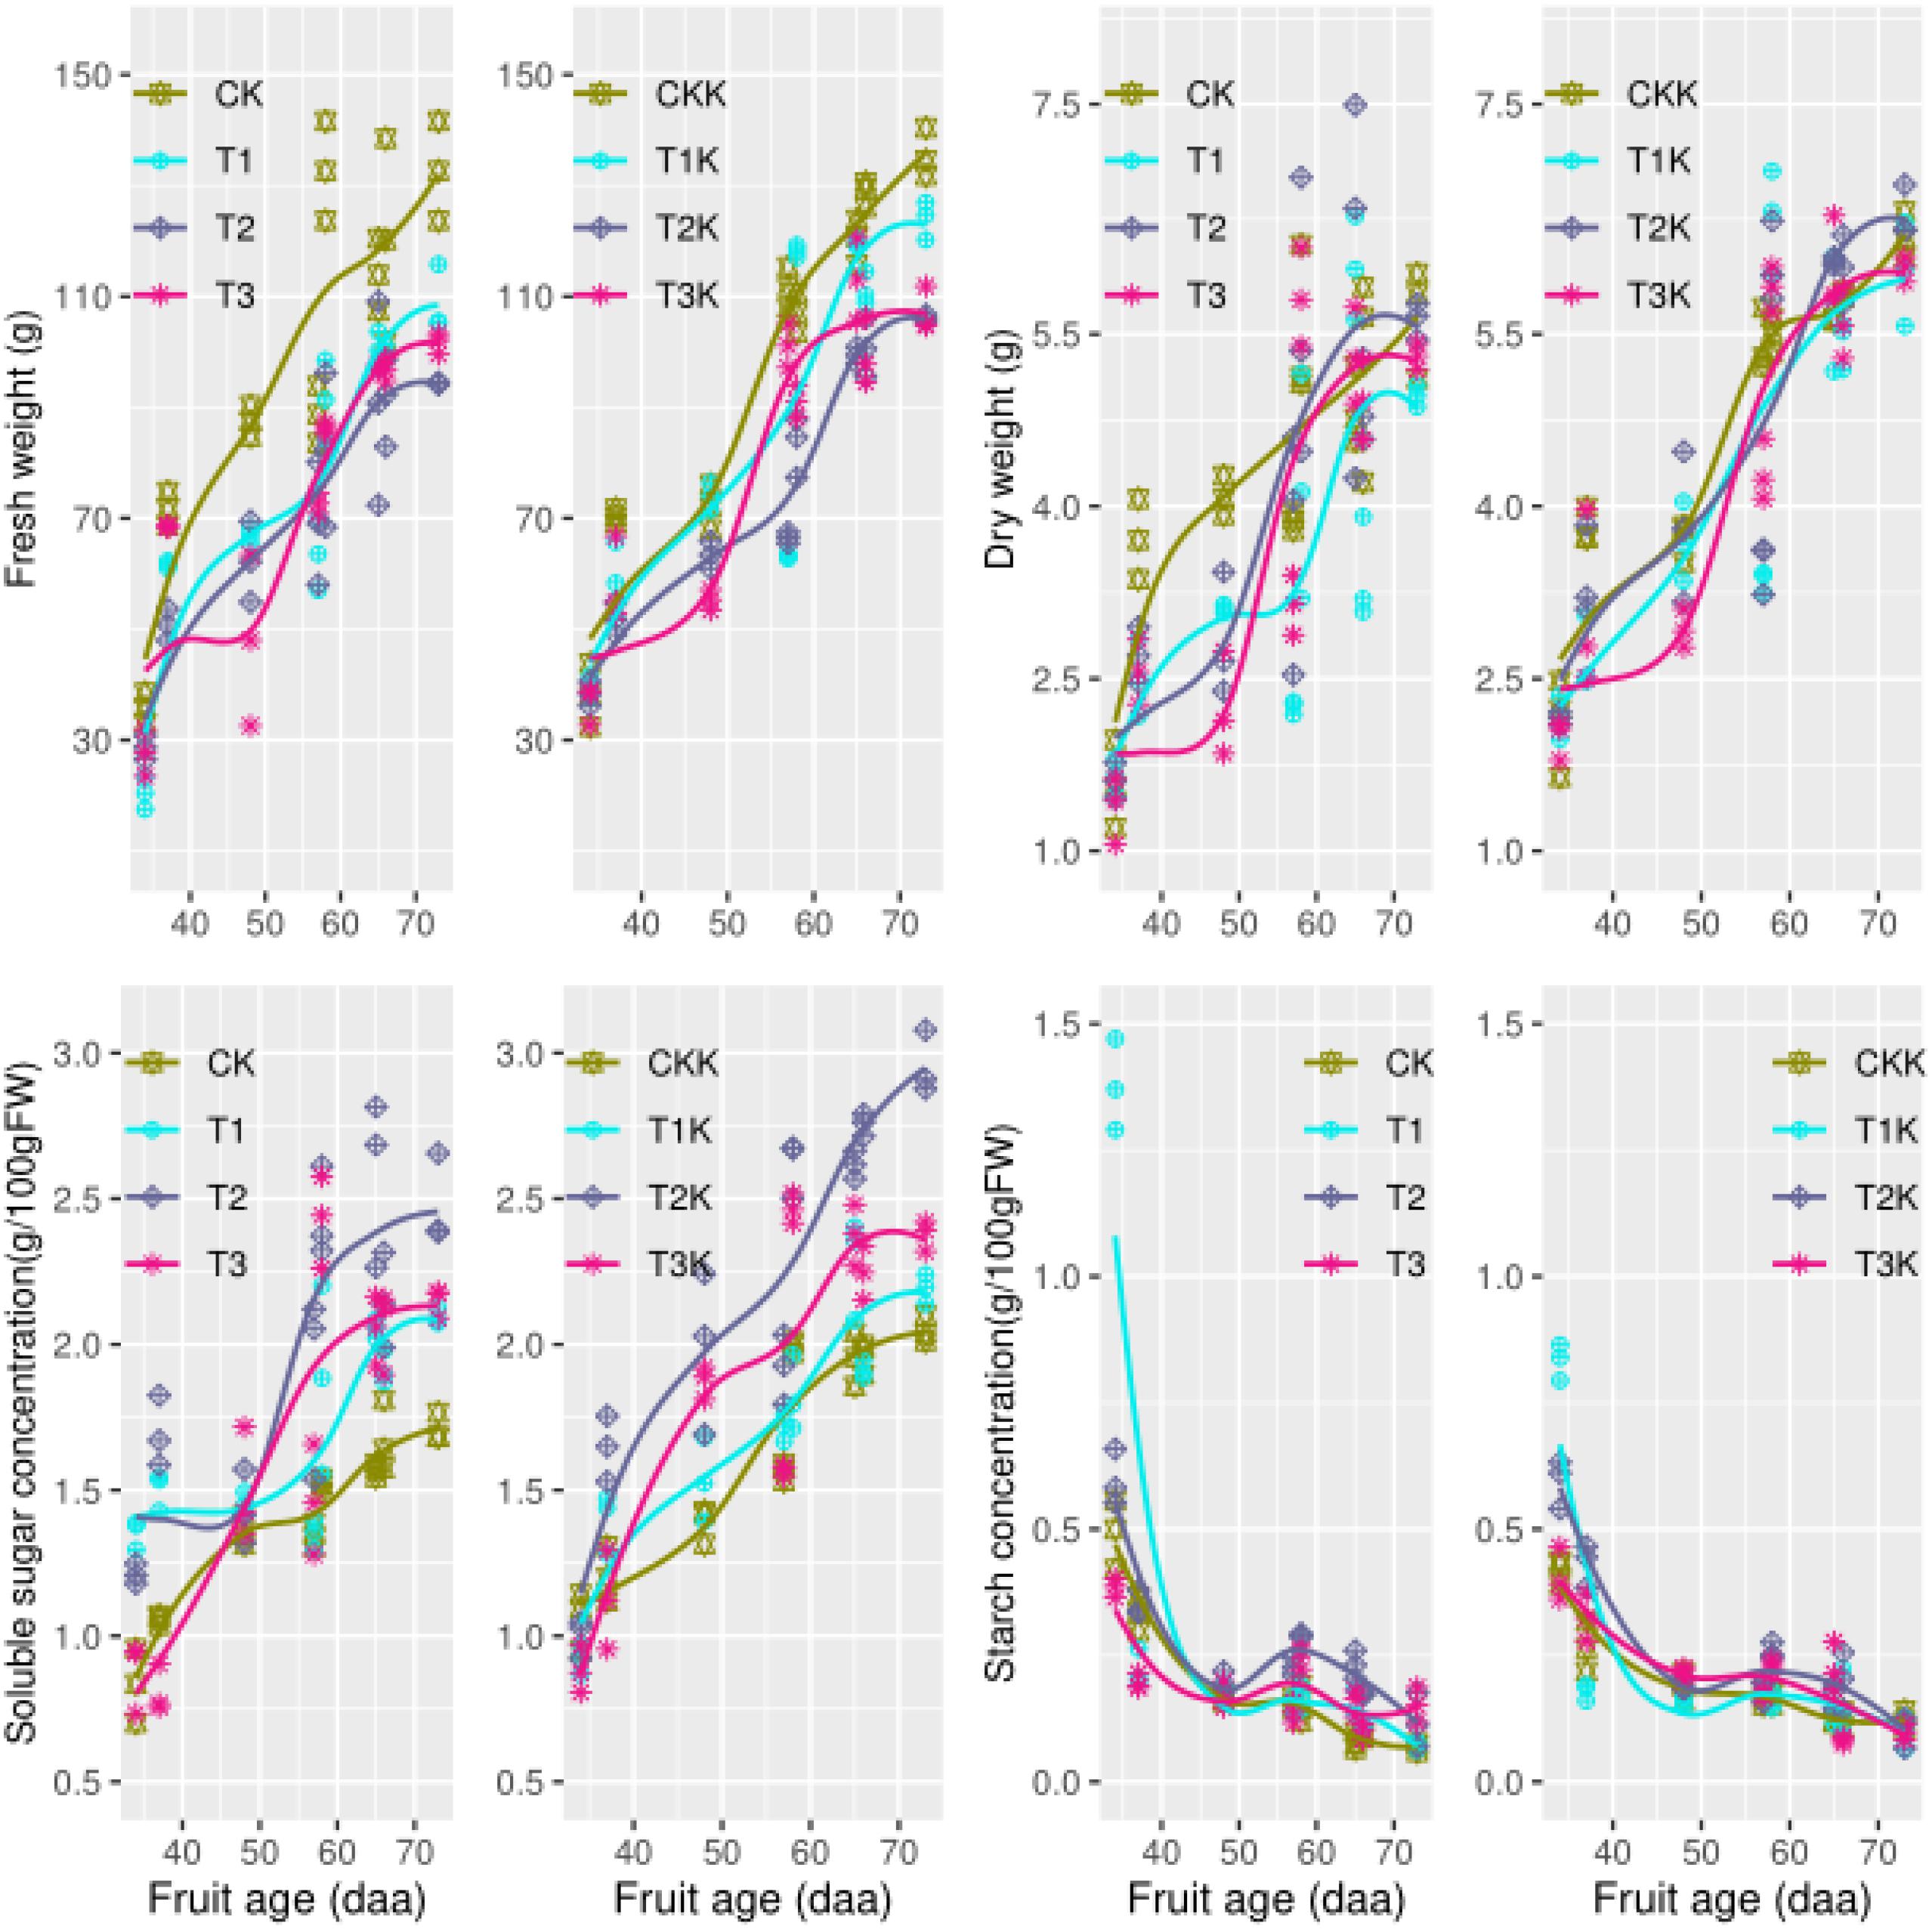
Figure 2. Fruit growth and carbohydrate concentration during all growth stages. Measured fresh weight (points), dry weight(point), and the fitted curves (lines) for different water and potassium treatments are shown as functions of fruit age (days after anthesis, DAA). Variations in the observed data (points) and the fitted curves (lines) for soluble sugar (SSC) and starch (STC) concentrations (g/100 g FW) are shown for different water and potassium treatments. Statistical variables for each treatment are shown in Table 2 for comparison.
Fruit dry weight (DW) also increased as DAA increased; it increased rapidly during the early development stage and leveled off during fruit development (Figure 2). Mean DW was ordered by treatment CK > T2 > T3 > T1, and water had a significant effect on DW (Table 2). Potassium treatments (T1K, T2K, T3K, and CKK) resulted in significant increases in DW, as shown by K1 > K0 in Table 2. All treatments significantly changed DW in different growth stages, and the relationship between growth stage and DW was pronounced. Both water and potassium had considerable influence on DW during the maturation stage (Table 2).
The concentration of soluble sugars (SSC) greatly increased as DAA increased and peaked at fruit maturation (Figure 2). Mean SSC was greater for the water-deficit treatments than for CK, in which T2 was the maximum and the effect of water on SSC was pronounced (Table 2). Potassium application resulted in very significant change in SSC, and SSC was greater for K1 than for K0 (Figure 2 and Table 2). The development stage effect on SSC was really notable, and the interactive effect between water and growth stage was obvious. SSC at the fruit maturation stage differed between water treatments, and potassium had an evident influence.
Starch concentration (STC) increased during the early development stage and then decreased to a very low level (near zero) at maturity (Figure 2). No difference in mean STC was observed between water treatments. However, the relationship between growth stage and STC was extremely remarkable, and the interactive effect between growth stage and water markedly differed. Water had a seriously effect on STC at maturity (Table 2) than during all growth stages.
Carbon Allocation and Variation in Tomato Fruit
Carbon content in the form of starch (Csta) varied significantly as DAA increased. The amount of carbon allocated to starch in the sink (Csta) decreased from 16% in the early development stage to 2% at the fruit maturation stage (Figure 3). As the fruit ripening, the declining trend between different water treatments was consistent, and no marked difference was found between water treatments. The variation trend of potassium treatments were similar, and carbon allocation to starch decreased as DAA increased (Figure 3). Neither water nor potassium significantly affected Csta. However, the development stage effect on Csta was seriously remarkable (Table 2).
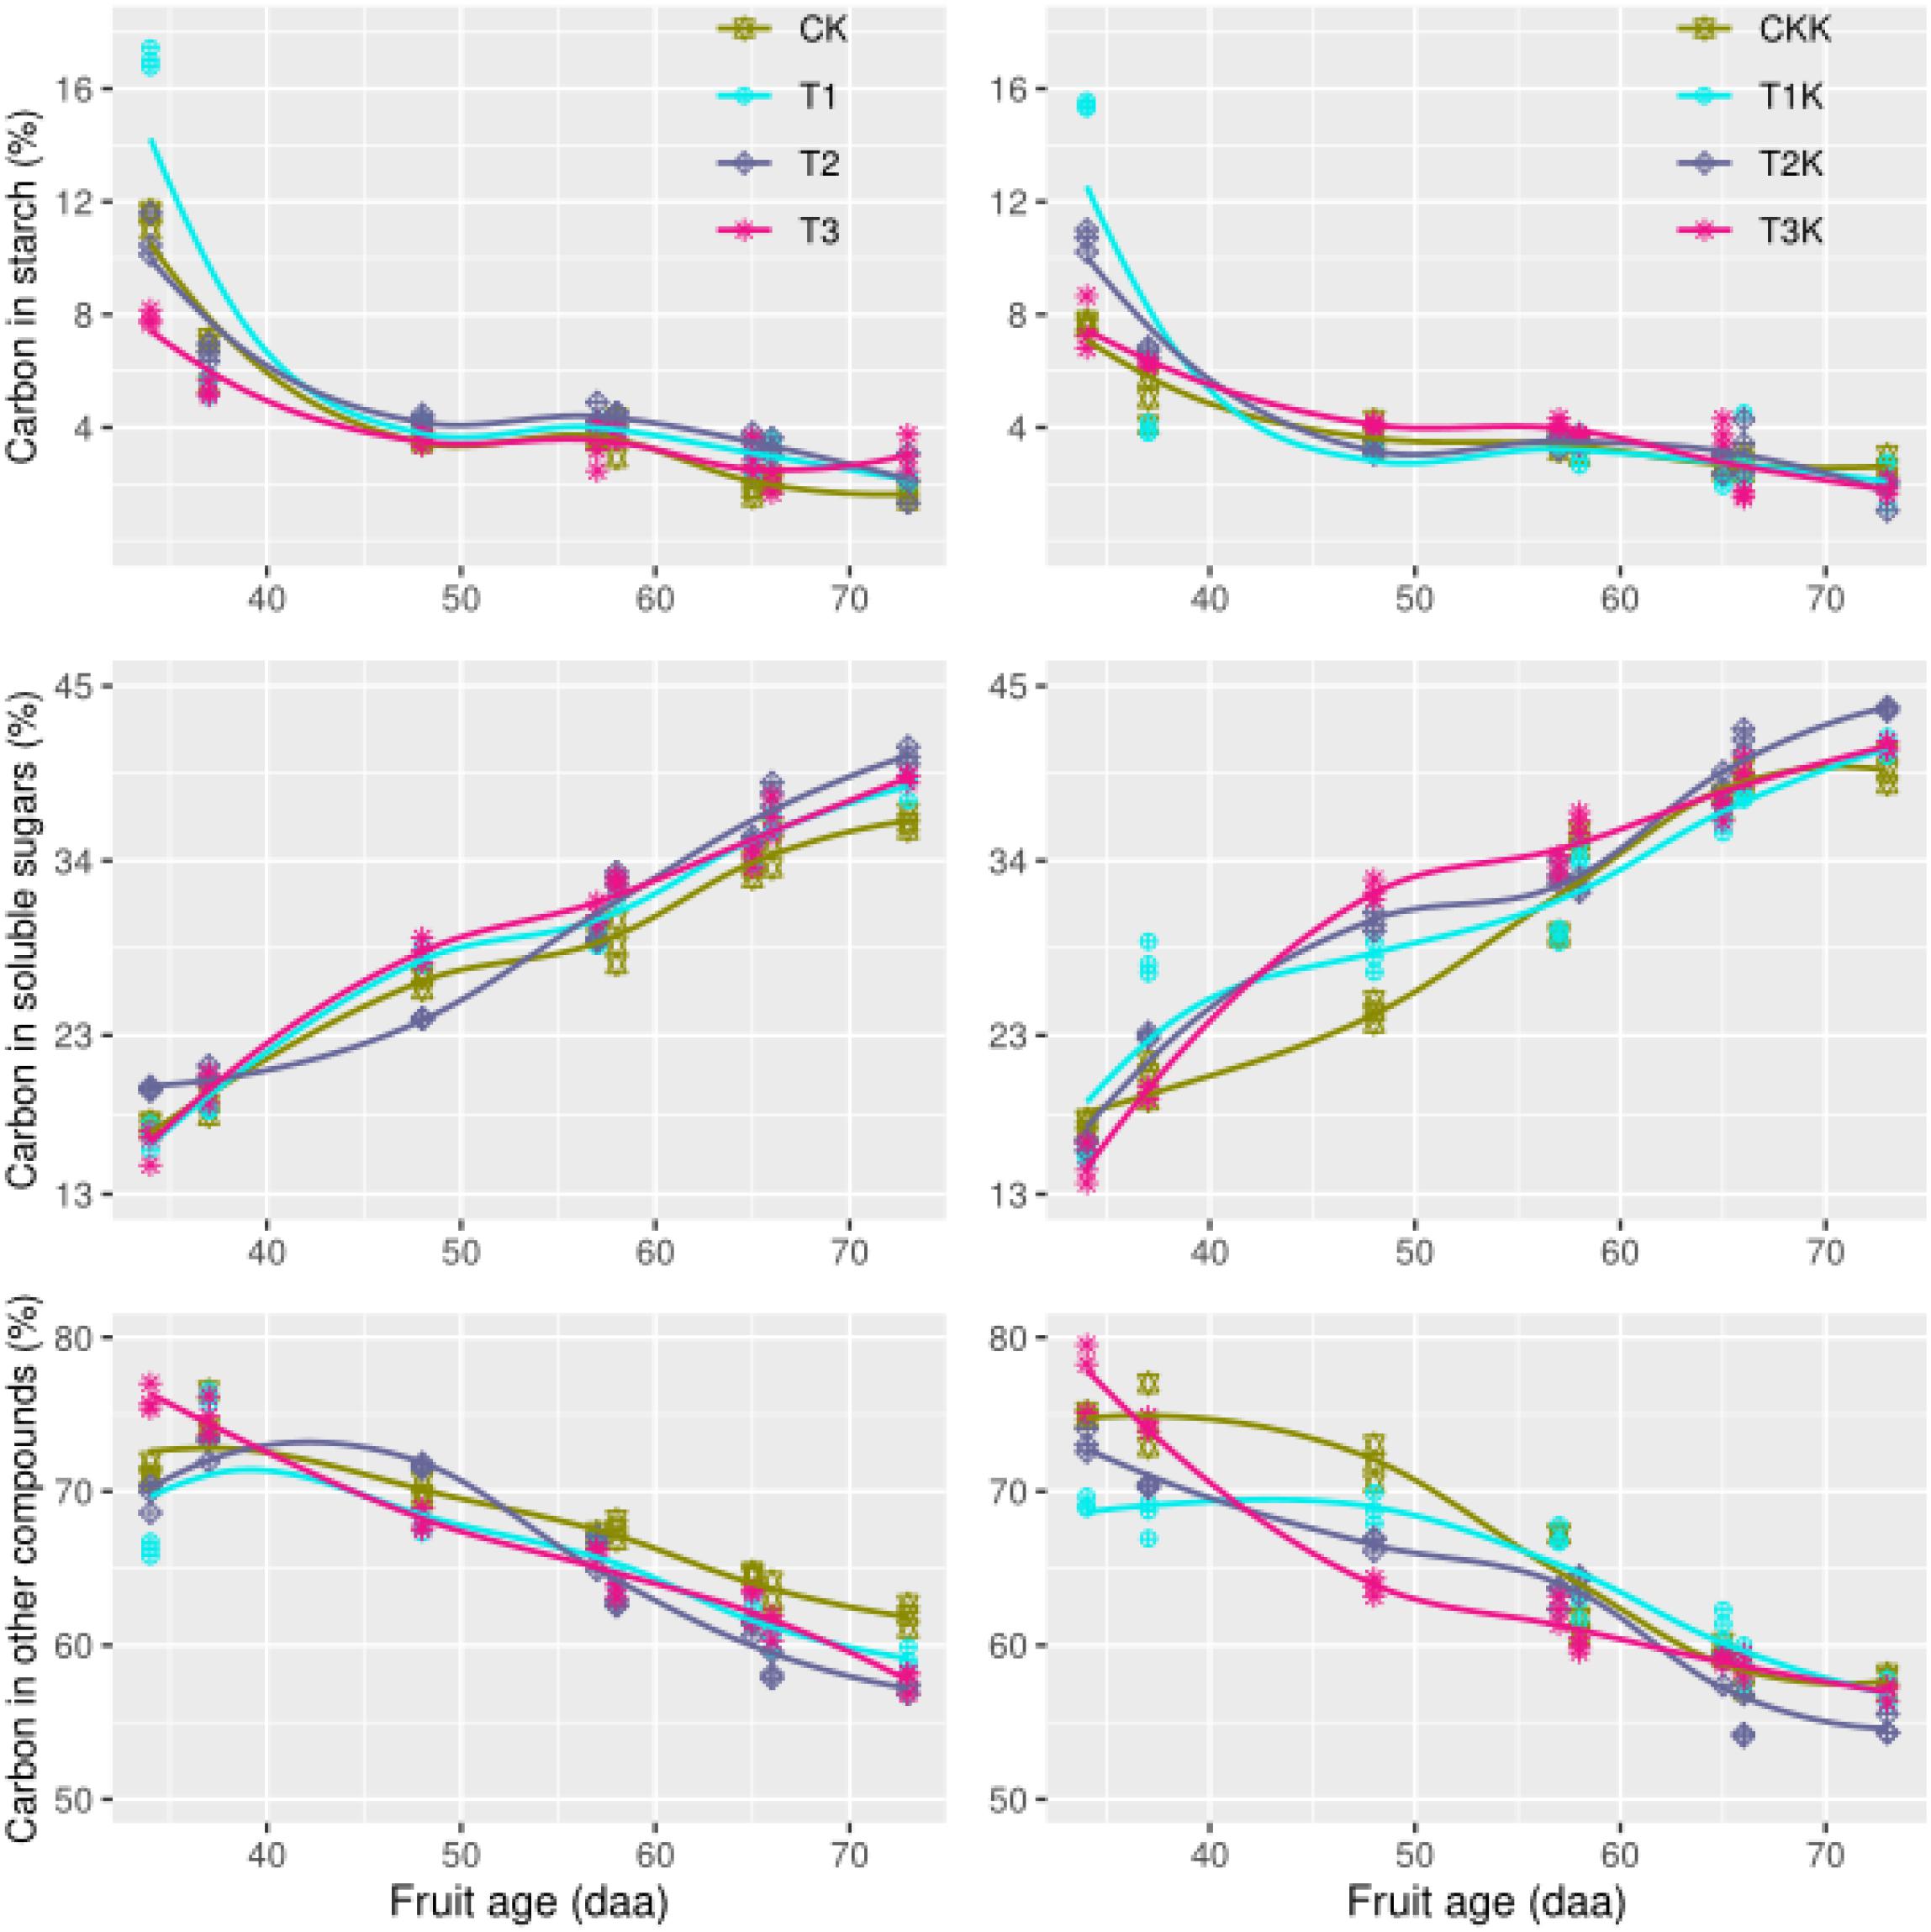
Figure 3. Carbon allocation during all growth stages. Measured values (points) and fitted curves (lines) are shown for different treatments. The graphs show variation in carbon concentrations in the form of starch, soluble sugar, and other carbon compounds.
Soluble sugar content (Csol) increased as DAA increased (Figure 3). Csol increased gradually from 13% at the beginning of the fruit growth stage to 45% at harvest, when the fruit was mature. The trend of this variation was consistent across different water treatments, but water-deficit treatments showed greater increases than CK. Csol for K1 was greater than K0. The effects of potassium and stage on Csol were statistically significant (Table 2).
Most carbon is allocated as structural carbohydrates Cstr. The carbon content of Cstr decreased greatly as DAA increased from 75% during the early development stage to about 50% at fruit maturation. This downward trend was consistent between the water-deficit treatments and CK; the mean of Cstr for CK was greater than for the water-deficit treatments. Water clearly had a significant effect on Cstr (Figure 3 and Table 2). Cstr for K1 was less than for K0. There were large differences in Cstr between different development stages, and the interactive effect between potassium and stage was impressive (Table 2).
Variation of Carbon Conversion Coefficient in Tomato Fruit
Change in k3(t) and k5m(t) over the period of the experiment was calculated from the carbon amounts (Csol, Csta, and Cstr) and their variation rates (dCstr/dt and dCsta/dt) using Eqs 8 and 9 with the experimental data. The flux of Csupply was calculated using Eq. 6.
The calculated carbon conversion coefficients k3(t) and k5m(t) were plotted against DAA (Figure 4). k3(t) decreased as DAA increased in all treatments; it reached a maximum during the early development stage and then decreased to a very low level (near zero) at maturity. Values of k3(t) for the water-deficit treatments were noticeably less than for CK during the early development stage, and the greatest decrease in k3(t) over the entire growth stage was for CK (Figure 4). The potassium treatments displayed the same trends as the water treatments. k5m(t) decreased as DAA increased for all the treatments; it reached a maximum during the early development stage and then decreased to an extremely low level (near zero) at fruit maturation. k5m(t) behaved similarly for the potassium treatments. Csupply flux was considerably greater for K1 than for K0 during the entire growth period (Supplementary Figure 2).
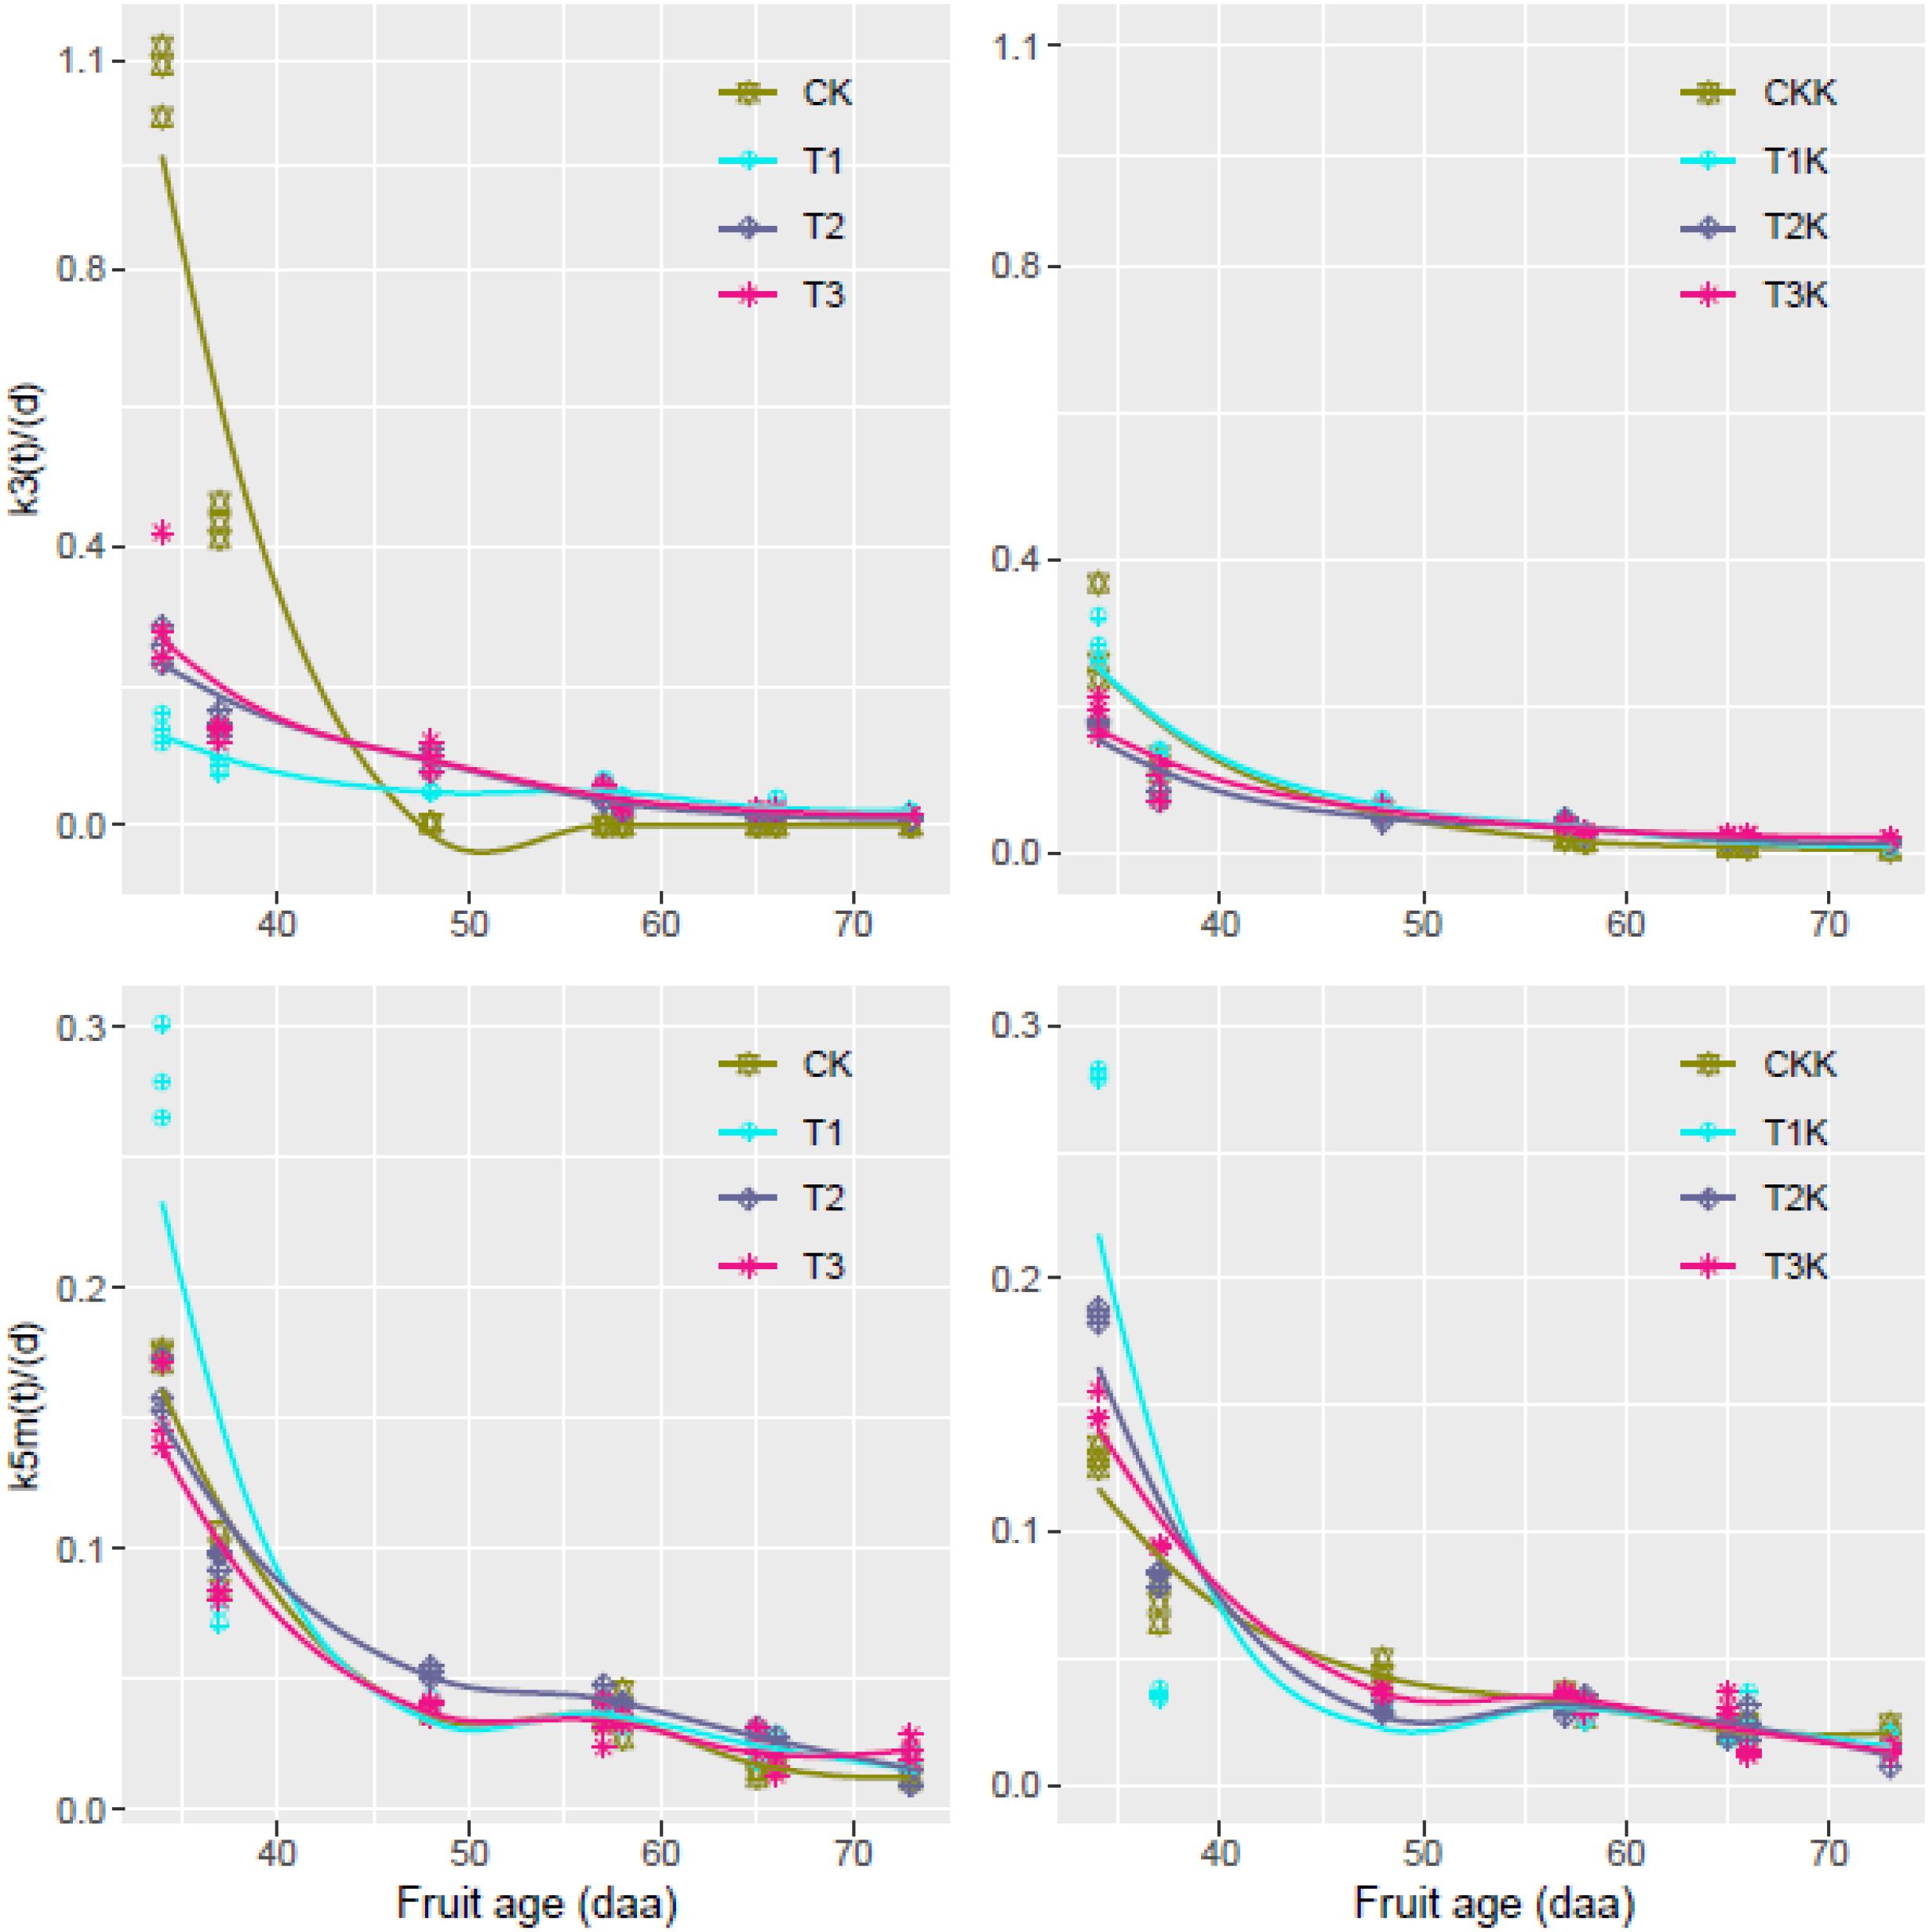
Figure 4. Relative rates of carbon conversion from soluble sugars to other carbon compounds [k3(t)] and from soluble sugars to starch [k5m(t)] during the entire growth period; values were calculated from Eqs 8 and 9 using R with the dataset for all treatments; fitted curves (lines) are also shown.
Carbon Allocation During the Maturation Stage
The mean value of Csta for the water treatments was greatest for T2 and least for CK, showed that water had a considerable influence (Table 2). The Csta for K1was lower than for K0, but the effect of potassium showed no notable change (Figure 5 and Table 2).
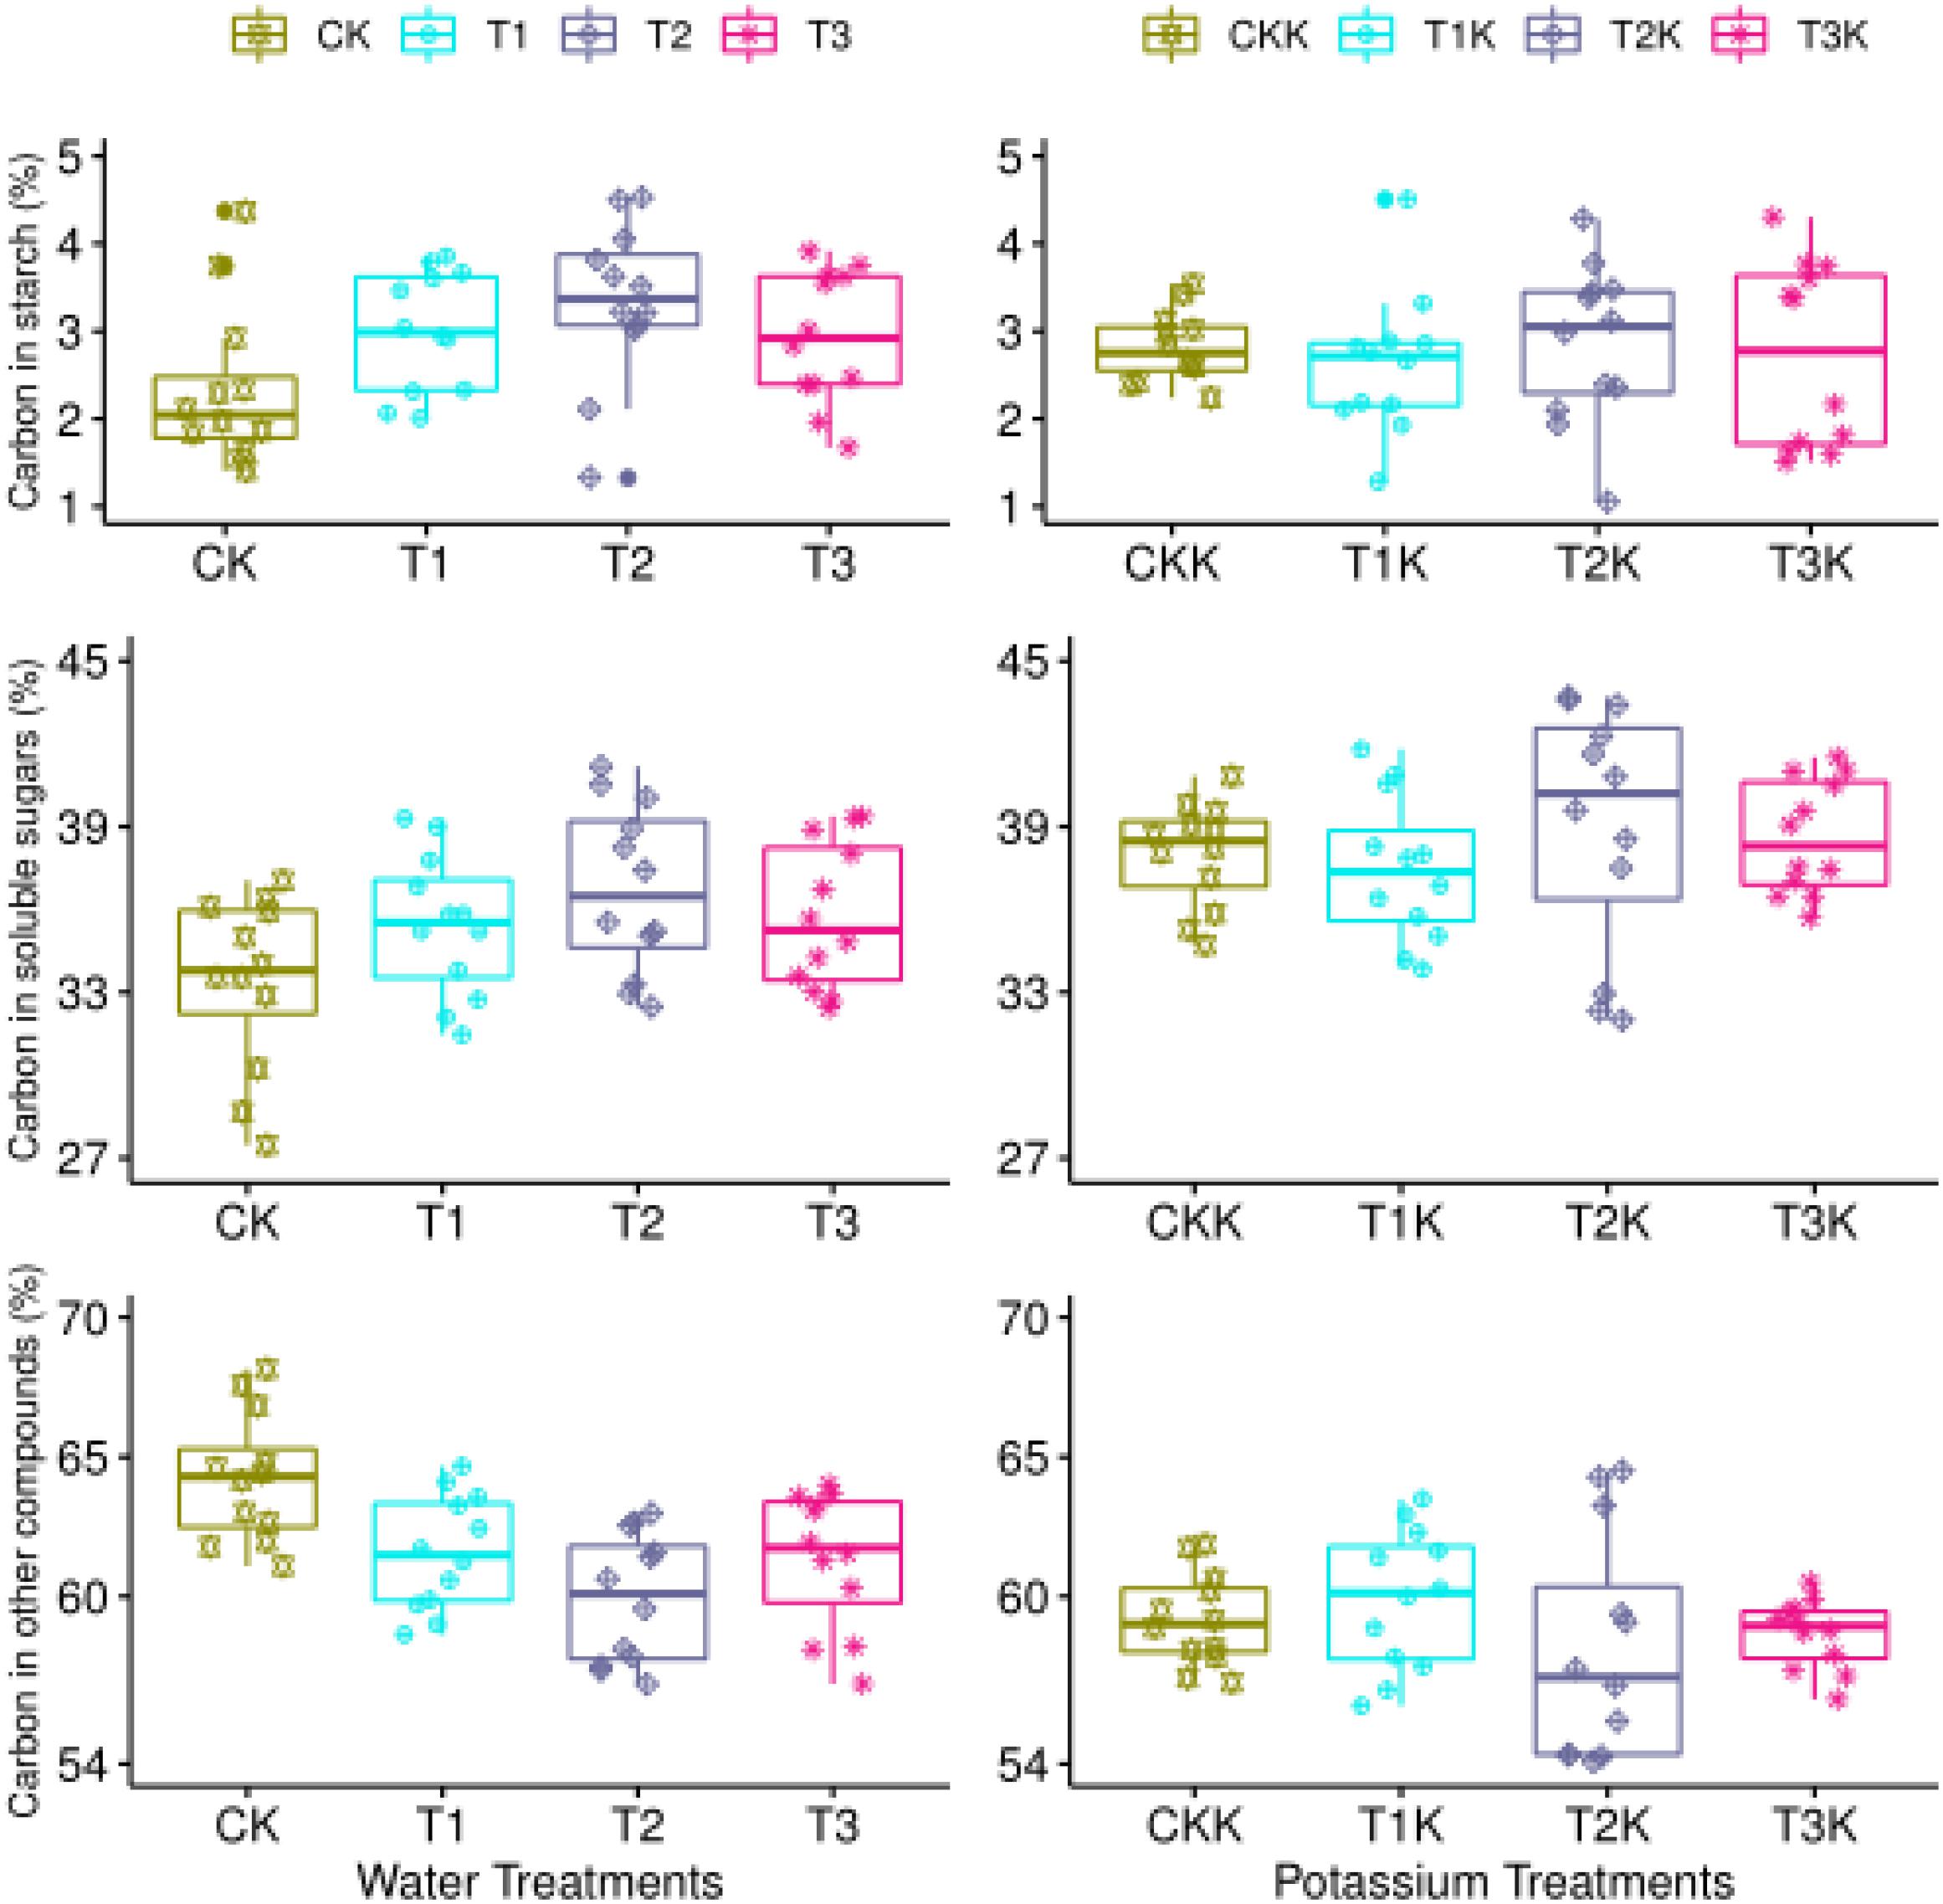
Figure 5. Carbon allocation during the maturation stage. Measured values (points) are shown for different water and potassium treatments. Statistical variables calculated for each treatment are presented in Table 2 for comparison.
The mean value of Csol was significantly greater for the water-deficit treatments (T1, T2, and T3) than for CK during the mature stage. T2 had the maximum mean value of Csol (Table 2). Csol was clearly greater for K1 than for K0 (Figure 5 and Table 2).
The mean value of Cstr for the water-deficit treatments was noticeably less than for CK (Figure 5). There were significant differences between water treatments, but not between T1 and T3 (Table 2). The Cstr for K1 was lower than for K0 (Figure 5 and Table 2). Water had an influence on Csta, but potassium did not. Water and potassium significantly affected Csol. Water also had a noteworthy impact on Cstr, and potassium significantly affected Cstr at maturaty. The interactive effect of water and potassium on Cstr was also significant (Table 2).
Changes in k3(t) and k5m(t) at Fruit Maturation
Samples were taken at 58, 65, 66, and 73 DAA during fruit maturation. Figure 6 shows changes in the parameters for different treatments. There was little change in k3(t) for CK between 58 and 73 DAA, but for other treatments k3(t) decreased gradually as DAA increased (Figure 6).
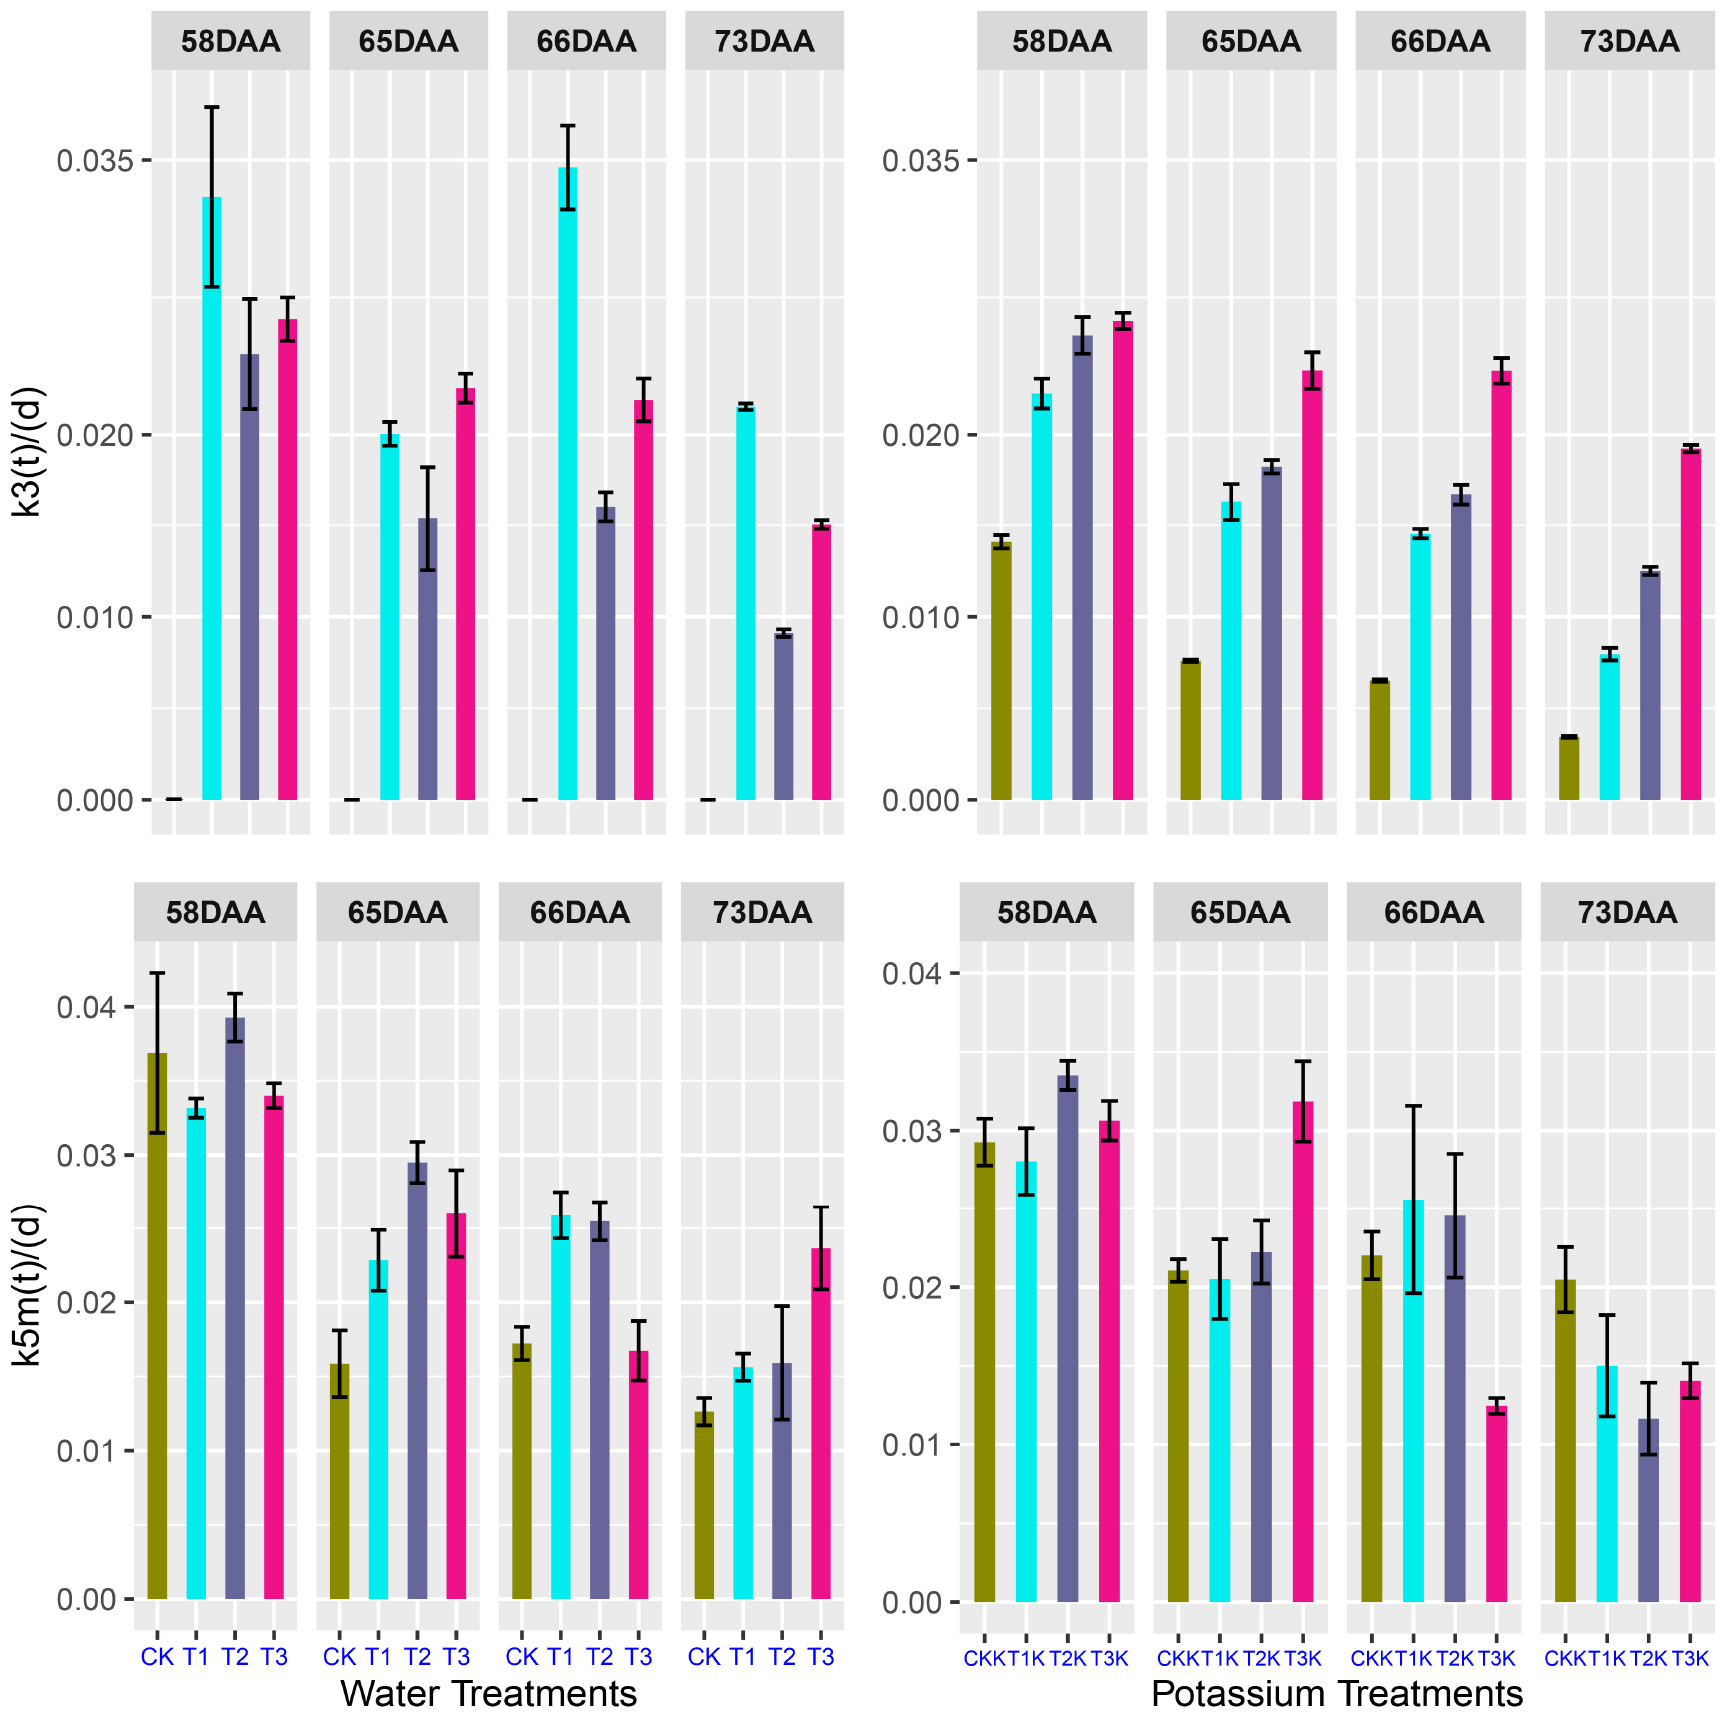
Figure 6. Relative rates of k3(t) and k5m(t) at 58, 65, 66, and 73 days after anthesis (DAA) as a function of fruit age. The values were calculated using Eqs 8 and 9 in R project.
k5m(t) gradually decreased during fruit maturation for different treatments. The water-deficit treatments showed greater values of k5m(t) than CK for 65–73 DAA. CKK showed the least variation (Figure 6), but the change in k5m(t) ranged from 0.01 to 0.04 during the fruit ripening stage, which was not considerable. There was very little change in k3(t) and k5m(t) during fruit maturation.
Discussion
Moisture is closely related to plant growth. Tomato plants have a high water demand (Norris, 2006), and tomato fruits are sensitive to water deficit (Rao et al., 2001). The water status of the fruit directly affects the sugar concentration in tomato, so irrigation is an important factor influencing tomato yield and fruit quality. Water stress reduces fruit size in grapes and thus increases the ratio of skin to pulp and improves wine quality (Ginestar et al., 1998; Ojeda et al., 2002; Koundouras et al., 2006). Deficit irrigation of peaches significantly reduces fruit weight but increases soluble solid content (Kobashi, 2000; Génard et al., 2003). Water deficit has a significant effect on fruit weight of melons (Dogan et al., 2008). A study on citrus also confirmed that both the fruit size and single fruit weight decrease in deficit irrigation (Treeby et al., 2007). Clearly, water deficit significantly reduces the weight of fresh fruit. Our experimental data showed that fruit weight for the control CK was greater than for the water deficit treatments (Figure 2 and Table 2), which implies that that water stress in tomatoes decreases FW, which is consistent with the results of the studies mentioned.
Water deficit changes the amount of assimilate received by fruit (Wang et al., 2003), the rate of sugar metabolism (Kobashi, 2000) and the water budget (Keller et al., 2006), thereby altering the sugar content (Mitchell et al., 1991). Water content accounts for about 95% of fruit weight, and dilution is important in determining the concentration of soluble sugars (Génard et al., 2014). The dilution effect (Terry et al., 2007) results in a negative correlation between sugar content and irrigation level (Kobashi, 2000; Sadras and McCarthy, 2008; Julie et al., 2016). In our experiment, total water quantity applied by the treatments was ordered CK > T1 > T3 > T2 (Table 1). T2 gave the greatest value of mean SSC and CK the least, demonstrating the dilution effect: as irrigation amount increased, sugar concentration decreased. Thus water deficit increased the concentration of soluble sugars and so improved fruit quality, shown by treatment T2 giving the highest SSC.
Fontes et al. (2000) found a correlation between fruit size and potassium content: when potassium was at a low level the fruits were small, and when potassium was at a high level the fruits were large and had thick peels. It was showed that the addition of potassium was significant when the irrigation amount was unchanged. Full irrigation and potassium addition resulted in greatest FW (Table 2). Mean SSC was greater for the K1 treatments than for the corresponding K0, which shows that SSC increased when potassium was added. We concluded that potassium addition significantly increased SSC. There were no significant differences in STC between treatments (Table 2), possibly due to the lower starch content at fruit maturation. This result was confirmed by the trend of change in the carbon conversion coefficient k5m(t), which approached zero at the maturation stage (Figure 4).
Carbon accounts for over 90% of plant dry matter (Zhang et al., 2006). Carbon metabolism is affected by plant genetics and by environmental conditions such as light, temperature, humidity, moisture, and mineral nutrients (Hanson and Roje, 2001; Buckley and Mott, 2013). Water stress influences carbon transport, carbon assimilation, carbon partitioning and carbon metabolism in plants. Our experiment shows that Csol was significantly less than Csta during the early development stage (Figure 3) due to the large amount of carbon partitioned for starch synthesis, which resulted in high Csta content. Colombié et al. (2016) showed that at the beginning of ripening, degradation of starch accumulated during early fruit development is an important source of sugars and energy. It is well known that water stress and salt stress increase starch content in the fruit of some tomato cultivars (Mitchell et al., 1991; Gao et al., 1998; Yin et al., 2010; Biais et al., 2014). We found that water deficit treatment T1 resulted in the highest starch content, and that water deficit increased soluble sugar content (Leonardi et al., 2000; Qi et al., 2005). In the early development stage, due to limited sink strength, soluble sugars were stored as starch, which increased starch content, consistent with previous research.
The carbon conversion coefficient k5m(t) in our model showed that starch content peaked during the early development stage. The maximum k5m(t) value of different water treatments during the early development stage of fruit growth was given by treatment T1 (Figure 4). The high initial values of Csta and Cstr gradually decreased and the value of Csol slowly increased as the fruit developed (Figure 3), indicating that carbon allocation was a dynamic process over the entire fruit growth period and suggesting that there were significant differences in carbon allocation during different growth stages (Table 2). The accumulation of starch and other structural carbon compounds occurred mainly during the early development stage, whereas soluble sugars accumulated mainly during the maturation stage.
The intensity of metabolic changes increases as fruit ripens during the final slow growth period, when glucose and fructose continue to accumulate and the concentration of soluble sugars reaches a maximum. The maturation stage is thus critical to sugar accumulation in the fruit (Prudent et al., 2011). There were few significant differences between indicators over the entire growth stage, but we analyzed the indicators at fruit maturation (Table 2) because understanding the distribution and transformation of carbon during the maturation stage is beneficial to analyzing the final formation process of fruit.
Water had a significant effect on carbon partitioning at fruit maturation. Mean Csol and Csta values for water-deficit treatments were significantly greater than for CK, and mean Cstr was significantly less (Table 2 and Figure 5). Starch can be hydrolyzed into soluble sugars by the activity of starch phosphorylase and amylase (Smith et al., 2005), which occurs when carbon is converted from Csta to Csol in fruit. However, structural carbohydrates cannot be converted into soluble sugars. Thus as Cstr increases, Csol decreases at fruit maturation. In comparison to CK, the water deficit treatments will (1) increase the starch and soluble sugar concentrations during fruit ripening, (2) reduce the content of structural carbon, (3) regulate carbon allocation, and (4) improve fruit quality.
The accumulation of sugar and potassium is closely related to fruit ripening. The mechanism driving this correlation has not yet been elucidated, but it could be that potassium ions increase the efficiency of photosynthesis (Lalonde et al., 2003), which could be coupled to their role in phloem transport (Zelmari et al., 2019). We found that the flux of Csupply (dCsup/dt) was significantly greater when potassium was added over the entire growth stage of the tomato fruit, which is consistent with previous results (Supplementary Figure 2). Figure 5 and Table 2 show that potassium addition reduced Csta at fruit maturation in treatments T1K, T2K, and T3K, and that Csol was greater than when potassium was not added. Cstr was decreased considerably in potassium treatments, which indicates that potassium addition may regulate carbon allocation and increase the accumulation of soluble sugars, thus increasing Csol and correspondingly decreasing Cstr.
The SUGAR model of sugar metabolism developed by Génard and Souty (1996) was the first to provide a mechanistic representation of biochemical activity during all growth stages (Lobit et al., 2006). Mechanical models are important tools for investigating and understanding carbon allocation within plants (Génard et al., 2008).
Metabolic activity involved in the synthesis of starch and structural carbon compounds decreases during fruit development (Robinson et al., 1988). This observation is confirmed by the decreases in k3(t) and k5m(t) as DAA increased (Figure 4); both k3(t) and k5m(t) approached zero whether or not potassium was added.
Parameter variation during the critical periods of sugar accumulation can reflect activity during the fruit growth stage. For instance, sugar transported from the source to the sink during the early growth stage is mainly used for synthesis of structural compounds such as cellulose and protein (Keller and Steffen, 1995), as well as other structural compounds in the cell, to maintain normal cell metabolism. The maximum value of k3(t) was found during the early fruit development stage. Sugar and starch were gradually accumulated during the fruit development stage; however, sink strength was limited, and the concentration of structural carbon decreased. Thus, k3(t) was bound to decrease (Figure 4).
Starch accumulation reached a maximum and k5m(t) also reached a maximum during the interval 25–30 DAA. The coefficient of correlation between starch concentration and k5m(t) reached 0.93 (Sweetlove et al., 1999). k3(t) and k5m(t) decreased as DAA increased over the entire growth period and reached minimum values at fruit maturation.
Conclusion
With the assistance of the SUGAR model, we analyzed the effects of water and potassium supply on carbon allocation and conversion of different carbohydrates as indicated in tomato fruit.
The results showed that carbon allocation and transformation changed dynamically during all growth stages, but that the trend of the variation was the same for different water and potassium treatments. The results also showed that the growth stage had a significant effect on carbon allocation. Starch accumulation and the formation of structural carbon compounds were the main forms of carbon found in the early fruit growth stage, and k3 and k5m peaked during this stage. The starch was eventually converted to soluble sugars, and soluble sugars were the main form of carbon found in the fruit at fruit maturation, when k3(t) and k5m(t) decreased to zero.
Potassium addition significantly increased the formation of soluble sugars over the entire growth stage. Potassium addition decreased both Csta and Cstr during fruit maturation compared to no potassium addition.
We concluded that water deficit regulated carbon allocation in tomato fruit and increased soluble sugar content. Potassium application noticeably increased carbon flow from phloem into the fruit. The interactive effect of water and potassium on Cstr during fruit maturation was significant. Both water deficit and potassium application decreases the content of structural carbon in the fruit, thereby improving fruit quality.
Data Availability Statement
All datasets generated for this study are included in the article/Supplementary Material.
Author Contributions
AL did the experiment and finished the first manuscript. SK supervised the work. JC helped to do the experiment.
Funding
This work was supported by the National Natural Science Foundation of China (51790534), and the National Key Research Program (201803210910254).
Conflict of Interest
The authors declare that the research was conducted in the absence of any commercial or financial relationships that could be construed as a potential conflict of interest.
Supplementary Material
The Supplementary Material for this article can be found online at: https://www.frontiersin.org/articles/10.3389/fpls.2020.00712/full#supplementary-material
FIGURE S1 | Details of the experiment site and plant layout in the greenhouse.
FIGURE S2 | Diurnal variation of carbon supply flux between potassium and without potassium treatments during the all growth stages.
References
Agbenin, J. O., and Tiessen, H. (1995). Phosphorus sorption at field capacity and soil ionic strength: kinetics and transformation. Soil Sci. Soc. Am. J. 59, 998–1005. doi: 10.2136/sssaj1995.03615995005900040006x
Almeselmani, M., Pant, R. C., and Singh, B. (2009). Potassium level and physiological response and fruit quality in hydroponically grown tomato. J. Veg. Sci. 16, 85–99. doi: 10.1080/19315260903271526
Bertin, N., and Heuvelink, E. (1993). Dry-matter production in a tomato crop: comparison of two simulation models. J. Pomol. Hortic. Sci. 68:17. doi: 10.1080/00221589.1993.11516441
Biais, B., Bénard, C., Beauvoit, B., Colombié, S., Prodhomme, D., Ménard, G., et al. (2014). Remarkable reproducibility of enzyme activity profiles in tomato fruits grown under contrasting environments provides a roadmap for studies of fruit metabolism. Plant Physiol. 164, 1204–1221. doi: 10.1104/pp.113.231241
Boyd, L. M., and Barnett, A. M. (2011). Manipulation of whole-vine carbon allocation using girdling, pruning, and fruit thinning affects fruit numbers and quality in kiwifruit. J. Am. Soc. Hortic. Sci. 46, 590–595. doi: 10.1007/s10341-011-0126-7
Buckley, T. N., and Mott, K. A. (2013). Modelling stomatal conductance in response to environmental factors. Plant, Cell Environ. 36, 1691–1699. doi: 10.1111/pce.12140
Buttery, B. R., Tan, C. S., Drury, C. F., Park, S. J., Armstrong, R. J., and Park, K. Y. (1998). The effects of soil compaction, soil moisture and soil type on growth and nodulation of soybean and common bean. Can. J. Plant Sci. 78, 571–576. doi: 10.4141/P97-132
Chen, J. L. (2016). Modeling Fruit Growth And Sugar Accumulation And Optimizing Irrigation Scheduling For Improving Water Use Efficiency and Fruit Quality Of Tomato. Doctoral dissertation, China Agricultural University, Beijing.
Colombié, S., Beauvoit, B., Nazaret, C., Bénard, C., Vercambre, G., Gall, L. S., et al. (2016). Respiration climacteric in tomato fruits elucidated by constraint-based modelling. New Phytol. 2, 1726–1739. doi: 10.1111/nph.14301
Dai, Z. W., Vivin, P., Robert, T., Milin, S., Li, S. H., and Génard, M. (2009). Model-based analysis of sugar accumulation in response to source-sink ratio and water supply in grape(Vitis vinifera) berries. Funct. Plant Biol. 36, 527–540. doi: 10.1071/FP08284
Dai, Z. W., Wu, H., Baldazz, V., Leeuwen, C. V., Bertin, N., Gautier, H., et al. (2016). Inter-species comparative analysis of components of soluble sugar concentration in fleshy fruits. Front. Plant Sci. 7:649. doi: 10.3389/fpls.2016.00649
Dogan, E., Kirnak, H., Berekatoglu, K., Bilgel, L., and Surucu, A. (2008). Water stress imposed on muskmelon (cucumis melol.) with subsurface and surface drip irrigation systems under semi-arid climatic conditions. Irrig. Sci. 26, 131–138. doi: 10.1007/s00271-007-0079-7
Feng, P. Y., Chen, S., Zhou, Z. J., and Hu, T. T. (2017). Effect of soil water content on titratable acid content in tomato fruits based on rotatable design. J. Northwest A F Univ. 45, 67–84. doi: 10.13207/j.cnki.jnwafu.2017.11.009
Fontes, P. R., Sampaio, R. A., and Finger, F. L. (2000). Fruit size, mineral composition and quality of trickle-irrigated tomatoes as affected by potassium rates. Pesqui. Agropecu. Bras. 35, 21–25. doi: 10.1590/s0100-204x2000000100003
Gao, Z., Sagi, M., and Lips, S. H. (1998). Carbohydrate metabolism in leaves and assimilate partitioning in fruits of tomato (Lycopersicon esculentum l.) as affected by salinity. Plant Sci. 135, 149–159. doi: 10.1016/s0168-9452(98)00085-5
Gary, C., Andriolo, J. L., Frossard, J. S., and Bot, J. L. (1998). Ontogenic changes in the construction cost of leaves, stems, fruits, and roots of tomato plants. J. Exp. Bot. 49, 59–68. doi: 10.1093/jexbot/49.318.59
Génard, M., and Souty, M. (1996). Modeling the peach sugar contents in relation to fruit growth. J. Am. Soc. Hortic. Sci. 121, 914–923. doi: 10.21273/JASHS.121.6.1122
Génard, M., Baldazzi, V., and Gibon, Y. (2014). Metabolic studies in plant orangs: don’t forget dilution by growth. Front. Plant Sci. 5:85. doi: 10.3389/fpls.2014.00085
Génard, M., Dauzat, J., Nicolás Franck, M., Lescourret, F., Moitrier, N., Vaast, P., et al. (2008). Carbon allocation in fruit trees: from theory to modelling. Trees 22, 269–282. doi: 10.1007/s00468-0070176-5
Génard, M., Lescourret, F., Gomez, L., and Habib, R. (2003). Changes in fruit sugar concentrations in response to assimilate supply, metabolism and dilution: a modeling approach applied to peach fruit (Prunus persica). Tree Physiol. 23, 373–385. doi: 10.1093/treephys/23.6.373
Georgelis, N., Scott, J., and Baldwin, E. (2004). Relationship of tomato fruit sugar concentration with physical and chemical traits and linkage of RAPD makers. J. Am. Soc. Hortic. Sci. 129, 839–845. doi: 10.21273/JASHS.129.6.0839
Ginestar, C., Eastham, J., Gray, S., and Iland, P. (1998). Use of sap-flow sensors to schedule vineyard irrigation. I. Effects of post-veraison water deficits on water relations, vine growth, and yield of shiraz grapevines. Am. J. Enol. Vitic. 49, 413–420. doi: 10.1051/rnd:19730301
Gomez, L., Rubio, E., and Auge, M. (2002). A new procedure for extraction and measurement of soluble sugars in ligneous plants. J. Sci. Food Agric. 82, 360–369. doi: 10.1002/jsfa.1046
Gomez, L., Rubio, E., and Lescourret, F. (2003). Critical study of a procedure for the assay of starch in ligneous plants. J. Sci. Food Agric. 83, 1114–1123. doi: 10.1002/jsfa.1512
Han, Q. H., Jiang, W. J., Yu, H. J., and Wang, M. (2012). Effects of potash applied at different growth phases on tomato yield and quality in greenhouse. Acta Hortic. 944, 45–49. doi: 10.17660/ActaHortic.2012.944.5
Hanson, A. D., and Roje, S. (2001). One-carbon metabolism in higher plants. Annu. Rev. Plant Biol. 52, 119–137. doi: 10.1146/annurev.arplant.52.1.119
Hu, S. J., Tian, C. Y., Song, Y. D., and Gan, Y. D. (2011). Determination and calculation of soil permeability coefficient. Trans. Chin. Soc. Agric. Eng. 27, 68–72. doi: 10.3969/j.issn.1002-6819.2011.05.011
Julie, R., Laurent, U., and Nadia, B. (2016). The potential of the MAGIC TOM parental accessions to explore the genetic variability in tomato acclimation to repeated cycles of water deficit and recovery. Front. Plant Sci. 6:1172. doi: 10.3389/fpls.2015.01172
Keller, E., and Steffen, K. L. (1995). Increased chilling tolerance and altered carbon metabolism in tomato leaves following application of mechanical stress. Physiol. Plant. 93, 519–525. doi: 10.1034/j.1399-3054.1995.930316.x
Keller, M., Smith, J. P., and Bondada, B. R. (2006). Ripening grape berries remain hydraulically connected to the shoot. J. Exp. Bot. 57, 2577–2587. doi: 10.1093/jxb/erl020
Keller, M., Smithyman, R. P., and Mills, L. J. (2008). Interactive effects of deficit irrigation and crop load on cabernet sauvignon in an arid climate. Am. J. Enol. Vitic. 59, 221–234. doi: 10.1016/SO065-2911(07)53004-3
Kobashi, K. (2000). Abscisic acid content and sugar metabolism of peaches grown under water stress. J. Amer. Soc. Hort. Sci. 125, 425–428. doi: 10.1023/A:100873813092
Koundouras, S., Marinos, V., Gkoulioti, A., Kotseridis, Y., and Van Leeuwen, C. (2006). Influence of vineyard location and vine water status on fruit maturation of nonirrigated cv. agiorgitiko (Vitis vinifera L.). effects on wine phenolic and aroma components. J. Agric. Food Chem. 54, 5077–5086. doi: 10.1021/jf0605446
Lalonde, S., Tegeder, M., Throne-Holst, M., Frommer, W. B., and Patrick, J. W. (2003). Phloem loading and unloading of sugars and amino acids. Plant Cell Environ. 26, 37–56. doi: 10.1046/j.1365-3040.2003.00847.x
Leonardi, C., Guichard, S., and Bertin, N. (2000). High vapor pressure deficit influences growth, transpiration and quality of tomato fruits. Sci. Hortic. 84, 285–296. doi: 10.1016/s0304-4238(99)00127-2
Lobit, P., Génard, M., Soing, P., and Habib, R. (2006). Modelling malic acid accumulation in fruits: relationships with organic acids, potassium, and temperature. J. Exp. Bot. 57, 1471–1483. doi: 10.1093/jxb/erj128
Manzoor, A. S., Shahzad, A., Muhammad, O. K., Shazma, A., Haq, N., Farhan, A., et al. (2018). Impact of potassium levels and application timing on dry matter partitioning of Wheat crop in Peshawar valley. Pure Appl. Biol. 8, 9–15. doi: 10.19045/bspab.2018.700158
Mitchell, J., Shennan, C., and Grattan, S. (1991). Tomato fruit yields and quality under water deficit and salinity. J. Am. Soc. Hortic. Sci. 116, 215–221. doi: 10.21273/JASHS.116.2.215
Nguyen-Quoc, B., and Foyer, C. (2001). A role for ‘futile cycles’ involving invertase and sucrose synthase in sucrose metabolism of tomato fruit. J. Exp. Bot. 52, 881–889. doi: 10.1093/jexbot/52.358.881
Norris, I. B. (2006). Soil moisture and growth of contrasting varieties of lolium, dactylis and festuca species. Grass Forage Sci. 37, 273–283. doi: 10.1111/j.1365-2494.1982.tb01607.x
Ojeda, H., Andary, C., Kraeva, E., Carbonneau, A., and Deloire, A. (2002). Influence of pre- and postveraison water deficit on synthesis and concentration of skin phenolic compounds during berry growth of vitis vinifera cv. shiraz. Am. J. Enol. Vitic 53, 261–267. doi: 10.1021/jf0108664
Praxedes, S. C., Fábio, M., DaMatta, J., Loureiro, M. E., FerrO, M. A. G., and Cordeiro, A. T. (2006). Effects of long-term soil drought on photosynthesis and carbohydrate metabolism in mature robusta coffee (coffea canephora pierre var. kouillou) leaves. Environ. Exp. Bot. 56, 263–273. doi: 10.1016/j.envexpbot.2005.02.008
Prudent, M., Lecomte, A., Bouchet, J. P., Bertin, N., Causse, M., and Genard, M. (2011). Combining ecophysiological modelling and quantitative trait locus analysis to identify key elementary processes underlying tomato fruit sugar concentration. J. Exp. Bot. 62, 907–919. doi: 10.1093/jxb/erq318
Qi, H. Y., Li, T. L., and Chen, Y. H. (2005). Effects of foliage applications of KH2PO4 and glucose on photosynthesis and sucrose metabolism of tomato. Trans. Chin. Soc. Agric. Eng. 21, 137–142. doi: 10.3321/j.issn:1002-6819.2005.z2.035
Rao, N. S., Bhatt, R. M., and Sadashiva, A. T. (2001). Tolerance to water stress in tomato cultivars. Photosynthetica 38, 465–467. doi: 10.1023/A:1010902427231
Robinson, N. L., Hewitt, J. D., and Bennett, A. B. (1988). Sink metabolism in tomato fruit I. Developmental changes in carbohydrate metabolizing enzymes. Plant Physiol. 87, 727–730. doi: 10.1104/pp.87.3.727
Sadras, V. O., and McCarthy, M. G. (2008). Quantifying the dynamics of sugar concentration in berries of vitis vinifera cv. shiraz: a novel approach based on allometric analysis. Aust. J. Grape Wine Res. 13, 66–71. doi: 10.1111/j.1755-0238.2007.tb00236.x
Smith, A. M., Zeemann, S. C., and Smith, S. M. (2005). Starch degradation. Annu. Rev. Plant Biol. 56, 73–98. doi: 10.1146/annurev.arplant.56.032604.144257
Sweetlove, L. J., Muller, B., and Wlll, M. L. (1999). The contribution of AGPP to the control of starch synthesis in potato tubers. Planta 20, 330–337. doi: 10.2307/23385792
Terry, L. A., Ilkenhans, T., Poulston, S., Rowsell, L., and Smith, A. J. (2007). Development of new palladium-promoted ethylene scavenger. Postharvest. Biol. Technol. 45, 214–220. doi: 10.1016/j.postharvbio.2006.11.020
Treeby, M. T., Henriod, R. E., Bevington, K. B., Milne, D. J., and Storey, R. (2007). Irrigation management and rootstock effects on navel orange [Citrus sinensis (L.) Osbeck] fruit quality. Agric. Water Manag. 91, 1–32. doi: 10.1016/j.agwat.2007.04.002
Wang, Z. P., Deloire, A., Carbonneau, A., Federspiel, B., and Lopez, F. (2003). An in vivo experimental system to study sugar phloem unloading in ripening grape berries during water deficiency stress. Ann. Bot. 92, 523–528. doi: 10.1006/bbrc.1995.1305
Winter, H., and Huber, S. C. (2000). Regulation of sucrose metabolism in higher plants: localization and regulation of activity of key enzymes. Crit. Rev. Biochem. Mol. Biol. 35, 253–289. doi: 10.1080/10409230008984165
Wu, B. H., Quilot, B., Génard, M., Li, S. H., Zhao, J. B., Yang, J., et al. (2012). Application of a sugar model to analyze sugar accumulation in peach cultivars that differ in glucose–fructose ratio. J. Agric. Sci. 150, 53–63. doi: 10.1017/s0021859611000438
Xue, G. Q., Liu, Q., and Qi, H. Y. (2006). Determination of thirteen metal elements in the plant Foeniculum vulgare mill.by flame atomic absorption spectrophotometry. Spectrosc. Spectr. Anal. 26, 1935–1938. doi: 10.1109/INFOCOM.2006.241
Yelle, S., Hewitt, J. D., Robinson, N. L., and Bennett, A. B. (1988). Sink metabolism in tomato fruit III. analysis of carbohydrate assimilation in a wild species. Plant Physiol. 87, 737–740. doi: 10.1104/pp.87.3.737
Yin, Y. G., Kobayashi, Y., and Sanuki, A. (2010). Salinity induces carbohydrate accumulation and sugar regulated starch biosynthetic genes in tomato (Solanum lycopersicum L. cv.‘Micro-Tom’) fruits in an ABA-and osmotic stress-independent manner. J. Exp. Bot. 61, 563–574. doi: 10.1093/jxb/erp333
Zelmari, A., Rob, R., Liao, S. Y., Barril, C., Deloire, A. J., and Clarke, S. J. (2019). Expression patterns of genes encoding sugar and potassium transport proteins are simultaneously upregulated or downregulated when carbon and potassium availability is modified in shiraz (Vitis vinifera L.) berries. Plant Cell Physiol. 60, 2331–2342. doi: 10.1093/pcp/pcz130
Zhang, G. H., Sui, X. L., Guo, Y. H., Yuan, L. P., and Zhang, Z. X. (2006). Effect of Fertilization Levels on the Photosynthetic Physiology of Tomato in Helio-Greenhouse. J. Shenyang Agric. Univ. 37, 317–321. doi: 10.1360/aps040178
Keywords: fruit quality, carbon allocation and transformation, SUGAR model, potassium, water deficit
Citation: Luo A, Kang S and Chen J (2020) SUGAR Model-Assisted Analysis of Carbon Allocation and Transformation in Tomato Fruit Under Different Water Along With Potassium Conditions. Front. Plant Sci. 11:712. doi: 10.3389/fpls.2020.00712
Received: 26 November 2019; Accepted: 05 May 2020;
Published: 05 June 2020.
Edited by:
Brian N. Bailey, University of California, Davis, United StatesReviewed by:
Valentina Baldazzi, Institut Sophia Agrobiotech, FranceWang Xiukang, Yan’an University, China
Copyright © 2020 Luo, Kang and Chen. This is an open-access article distributed under the terms of the Creative Commons Attribution License (CC BY). The use, distribution or reproduction in other forums is permitted, provided the original author(s) and the copyright owner(s) are credited and that the original publication in this journal is cited, in accordance with accepted academic practice. No use, distribution or reproduction is permitted which does not comply with these terms.
*Correspondence: Shaozhong Kang, a2FuZ3N6QGNhdS5lZHUuY24=