 Deepender Kumar1,2†
 Animesh Kumar3†Vinod Chhokar1Om Prakash Gangwar4Subhash Chander Bhardwaj4M. Sivasamy5S. V. Sai Prasad6
 T. L. Prakasha6
 Hanif Khan2
 Rajender Singh2
 Pradeep Sharma2
 Sonia Sheoran2
 Mir Asif Iquebal3
 Sarika Jaiswal3Ulavappa B. Angadi3Gyanendra Singh2
 Anil Rai3
 Gyanendra Pratap Singh2
 Dinesh Kumar3*
 Ratan Tiwari2*
- 1Department of Bio and Nanotechnology, Guru Jambheshwar University of Science and Technology, Hisar, India
- 2ICAR-Indian Institute of Wheat and Barley Research, Karnal, India
- 3ICAR-Indian Agricultural Statistics Research Institute, New Delhi, India
- 4ICAR-Indian Institute of Wheat and Barley Research, Regional Station, Shimla, India
- 5ICAR-Indian Agricultural Research Institute, Regional Station, Wellington, India
- 6ICAR-Indian Agricultural Research Institute, Regional Station, Indore, India
Among several important wheat foliar diseases, Stripe rust (YR), Leaf rust (LR), and Stem rust (SR) have always been an issue of concern to the farmers and wheat breeders. Evolution of virulent pathotypes of these rusts has posed frequent threats to an epidemic. Pyramiding rust-resistant genes are the most economical and environment-friendly approach in postponing this inevitable threat. To achieve durable long term resistance against the three rusts, an attempt in this study was made searching for novel sources of resistant alleles in a panel of 483 spring wheat genotypes. This is a unique and comprehensive study where evaluation of a diverse panel comprising wheat germplasm from various categories and adapted to different wheat agro-climatic zones was challenged with 18 pathotypes of the three rusts with simultaneous screening in field conditions. The panel was genotyped using 35K SNP array and evaluated for each rust at two locations for two consecutive crop seasons. High heritability estimates of disease response were observed between environments for each rust type. A significant effect of population structure in the panel was visible in the disease response. Using a compressed mixed linear model approach, 25 genomic regions were found associated with resistance for at least two rusts. Out of these, seven were associated with all the three rusts on chromosome groups 1 and 6 along with 2B. For resistance against YR, LR, and SR, there were 16, 18, and 27 QTL (quantitative trait loci) identified respectively, associated at least in two out of four environments. Several of these regions got annotated with resistance associated genes viz. NB-LRR, E3-ubiquitin protein ligase, ABC transporter protein, etc. Alien introgressed (on 1B and 3D) and pleiotropic (on 7D) resistance genes were captured in seedling and adult plant disease responses, respectively. The present study demonstrates the use of genome-wide association for identification of a large number of favorable alleles for leaf, stripe, and stem rust resistance for broadening the genetic base. Quick conversion of these QTL into user-friendly markers will accelerate the deployment of these resistance loci in wheat breeding programs.
Introduction
Among the many foliar diseases of wheat, rusts are the economically most significant fungal diseases threatening the food security of the world’s growing population. There are three types of rusts in wheat, stripe, or yellow rust (YR) caused by the fungus Puccinia stritiformis Westend. f.sp. tritici Eriks. (Pst), leaf, or brown rust (LR) caused by Puccinia triticina Eriks. (Pt), and stem or black rust (SR) caused by Puccinia graminis Pers. f. sp. tritici Eriks. & Henn. (Pgt). More than sixty wheat-producing countries distributed in all continents other than Antarctica have encountered the rusts proving their widespread presence. The damage caused by YR can be as high as 70% in case cultivars are susceptible and the climatic conditions are favorable for an early infection (Chen, 2005). LR has a widespread geographical presence causing considerable yield losses (Marasas et al., 2002). At an early onset, it causes much more damage to crop resulting in yield losses as compared to stem and stripe rusts (Bolton et al., 2008; Huerta-Espino et al., 2011). SR inflicts losses up to USD 1.12 billion worldwide which results particularly due to a reduction in yield and hampered end-use quality of the crop (Pardey et al., 2013). All three rusts pose a major threat to Indian farmers as well. North Indian conditions support the survival and spread of the YR fungal spores. LR is more prevalent in the whole of India as the disease is favored by intermediate temperatures. Also, LR is the most widely distributed amongst rusts and commonly visible in all wheat growing areas during the season. SR is contained mostly in the southern states of the country and survives throughout the year in the Nilgiri hills of southern India (Joshi et al., 1985; Nagarajan and Joshi, 1985).
In disease management practices, planting resistant varieties is the most economical, efficient, and ecologically acceptable tool to manage wheat rusts worldwide (McIntosh et al., 1995; Wiesner-Hanks and Nelson, 2016). Wheat cultivars with diverse resistance are deployed in different areas keeping in mind the pathotype distribution of three Puccinia species on wheat. To date, the reported number of officially designated resistance genes are more than seventy against both YR (78) and LR (77) in addition to about sixty designated resistance genes against SR (McIntosh et al., 2017). Two recently identified Yr genes Yr79 (Feng et al., 2018) and Yr80 (Nsabiyera et al., 2018) have been added to the rust-resistant gene library. Resistance to multiple rusts can be broadly categorized as all stage or seedling resistance (ASR) and adult-plant resistance (APR). Of these reported genes, many genes provide resistance at the seedling stage of plants (McIntosh et al., 2017). Since seedling genes are pathogen race-specific, the cell death phenomenon is activated due to plant hypersensitive response preventing pathogen spread (Ellis et al., 2014; Mondal et al., 2016). This also puts intense selection pressure on the pathogen for its survival. In such cases, pathogen evades and evolves itself which in result renders the deployed all stage resistance gene to be ineffective in a very short time (Line and Qayoum, 1992; Burdon et al., 2014; Li et al., 2014; Niks et al., 2015). The rust resistant wheat with ASR favors the selection of new pathotypes that multiply without any competition on the resistant host resulting in susceptibility of the cultivar/gene. Several all stage resistant Yr genes have become susceptible for instance Yr2, Yr6 to Yr9, Yr17, and Yr 27 (Singh et al., 2008). Other genes such as Lr1, Lr13, Lr24, Lr26, Lr37; Sr6, Sr8a, and Sr11 against LR and SR also succumbed (Kolmer et al., 2007; McIntosh et al., 2009, 2014; Ellis et al., 2014). A well-known outbreak causing great loss of yield was witnessed in the year 1998 due to the new Pgt virulent race Ug99. This resulted in the failure of ASR Sr genes Sr24, Sr31, Sr36, and SrTmp in subsequent years with the emergence of its new variants (Pretorius et al., 2000, 2010; Jin et al., 2007, 2008, 2009; Visser et al., 2011; Newcomb et al., 2016). On the other hand, APR resistance is usually governed by multiple genes and quantitatively gets less influenced by race-specific pathogens. The involved genes provide non-race-specific partial resistance to all the pathotypes of a given pathogen species, thus making it more durable (Lagudah, 2011; Burdon et al., 2014). Despite the fact that incorporating APR into new cultivars can be difficult when compared to ASR, it was found that many wheat cultivars possessing APR showed durable resistance (Mcintosh, 1992; Boyd, 2005; Navabi et al., 2005; Singh et al., 2005; Ren et al., 2012b; Chen, 2013; Randhawa et al., 2018). Some APR genes when used in combinations have been known to possess durable pleiotropic resistance against multiple wheat rusts and powdery mildew, i.e., Lr34/Yr18/Sr57/Pm38 (on chromosome 7DS), Lr46/Yr29/Sr58/Pm39 (on chromosome 1BL), and Lr67/Yr46/Sr55/Pm46 (on chromosome 4DL) (Lagudah, 2011; Risk et al., 2012; Ellis et al., 2014), of which Lr34 has been studied extensively in different crops including rice, barley, maize, and sorghum (Krattinger et al., 2013, 2019). Deployment of seedling (all-stage resistance), adult plant (non-race specific and race-specific) and slow rusting resistance is to create diversity for resistance (Bhardwaj et al., 2019b). The wheat lines possessing rust resistance at the seedling stage will remain resistant during the whole life of a wheat variety. Therefore, both types of resistance can be amalgamated to strengthen more extended and durable resistance in the future.
As most of the ASR genes go ineffective in the long run and APR genes have only minor effects, more resistance associated genomic regions are needed to be identified and utilized in wheat genetic improvement for rust resistance. Not all of the QTL identified so far were explored for use in marker-assisted selection (MAS). Therefore, finding user-friendly markers becomes even more necessary (Zeng et al., 2019). With the advent of NGS technologies, it became possible to develop high-throughput Single Nucleotide Polymorphism (SNP) markers which are abundant, co-dominant, and present throughout the wheat genome (Allen et al., 2013; Rasheed et al., 2016; Wu et al., 2017, 2018). These markers have advantages over traditional PCR based markers (Chen et al., 1998; Röder et al., 1998; Ren et al., 2012b; Rosewarne et al., 2013; Zhou et al., 2014) for being high-throughput, low cost for genotyping, high efficiency, and allele specificity (Gupta et al., 2008; Colasuonno et al., 2014; Semagn et al., 2014; Long et al., 2017). Genotyping by sequencing (GBS) and array-based SNP genotyping platforms are utilized globally. Several SNP arrays are now available in the market viz. 9K (Cavanagh et al., 2013), 15K (Boeven et al., 2016), 35K (Allen et al., 2017), 50K (Bayer et al., 2017), 90K (Wang et al., 2014), 55K, 660K (Jia and Zhao, 2016), and 820K (Winfield et al., 2016). Genome-wide association studies (GWAS) using these chips have certain advantages over bi-parental QTL mapping. Genetic architecture of complex traits in diverse germplasm collections can be studied using GWAS, which detects the genomic regions present in linkage disequilibrium (LD) with genes associated with the trait under study (Hall et al., 2010; Zhao et al., 2011; Riedelsheimer et al., 2012). Due to the accumulation of historical chromosomal recombinations over several generations in a natural population, QTL can be identified using GWAS at a higher mapping resolution (Yu and Buckler, 2006; Semagn et al., 2010). GWAS has been successfully used to study various traits in wheat such as grain yield (Sukumaran et al., 2018), eyespot disease resistance (Zanke et al., 2017), pre-harvest sprouting resistance (Zhou et al., 2017), 36 agro-morphological traits (Sheoran et al., 2019) and so on.
The current study was undertaken with the objective of performing a large-scale association study for identifying genomic regions responsible for resistance to the three rusts from a very diverse set of germplasm comprising of improved genotypes, released varieties, exotic collection, genetic stocks, landraces, and some mutant lines. The study was focused on both seedling and adult plant stage rust response under controlled and natural field conditions, respectively. To identify seedling resistance, the most virulent and predominantly prevalent pathotypes were used to challenge the wheat material in this study. Care was taken to select pathotypes with varied avirulence and virulence structure which would knock down most of the genes in present-day wheat material (Bhardwaj, 2011). Keeping the aforesaid points into consideration seven pathotypes of Pgt (Prasad et al., 2018), five pathotypes of Pst (Gangwar et al., 2019), and six pathotypes of Pt (Bhardwaj et al., 2019a) were selected for screening wheat material at seedling stage under controlled conditions. The optimum conditions ensure foolproof evaluation and selection of rust resistant material. The SNP marker enabled the identification of genomic regions associated with disease resistance will be further firmed up so as to harness less exploited resistant genes for broadening the resistance base thereby avoiding any substantial losses due to rust diseases.
Materials and Methods
Plant Materials and Genotyping
The diverse panel of 483 genotypes mentioned in our previous report (Kumar et al., 2020) was used for this study. The germplasm comprised of the exotic collection (34), genetic stocks (44), improved genotypes (120), landraces (96), mutant lines (2), and varieties (187). Genotypes in the panel are adapted to different agro-climatic zones of India. Henceforth, this diverse panel will be recalled as rust association mapping panel (RAMP). Genotyping of the panel was done using 35K Axiom® Wheat Breeder’s Array (Allen et al., 2017, Affymetrix UK Ltd., United Kingdom) as per manufacturer’s guidelines with 35,143 SNP markers. The genotyping data was filtered by retaining markers with minor allele frequency (MAF) > 5%, genotypes with <10% missing SNP calls, and markers with <10% missingness. The obtained markers were further ordered according to the genetic map available at CerealDb (Wilkinson et al., 2012; Allen et al., 2017). This resulted in a selection of 14,650 polymorphic SNP markers as described previously (Kumar et al., 2020) for subsequent genetic analyses.
Phenotypic Evaluation for Stripe Rust, Stem Rust, and Leaf Rust
The RAMP was evaluated for stripe rust (YR), stem rust (SR), and leaf rust (LR) both at the seedling stage in controlled conditions and at the adult plant stage in the field under natural disease pressure.
The seedling resistance test (SRT) was performed on this panel against five, six, and seven rust pathotypes/races for Pst, Pt, and Pgt respectively. The selection of pathotypes was based on the virulence and their prominence. They are namely YR_110S84, YR_110S119, YR_T, YR_238S119, YR_46S119 for Pst, LR_77-1, LR_77-5, LR_77-9, LR_12-5, LR_104, LR_106-2 for Pt and SR_40A, SR_21A2, SR_11, SR_34-1, SR_40-3, SR_117-6, SR_122 for Pgt. SRT was done under glasshouse conditions at Regional Station, ICAR-Indian Institute of Wheat and Barley Research (IIWBR), Shimla, India. The avirulence/virulence formulae for the 18 pathotypes are provided in Supplementary Table S1. The experiments were performed as mentioned by Bhardwaj (2011). The disease response recorded as infection type (IT) using Stakman scale (Stakman et al., 1962) was converted to a modified linear 0-9 scale (Riaz et al., 2016) as follows: 0; = 0, ;- = 0.5, ; = 1, 1- = 1.5, 1 = 2, 1 + = 3, 2- = 4, 2 = 5, 2 + = 6, 3- = 6.5, 3 = 7, 3 + = 8 and 4 = 9, where average was considered in case of complex scores. Genotypes with an IT score of >0 to <3, >3 to <6, and >6 to <9 were considered as resistant, moderate, and susceptible, respectively (Table 1). Taking pedigree relationships into consideration, the postulation of resistance genes were made by comparing the IT response of the pathotypes on the test lines with controls of known resistance genes.
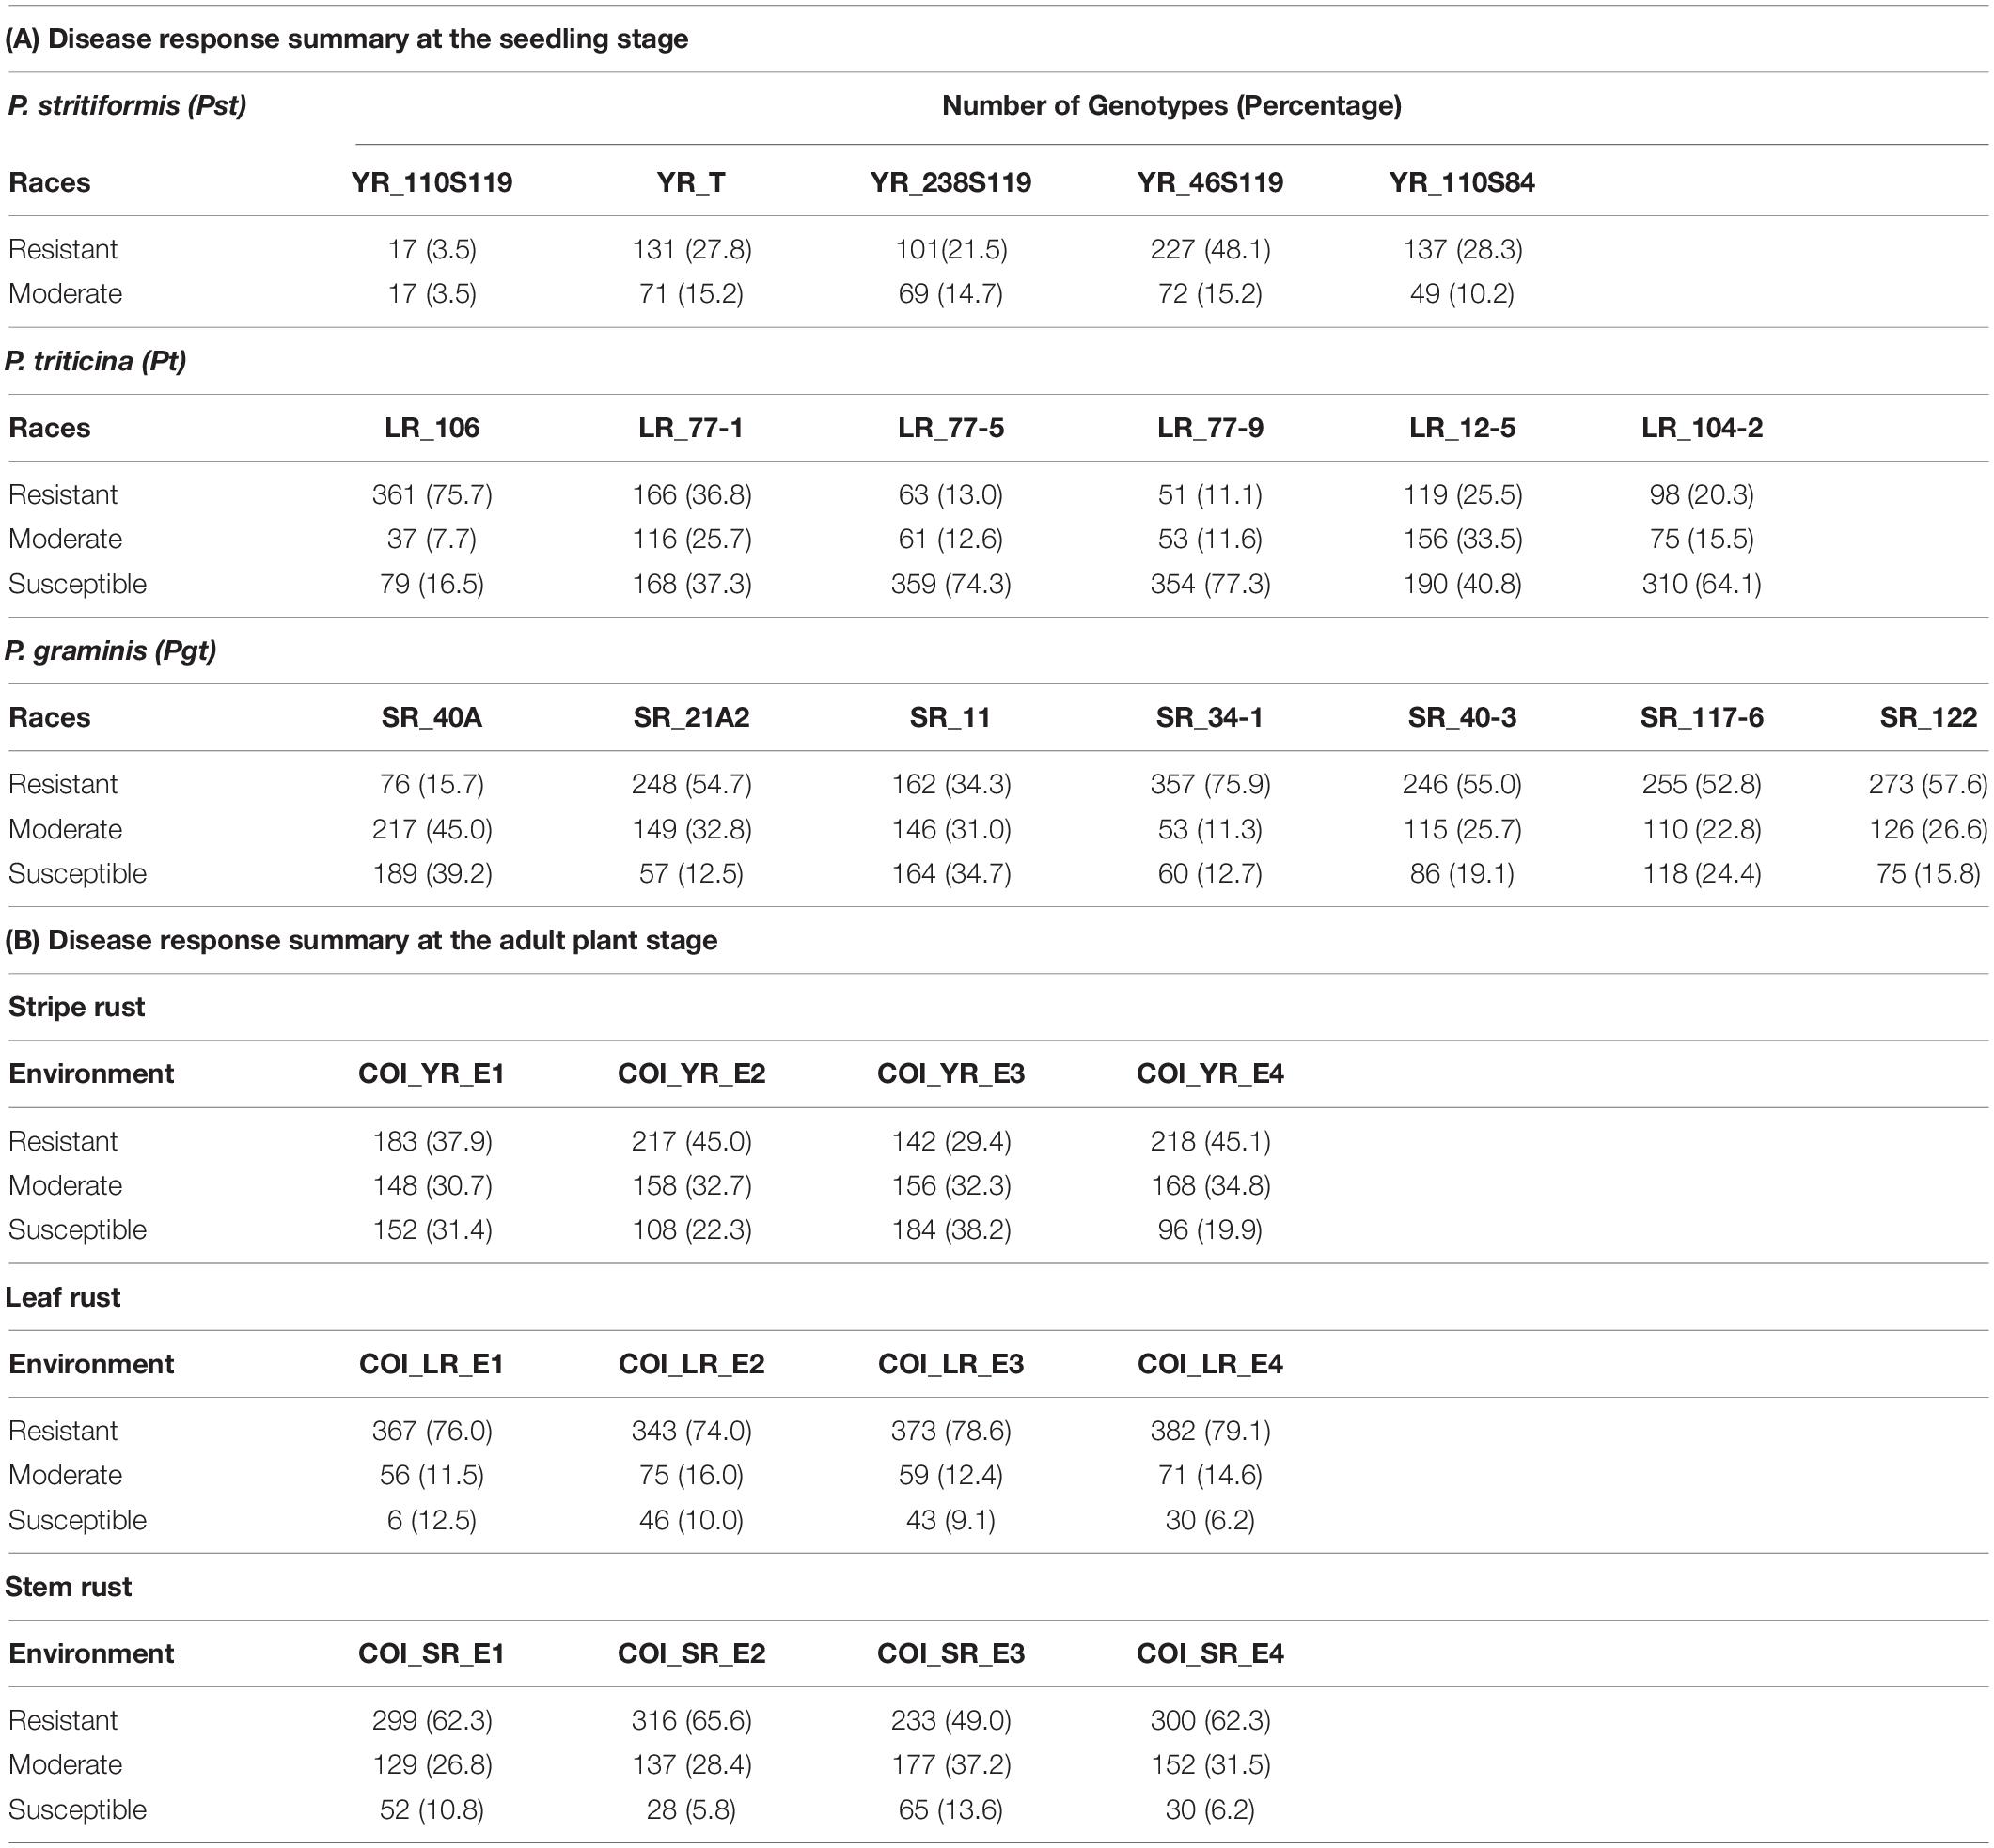
Table 1. Summary of yellow rust, leaf rust, and stem rust responses at the seedling and adult plant stages.
Field evaluation of YR was done at two locations for two consecutive years viz. 2017-18 and 2018-19. By counting each location and year as one environment, a total of four environments (E1-E4) were considered. The plants were sown at seed farm, Uchani (29°42′48.7″N, 76°59′51.3″E), Haryana, India and ICAR-IIWBR, Karnal (29°42′10.0″N, 76°59′29.7″E), Haryana, India. These locations come under stripe rust-prone areas in the Northern region of India suitable to study natural disease pressure. Similarly, field evaluation for SR and LR was done at two locations for two years. The locations were ICAR-Indian Agricultural Research Institute (IARI), Regional Station, Wellington (11°22′47.5″N, 76°46′26.1″E), Tamil Nadu, India and ICAR-IARI, Regional Station, Indore (22°42′31.3″N, 75°53′29.2″E), Madhya Pradesh, India. These locations are prone to natural disease pressure of stem and leaf rusts. A total of 12 environments (4 for each rust) were considered for this study (Supplementary Table S2). The seeds were planted in a non-replicated augmented block design with single row of 1 m and the distance between two rows was 0.3 m. The planting was done in the first fortnight of November at Indore and Wellington and in the second fortnight at Karnal and Uchani, each year. A mixture of check lines susceptible to multiple rusts was planted as infector rows (at every 20th single row) and in spreader rows (perpendicular to the 1 m rows) surrounding the plot for establishing sufficient inoculum and uniform disease development. To ensure uniform disease distribution, spores were collected from the early infections that appeared naturally in the spreader rows and were used to inoculate the infector rows. The response to rust was recorded using disease severity (DS) and infection response (IR) as the two measures. DS was measured using the modified Cobb scale (Peterson et al., 1948) as an estimation of percentage coverage (0, 5, 10, 20, 40, 60, 80, and 100) of rust pustules (uredinia) over the flag leaf. IR was scored as a host reaction to rust pustules and converted to a 0–1 scale (Roelfs et al., 1992). The lines showing the mixed response of moderately resistant to moderately susceptible or vice-versa, were considered as the fifth category other than mentioned in Roelfs et al. (1992). Therefore, five scoring categories considered for the evaluation were: Resistant (R) = 0.2, Moderately Resistant (MR) = 0.4, Mixed response (M) = 0.6, Moderately Susceptible (MS) = 0.8, and Susceptible (S) = 1. Data were recorded at weekly intervals for three times when the flag leaves of the susceptible checks showed a disease score of 60S (DS: 60; IR: S). Out of these multiple scores of a test line, the one with the score tending toward susceptibility was kept for the study. These were further considered for GWAS in each environment by combining the two measures into a single value as coefficient of infection (COI). It is the product of DS and IR on a 0–100 linear scale (Loegering, 1959; Roelfs et al., 1992). Genotypes with COI scores of 0 to 20 were considered as resistant, with score ≥ 60 as susceptible and the remaining as moderate (Table 1). COI was assumed to be suitable for GWAS and as a primary trait for the identification of significant marker-trait associations (MTAs) since it combines both the information from DS and IR for rust response (Yu et al., 2012; Gao et al., 2016, 2017; Mihalyov et al., 2017).
Statistical Analysis
The phenotype data (IT, IR, DS, COI) for the three rusts were visualized and considered for studying Pearson’s correlation in R statistical programming. Correlation plots for each rust describing the correlation of disease scores between different pathotypes and environments were created using corrplot R package. Mean comparison tests were performed for IT and COI among population structure based groups using Levene’s test (Levene, 1960) dependent two-way t-test at a significance level of P < 0.05 in the R program. The normality of the original data was tested using the Shapiro-Wilk test in IBM SPSS Statistics v.22.
A Restricted Maximum Likelihood (REML) approach (Corbeil and Searle, 1976) in R package “lme4” (Bates et al., 2015) was used for estimating variance components for IR and DS from field experiments for the three rusts. A linear mixed model was fitted by considering the overall mean as fixed effect and other factors as random effects. The random effects included genotype (g), location (e), genotype × location interaction (g × e) and year (as replication, r). Following model was applied to estimate variance components:
Where, ypq is the observation for the genotype p at location q in season r, μ is the overall mean, gp the effect of the genotype p, eq the effect of location q, rq the effect of year (season) r, gepq the interaction between accession p within location q, and epq the residual.
Broad sense heritability (H2) was estimated by using the following equation:
Where, is the genotypic variance, is the environmental variance, is the genotype by environment interaction variance, and is the residual error variance and t is the number of years for each location or location by year for the estimates of heritability across all environments. To estimate the stability of genotypes in response to YR, LR, and SR infection in their respective four environments, COI scores were used to perform GGE biplot (genotype × environment interaction) in R package GGEBiplotGUI (Frutos et al., 2014). The COI scores were reversed with reference to maximum score so that the resistant genotypes can have higher scores aiding the interpretation of stable resistant genotypes across environments.
Linkage Disequilibrium (LD), Population Structure, and Genetic Diversity
For the complete RAMP, LD analysis was performed across A, B, and D genomes separately. Intra-chromosomal pairwise marker LD as squared allele-frequency correlations (r2) values were calculated in TASSEL v5.2 (Bradbury et al., 2007) using a sliding window approach with default parameters. As a function of genetic distance, the estimated r2− values for significant SNP marker pairs were plotted to understand the extent of LD. A second-degree “loess” function (Cleveland, 1981) in the R statistical program was fitted to estimate the rate of LD decay over genetic distance (cM). Critical r2− values were estimated as the 95th percentile of square root transformed r2− values of the unlinked SNP marker pairs (Breseghello and Sorrells, 2006) showing a distance of more than 50 cM for each genome. It indicates the point beyond which the LD is caused by genetic linkage (Breseghello and Sorrells, 2006). The genetic distance at which LD fell below the critical r2− value was considered as the confidence interval (CI) of quantitative trait loci (QTL) in this study. In other words, the point of intersection between LD decay loess curve and critical r2 was used to adjust the QTL-CI in terms of genetic distance.
The population structure and genetic diversity for the RAMP were previously described by Kumar et al. (2020). Briefly, the population structure was estimated with LD-based pruned markers using a Bayesian based model. The optimal number of subpopulations (i.e., K = 2) was determined using parallel runs in STRUCTURE 2.3.4 (Pritchard et al., 2000) with the Linux based python program “StrAuto” (Chhatre and Emerson, 2017). In addition, principal component analysis was also performed on the study panel using 14,650 SNP markers using ‘prcomp’ function in the R statistical programming language.
Marker-Trait Association Analysis
The seedling response under greenhouse condition and field evaluation for adult plant response were considered for finding out associations. In order to identify the loci associated with the response, 14,650 SNP markers and phenotypic trait values for seedling (IT) and adult plant (COI) responses were used to conduct genome-wide association analyses. For the estimation of marker-trait associations (MTAs), Genomic Association and Prediction Integrated Tool (GAPIT) (Lipka et al., 2012) was used by implementing compressed mixed linear model (CMLM) (Yu et al., 2006; Zhang et al., 2010) in R environment. A marker-based VanRaden kinship (K) matrix (VanRaden, 2008) for the 483 accessions was also generated using GAPIT. The K and Q (Kumar et al., 2020) matrices were considered as random and fixed components, respectively, to avoid any spurious associations caused by population structure. Some additional association testing models were analyzed to compare the observed probability deviations from the expected distribution based on the Q-Q plots. A general linear model with kinship only and no correction for population structure (GLM_K), GLM (GLM_PC3.K), and mixed linear model (MLM_PC3.K) with kinship and the first three principal components, MLM with kinship and correction for population structure (MLM_Q.K), and MLM with kinship only (MLM_K) were considered. The comparison was done based on P-values and respective Q-Q plots for the MTAs obtained from GAPIT. All the comparative Q-Q plots and circular Manhattan plots were generated using the CMplot R package1.
GWAS was conducted on each rust pathotypes separately to identify race-specific seedling resistance loci. In the case of identifying resistance loci in the adult plant stage, COI was considered for each rust in four environments. Each environment (Supplementary Table S2) was considered as a unique set of phenotypic data to be considered for GWAS. The percentage of phenotypic variation explained by the MTA (R2) was calculated as the difference of R2 without SNP from R2 with SNP of the GAPIT model (Abed and Belzile, 2019; Garcia et al., 2019). High stringency was observed in GAPIT for false discovery rate (FDR) adjusted p-values. SNP markers were declared significantly associated at p ≤ 0.001 {-log10(p) ≥ 3} in the selected model. Hence, a liberal approach similar to previous studies (Pasam et al., 2012; Zegeye et al., 2014; Gao et al., 2016; Visioni et al., 2018), was considered so as to reduce the chance of neglecting any significantly associated marker annotating for disease resistance. A putative QTL was designated for intra-chromosomal SNPs of the MTAs detected and fall within the range for QTL-CI defined by LD. A representative SNP for such putative QTL was selected with the lowest p-value as the most significantly associated SNP.
Significant markers observed were further subjected to in silico annotation. The flanking sequence of these markers was obtained from the EnsemblPlants database spanning 1 kb both upstream and downstream of the SNP position2. In order to obtain the reference physical map positions of these markers, the flanking sequence was used to make a query against IWGSC RefSeq v1.0 (Appels et al., 2018). The flanking region of the significant SNP was then used to explore candidate gene overlapping with this region by using JBrowse (Skinner et al., 2009) from URGI (Unité de Recherche Génomique Info/research unit in genomics and bioinformatics). Annotations of found overlapping candidate genes were obtained from IWGSC Annotation v1.1. For candidate genes with unavailable annotations, the orthologous genes from Triticum urartu and Aegilops tauschii with highly similar sequences were considered for prediction of gene function in wheat by implementing BLASTn3. Further, annotations for SNPs (e.g., intergenic variants) with no overlapping gene were searched using a similar approach. The annotations were then confirmed against the protein sequences for determining putative molecular functions in wheat using BLASTx with default parameters in the Blast2Go v5.2 tool (Conesa and Götz, 2008). This could provide aid in the identification of putative candidate genes for disease resistance.
Results
Phenotypic Evaluation of Seedling and Adult Plant Stage
The phenotypic data recorded for disease response to pathotypes of three Puccinia species on wheat at seedling stage (IT) under controlled conditions and adult plant stage under field conditions (IR, DS, and COI) have been provided in Supplementary Table S3. In the panel, rust gene postulation was successfully done in about 240 genotypes based on response to multi-pathotype testing at seedling stage. Known resistance genes for the three rusts were postulated mostly in varieties (139) followed by improved genotypes (93) and few genetic stocks (12) (Supplementary Table S3).
Seedling Response to P. stritiformis Pathotypes
On the linear scale of 0–9, IT scores ranged from 0 (as most resistant) to 8 (as susceptible) for the Pst pathotypes. Of the 5 Pst pathotypes, based on IT scores, 93, 63.7, 61.4, and 56.9% of the tested lines were found susceptible toYR_110S119, YR_238S119, YR_110S84, and YR_T, respectively (Table 1 and Figure 1A). This indicates YR_110S119 being the most virulent in the current study panel. On the other hand, pathotype YR_46S119 was found to be avirulent with 48.1% of the tested lines as resistant and 36.6% as susceptible. The mean IT scores for YR_110S119, YR_238S119, YR_110S84, YR_T, and YR_46S119 were 7.56, 5.64, 5.26, 5.11, and 3.51, respectively. Except for YR_46S119, the IT scores for other pathotypes were skewed toward susceptibility (Supplementary Table S4). The phenotypic correlation coefficients among pairs of the five pathotypes were observed to be significant (at P < 0.01, 0.001) and in the range of 0.09 (YR_110S119-YR_T) to 0.23 (YR_46S119-YR_110S84) (Supplementary Table S5 and Supplementary Figure S1).
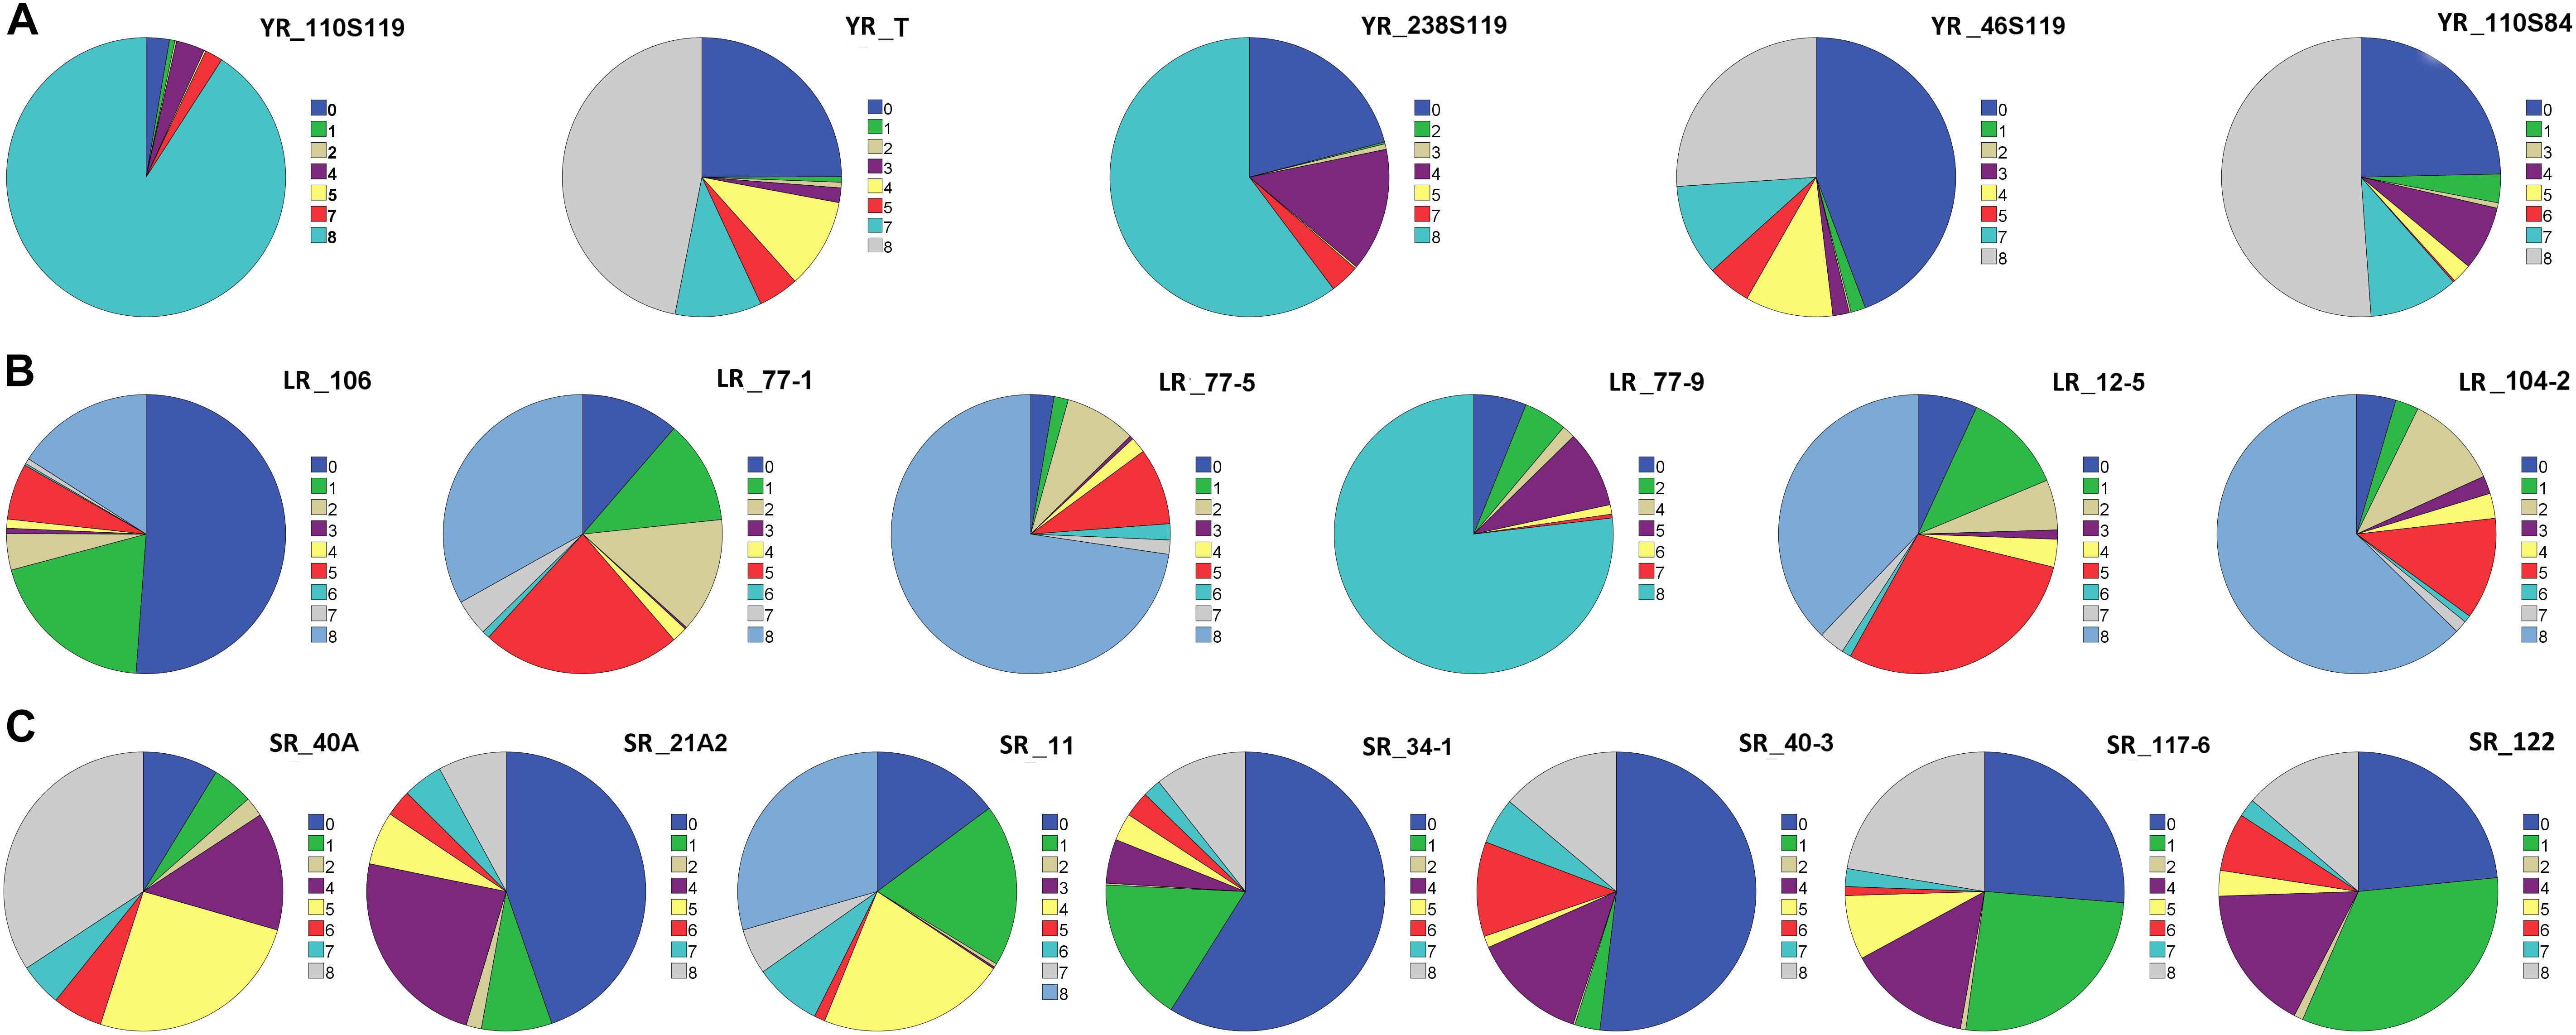
Figure 1. Pie chart representation of seedling response against (A) five pathotypes of stripe rust (YR), (B) six pathotypes of leaf rust (LR), and (C) seven pathotypes of stem rust (SR) of rust association mapping panel (RAMP). The color legend on the right side of each pie chart represents the infection type (IT) score. The magnitude of arc length is directly proportional to the frequency of genotypes showing corresponding IT scores.
Seedling Response to P. triticina Pathotypes
Based on the IT score with a range of 8, pathotype LR_106 was found to be relatively avirulent based on response to the current study panel. More than two-third (75.7%) of the tested lines were found resistant against LR_106 (Table 1 and Figure 1B). Among other Pt pathotypes, LR_77-9 was the most virulent followed by LR_77-5 and LR_104-2 with 77.3, 74.3, and 64.1% of the tested lines to be scored as susceptible, respectively. LR_12-5 and LR_77-1 were found to have an intermediate virulent response on the tested lines (Table 1). Mean IT scores for LR_106, LR_77-5, LR_104-2, LR_77-9, LR_12-5, and LR_77-1 were 1.87, 6.68, 6.10, 6.80, 5.00, and 4.43, respectively, with skewness toward susceptibility except for LR_106 (Supplementary Table S4). Significant correlation coefficients (at P < 0.001) among pairs of six Pt pathotypes ranged from 0.26 (LR_106-LR_77-9) to 0.57 (LR_106-LR_77-1) (Supplementary Table S5 and Supplementary Figure S1).
Seedling Response to P. graminis Pathotypes
Of the 7 Pgt pathotypes, none of them were found to be virulent on a range of 8 IT score. SR_40A can be designated as mildly virulent where only 39.2% of the tested lines were susceptible. For pathotypes SR_21A2, SR_34-1, SR_40-3, SR_117-6, and SR_122, resistant reactions were observed in 54.7, 75.9, 55.0, 52.8, and 57.6% genotypes. For SR_11, the tested lines showed similar type of response in resistant (34.3%), intermediate (31.0%), and susceptible (34.7%) category (Table 1 and Figure 1C). Mean IT responses for SR_40A, SR_21A2, SR_11, SR_34-1, SR_40-3, SR_117-6, and SR_122 were 5.299, 2.452, 4.206, 1.617, 2.721, 3.079, and 2.623, respectively, with skewness toward resistance except for SR_40A and SR_11 (Supplementary Table S4). Correlation coefficients between the seven Pgt pathotypes were found significant (at P < 0.001) and ranged from 0.34 (SR_21A2- SR 40-3) to 0.68 (SR_34-1-SR_117-6) (Supplementary Table S5 and Supplementary Figure S1).
Adult Plant Field Response to Stripe Rust
Infection response (IR) with an average score of 0.5 was recorded at environments YR_E1 and YR_E2, whereas at YR_E3 and YR_E4, it was 0.6 (Supplementary Table S3). The distribution of IR was found to be non-biased for any single response category (Figure 2A). An average disease severity (DS) score of 62.5 at YR_E3 was found maximum among the four environments. DS with scores of 60-80 was found in most of the tested lines in all environments (Figure 2B and Supplementary Table S3). Based on the coefficient of infection (COI) as the disease response at four environments (COI_YR_E1-E4), stripe rust-resistant lines were found to be falling in more than one environment. In the RAMP, 37.9, 45.0, and 45.1% of the genotypes were recorded as resistant with a COI score from 0 to 20, in environments COI_YR_E1, COI_YR_E2, and COI_YR_E4, respectively (Table 1 and Figure 3A). Highly significant (at P < 0.001) Pearson’s correlation coefficients between IR, DS, and COI across four environments showed positive correlations (Supplementary Table S6 and Figure 3B). Strong correlation coefficients (R = 0.8–0.9) were observed between COI with IR and DS within the environment, whereas, it ranged from 0.6-0.8 between IR and DS. For COI among environments, strong values of R were detected between YR_E1 with YR_E2 and YR_E3 with YR_E4.
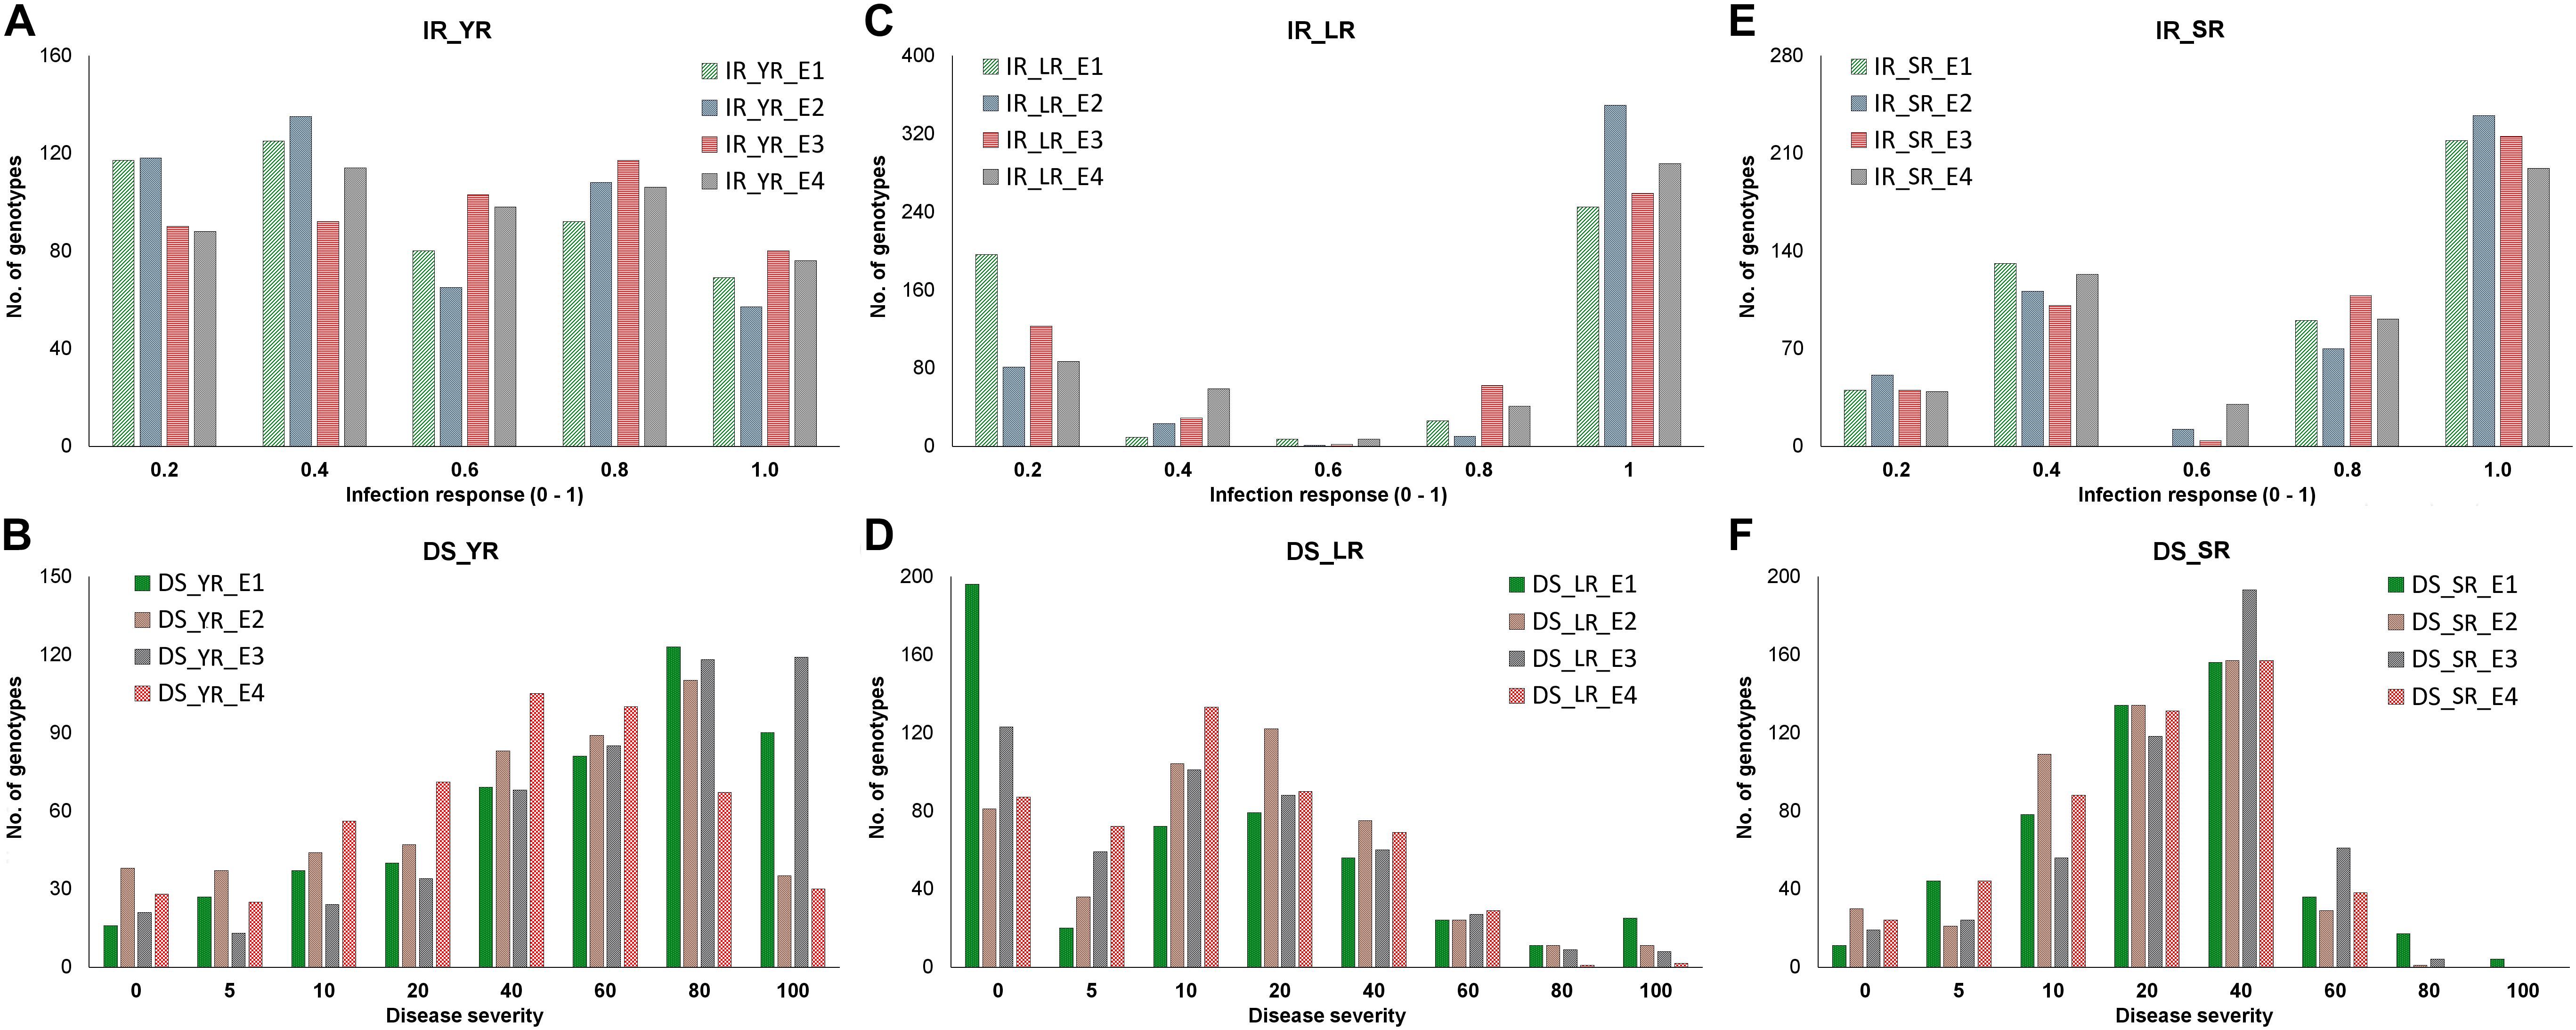
Figure 2. Distribution of adult plant stage disease response as infection response (IR) and disease severity (DS) in corresponding four environments (E1-E4) in the panel. Frequency of genotypes having IR (y-axis) for YR (A), LR (C), and SR (E) was recorded on the scale of 0-1 (x-axis), whereas the frequency of genotypes having DS (y-axis) for YR (B), LR (D), and SR (F) was recorded on the scale of 0-100 (x-axis). Each environment is represented with different colors as indicated by the color legend.
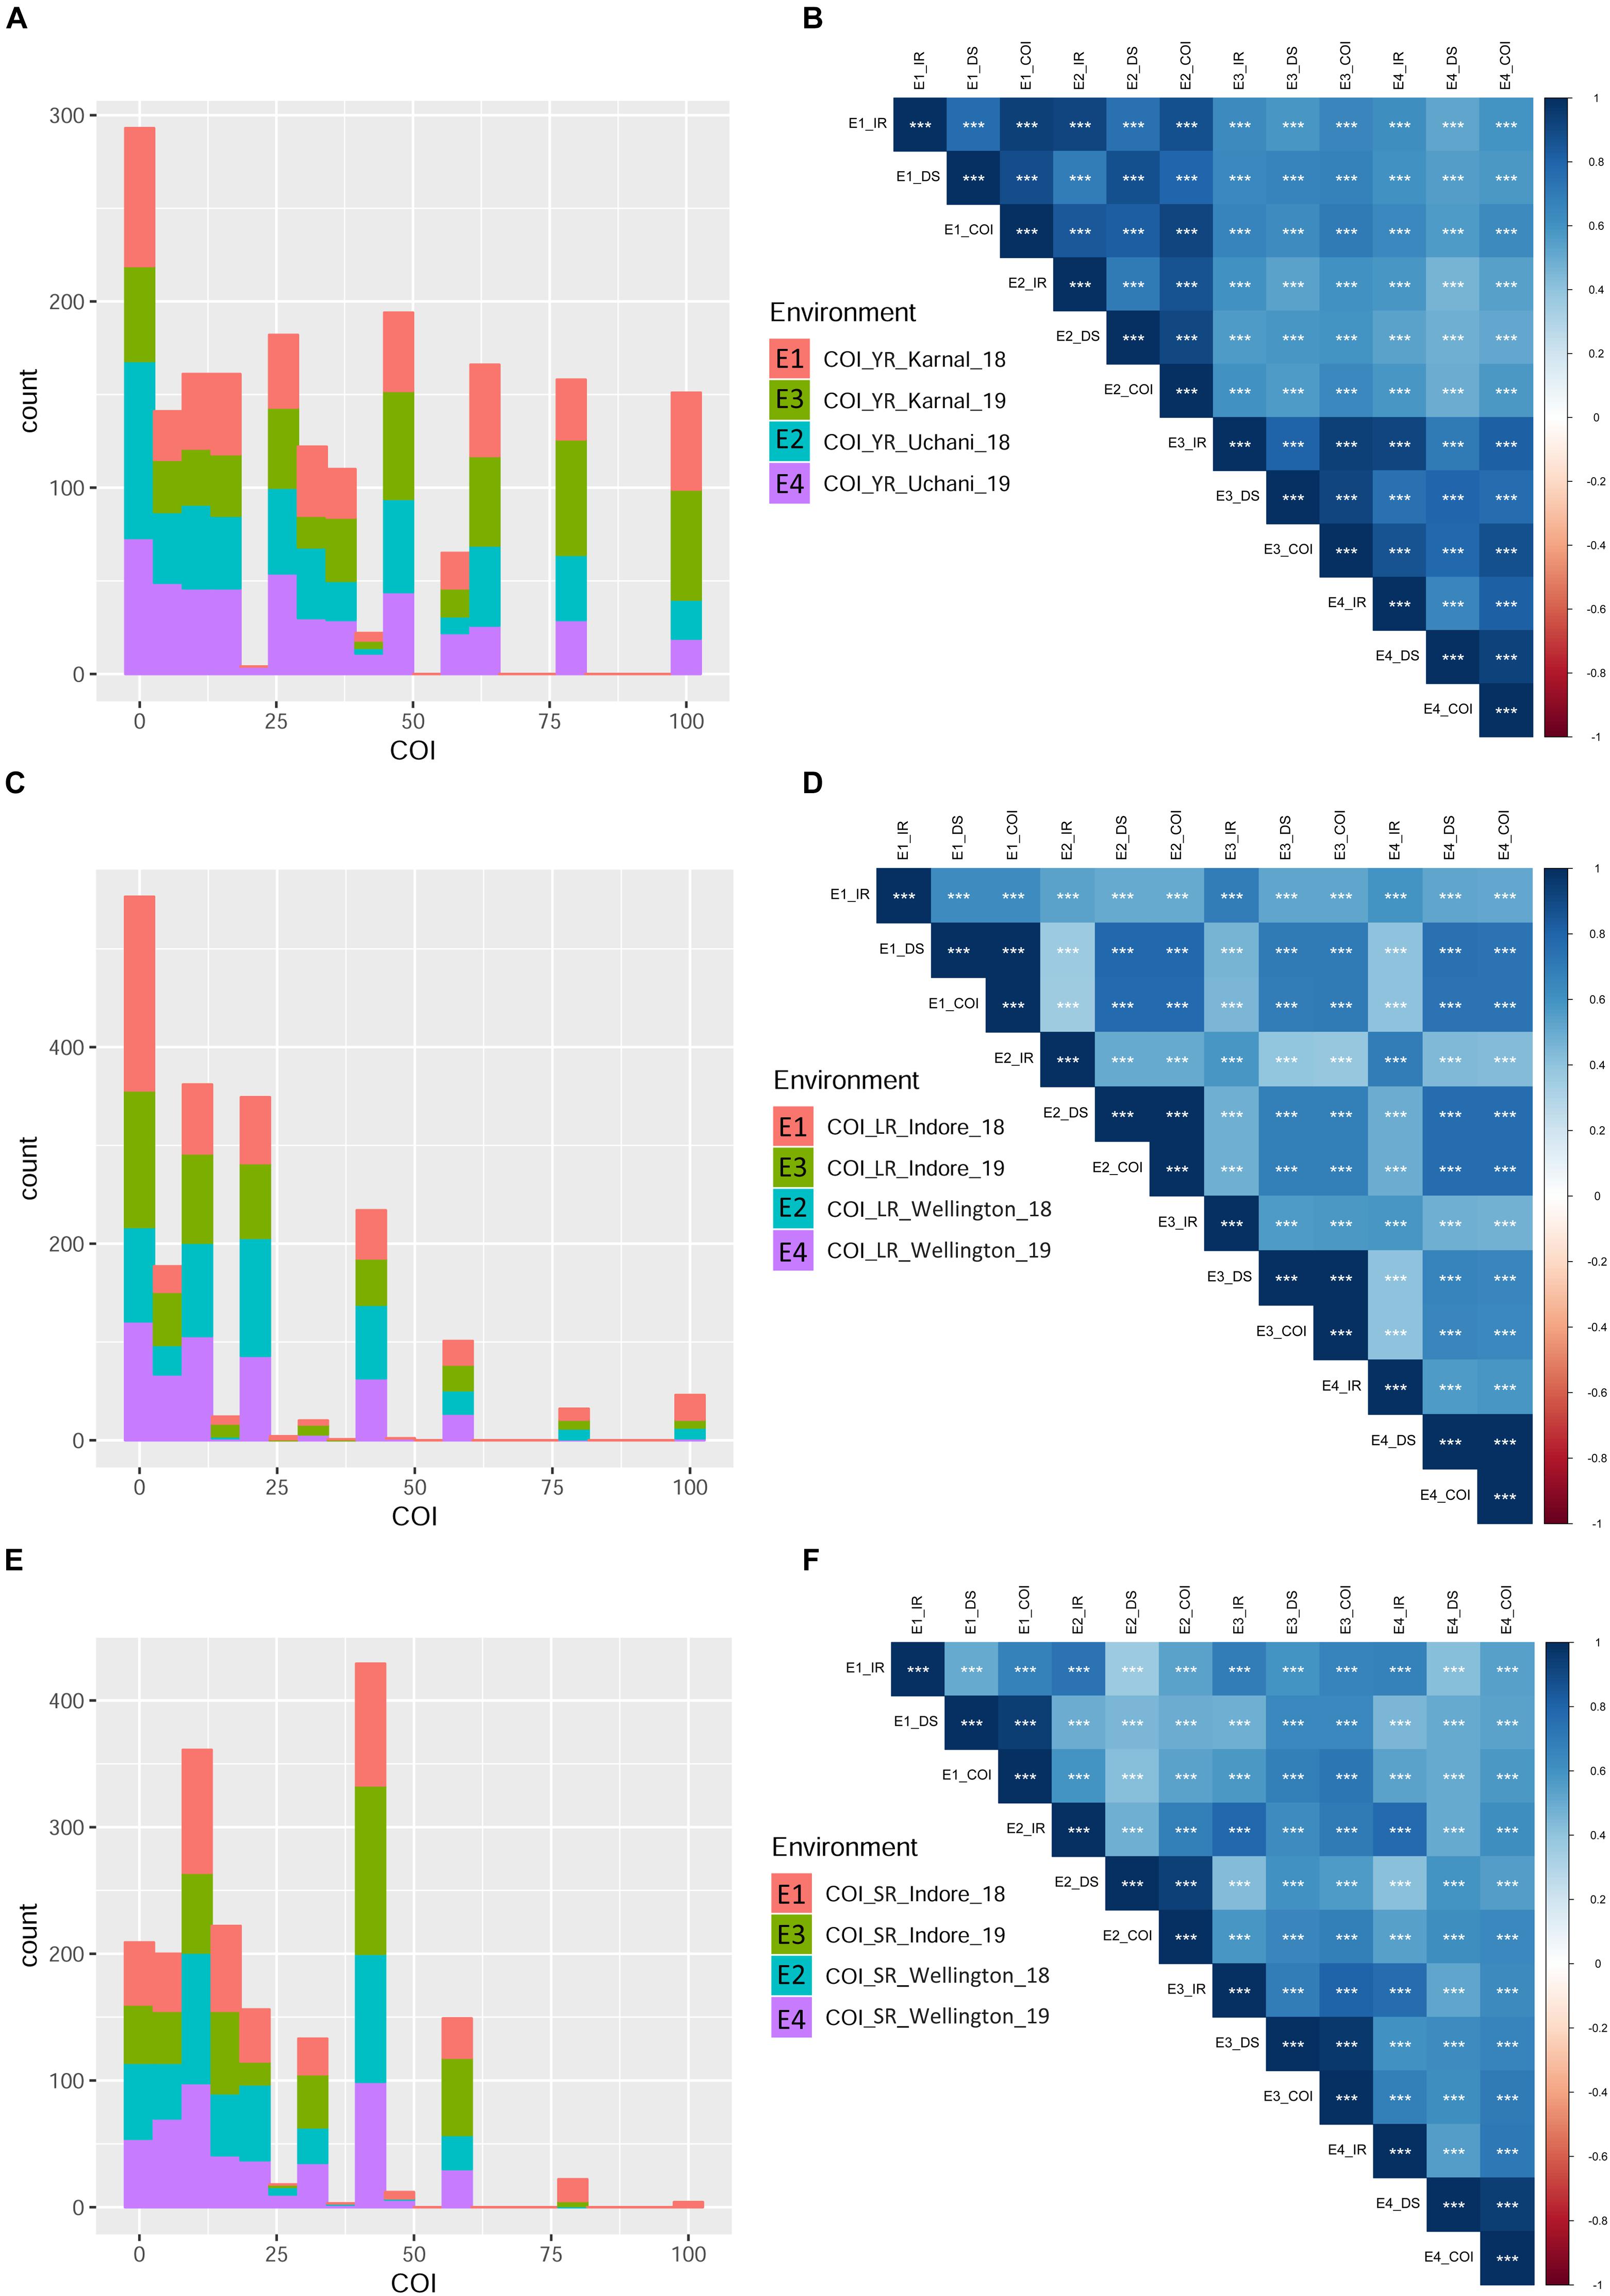
Figure 3. Phenotypic distribution based on the coefficient of infection (COI) in different environments for the three rust diseases. Different environments are represented with different colors in the bar-plot. Histograms (A,C,E) represent COI distribution for YR, LR, and SR, respectively. Pearson correlation coefficients (Supplementary Table S6) heat-map for infection response (IR), disease severity (DS), and COI between four environments are represented for YR (B), LR (D), and SR (F). All correlation coefficients are highly significant at ∗∗∗P < 0.001.
Adult Plant Field Response to Leaf Rust
An average high score of IR (0.8) and DS (21.7) was recorded in environment LR_E2 (Supplementary Table S3). The IR with score 1.0 (S) was seen in most of the genotypes irrespective of the environment (Figure 2C). DS with pustules coverage score 0–20 was present in more than 300 genotypes in each environment (Figure 2D). Likewise, more than seventy percent of the tested lines were observed to be resistant in the panel as per the COI score in all four environments (COI_LR_E1- E4) (Table 1 and Figure 3C). All correlations across four environments for IR, DS, and COI were found positive and highly significant (at P < 0.001) (Supplementary Table S6 and Figure 3D). Interestingly, unlike most genotypes featuring susceptible IR score, a very strong correlation (R = 0.99) was found between DS and COI per environment. This may suggest that a large proportion of the tested lines were able to resist the spreading of rust pustules. IR and DS showed a correlation coefficient value of R = 0.5–0.6 and COI with a correlation coefficient of 0.7, within and among the four environments.
Adult Plant Field Response to Stem Rust
Like leaf rust, stem rust also had a similar IR frequency distribution in the panel for the score 1.0 (S) with an overall average of 0.7 in each environment (Supplementary Table S3 and Figure 2E). Pustules coverage was found in a limited number of genotypes beyond the DS score of 40, where only 4 genotypes (HTW-6, IC212182, IC28617, and LGM69) attained rust coverage of 100 (Supplementary Table S3 and Figure 2F). The average DS was higher in SR_E3 followed by SR_E1. In the study panel, ∼62% of the tested lines were observed resistant to stem rust in environment COI_SR_E1 and E4 (Table 1 and Figure 3E). Results of correlations between DS and COI were found similar to those for leaf rust field response, whereas IR and DS showed R ranging from 0.4 to 0.6 within the environment. It varied from 0.5 to 0.7 for COI across the environments (Supplementary Table S6 and Figure 3F). All correlation coefficients were observed to be highly significant at P < 0.001.
For each of the three rusts in four environments, it was observed that the susceptible check lines present at regular intervals of the test genotypes showed maximum disease response with a score of 100S. This indicates that any possible variations observed in the reaction of the genotypes in RAMP would be genetic in nature and not due to the environment or inoculum load. The disease response at seedling and adult plant stages were observed to have less than 10% missing observations in the study panel. The distribution of phenotypic disease response (IT and COI) were found deviating from the normal distribution. No improvement in the normality was observed after using logarithmic and square root transformation. Therefore, the original data were used for subsequent genetic analyses.
Variance Components Estimation and Broad-Sense Heritability (H2)
Estimation and analysis of variance components, using a linear mixed model approach, revealed highly significant (P < 0.001) differences for IR, DS, and COI among the genotypes (g) across all environments in each rust type. Significant differences for location (e) and genotype-location interactions (g × e) were not observed in all cases (Table 2), therefore, by and large, indicating ample inoculum load and congenial atmospheric conditions for the appearance of the disease. High H2 estimates were observed across the four environments for each rust type, ranging from 0.78 to 0.92 for IR, 0.78 to 0.90, and 0.83 to 0.90 for COI (Table 2). The first two principal components explained together about 95.05, 88.68, and 86.76% of the total variation in GGE Biplot analysis for YR, LR, and SR field response, respectively. In reference to ranking resistant genotypes across environments, 22.15% (for YR), 61.49% (for LR), and 43.89% (for SR) were found in proximity to the ideal genotype (Supplementary Figure S2). In this study, a genotype would be considered as an ideal genotype, which would show a uniformly low and stable disease response in the tested four environments for all the three rusts.
Table 2. Variance component estimates for random variables for IR, DS, and COI across four environments per rust type@.
SNP Markers, Population Structure, and Linkage Disequilibrium
Of the 35K SNP markers, 14,650 polymorphic mapped markers were used for LD analysis and subsequently for GWAS. Genome D was found evident with lower marker density as compared to A and B genomes. Population structure analysis on RAMP was previously described by Kumar et al. (2020). The two subpopulations observed comprised of 106 (in SP1) and 377 (in SP2) genotypes (Supplementary Table S3). Genotypes that have been involved mostly in the breeding programs were observed as a major subpopulation. Principal component analysis (PCA) concurred with the result of STRUCTURE. Two separate clusters were observed in the PCA where PC1 (principal component 1) and PC2 contributed with 13.04 and 4.11%, of the total variation, respectively (Supplementary Figure S3). The effect of population structure was evident in the seedling response to multiple rust races. All pathotypes had a significant mean difference (at P < 0.05) for subpopulation based seedling disease response except for the pathotypes YR_110S119, YR_238S119, and YR_46S119 (Supplementary Table S7). The mean of IT scores for genotypes in subpopulation one (SP1) was higher than that of those in subpopulation two (SP2). This shows that in the current study genotypes were more resistant in SP2 than in SP1 to most of the pathotypes. A similar trend was observed in adult plant disease response where SP2 was significantly more resistant than SP1 based on COI (Supplementary Table S7). Therefore, the influence of population structure on rust infection was considered as covariates for subsequent association analyses.
Linkage disequilibrium r2− values were estimated for the three genomes separately and for all chromosomes within each genome. The significant marker pairs at P < 0.01 were considered for the study. Genome A had 69.56% of significant marker pairs with an average r2− value of 0.250. Chromosome 2A had the highest (21.2%) and chromosome 4A had the lowest (10.1%) percentage of significant marker pairs of LD r2. Genome B had 73.67% of significant markers with an average r2− value of 0.212. All chromosomes of B genome had a similar percentage (∼16-18%) of significant marker pairs except for chromosome 4B (5.2%) and 7B (9.6%). Chromosome 1D (31.9%) and 2D (29.4%) had the highest number of significant marker pairs from the D genome with chromosome 4D (2.7%) bearing the lowest count (Figure 4A).
Figure 4. (A) Chromosome wise significant marker pairs that showed Linkage disequilibrium (LD) due to genetic linkage. LD decay plot is shown as a scatter plot of pairwise SNP LD r2− value over the genetic distance between each intra-chromosomal marker pairs for (B) A genome, (C) B genome, and (D) D genome. LOESS smoothening curve (red curved line) was fitted to the LD decay. Orange dash line represents the 95th percentile unlinked r2 line for (A) (r2 = 0.126), (B) (r2 = 0.219), and (D) (r2 = 0.215) genomes. The Cyan dash line represents the critical r2 (=0.201) of the whole genome.
The critical r2-values were 0.126, 0.219, and 0.215 for genome A, B, and D, respectively. The difference in LD decay analysis was observed between A, B, and D genome. Whereas, predicted genome-wide LD decay was below critical r2 = 0.201. As LD beyond the critical value is considered to be caused by genetic linkage, chromosome-wise significant marker pairs with r2 > 0.201 were also estimated (Figures 4B–D). At a genome-wide scale, 36.35% of significant SNP pairs showed LD beyond critical r2 (> 0.201). Among the marker pairs in LD due to linkage, chromosome 5B contained the highest percentage (11.96%) of these markers, while chromosome 4D contained the lowest percentage (<< 1%). The percentage of these marker pairs in the A, B, and D genomes were 39.35, 47.21, and 13.43%, respectively. The map distance at which the fitted decay curve intersected with the critical r2 provided an estimate of QTL-CI. For genome A, B, and D, the estimated QTL-CI was 5, 3, and 8 cM, respectively (Figures 4B–D).
Marker Trait Associations for Race-Specific Rust Response
A CMLM adjusted for population structure and relatedness (kinship) was selected to detect marker-trait associations (MTAs) (Figure 5). This approach gave a minimum deviation in the observed p-values from the expected values presented as Q-Q plots when compared with other tested models for controlling effects of population structure and relatedness (Supplementary File S1) for all GWAS analyses in this study. The number of MTAs found significant (at p < 0.001) for race-specific stripe rust (YR) response were 11, 25, 33, 62, and 99 for YR_46S119, YR_110S119, YR_238S119, YR_110S84, and YR_T, respectively. In case of leaf rust (LR), the counts were 41, 42, 47, 53, 69, and 100 for pathotypes LR_77-1, LR_106, LR_12-5, LR_104-2, LR_77-9, and LR_77-5, respectively. Stem rust (SR) pathotypes SR_40-3, SR_21A2, SR_122, SR_117-6, SR_40A, SR_11, and SR_34-1 were observed to have 12, 23, 28, 30, 64, 92, and 100 MTAs, respectively (Supplementary Table S8 and Supplementary Figure S4). Clearly, LR and SR possessed a large number of MTAs. In silico annotation of these MTAs associated with seedling disease response are also reported. Based upon these annotations, some of the commonly known resistance associated genes were found such as F-box/LRR-repeat protein At3g26922-like and protein 23, disease resistance RPP13-like protein 4, ABC transporter G family member 25, and more (Supplementary Table S8). The cluster of MTAs on the same chromosomes was considered as a putative QTL based on the confidence interval defined by LD. Therefore, MTAs within range of 5, 3, and 8 cM on chromosomes of genome A, B, and D, respectively were considered as a single putative QTL. The SNP marker with the lowest p-value (or most significant association) was used to represent such QTL obtained as the representative SNP. Based on this approach, YR pathotypes bearing 230 MTAs were grouped into 46 distinct loci. Similarly, MTAs for LR (352) and SR (349) pathotypes were grouped into 62 and 64 distinct loci, respectively (Supplementary Table S9). The MTAs observed can be considered in two categories. The first category comprised of loci found associated with two or more pathotypes and those associated with only one pathotype may fall in the second category. For YR pathotypes, nine loci mapped on chromosomes 1A (1), 1B (2), 1D (1), 2A (1), 2B (1), 3B (1), 5A (1), and 6A (1) were considered for the first category. Similarly, eighteen loci were observed on chromosomes 1A (1), 1B (1), 2B (2), 3A (2), 3B (4), 3D (5), 5B (2), and 7A (1) for LR pathotypes. Likewise, twenty six loci were observed for SR pathotypes on chromosomes 1A (3), 1B (2), 1D (2), 2A (1), 2B (2), 3A (3), 3B (4), 3D (3), 5A (1), 5B (2), 6B (1), 6D (1), and 7A (1) (Table 3).
Table 3. Putative QTL significantly (p < 0.001) associated with seedling stage resistance against at least two pathotypes for each rust pathogen.
Figure 5. A circular Manhattan plot for significance [–log10(p-values)] of the association of 14,650 SNPs based on CMLM located on 21 chromosomes with the seedling disease responses against pathotypes of the three rusts. Associations for the (A) five YR pathotypes YR_110S119, YR_T, YR_238S119, YR_46S119, and YR_110S84; (B) six LR pathotypes LR_106, LR_77-1, LR_77-5, LR_77-9, LR_12-5, and LR_104-2; and (C) seven SR pathotypes SR_40A, SR_21A2, SR_11, SR_34-1, SR_40-3, SR_117-6, and SR_122 were plotted from inside to outside, respectively. A multi-track Q-Q plot for each case is presented at the right upper corner of the circular Manhattan plot. The threshold value at –log10(p) ≥ 3 is indicated as red-colored circle for each pathotype. A rectangular version of the plots is shown in Supplementary Figure S4.
Several representative SNPs were observed for more than one rust type. Among those SNP markers AX-94573417, AX-94677476, and AX-94842331 representing loci for YR and SR seedling response had a bidirectional allelic effect. Whereas, AX-94871275, AX-94874313, AX-94883935, AX-94977862, and AX-95226287 had unidirectional allelic effect while representing loci for LR and SR (Supplementary Tables S8, S9). With respect to YR, only QYr.ramp-1B.3 was observed in more than 2 pathotypes viz. YR_110S119, YR_238S119, and YR_T, also having the maximum number of MTAs. Loci QYr.ramp-2A.1 had the second most numbers of MTAs found after QYr.ramp-1B.3. The most significant association among the nine QTL were observed for YR_T, more than twice (Table 3). In the case of LR, QLr.ramp-3A.7 was seen associated with all the 6 pathotypes. Six loci QLr.ramp-3A.6, QLr.ramp-3B.8, QLr.ramp-3B.11, QLr.ramp-3D.4, QLr.ramp-3D.5, and QLr.ramp-3D.6 were associated with all LR pathotypes except for LR_106, located on group 3 chromosomes. Most significant associations were present for LR_77-5 at more than four loci. The highest number of MTAs were found located on chromosome 3D at 174.29–178.60 cM (Table 3). For SR pathotypes, seven loci were found associated with more than 3 but limited to 6 pathotypes. These loci were present on chromosomes 1A (QSr.ramp-1A.1, QSr.ramp-1A.2), 3A (QSr.ramp-3A.6), 3B (QSr.ramp-3B.7), and 3D (QSr.ramp-3D.2, QSr.ramp-3D.3, QSr.ramp-3D.4). Most significant association was seen for SR_34-1 at more than two loci (Table 3).
When compared to other YR seedling resistance loci, QYr.ramp-1A.1 exhibited a higher level of contribution to IT with phenotypic variance (R2) of 5.24% being associated with YR_110S84 and YR_T. Followed by QYr.ramp-1B.3 accounting for R2 of 4.81% in association with YR_110S119, YR_238S119, and YR_T. Thirty-seven loci were associated with response to single YR pathotype, including 12 loci each with YR_238S119 and YR_T, 8 loci with YR_110S84, 4 loci with YR_46S119, and single loci with YR_110S119 (Supplementary Table S9). Similarly, of LR seedling resistance loci, QLr.ramp-3B.11 exhibited the most contribution to IT within an R2 range of 4.39–12.32% in association with all pathotypes but LR_106. Also in decreasing order, QLr.ramp-3D.5, QLr.ramp-3A.7, and QLr.ramp-3D.6 contributed to IT exhibiting a range of R2 from 3.41 to 10.97%, 3.73 to 10.34%, and 2.56 to 10.09%, respectively, associated with multiple LR pathotypes. Whereas, QLr.ramp-5D contributed with R2 of 6.86% and significantly associated (−log10p = 9.4711) with single pathotype LR_12-5. Forty four loci were associated with response to single LR pathotype, including 12 loci with LR_106, 10 loci with LR_77-9, 9 loci with LR_77-5, 6 loci with LR_12-5, 4 loci with LR_104-2, and 3 loci with LR_77-1 (Supplementary Table S9). In SR seedling resistance, loci QSr.ramp-1B.4 was accounted for maximum contribution to IT with R2 ranging from 2.20 to 4.01% and was associated with SR_122, SR_40A, and SR_11. Another locus QSr.ramp-1A.2 demonstrated a considerable R2 of 3.26% being associated with five SR pathotypes showing the most significant association with SR_34-1. Thirty-eight loci were associated with response to single SR pathotype, including 10 loci with SR_11, 7 loci each with SR_40-3 and SR_122, 6 loci with SR_21A2, 5 loci with SR_117-6, and 3 loci with SR_34-1 (Supplementary Table S9).
Marker Trait Associations for the Three Rusts Field Response
Under natural disease pressure in respective environments, 78, 151, and 252 significant (at −log10p ≥ 3) MTAs were observed using the CMLM for YR, LR, and SR field response in adult plant stage, respectively (Figure 6, Supplementary Table S10, and Supplementary Figure S5). In silico annotation of these MTAs associated with adult plant disease response are also reported. Several resistance associated genes were found in adult plant responses such as E3 ubiquitin-protein ligase, NB-LRR protein, Lr10 disease resistance locus receptor-like protein kinase, serine/threonine kinase protein, DEAD-box ATP- dependent RNA helicase, disease resistance protein RGA3, etc. (Supplementary Table S10). LD based putative QTL identification revealed 29 distinct loci on all chromosomes except for 3D, 4D, 5D, and 7B to be associated with YR response, where 16 loci were observed in more than one environment. In case of LR response, 45 distinct loci were observed on all chromosomes except for 2D, 4D, 5D, and 7A. For SR response, none of the 44 distinct loci were observed on chromosomes 2D, 5D, and 7D. Eighteen and twenty-seven loci were observed in more than one environment for LR and SR, respectively (Table 4 and Supplementary Table S11). Among the identified representative SNPs, haplotype analysis using Haploview v4.2 (Barrett et al., 2005) markers with LD value r2 > 0.8 were observed in the case of LR and SR but not in YR. For LR, only one set of marker pairs comprising two markers was in strong LD, whereas for SR, three sets of marker pairs comprising of 2, 7, and 11 SNPs were observed in LD (Supplementary Figure S6 and Supplementary Table S11).
Table 4. Putative QTL significantly (p < 0.001) associated with resistance at the adult plant stage observed in at least two environments corresponding to the three rust diseases.
Figure 6. A circular Manhattan plot for significance [–log10(p-values)] of the association of 14,650 SNPs based on CMLM located on 21 chromosomes with the adult plant disease responses in the respective four environments for the three rusts. Associations in the four (A) YR environments YR_E1, YR_E2, YR_E3, and YR_E4; (B) LR environments LR_E1, LR_E2, LR_E3, and LR_E4; and (C) SR environments SR_E1, SR_E2, SR_E3, and SR_E4 were plotted from inside to outside, respectively. A multi-track Q-Q plot for each case is presented at the right upper corner of the circular Manhattan plot. The threshold value at –log10(p) ≥ 3 is indicated as red-colored circle for each environment. A rectangular version of the plots is shown in Supplementary Figure S5.
For YR field response, QYr.ramp-2D.1 was the only locus observed in all the four environments (YR_E1-E4), whereas the remaining 15 loci represented at least two environments. Most significant association was seen for QYr.ramp-6B.4 in YR_E2 followed by QYr.ramp-1B.4 in YR_E4. For LR field response, three loci were seen associated in all four environments (LR_E1-E4) namely QLr.ramp-4A.4, QLr.ramp-6B.3, and QLr.ramp-7B.1. Most significant association was found for QLr.ramp-1B.3 in LR_E3 which also holds the most numbers of MTAs observed. In the case of SR, the most number of loci (nine) affiliated with all four environments (SR_E1-E4) were observed. Amongst these and other loci, QSr.ramp-3D.4 holds the most number of MTAs followed by QSr.ramp-1B.4, where the most significant association was observed for QSr.ramp-3B.7 in SR_E3 (Table 4).
Among YR field response associated loci, QYr.ramp-6B.4 and QYr.ramp-1B.4 exhibited similar and higher contribution for COI with R2 ranging from 2.42 to 3.55% in at least two environments. Thirteen loci were associated with YR field response in single environment, including 6 loci in YR_E4, 3 loci in YR_E3, and 2 loci each in YR_E2 and YR_E1 (Supplementary Table S11). For LR field response, of 45 loci, QLr.ramp-1B.3 accounted for the higher level of R2 of 5.03% while contributing to COI. To LR field response in single environment, 27 loci were seen associated where 10 loci in LR_E1, 7 loci in LR_E2, 6 loci inLR_E3, and 4 loci in LR_E4 were observed (Supplementary Table S11). In case of SR field response, QSr.ramp-3B.7 explained the higher level of contribution for COI with R2 ranging from 1.96 to 4.18%. Seventeen loci were associated with a single environment, where 8 loci in SR_E1, 4 loci each in SR_E2 and SR_E4, and single loci in SR_E3 were observed (Supplementary Table S11).
Like seedling response, some representative SNPs were found common between two rust type field responses. Among those SNPs, AX-94638655 and AX-95176310 representing loci for YR and LR; AX-94874313 and AX-94877284 representing loci for LR and SR showed a bidirectional allelic effect. Whereas, AX-94805944 representing loci for LR and SR showed unidirectional allelic effect (Supplementary Tables S10, S11). Despite having different representative SNP markers, certain QTL observed for resistance in the adult plant stage were seen to be sharing QTL-CI based similar to identical genomic region with those observed for seedling stage resistance (Supplementary Table S12). In such case, QTL observed for both seedling and adult plant disease responses were considered as ASR loci and those observed only for the adult plant disease response were considered as APR loci. There were few ASR loci which had identical representative SNP marker for the QTL observed in seedling and adult plant stages. Of 12 YR ASR loci, QYr.ramp-3B.4 was represented by SNP AX-94680284. Similarly, of 15 LR ASR loci, QLr.ramp-3B.3 and QLr.ramp-3D.4 were represented by SNPs AX-94741529 and AX-94874313, respectively. In the case of SR, with the most number of ASR loci (31), there were fourteen such representative SNP markers (Supplementary Table S12). The most number of APR loci were observed against LR (30) disease response followed by that of YR (17) and SR (13). Several genomic regions in terms of QTL-CI were found common in more than one rust field response. These robust genomic regions bearing QTL-CI based co-localized ASR and APR loci can be harnessed for further exploration and usage (Table 5). Among these genomic regions, seven of them been found on chromosomes 1A, 1B, 1D, 2B, 6A, 6B, and 6D, had QTL for all the three rusts.
Table 5. Robust genomic regions observed in more than one rust type field response.
Pyramiding Effects of Favorable Alleles on Field Response
The cumulative effect of favorable MTAs for field resistance was studied based on the estimated number of favorable alleles in each specific genotype. For this, SNPs representing the distinct loci for each rust were considered. Alleles associated with a reduction in disease response were considered as favorable alleles at each locus of the representative SNP. With 29 SNPs for YR, the number of favorable alleles ranged from 6 to 26. Similarly, for LR and SR, it ranged from 10 to 40 and 4 to 39 with 45 and 44 SNPs, respectively (Supplementary Table S13). The accumulating resistant alleles were expected to be strongly correlated with the disease response. A significant negative correlation (at p < 0.0001) was observed in the case of YR (-0.4825), LR (-0.6256), and SR (-0.5775) between the number of favorable alleles in individual genotypes and averaged disease response under their respective environments. This observation was further supported by the linear regression coefficients (R2) found significant at p < 0.0001 in all three cases (Figure 7). The total SNPs (118) estimated as field response based QTL representative markers were examined using a hierarchical clustering approach by selecting 72 genotypes having average COI score ≤ 20 in all the three rusts. Clearly, these genotypes were found to have the most number of favorable alleles compared to moderately resistant to susceptible genotypes except for some resistant genotypes viz. E3257, H957, HUW679, PBW138, IC321918, and LBRL4. The genotypes were grouped in same clusters based on the SNP array pattern having favorable alleles in those genotypes (Supplementary Figure S7). Pedigree based closeness was also visible in genotypes showing allelic similarity in terms of favorable alleles, e.g., HPW360-HPW361, DBW50-DBW88, and VL802-VL804. The present finding provides valuable information to the wheat breeders in deciding the selection of parents for the crossing program, particularly those to be utilized as source of rust resistance. Incorporation of diverse alleles can be ensured if parents are chosen from the different clusters (Supplementary Figure S7).
Figure 7. Linear regression plots of field disease response toward (A) YR, (B) LR, and (C) SR, to favorable alleles of representative SNPs of identified QTL in each of the 483 genotypes in the panel and averaged COI score over different environments. All regressions were highly significant at P < 0.0001.
Discussion
Crop scientists face dual challenges of increasing productivity and sustaining it by managing stresses occurring due to biotic and abiotic factors. Among biotic factors, the three rusts of wheat cause continuous threat through the rapid evolution of new races. The development and deployment of resistant cultivars is the most economical and environmentally safe method to control diseases. Primary gene pool including indigenous collections comprising of landraces, old cultivars and breeding lines are considered as a valuable genetic resource for providing new and durable resistance that can be exploited for the development of current day high-yielding varieties (Mujeeb-Kazi et al., 2013). Utilization of primary gene pool is advantageous over secondary (comprising of wild relatives) as they carry homologous genomic regions having a better opportunity as combiner with hexaploid wheat (Wulff and Moscou, 2014). To widen the spectrum of rust resistance in modern wheat varieties, finding lines having new sources of resistance along with newer alleles for known resistance genes, is the way forward. High throughput genotyping technologies coupled with bioinformatics enable us to mine valuable information from genome database paving the way for a better understanding of vast germplasm collections.
With this objective, a diverse panel of 483 genotypes found suitable for GWAS (Kumar et al., 2020) was utilized for identifying genomic regions associated with rust resistance in the form of diverse resistant alleles and their combinations for durable resistance. This panel comprised diverse genotypes both in temporal and spatial dimensions, i.e., genotypes adapted to various agro-climatic conditions spanning India and varieties released during pre and post green revolution era. This panel encompassing of hitherto less engaged germplasm such as landraces offers a rich and new accessible source for disease resistance. Studies have supported the utilization of landraces for exploring novel resistant alleles (Muleta et al., 2017b; Pasam et al., 2017; Riaz et al., 2018). The same diverse panel was evaluated against all the three rusts without aiming any biasness toward specific rust. The phenotypic distribution of disease response did not follow a normal distribution, and original phenotypic data was utilized as such, similar to the previous studies (Gao et al., 2016; Edae et al., 2018). In this study, more than 50% of genotypes in the panel showed resistance to five out of seven SR pathotypes. Similar proportion of genotypes were found resistant to SR in four environments at the adult plant stage under field disease situations. This observation strongly suggested the presence of ASR loci in the panel. Whereas, in the case of LR, the presence of APR loci was supported by the fact that more than 70% of the lines were resistant in each of the four LR environments in spite of the panel showing susceptibility to five out of six LR pathotypes under seedling stage disease response. This was in concurrence with most number of ASR and APR loci observed against SR and LR disease response, respectively. Significant variations were observed among the genotypes in the panel as indicated by analysis of variance (ANOVA). High heritability estimates observed in this study for field disease responses were supported by significant positive correlations among traits and occurrence of consistent data recorded across environments. This indicated reproducibility of the data reliable for GWAS (Godoy et al., 2018).
Wheat breeder’s 35K array derived from wheat 820K SNP array provides breeder oriented informative markers (Allen et al., 2017). It has an added advantage of capturing information on germplasm derived from secondary and tertiary gene pools as the array is developed using exome capture of wheat and its wild relatives (Allen et al., 2017; Rasheed and Xia, 2019). In our study, LD decay was found strongly different in the three genomes with B genome to have the quickest decay followed by A genome, which is supported by previous reports (Gao et al., 2017; Riaz et al., 2018). This supports the practical use of D genome markers suitable for association tests even though less in number (Gao et al., 2017). D genome was found to have the highest LD than other genomes which has also been mentioned in several previous studies (Nielsen et al., 2014; Wang et al., 2014; Zegeye et al., 2014; Voss-Fels et al., 2015; Riaz et al., 2018). The number of significant marker pairs was found lowest in the chromosome 4D similar to a previous study (Muleta et al., 2017a).
Population structure in the panel showed two subpopulations (Kumar et al., 2020) which was further supported by PCA. A significant effect of population stratification was observed in differences based on disease response at seedling and adult plant stage. The resistant subpopulation of the two subpopulations, comprised of majorly improved genotypes and released varieties. It appeared that landraces in the minor subpopulation were found mostly susceptible. The landraces under study have originated from central and northwestern states of India namely Gujarat, Rajasthan, and Madhya Pradesh (Kumar et al., 2020). Landraces adapted to these regions are mostly tolerant to abiotic stresses viz. drought, heat, and salinity, e.g., genotype KHARCHIA LOCAL (origin: Rajasthan, India) is adapted to long-term salinity stress (Mahajan et al., 2017, 2020). We hypothesize that landraces adapted to harsh environments, such as abiotic stresses and low-input conditions give an eluded appearance of diseases. But under high input conditions, we observed that landraces appeared to be more susceptible when compared to improved genotypes. Since not all landraces were found susceptible (Supplementary Table S3), they may still be beneficial in the identification of novel resistant alleles. Of 96 landraces in the panel, twenty-one were found resistant in field response against LR and eleven each against YR and SR. Landrace IC321998 (origin: Uttarakhand, India) was found resistant for all three rusts. This suggests an indirect selection for disease resistance in spite of the fact that landraces are traditionally selected by the farmers preferring better agronomic traits (Zeven, 2002).
Care was taken to avoid spurious association due to population stratification by treating it as a covariate along with kinship accounting relationship among genotypes for association studies in this panel (Stich et al., 2008; Lipka et al., 2012; Yang et al., 2014). The selection of CMLM applied in this study was found suitable from the comparative study of different association models. In most of the cases, based on the Q-Q plots, CMLM was found to have minimum deviations in observed probabilities with respect to expected probabilities (Supplementary File S1). Several studies have been successfully conducted using the CMLM model (Arruda et al., 2016; Muleta et al., 2017a, b; Sheoran et al., 2019). It also provides efficiently high statistical power over and is an improvement to the MLM model for a large sample size (Zhang et al., 2010).
Three ASR loci QYr.ramp-1A.2, QLr.ramp-1A.2, and QSr.ramp-1A.2 were found co-localized on chromosome 1A against each rust located at 72.25–75.74 cM. Except for QYr.ramp-1A.2 exhibiting minor effect, other loci were found associated with disease response to multiple pathotypes and environments. This was in agreement with the QTL observed to have a minor effect but also showed seedling resistance on chromosome 1AL (Rosewarne et al., 2012; Jighly et al., 2015). QLr.umn-1AL was reported to be associated with both field and seedling disease response mapped at 149.8 cM on chromosome 1AL (Gao et al., 2016). In this study, QLr.ramp-1A.2 was observed proximal to this previously reported QTL. APR for LR is not known to be present on chromosome 1AL (Li et al., 2014) and the chance of having an association with Lr59 is highly unlikely as source of such alien introgression (Marais et al., 2008) is not present in the current study panel. A MTA exhibiting seedling resistance against Pgt race TTKSK represented by DArT marker wPt-2014 was reported on chromosome 1AL mapped at 70.5 cM (Laidò et al., 2015). This could be present in close proximity to the loci QSr.ramp-1A.2 identified in this study.
LR APR loci QLr.ramp-1B.2 was mapped on the short arm of chromosome 1B located at 8.24–9.93 cM. It was identified in close proximity to SSR marker Xswm271 linked to known APR gene Lr75 (Singla et al., 2017) and proximal to another APR gene Lr71 (Singh et al., 2013). Genomic region 23.90–26.22 cM (1B) was found to have a large number of MTAs in all the three rusts for seedling disease response (Figure 5 and Table 3). This region located on chromosome 1BL harbors several known Yr genes such as Yr9, Yr10, Yr15, Yr 64, Yr65, etc. In concurrence ASR loci QYr.ramp-1B.3 was found in a close proximity to Xbarc119 (27.4 cM) and Xgwm413 (29.9 cM) which are linked to Yr15 and YrH52 (Maccaferri et al., 2015a). This region also showed a possible association with wheat-alien translocation (1RS.1BL) derived from Secale cereale (Schlegel and Korzun, 1997). Resistance genes for all the three rusts are known to be associated with this translocation viz. Yr9 (Ren et al., 2009), Lr26, and Sr31 (Mago et al., 2005). Race-specific gene postulations demonstrated the presence of these genes in the panel, possibly being reflected as the co-localized ASR QTL QYr.ramp-1B.3, QLr.ramp-1B.3, and QSr.ramp-1B.4. The most virulent Pgt race Ug99 and its lineage have not been observed in India and its neighboring countries inferring the effectiveness of Sr31 in Indian germplasm (Prasad et al., 2018; Bhardwaj et al., 2019b).
So far, five QTL have been reported for resistance against YR on chromosome 1D, with three present at the distal end (Zwart et al., 2010; Ren et al., 2012a; Vazquez et al., 2012) and two present at the proximal end of its short arm (Maccaferri et al., 2015b; Godoy et al., 2018). Not many reports are present for ASR genes against YR at locations close to the centromere on chromosome 1DS where Godoy et al. (2018) reported QTL present at 89.58 cM. Two potential ASR loci QYr.ramp-1D.1 (AX-94508418: 1.03 Mb) and QYr.ramp-1D.3 (AX-94444583: 34.6 Mb) were observed both at distal and proximal regions of 1DS, respectively, in this study. The chromosome 1DS is also known to harbor Lr42 gene conferring resistance against LR at both seedling and adult plant stages and recently it has been fine mapped on 1DS flanked by markers TC387992 and Xwmc432 to a 3.7 cM genetic interval (Gill et al., 2019). QLr.ramp-1D (3.38 cM) was observed very close to this location at adult plant stage only. QSr.ramp-1D.1 located at 1.69 cM on 1DS was observed in close proximity of gene Sr33 which is known to be flanked by Xbarc152 and Xcfd15 at a distance of 1.8 cM on either end on 1DS (Sambasivam et al., 2008). The gene was introgressed in bread wheat from its wild relative Aegilopes taushii providing resistance against Ug99 group races (Periyannan et al., 2013).
The genomic region 102.12–104.59 cM was observed to have ASR loci for each rust. This region was present on the chromosome 2BL supported by the physical positions of QTL associated SNPs spanning ∼612–722 Mb region. Corresponding to this physical region, Aoun et al. (2019) identified QSr.ace-2B conferring resistance to Pgt races TTKSK and JRCQC (virulent to Sr9e) linked to Sr9 gene flanked by SNP markers IWA6399 and IWA7955 (92.7–105.3 cM) on chromosome 2BL. SR ASR loci QSr.ramp-2B.6 was identified within this genomic region supporting possible affiliation to Sr9. In co-localization to which YR ASR loci QYr.ramp-2B.4 was identified in a single field environment possibly due to its minor effect. It was located 5 cM proximal to another minor effect QTL QYrAvS.wgp-2BL (Liu et al., 2020). It was further located 3 cM proximal to SNP marker IWA638 (724 Mb: 107.58 cM) (Blake et al., 2016) which has been identified in a close proximity of YrSp gene (Feng et al., 2015). Another ASR loci QLr.ramp-2B.7 against LR was identified at 103.81–104.59 cM on chromosome 2BL. Gao et al. (2016) reported a QTL 2B_3 at 102.28–108.35 cM interval on chromosome 2B in response to field experiments only which reduced any possible similarity. Two formally known LR resistance genes Lr50 and Lr58 are present on the terminal region of chromosome 2BL (Brown-Guedira et al., 2003; Kuraparthy et al., 2007). SSR markers Xgdm87 (Lr50) and Xcfd50 (Lr58) linked to these genes are present distant to the identified QTL QLr.ramp-2B.7 based on the integrated consensus map (Maccaferri et al., 2015a). In a previous report, multiple resistance QTL against YR and LR QYr.ifa-2BL/QLr.ifa-2BL was identified on chromosome 2BL. It was flanked by DArT markers wPt-3378 and wPt-7360 (Crossa et al., 2007; Buerstmayr et al., 2014). However these markers were also present distant (Maccaferri et al., 2015a) to QLr.ramp-2B.7, leaving it for being an unexplored ASR loci.
In our study, it was observed that the genomic region 174.29–178.60 cM on chromosome 3DL harbored the most number of MTAs for seedling disease response against LR. Pathotypes LR_12-5, LR_104-2, LR_77-9, LR_77-5, and LR_77-1 collectively contributed to these MTAs observed (Figure 5 and Table 3). This region was also found highlighted in seedling disease response against SR pathotypes SR_122, SR_117-6, SR_40A, and SR_11. Wheat-alien translocations were known to be carried out for incorporating resistance genes Lr24/Sr24 (T3DS.3DL-3Ae#1L) and Lr38 (T3DL.3DS-7Ai#2L) in the chromosome 3D derived from Agropyron elongatum and Agropyron intermedium, respectively (Friebe et al., 1993; Jiang et al., 1993). ASR loci QLr.ramp-3D.6 and QSr.ramp-3D.4 were found associated with these translocations possibly harboring these resistance genes in our panel as evident by race-specific genes postulated.
Two APR and one ASR loci were identified co-localized on chromosome 6AL located at 215.37-221.75 cM (∼605–615 Mb). QYr.ramp-6A.5 was the ASR loci which provided resistance against YR in this region. It has been found distal to a previously reported ASR QTL tagging SNP IWA2129 on chromosome 6AL mapped at 212.2 cM (596.89 Mb) (Blake et al., 2016; Muleta et al., 2017a). Chromosome 6AL is also known to harbor the YR ASR gene Yr38 which is linked with another ASR gene Lr56 for LR (Park, 2016). None of these genes were postulated in the current study panel. In a previous study, Lr64 gene was mapped on chromosome 6AL tightly linked to the KASP marker which was developed for the SNP marker IWB59855 (Kolmer et al., 2019). The LR APR QTL QLr.ramp-6A.4 identified was represented by SNP marker AX-95147877 (615.46 Mb) in this study, found to be present close to SNP marker IWB59855 (614.17 Mb). Therefore, QLr.ramp-6A.4 could be strongly associated with the gene Lr64. Interestingly, Lr64 has not been characterized as ASR or APR gene so far (Park, 2016), whereas QLr.ramp-6A.4 was identified exhibiting APR response. This could provide supporting evidence for the identification of the true resistance nature of Lr64 in the future. An ASR QTL QSr.fcu-6A was mapped earlier on chromosome 6AL to the genomic region harboring Sr13 gene conferring resistance against Pgt races TMLKC, TRTTK, and TTKSK in emmer wheat (Sharma et al., 2019). An SNP-based semi-thermal asymmetric reverse PCR (STARP) marker rwgsnp7 was developed from the SNP IWB34398 (6AL: 615.45 Mb) to map QSr.fcu-6A. Validation of marker rwgsnp7 in hexaploid wheat provided evidence that chromosome 6D harbors a homoeologous allele similar to that present on chromosome 6A for this marker (Sharma et al., 2019). In this study, QSr.ramp-6A.5 was identified as APR loci mapped at 215.37–221.75 cM (∼605–615 Mb) interval on chromosome 6AL where the SNP IWB34398 overlaps with this region. Therefore, QSr.ramp-6A.5 could be present in the genomic region harboring Sr13. Since none of the Pgt races mentioned above were used in this study, seedling resistance could not be confirmed governed by this region in this study.
Chromosome 6B was observed to have co-localized APR loci for the three rusts. Based on MTAs associated with these QTL, an estimated physical location of ∼712–714 Mb was obtained (IWGSC RefSeq v.1.0) representing the long arm of the chromosome. Among several other reported YR APR QTL on 6BL (Mu et al., 2019), three QTL viz. QYr.wsu-6B.1 (Bulli et al., 2016), QYr.ucw-6B (Maccaferri et al., 2015b), and QYr.wgp-6B.1 (Santra et al., 2008) spanning ∼631–720 Mb genomic region were found overlapping to some extent with QYr.ramp-6B.4 identified in this study. LR APR QTL QLr.ramp-6B.6 was identified distally close to a recently reported APR QTL QLr.cim-6BL mapped in a durum mapping population on chromosome 6BL (Li et al., 2020). It was located in the interval of SNP markers AX-95155193 and AX-94562707 spanning 691.07–698.26 Mb genomic region. Lr3 (Kolmer, 2015) and Lr9 (Schachermayr et al., 1994) are well known genes present on chromosome 6BL. QLr.ramp-6B.6 was unlikely to be linked with either of these genes as Lr3 is an ASR gene and Lr9 has not been deployed in the current study panel. Similarly, Sr11 gene is also present on chromosome 6BL but exhibits ASR (origin: Triticum turgidum ssp. durum) (Park, 2016). It was mapped within the marker interval of Tdurum_contig55744_822 (IWB72471: 709.53 Mb) and BS00074288_51 (IWB10724: 715.97 Mb) (Blake et al., 2016; Nirmala et al., 2016). This region was found to be overlapping with those of QTL QSr.ramp-6B.3. Several genotypes were postulated to have this gene in the study panel. Since Sr11 provides a race-specific ASR against Pgt race TKTTF which has not been used in this study, QSr.ramp-6B.3 could have been mistakenly identified as an APR loci. Although, without further investigation a conclusion cannot be made.
The region (17.65–18.61 cM) harboring one ASR loci against YR and SR each, and one APR loci against LR were identified on the long arm of chromosome 6D (∼459–460 Mb). Gebrewahid et al. (2020) reported an APR QTL QYr.hebau-6DL located at 464.6–472.0 Mb interval flanked by SNP markers AX-108848475 and AX-109273869. QTL QYr.ramp-6D.2 identified in this study was present proximal to QYr.hebau-6DL, showing ASR property. There was a clear difference in the nature and position of these two QTL. LR APR QTL QLr.ramp-6D.1 was observed in a single environment depicting a possible minor effect. Although, chromosome 6DL harbors a known ASR gene Lr38 inheritably linked with SSR marker Xwmc773 (Mebrate et al., 2008) could be present relatively close to QLr.ramp-6D.1. Of the four known Sr genes on chromosome 6D, only the ASR gene Sr29 is present on the long arm (Dyck and Kerber, 1977). In a report, an APR QTL QSr.cim-6DL was mapped on chromosome 6DL. In our study, QSr.ramp-6D was identified as an ASR loci which could be in close proximity of Sr29.
The telomeric region of chromosomes 2AL and 7DS bears significant importance in YR resistance along with other resistant systems for barley yellow dwarf virus, powdery mildew and fusarium head blight (Boukhatem et al., 2002). Apart from the three known YR seedling resistance genes viz. Yr1 (Bansal et al., 2009), Yr32 (Eriksen et al., 2004), and YrJ22 (Chen et al., 2016), a recently identified and temporarily designated YR seedling resistance gene YrH9017 (Dong-fang et al., 2019) has been found on chromosome 2AL. None of the genotypes in the panel harbored these genes based on their pedigree and race-specific gene postulations. Instead, an unexplored YR APR loci QYr.ramp-2A.4 (179.61 cM) was observed at the telomeric region represented by SNP AX-94463225 (764.1 Mb). In co-localization to which, a LR APR loci QLr.ramp-2A.5 (AX-94995671: 779.6 Mb) was observed 33.07 cM and 73.07 cM distal to APR QTL QLr.ubo-2A (Li et al., 2014) and QLr.hebau-2AL (Zhang et al., 2017), respectively, in this study. APR loci QYr.ramp-7D.2 and QLr.ramp-7D.2 on chromosome 7D (6.96-18.37 cM) were found associated possibly with pleiotropic resistance gene Lr34/Yr18/Sr57, where SNPs representing these QTL viz. AX-95205886 (5.38 Mb) and AX-94674448 (72.94 Mb), respectively being in high LD (D’ = 0.87) are present on the short arm of chromosome 7D based on the IWGSC RefSeq v1.0 (Appels et al., 2018) reference physical map. The association to this pleiotropic gene can be further supported by the fact that forty genotypes in the current study panel were characterized for Lr34 in a previous report (Pawar et al., 2013). When compared to 90K SNP array, 35K SNP array used in this study was able to capture association with this pleiotropic resistance gene, since none of the 90K SNP markers are known to be linked to this gene (Muleta et al., 2017b). Since this array is capable of capturing conserved regions associated with yield-related traits present on the 1RS.1BL translocation region (Luján Basile et al., 2019) and was designed using wild relatives (Allen et al., 2017), provided an advantage over the most utilized 90K SNP array.
Evidence of true QTL can be derived from the results of having significant associations seen in at least two pathotypes or environments for a rust type (Edae et al., 2018). Validation of markers associated with these QTL can be done by comparing them with the positions of the markers of previously mapped QTL (Pasam et al., 2012; Hwang et al., 2014; Kertho et al., 2015; Maccaferri et al., 2015a). In this study, MTAs found associated with multiple pathotypes may be broadly useful in the enhancement of future germplasm and breeding programs (Liu et al., 2017). Accumulation and detection of favorable resistance alleles often pose challenges in the breeding program upon consideration (Riaz et al., 2018). In our study, a large number of favorable resistant alleles were detected in some landraces and these showed moderate to resistant behavior against the three rusts. As a separate observation, SNP AX-94394356, AX-94674448, and AX-95176310 being the QTL representing markers in field response against LR, had a poor percentage of resistance alleles accumulated in improved genotypes and released varieties when compared to landraces, in the panel. Similarly, AX-94608698, AX-95226309, AX-94485764, and AX-94805944 observed for SR field response, had more accumulated favorable alleles in landraces than that in other genotype categories. Such observations were not distinctively visible in case of YR response. This observation is possible when these favorable alleles have accumulated in landraces over time with varying frequencies (Riaz et al., 2018). The concept of ‘Speed breeding’ introduced (Watson et al., 2018) with the aim of utilizing latest advancements in phenotyping and high throughput data generation, can be helpful in developing rust-resistant wheat cultivars at an accelerated rate (Hickey et al., 2012; Riaz et al., 2016). To determine the identified QTL to be potentially novel or are associated with previously mapped QTL, allelism tests will be required.
Breeders engaged in wheat genetic improvement have a keen interest in looking for desirable parents or donor lines to enrich their crossing block. While grain yield is prime focus area along with end product making quality parameters, yet stabilization of yield potential through tolerance against abiotic and biotic stresses will always be a major concern. Therefore, any information on diverse or novel sources of resistance, in this case against the three rusts, is of considerable importance to the breeders. Since wheat cultivation in India corresponds to many of the agro-climatic regions growing wheat globally, the information becomes universally important in combating rust diseases. Our finding of hitherto less utilized sources of stripe, leaf and stem rust viz. IC321918, IC212153AMB, IC321998, H957, LBRL4, and some exotic lines shall attract the attention of the wheat breeders. When present alone, the APR genes/QTL do not confer adequate resistance especially under high disease pressure; however, combinations of 4 or 5 minor genes usually result in “near-immunity” or a high level of resistance (Singh et al., 2014). Increasing the frequency of QTL for rust resistance through divergent crossing in the population improvement program of wheat can provide durable rust resistance by broadening the genetic base for resistance. The pleiotropic QTL can confer slow rusting resistance against the three rusts of wheat. Bi-parental and multi-parent populations developed using resistant landraces and modern varieties shall enable toward this endeavor.
Data Availability Statement
All datasets generated for this study are included in the article/Supplementary Material.
Author Contributions
RT, AR, and DiK conceived the theme of study. DeK, AK, SS, SJ, MI, and UA analyzed the data. DeK, VC, and RT drafted the manuscript. DeK conducted the field condition phenotyping at Karnal, India. OG and SB conducted the phenotyping of the seedling resistance test. MS conducted the field condition phenotyping at Wellington, India. SP and TP the conducted field condition phenotyping at Indore, India. HK, RS, and PS provided insights into reported genes for rust resistance. VC, RT, GS, AR, GPS, and DiK provided overall guidance and edited the manuscript. All authors read and approved the final version of the manuscript.
Funding
This work was supported by the Indian Council of Agricultural Research; Ministry of Agriculture and Farmer’s welfare, Government of India by providing financial assistance in the form of CABin grant (F.No. Agril. Edn.4-1/2013-A&P).
Conflict of Interest
The authors declare that the research was conducted in the absence of any commercial or financial relationships that could be construed as a potential conflict of interest.
Acknowledgments
We are thankful to the Indian Council of Agricultural Research, Ministry of Agriculture and Farmers’ Welfare, Govt. of India for Advanced Super Computing Hub for Omics Knowledge in Agriculture (ASHOKA) facility at ICAR-IASRI, New Delhi, India created under National Agricultural Innovation Project, funded by World Bank at ICAR-IASRI, New Delhi. Support provided by the Department of Biotechnology, Ministry of Science and Technology, Government of India in the form of DBT-JRF fellowship program to DeK was acknowledged. Financial support from CABin Grant of ICAR-IASRI, New Delhi in the form of fellowship to AK was also thankfully acknowledged. Drs. Pramod Prasad and Subodh Kumar from the regional station, ICAR-IIWBR, Shimla for help in phenotyping against rust pathotypes. Support of Dr. Arun Gupta from the GRU, ICAR-IIWBR is highly acknowledged.
Supplementary Material
The Supplementary Material for this article can be found online at: https://www.frontiersin.org/articles/10.3389/fpls.2020.00748/full#supplementary-material
FIGURE S1 | Heatmap of correlation coefficients showing the correlation between the 18 pathotypes representing the three rusts used in the study. The magnitude of the correlation is represented by the color gradient legend on the right side of the heatmap. Significant correlations are marked as ∗(p < 0.05), ∗∗(p < 0.01), and ∗∗∗(p < 0.001).
FIGURE S2 | GGE Biplot representing variations explained in the first two principal components for field disease response against YR, LR, and SR. Concentric circles represent the ranking of genotypes with respect to being an ideal genotype stable in corresponding environments.
FIGURE S3 | Population stratification study by using principal component analysis on 483 genotypes in the panel with variation partitioned between the first two principal components. (A) Two subpopulations observed in STRUCTURE analysis are represented with separate colors in the PCA plot. Also, (B) different categories of genotypes in the panel are represented in different colors.
FIGURE S4 | (A) Q-Q plot, (B) Manhattan plot, and (C) minor allele frequency of the MTAs observed for seedling stage disease response against 18 pathotypes representing the three rusts using CMLM.
FIGURE S5 | (A) Q-Q plot, (B) Manhattan plot, and (C) minor allele frequency of the MTAs observed for adult plant field disease response against the three rusts in different environments using CMLM.
FIGURE S6 | Haplotype analysis of the representative SNPs observed for putative QTL in the study for (A) stripe rust, (B) leaf rust, and (C) stem rust field responses. The number and variations in the grayscale represent the percentage magnitude of LD r2-value between marker pairs.
FIGURE S7 | Hierarchical clustering based dendrogram representing 72 genotypes resistant to multiple rusts. The numbers suffixed to genotypes in parenthesis represents the total number of favorable alleles observed for field response based QTL representative SNPs.
TABLE S1 | Avirulence/virulence formula of predominant Indian wheat rust pathotypes used in the present study.
TABLE S2 | Nomenclature of environments (12) considered for the evaluation of field disease response at adult plant stage.
TABLE S3 | Phenotypic evaluation of RAMP at seedling and adult plant stage for multiple rusts.
TABLE S4 | Basic statistics of disease response on RAMP at seedling and adult plant stages.
TABLE S5 | Pearson’s Correlation matrix of seedling resistance test (SRT) for stripe (5), stem (7), and Leaf (6) rust pathotypes.
TABLE S6 | Correlation analysis of phenotypic data for multiple rusts observed in different environments (p-value ≤ 0.001∗∗∗, 0.01∗∗, 0.05∗).
TABLE S7 | Phenotypic reactions of the 483 genotypes included in the study to multiple rusts at seedling and adult stage, grouped based on population structure.
TABLE S8 | Marker trait associations (MTAs) observed at seedling stage for Rust pathotypes in RAMP at −log10P ≥ 3.
TABLE S9 | Putative QTLs identified significantly associated with seedling stage disease response against multiple rust pathotypes.
TABLE S10 | Marker trait associations (MTAs) observed at adult plant stage for multiple rusts in RAMP at −log10P ≥ 3.
TABLE S11 | Putative QTLs identified significantly associated with adult plant stage disease response against the three rusts.
TABLE S12 | Putative QTL observed at seedling and adult plant stage for the three rusts.
TABLE S13 | Distribution of favorable alleles of representative SNPs in 483 wheat genotypes.
FILE S1 | Comparative Q–Q plots of six association models for multiple rust pathotypes and four environments each for YR, LR, and SR. The CMLM was observed as the best fit model.
Footnotes
- ^ https://github.com/YinLiLin/R-CMplot
- ^ http://plants.ensembl.org/Triticum_aestivum/Info/Index
- ^ https://blast.ncbi.nlm.nih.gov/Blast.cgi
References
Abed, A., and Belzile, F. (2019). Comparing single-SNP, multi-SNP, and haplotype-based approaches in association studies for major traits in Barley. Plant Genome 12:190036. doi: 10.3835/plantgenome2019.05.0036
Allen, A. M., Barker, G. L. A., Wilkinson, P., Burridge, A., Winfield, M., Coghill, J., et al. (2013). Discovery and development of exome-based, co-dominant single nucleotide polymorphism markers in hexaploid wheat (Triticum aestivum L.). Plant Biotechnol. J. 11, 279–295. doi: 10.1111/pbi.12009
Allen, A. M., Winfield, M. O., Burridge, A. J., Downie, R. C., Benbow, H. R., Barker, G. L. A., et al. (2017). Characterization of a Wheat Breeders’ Array suitable for high-throughput SNP genotyping of global accessions of hexaploid bread wheat (Triticum aestivum). Plant Biotechnol. J. 15, 390–401. doi: 10.1111/pbi.12635
Aoun, M., Kolmer, J. A., Rouse, M. N., Elias, E. M., Breiland, M., Bulbula, W. D., et al. (2019). Mapping of novel leaf rust and stem rust resistance genes in the Portuguese durum wheat landrace PI 192051. G3 9, 2535–2547. doi: 10.1534/g3.119.400292
Appels, R., Eversole, K., Stein, N., Feuillet, C., Keller, B., Rogers, J., et al. (2018). Shifting the limits in wheat research and breeding using a fully annotated reference genome. Science 361:eaar7191. doi: 10.1126/science.aar7191
Arruda, M. P., Brown, P., Brown-Guedira, G., Krill, A. M., Thurber, C., Merrill, K. R., et al. (2016). Genome-wide association mapping of fusarium head blight resistance in wheat using genotyping-by-sequencing. Plant Genome 9, 1–14. doi: 10.3835/plantgenome2015.04.0028
Bansal, U. K., Hayden, M. J., Keller, B., Wellings, C. R., Park, R. F., and Bariana, H. S. (2009). Relationship between wheat rust resistance genes Yr1 and Sr48 and a microsatellite marker. Plant Pathol. 58, 1039–1043. doi: 10.1111/j.1365-3059.2009.02144.x
Barrett, J. C., Fry, B., Maller, J., and Daly, M. J. (2005). Haploview: analysis and visualization of LD and haplotype maps. Bioinformatics 21, 263–265. doi: 10.1093/bioinformatics/bth457
Bates, D., Mächler, M., Bolker, B. M., and Walker, S. C. (2015). Fitting linear mixed-effects models using lme4. J. Stat. Softw. 67:1. doi: 10.18637/jss.v067.i01
Bayer, M. M., Rapazote-Flores, P., Ganal, M., Hedley, P. E., Macaulay, M., Plieske, J., et al. (2017). Development and evaluation of a barley 50k iSelect SNP array. Front. Plant Sci. 8:1792. doi: 10.3389/fpls.2017.01792
Bhardwaj, S. C. (2011). Resistance genes and adult plant rust resistance of released wheat varieties of India. Res. Bull. 5:31.
Bhardwaj, S. C., Gangwar, O. P., Prasad, P., Kumar, S., Khan, H., and Gupta, N. (2019a). Physiologic specialization and shift in Puccinia triticina pathotypes on wheat in Indian subcontinent during 2013–2016. Indian Phytopathol. 72, 23–34. doi: 10.1007/s42360-018-00110-9
Bhardwaj, S. C., Singh, G. P., Gangwar, O. P., Prasad, P., and Kumar, S. (2019b). Status of wheat rust research and progress in rust management-indian context. Agronomy 9, 1–14. doi: 10.3390/agronomy9120892
Blake, V. C., Birkett, C., Matthews, D. E., Hane, D. L., Bradbury, P., and Jannink, J.-L. (2016). The Triticeae Toolbox: combining phenotype and genotype data to advance small-grains breeding. Plant Genome 9, 1–10. doi: 10.3835/plantgenome2014.12.0099
Boeven, P. H. G., Longin, C. F. H., Leiser, W. L., Kollers, S., Ebmeyer, E., and Würschum, T. (2016). Genetic architecture of male floral traits required for hybrid wheat breeding. Theor. Appl. Genet. 129, 2343–2357. doi: 10.1007/s00122-016-2771-6
Bolton, M. D., Kolmer, J. A., and Garvin, D. F. (2008). Wheat leaf rust caused by Puccinia triticina. Mol. Plant Pathol. 9, 563–575. doi: 10.1111/j.1364-3703.2008.00487.x
Boukhatem, N., Baret, P. V., Mingeot, D., and Jacquemin, J. M. (2002). Quantitative trait loci for resistance against yellow rust in two wheat-derived recombinant inbred line populations. Theor. Appl. Genet. 104, 111–118. doi: 10.1007/s001220200013
Boyd, L. A. (2005). Can Robigus defeat an old enemy? - Yellow rust of wheat. J. Agric. Sci. 143, 233–243. doi: 10.1017/S0021859605005095
Bradbury, P. J., Zhang, Z., Kroon, D. E., Casstevens, T. M., Ramdoss, Y., and Buckler, E. S. (2007). TASSEL: software for association mapping of complex traits in diverse samples. Bioinformatics 23, 2633–2635. doi: 10.1093/bioinformatics/btm308
Breseghello, F., and Sorrells, M. E. (2006). Association mapping of kernel size and milling quality in wheat (Triticum aestivum L.) cultivars. Genetics 172, 1165–1177. doi: 10.1534/genetics.105.044586
Brown-Guedira, G. L., Singh, S., and Fritz, A. K. (2003). Performance and mapping of leaf rust resistance transferred to wheat from Triticum timopheevii subsp. armeniacum. Phytopathology 93, 784–789. doi: 10.1094/PHYTO.2003.93.7.784
Buerstmayr, M., Matiasch, L., Mascher, F., Vida, G., Ittu, M., Robert, O., et al. (2014). Mapping of quantitative adult plant field resistance to leaf rust and stripe rust in two European winter wheat populations reveals co-location of three QTL conferring resistance to both rust pathogens. Theor. Appl. Genet. 127, 2011–2028. doi: 10.1007/s00122-014-2357-0
Bulli, P., Zhang, J., Chao, S., Chen, X., and Pumphrey, M. (2016). Genetic architecture of resistance to stripe rust in a global winter wheat germplasm collection. G3 6, 2237–2253. doi: 10.1534/g3.116.028407
Burdon, J. J., Barrett, L. G., Rebetzke, G., and Thrall, P. H. (2014). Guiding deployment of resistance in cereals using evolutionary principles. Evol. Appl. 7, 609–624. doi: 10.1111/eva.12175
Cavanagh, C. R., Chao, S., Wang, S., Huang, B. E., Stephen, S., Kiani, S., et al. (2013). Genome-wide comparative diversity uncovers multiple targets of selection for improvement in hexaploid wheat landraces and cultivars. Proc. Natl. Acad. Sci. U.S.A. 110, 8057–8062. doi: 10.1073/pnas.1217133110
Chen, C., He, Z., Lu, J., Li, J., Ren, Y., Ma, C., et al. (2016). Molecular mapping of stripe rust resistance gene YrJ22 in Chinese wheat cultivar Jimai 22. Mol. Breed. 36:118. doi: 10.1007/s11032-016-0540-5
Chen, X. (2013). High-temperature adult-Plant resistance, key for sustainable control of stripe rust. Am. J. Plant Sci. 04, 608–627. doi: 10.4236/ajps.2013.43080
Chen, X. M. (2005). Epidemiology and control of stripe rust (Puccinia striiformis f. sp. tritici) on wheat. Can. J. Plant Pathol. 27, 314–337. doi: 10.1080/07060660509507230
Chen, X. M., Line, R. F., and Leung, H. (1998). Genome scanning for resistance-gene analogs in rice, barley, and wheat by high-resolution electrophoresis. Theor. Appl. Genet. 97, 345–355. doi: 10.1007/s001220050905
Chhatre, V. E., and Emerson, K. J. (2017). StrAuto: automation and parallelization of STRUCTURE analysis. BMC Bioinformatics 18:192. doi: 10.1186/s12859-017-1593-0
Cleveland, W. S. (1981). Lowess: a program for smoothing scatterplots by robust locally weighted regression. Am. Stat. 35, 54–55. doi: 10.1080/00031305.1981.10479306_3
Colasuonno, P., Gadaleta, A., Giancaspro, A., Nigro, D., Giove, S., Incerti, O., et al. (2014). Development of a high-density SNP-based linkage map and detection of yellow pigment content QTLs in durum wheat. Mol. Breed. 34, 1563–1578. doi: 10.1007/s11032-014-0183-3
Conesa, A., and Götz, S. (2008). Blast2GO: a comprehensive suite for functional analysis in plant genomics. Int. J. Plant Genomics 2008:619832. doi: 10.1155/2008/619832
Corbeil, R. R., and Searle, S. R. (1976). Restricted maximum likelihood (reml) estimation of variance components in the mixed model. Technometrics 18, 31–38. doi: 10.1080/00401706.1976.10489397
Crossa, J., Burgueño, J., Dreisigacker, S., Vargas, M., Herrera-Foessel, S. A., Lillemo, M., et al. (2007). Association analysis of historical bread wheat germplasm using additive genetic covariance of relatives and population structure. Genetics 177, 1889–1913. doi: 10.1534/genetics.107.078659
Dong-fang, M. A., Hou, L., Sun, C., Zhang, X., Liang, Y. J., Yun, G. Q., et al. (2019). Molecular mapping of stripe rust resistance gene YrH9017 in wheat-Psathyrostachys huashanica introgression line H9017-14-16-5-3. J. Integr. Agric. 18, 108–114. doi: 10.1016/S2095-3119(18)62048-9
Dyck, P. L., and Kerber, E. R. (1977). Chromosome location of gene Sr29 for reaction to stem rust. Can. J. Genet. Cytol. 19, 371–373. doi: 10.1139/g77-040
Edae, E. A., Pumphrey, M. O., and Rouse, M. N. (2018). A genome-wide association study of field and seedling response to individual stem rust pathogen races reveals combinations of race-specific genes in north american spring wheat. Front. Plant Sci. 9:52. doi: 10.3389/fpls.2018.00052
Ellis, J. G., Lagudah, E. S., Spielmeyer, W., and Dodds, P. N. (2014). The past, present and future of breeding rust resistant wheat. Front. Plant Sci. 5:641. doi: 10.3389/fpls.2014.00641
Eriksen, L., Afshari, F., Christiansen, M. J., McIntosh, R. A., Jahoor, A., and Wellings, C. R. (2004). Yr32 for resistance to stripe (yellow) rust present in the wheat cultivar Carstens V. Theor. Appl. Genet. 108, 567–575. doi: 10.1007/s00122-003-1573-9
Feng, J., Wang, M., See, D. R., Chao, S., Zheng, Y., and Chen, X. (2018). Characterization of novel gene Yr79 and four additional quantitative trait loci for all-stage and high-temperature adult-plant resistance to stripe rust in spring wheat PI 182103. Phytopathology 108, 737–747. doi: 10.1094/PHYTO-11-17-0375-R
Feng, J. Y., Wang, M. N., Chen, X. M., See, D. R., Zheng, Y. L., Chao, S. M., et al. (2015). Molecular mapping of YrSP and its relationship with other genes for stripe rust resistance in wheat chromosome 2BL. Phytopathology 105, 1206–1213. doi: 10.1094/PHYTO-03-15-0060-R
Friebe, B., Jiang, J., Gill, B. S., and Dyck, P. L. (1993). Radiation-induced nonhomoeologous wheat-Agropyron intermedium chromosomal translocations conferring resistance to leaf rust. Theor. Appl. Genet. 86, 141–149. doi: 10.1007/BF00222072
Frutos, E., Galindo, M. P., and Leiva, V. (2014). An interactive biplot implementation in R for modeling genotype-by-environment interaction. Stoch. Environ. Res. Risk Assess. 28, 1629–1641. doi: 10.1007/s00477-013-0821-z
Gangwar, O. P., Kumar, S., Bhardwaj, S. C., Kashyap, P. L., Prasad, P., and Khan, H. (2019). Characterization of three new Yr9-virulences and identification of sources of resistance among recently developed Indian bread wheat germplasm. J. Plant Pathol. 101, 955–963. doi: 10.1007/s42161-019-00302-w
Gao, L., Kathryn Turner, M., Chao, S., Kolmer, J., and Anderson, J. A. (2016). Genome wide association study of seedling and adult plant leaf rust resistance in elite spring wheat breeding lines. PLoS One 11:e0148671. doi: 10.1371/journal.pone.0148671
Gao, L., Rouse, M. N., Mihalyov, P. D., Bulli, P., Pumphrey, M. O., and Anderson, J. A. (2017). Genetic characterization of stem rust resistance in a global spring wheat germplasm collection. Crop Sci. 57, 2575–2589. doi: 10.2135/cropsci2017.03.0159
Garcia, M., Eckermann, P., Haefele, S., Satija, S., Sznajder, B., Timmins, A., et al. (2019). Genome-wide association mapping of grain yield in a diverse collection of spring wheat (Triticum aestivum L.) evaluated in southern Australia. PLoS One 14:e0211730. doi: 10.1371/journal.pone.0211730
Gebrewahid, T. W., Zhang, P., Zhou, Y., Yan, X., Xia, X., He, Z., et al. (2020). QTL mapping of adult plant resistance to stripe rust and leaf rust in a Fuyu 3/Zhengzhou 5389 wheat population. Crop J. (in press). doi: 10.1016/j.cj.2019.09.013
Gill, H. S., Li, C., Sidhu, J. S., Liu, W., Wilson, D., Bai, G., et al. (2019). Fine mapping of the wheat leaf rust resistance gene Lr42. Int. J. Mol. Sci. 20:2445. doi: 10.3390/ijms20102445
Godoy, J. G., Rynearson, S., Chen, X., and Pumphrey, M. (2018). Genome-wide association mapping of loci for resistance to stripe rust in north American elite spring wheat germplasm. Phytopathology 108, 234–245. doi: 10.1094/PHYTO-06-17-0195-R
Gupta, P. K., Mir, R. R., Mohan, A., and Kumar, J. (2008). Wheat genomics: present status and future prospects. Int. J. Plant Genomics 2008:896451. doi: 10.1155/2008/896451
Hall, D., Tegström, C., and Ingvarsson, P. K. (2010). Using association mapping to dissect the genetic basis of complex traits in plants. Brief. Funct. Genomics Proteomics 9, 157–165. doi: 10.1093/bfgp/elp048
Hickey, L. T., Wilkinson, P. M., Knight, C. R., Godwin, I. D., Kravchuk, O. Y., Aitken, E. A. B., et al. (2012). Rapid phenotyping for adult-plant resistance to stripe rust in wheat. Plant Breed. 131, 54–61. doi: 10.1111/j.1439-0523.2011.01925.x
Huerta-Espino, J., Singh, R. P., Germán, S., McCallum, B. D., Park, R. F., Chen, W. Q., et al. (2011). Global status of wheat leaf rust caused by Puccinia triticina. Euphytica 179, 143–160. doi: 10.1007/s10681-011-0361-x
Hwang, E.-Y. Y., Song, Q., Jia, G., Specht, J. E., Hyten, D. L., Costa, J., et al. (2014). A genome-wide association study of seed protein and oil content in soybean. BMC Genomics 15:1. doi: 10.1186/1471-2164-15-1
Jia, J., and Zhao, G. (2016). Wheat 660K SNP Array Developed by CAAS. Available online at: http://wheat.pw.usda.gov/ggpages/topics/Wheat660_SNP_array_developed_by_CAAS.pdf (accessed November, 2019).
Jiang, J., Friebe, B., and Gill, B. S. (1993). Recent advances in alien gene transfer in wheat. Euphytica 73, 199–212. doi: 10.1007/BF00036700
Jighly, A., Oyiga, B. C., Makdis, F., Nazari, K., Youssef, O., Tadesse, W., et al. (2015). Genome-wide DArT and SNP scan for QTL associated with resistance to stripe rust (Puccinia striiformis f. sp. tritici) in elite ICARDA wheat (Triticum aestivum L.) germplasm. Theor. Appl. Genet. 128, 1277–1295. doi: 10.1007/s00122-015-2504-2
Jin, Y., Singh, R. P., Ward, R. W., Wanyera, R., Kinyua, M., Njau, P., et al. (2007). Characterization of seedling infection types and adult plant infection responses of monogenic Sr gene lines to race TTKS of Puccinia graminis f. sp. tritici. Plant Dis. 91, 1096–1099. doi: 10.1094/PDIS-91-9-1096
Jin, Y., Szabo, L. J., Pretorius, Z. A., Singh, R. P., Ward, R., and Fetch, T. (2008). Detection of virulence to resistance gene Sr24 within race TTKS of Puccinia graminis f. sp. tritici. Plant Dis. 92, 923–926. doi: 10.1094/PDIS-92-6-0923
Jin, Y., Szabo, L. J., Rouse, M. N., Fetch, T., Pretorius, Z. A., Wanyera, R., et al. (2009). Detection of virulence to resistance gene Sr36 within the TTKS race lineage of Puccinia graminis f. sp. tritici. Plant Dis. 93, 367–370. doi: 10.1094/PDIS-93-4-0367
Joshi, L. M., Srivastava, K. D., and Singh, D. V. (1985). Monitoring of wheat rusts in the Indian sub-continent. Proc. Plant Sci. 94, 387–406. doi: 10.1007/BF03053154
Kertho, A., Mamidi, S., Bonman, J. M., McClean, P. E., and Acevedo, M. (2015). Genome-wide association mapping for resistance to leaf and stripe rust in winter-habit hexaploid wheat landraces. PLoS One 10:e0129580. doi: 10.1371/journal.pone.0129580
Kolmer, J. A. (2015). Leaf rust resistance in wheat line RL6062 is an allele at the Lr3 locus. Crop Sci. 55, 2186–2190. doi: 10.2135/cropsci2015.01.0031
Kolmer, J. A., Bernardo, A., Bai, G., Hayden, M. J., and Anderson, J. A. (2019). Thatcher wheat line RL6149 carries Lr64 and a second leaf rust resistance gene on chromosome 1DS. Theor. Appl. Genet. 132, 2809–2814. doi: 10.1007/s00122-019-03389-y
Kolmer, J. A., Jin, Y., and Long, D. L. (2007). Wheat leaf and stem rust in the United States. Aust. J. Agric. Res. 58, 631–638. doi: 10.1071/AR07057
Krattinger, S. G., Jordan, D. R., Mace, E. S., Raghavan, C., Luo, M. C., Keller, B., et al. (2013). Recent emergence of the wheat Lr34 multi-pathogen resistance: insights from haplotype analysis in wheat, rice, sorghum and Aegilops tauschii. Theor. Appl. Genet. 126, 663–672. doi: 10.1007/s00122-012-2009-1
Krattinger, S. G., Kang, J., Bräunlich, S., Boni, R., Chauhan, H., Selter, L. L., et al. (2019). Abscisic acid is a substrate of the ABC transporter encoded by the durable wheat disease resistance gene Lr34. New Phytol. 223, 853–866. doi: 10.1111/nph.15815
Kumar, D., Chhokar, V., Sheoran, S., Singh, R., Sharma, P., Jaiswal, S., et al. (2020). Characterization of genetic diversity and population structure in wheat using array based SNP markers. Mol. Biol. Rep. 47, 293–306. doi: 10.1007/s11033-019-05132-8
Kuraparthy, V., Sood, S., Chhuneja, P., Dhaliwal, H. S., Kaur, S., Bowden, R. L., et al. (2007). A cryptic wheat-Aegilops triuncialis translocation with leaf rust resistance gene Lr58. Crop Sci. 47, 1995–2003. doi: 10.2135/cropsci2007.01.0038
Lagudah, E. S. (2011). Molecular genetics of race non-specific rust resistance in wheat. Euphytica 179, 81–91. doi: 10.1007/s10681-010-0336-3
Laidò, G., Panio, G., Marone, D., Russo, M. A., Ficco, D. B. M., Giovanniello, V., et al. (2015). Identification of new resistance loci to african stem rust race TTKSK in tetraploid wheats based on linkage and genome-wide association mapping. Front. Plant Sci. 6:1033. doi: 10.3389/fpls.2015.01033
Levene, H. (1960). “Robust tests for equality of variances,” in Contributions to Probability and Statistics: Essays in Honor of Harold Hotelling, eds I. Olkin, et al. (Palo Alto, CA: Stanford University Press), 279–292.
Li, Z., Lan, C., He, Z., Singh, R. P., Rosewarne, G. M., Chen, X., et al. (2014). Overview and application of QTL for adult plant resistance to leaf rust and powdery mildew in wheat. Crop Sci. 54, 1907–1925. doi: 10.2135/cropsci2014.02.0162
Li, Z., Yuan, C., Herrera-Foessel, S. A., Randhawa, M. S., Huerta-Espino, J., Liu, D., et al. (2020). Four consistent loci confer adult plant resistance to leaf rust in the durum Wheat Lines Heller#1 and Dunkler. Phytopathology 110, 892–899. doi: 10.1094/phyto-09-19-0348-r
Line, R. F., and Qayoum, A. (1992). Virulence, aggressiveness, evolution and distribution of races of Puccinia striiformis (the cause of stripe of wheat) in North America, 1968–1987. U.S. Dep. Agric. Tech. Bull. 1788:44.
Lipka, A. E., Tian, F., Wang, Q., Peiffer, J., Li, M., Bradbury, P. J., et al. (2012). GAPIT: genome association and prediction integrated tool. Bioinformatics 28, 2397–2399. doi: 10.1093/bioinformatics/bts444
Liu, W., Maccaferri, M., Chen, X., Laghetti, G., Pignone, D., Pumphrey, M., et al. (2017). Genome-wide association mapping reveals a rich genetic architecture of stripe rust resistance loci in emmer wheat (Triticum turgidum ssp. dicoccum). Theor. Appl. Genet. 130, 2249–2270. doi: 10.1007/s00122-017-2957-6
Liu, Y., Qie, Y., Li, X., Wang, M., and Chen, X. (2020). Genome-wide mapping of quantitative trait loci conferring all-stage and high-temperature adult-plant resistance to stripe rust in spring wheat landrace PI 181410. Int. J. Mol. Sci. 21:1594. doi: 10.3390/ijms21020478
Loegering, W. Q. (1959). Methods for Recording Cereal Rust Data in International Spring Wheat Rust Nursery (IRN). Washington, DC: USDA.
Long, Y. M., Chao, W. S., Ma, G. J., Xu, S. S., and Qi, L. L. (2017). An innovative SNP genotyping method adapting to multiple platforms and throughputs. Theor. Appl. Genet. 130, 597–607. doi: 10.1007/s00122-016-2838-4
Luján Basile, S. M., Ramírez, I. A., Crescente, J. M., Conde, M. B., Demichelis, M., Abbate, P., et al. (2019). Haplotype block analysis of an Argentinean hexaploid wheat collection and GWAS for yield components and adaptation. BMC Plant Biol. 19:553. doi: 10.1186/s12870-019-2015-4
Maccaferri, M., Ricci, A., Salvi, S., Milner, S. G., Noli, E., Martelli, P. L., et al. (2015a). A high-density, SNP-based consensus map of tetraploid wheat as a bridge to integrate durum and bread wheat genomics and breeding. Plant Biotechnol. J. 13, 648–663. doi: 10.1111/pbi.12288
Maccaferri, M., Zhang, J., Bulli, P., Abate, Z., Chao, S., Cantu, D., et al. (2015b). A genome-wide association study of resistance to stripe rust (Puccinia striiformis f. sp. tritici) in a worldwide collection of hexaploid spring wheat (Triticum aestivum L.). G3 5, 449–465. doi: 10.1534/g3.114.014563
Mago, R., Miah, H., Lawrence, G. J., Wellings, C. R., Spielmeyer, W., Bariana, H. S., et al. (2005). High-resolution mapping and mutation analysis separate the rust resistance genes Sr31, Lr26 and Yr9 on the short arm of rye chromosome 1. Theor. Appl. Genet. 112, 41–50. doi: 10.1007/s00122-005-0098-9
Mahajan, M. M., Goyal, E., Singh, A. K., Gaikwad, K., and Kanika, K. (2017). Transcriptome dynamics provide insights into long-term salinity stress tolerance in Triticum aestivum cv. Kharchia Local. Plant Physiol. Biochem. 121, 128–139. doi: 10.1016/j.plaphy.2017.10.021
Mahajan, M. M., Goyal, E., Singh, A. K., Gaikwad, K., and Kanika, K. (2020). Shedding light on response of Triticum aestivum cv. Kharchia Local roots to long-term salinity stress through transcriptome profiling. Plant Growth Regul. 90, 369–381. doi: 10.1007/s10725-019-00565-4
Marais, G. F., McCallum, B., and Marais, A. S. (2008). Wheat leaf rust resistance gene Lr59 derived from Aegilops peregrina. Plant Breed. 127, 340–345. doi: 10.1111/j.1439-0523.2008.01513.x
Marasas, C. N., Smale, M., and Singh, R. P. (2002). The Impact of Agricultural Maintenance Research: The Case of Leaf Rust Resistance Breeding in CIMMYT-Related Spring Bread Wheat. Mexico: CIMMYT.
Mcintosh, R. A. (1992). Close genetic linkage of genes conferring adult-plant resistance to leaf rust and stripe rust in wheat. Plant Pathol. 41, 523–527. doi: 10.1111/j.1365-3059.1992.tb02450.x
McIntosh, R. A., Dubcovsky, J., Rogers, W. J., Morris, C., Appels, R., and Xia, X. C. (2009). Catalogue of Gene Symbols for Wheat: 2009 Supplement. Available online at: https://shigen.nig.ac.jp/wheat/komugi/genes/macgene/supplement2009.pdf (accessed June, 2019).
McIntosh, R. A., Dubcovsky, J., Rogers, W. J., Morris, C., and Xia, X. C. (2017). Catalogue of Gene Symbols for Wheat: 2017 Supplement. Komugi Wheat Genet. Resour. Database. Available online at: https://shigen.nig.ac.jp/wheat/komugi/genes/macgene/supplement2017.pdf (accessed June, 2019).
McIntosh, R. A., Dubcovsky, J., Rogers, W. J., Morris, C. F., Appels, R., and Xia, X. C. (2014). Catalogue of Gene Symbols for Wheat: 2013-2014 Supplement. Available online at: https://shigen.nig.ac.jp/wheat/komugi/genes/macgene/supplement2013.pdf (accessed June, 2019).
McIntosh, R. A., Wellings, C. R., and Park, R. F. (1995). Wheat Rusts: An Atlas of Resistance Genes. East Melbourne: CSIRO Publishing.
Mebrate, S. A., Oerke, E. C., Dehne, H. W., and Pillen, K. (2008). Mapping of the leaf rust resistance gene Lr38 on wheat chromosome arm 6DL using SSR markers. Euphytica 162, 457–466. doi: 10.1007/s10681-007-9615-z
Mihalyov, P. D., Nichols, V. A., Bulli, P., Rouse, M. N., and Pumphrey, M. O. (2017). Multi-Locus Mixed Model analysis of stem rust resistance in winter wheat. Plant Genome 10, 1–12. doi: 10.3835/plantgenome2017.01.0001
Mondal, S., Rutkoski, J. E., Velu, G., Singh, P. K., Crespo-Herrera, L. A., Guzman, C., et al. (2016). Harnessing diversity in wheat to enhance grain yield, climate resilience, disease and insect pest resistance and nutrition through conventional and modern breeding approaches. Front. Plant Sci. 7:991. doi: 10.3389/fpls.2016.00991
Mu, J., Wu, J., Liu, S., Dai, M., Sun, D., Huang, S., et al. (2019). Genome-wide linkage mapping reveals stripe rust resistance in common wheat (Triticum aestivum) Xinong1376. Plant Dis. 103, 2742–2750. doi: 10.1094/PDIS-12-18-2264-RE
Mujeeb-Kazi, A., Kazi, A. G., Dundas, I., Rasheed, A., Ogbonnaya, F., Kishii, M., et al. (2013). Genetic diversity for wheat improvement as a conduit to food security. Adv. Agron. 4, 179–257. doi: 10.1016/B978-0-12-417187-9.00004-8
Muleta, K. T., Bulli, P., Rynearson, S., Chen, X., and Pumphrey, M. (2017a). Loci associated with resistance to stripe rust (Puccinia striiformis f. sp. tritici) in a core collection of spring wheat (Triticum aestivum). PLoS One 12:e0179087. doi: 10.1371/journal.pone.0179087
Muleta, K. T., Rouse, M. N., Rynearson, S., Chen, X., Buta, B. G., and Pumphrey, M. O. (2017b). Characterization of molecular diversity and genome-wide mapping of loci associated with resistance to stripe rust and stem rust in Ethiopian bread wheat accessions. BMC Plant Biol. 17:134. doi: 10.1186/s12870-017-1082-7
Nagarajan, S., and Joshi, L. M. (1985). “Epidemiology in the Indian Subcontinent,” in The Cereal Rust: Diseases, Distribution, Epidemiology, and Control, eds A. P. Roelfs, and W. R. Bushnell, (London: Academic Press), 371–402. doi: 10.1016/b978-0-12-148402-6.50020-1
Navabi, A., Tewari, J. P., Singh, R. P., McCallum, B., Laroche, A., and Briggs, K. G. (2005). Inheritance and QTL analysis of durable resistance to stripe and leaf rusts in an Australian cultivar, Triticum aestivum “Cook.”. Genome 48, 97–107. doi: 10.1139/g04-100
Newcomb, M., Olivera, P. D., Rouse, M. N., Szabo, L. J., Johnson, J., Gale, S., et al. (2016). Kenyan isolates of Puccinia graminis f. sp. tritici from 2008 to 2014: virulence to SrTmp in the Ug99 race group and implications for breeding programs. Phytopathology 106, 729–736. doi: 10.1094/PHYTO-12-15-0337-R
Nielsen, N. H., Backes, G., Stougaard, J., Andersen, S. U., and Jahoor, A. (2014). Genetic diversity and population structure analysis of European hexaploid bread wheat (Triticum aestivum L.) varieties. PLoS One 9:e94000. doi: 10.1371/journal.pone.0094000
Niks, R. E., Qi, X., and Marcel, T. C. (2015). Quantitative resistance to biotrophic filamentous plant pathogens: concepts, misconceptions, and mechanisms. Annu. Rev. Phytopathol. 53, 445–470. doi: 10.1146/annurev-phyto-080614-115928
Nirmala, J., Chao, S., Olivera, P., Babiker, E. M., Abeyo, B., Tadesse, Z., et al. (2016). Markers linked to wheat stem rust resistance gene Sr11 effective to Puccinia graminis f. sp. tritici race TKTTF. Phytopathology 106, 1352–1358. doi: 10.1094/PHYTO-04-16-0165-R
Nsabiyera, V., Bariana, H. S., Qureshi, N., Wong, D., Hayden, M. J., and Bansal, U. K. (2018). Characterisation and mapping of adult plant stripe rust resistance in wheat accession Aus27284. Theor. Appl. Genet. 131, 1459–1467. doi: 10.1007/s00122-018-3090-x
Pardey, P. G., Beddow, J. M., Kriticos, D. J., Hurley, T. M., Park, R. F., Duveiller, E., et al. (2013). Right-sizing stem-rust research. Science 340, 147–148. doi: 10.1126/science.122970
Park, R. F. (2016). “Wheat: biotrophic pathogen resistance,” in Reference Module in Food Science, 2nd Edn, ed. C. R. Wrigley, (Amsterdam: Elsevier Ltd), doi: 10.1016/b978-0-08-100596-5.00207-9
Pasam, R. K., Bansal, U., Daetwyler, H. D., Forrest, K. L., Wong, D., Petkowski, J., et al. (2017). Detection and validation of genomic regions associated with resistance to rust diseases in a worldwide hexaploid wheat landrace collection using BayesR and mixed linear model approaches. Theor. Appl. Genet. 130, 777–793. doi: 10.1007/s00122-016-2851-7
Pasam, R. K., Sharma, R., Malosetti, M., van Eeuwijk, F. A., Haseneyer, G., Kilian, B., et al. (2012). Genome-wide association studies for agronomical traits in a world wide spring barley collection. BMC Plant Biol. 12:16. doi: 10.1186/1471-2229-12-16
Pawar, S., Kumar, P., Singh Duhan, J., Singh Saharan, M., Chandra Bharadwaj, S., Tiwari, R., et al. (2013). Characterization of adult plant leaf rust resistance gene Lr34 in Indian wheat genotypes using an STS marker. J. Wheat Res. 5, 15–20.
Periyannan, S., Moore, J., Ayliffe, M., Bansal, U., Wang, X., Huang, L., et al. (2013). The gene Sr33, an ortholog of barley Mla genes, encodes resistance to wheat stem rust race Ug99. Science 341, 786–788. doi: 10.1126/science.1239028
Peterson, R. F., Campbell, A. B., and Hannah, A. E. (1948). A diagrammatic scale for estimating rust intensity on leaves and stems of cereals. Can. J. Res. 26c, 496–500. doi: 10.1139/cjr48c-033
Prasad, P., Bhardwaj, S. C., Savadi, S., Kashyap, P. L., Gangwar, O. P., Khan, H., et al. (2018). Population distribution and differentiation of Puccinia graminis tritici detected in the Indian subcontinent during 2009–2015. Crop Prot. 108, 128–136. doi: 10.1016/j.cropro.2018.02.021
Pretorius, Z. A., Bender, C. M., Visser, B., and Terefe, T. (2010). First report of a Puccinia graminis f. sp. tritici race virulent to the Sr24 and Sr31 wheat stem rust resistance genes in South Africa. Plant Dis. 94, 784. doi: 10.1094/PDIS-94-6-0784C
Pretorius, Z. A., Singh, R. P., Wagoire, W. W., and Payne, T. S. (2000). Detection of virulence to wheat stem rust resistance gene Sr31 in Puccinia graminis. f. sp. tritici in Uganda. Plant Dis. 84:203. doi: 10.1094/PDIS.2000.84.2.203B
Pritchard, J. K., Stephens, M., and Donnelly, P. (2000). Inference of population structure using multilocus genotype data. Genetics 155, 945–959. doi: 10.1111/j.1471-8286.2007.01758.x
Randhawa, M. S., Lan, C., Basnet, B. R., Bhavani, S., Huerta-Espino, J., Forrest, K. L., et al. (2018). Interactions among genes Sr2/Yr30, Lr34/Yr18/Sr57 and Lr68 confer enhanced adult plant resistance to rust diseases in common wheat (Triticum aestivum L.) line “Arula.”. Aust. J. Crop Sci. 12, 1023–1033. doi: 10.21475/ajcs.18.12.06.PNE1305
Rasheed, A., Wen, W., Gao, F., Zhai, S., Jin, H., Liu, J., et al. (2016). Development and validation of KASP assays for genes underpinning key economic traits in bread wheat. Theor. Appl. Genet. 129, 1843–1860. doi: 10.1007/s00122-016-2743-x
Rasheed, A., and Xia, X. (2019). From markers to genome-based breeding in wheat. Theor. Appl. Genet. 132, 767–784. doi: 10.1007/s00122-019-03286-4
Ren, T. H., Yang, Z. J., Yan, B. J., Zhang, H. Q., Fu, S. L., and Ren, Z. L. (2009). Development and characterization of a new 1BL.1RS translocation line with resistance to stripe rust and powdery mildew of wheat. Euphytica 169, 207–213. doi: 10.1007/s10681-009-9924-5
Ren, Y., He, Z., Li, J., Lillemo, M., Wu, L., Bai, B., et al. (2012a). QTL mapping of adult-plant resistance to stripe rust in a population derived from common wheat cultivars Naxos and Shanghai 3/Catbird. Theor. Appl. Genet. 125, 1211–1221. doi: 10.1007/s00122-012-1907-6
Ren, Y., Li, Z., He, Z., Wu, L., Bai, B., Lan, C., et al. (2012b). QTL mapping of adult-plant resistances to stripe rust and leaf rust in Chinese wheat cultivar Bainong 64. Theor. Appl. Genet. 125, 1253–1262. doi: 10.1007/s00122-012-1910-y
Riaz, A., Athiyannan, N., Periyannan, S. K., Afanasenko, O., Mitrofanova, O. P., Platz, G. J., et al. (2018). Unlocking new alleles for leaf rust resistance in the Vavilov wheat collection. Theor. Appl. Genet. 131, 127–144. doi: 10.1007/s00122-017-2990-5
Riaz, A., Periyannan, S., Aitken, E., and Hickey, L. (2016). A rapid phenotyping method for adult plant resistance to leaf rust in wheat. Plant Methods 12:17. doi: 10.1186/s13007-016-0117-7
Riedelsheimer, C., Lisec, J., Czedik-Eysenberg, A., Sulpice, R., Flis, A., Grieder, C., et al. (2012). Genome-wide association mapping of leaf metabolic profiles for dissecting complex traits in maize. Proc. Natl. Acad. Sci. U.S.A. 109, 8872–8877. doi: 10.1073/pnas.1120813109
Risk, J. M., Selter, L. L., Krattinger, S. G., Viccars, L. A., Richardson, T. M., Buesing, G., et al. (2012). Functional variability of the Lr34 durable resistance gene in transgenic wheat. Plant Biotechnol. J. 10, 477–487. doi: 10.1111/j.1467-7652.2012.00683.x
Röder, M. S., Korzun, V., Wendehake, K., Plaschke, J., Tixier, M. H., Leroy, P., et al. (1998). A microsatellite map of wheat. Genetics 149, 2007–2023.
Roelfs, A. P., Singh, R. P., and Saari, E. E. (1992). Rust Diseases of Wheat: Concepts and Methods of Disease Management. Mexico: CIMMYT.
Rosewarne, G. M., Herrera-Foessel, S. A., Singh, R. P., Huerta-Espino, J., Lan, C. X., and He, Z. H. (2013). Quantitative trait loci of stripe rust resistance in wheat. Theor. Appl. Genet. 126, 2427–2449. doi: 10.1007/s00122-013-2159-9
Rosewarne, G. M., Singh, R. P., Huerta-Espino, J., Herrera-Foessel, S. A., Forrest, K. L., Hayden, M. J., et al. (2012). Analysis of leaf and stripe rust severities reveals pathotype changes and multiple minor QTLs associated with resistance in an Avocet × Pastor wheat population. Theor. Appl. Genet. 124, 1283–1294. doi: 10.1007/s00122-012-1786-x
Sambasivam, P. K., Bansal, U. K., Hayden, M. J., Lagudah, E. S., and Bariana, H. S. (2008). “Identification of markers linked with stem rust resistance genes Sr33 and Sr45,” in Proceedings of the 11th International Wheat Genetics Symposium, Brisbane, 20–22.
Santra, D. K., Chen, X. M., Santra, M., Campbell, K. G., and Kidwell, K. K. (2008). Identification and mapping QTL for high-temperature adult-plant resistance to stripe rust in winter wheat (Triticum aestivum L.) cultivar “Stephens”. Theor. Appl. Genet. 117, 793–802. doi: 10.1007/s00122-008-0820-5
Schachermayr, G., Siedler, H., Gale, M. D., Winzeler, H., Winzeler, M., and Keller, B. (1994). Identification and localization of molecular markers linked to the Lr9 leaf rust resistance gene of wheat. Theor. Appl. Genet. 88, 110–115. doi: 10.1007/BF00222402
Schlegel, R., and Korzun, V. (1997). About the origin of 1RS.1BL wheat-rye chromosome translocations from Germany. Plant Breed. 116, 537–540. doi: 10.1111/j.1439-0523.1997.tb02186.x
Semagn, K., Babu, R., Hearne, S., and Olsen, M. (2014). Single nucleotide polymorphism genotyping using Kompetitive Allele Specific PCR (KASP): overview of the technology and its application in crop improvement. Mol. Breed. 33, 1–14. doi: 10.1007/s11032-013-9917-x
Semagn, K., Bjørnstad, Å., and Xu, Y. (2010). The genetic dissection of quantitative traits in crops. Electron. J. Biotechnol. 13, 16–17.
Sharma, J. S., Zhang, Q., Rouse, M. N., Klindworth, D. L., Friesen, T. L., Long, Y., et al. (2019). Mapping and characterization of two stem rust resistance genes derived from cultivated emmer wheat accession PI 193883. Theor. Appl. Genet. 132, 3177–3189. doi: 10.1007/s00122-019-03417-x
Sheoran, S., Jaiswal, S., Kumar, D. D., Raghav, N., Sharma, R., Pawar, S., et al. (2019). Uncovering genomic regions associated with 36 agro-morphological traits in Indian spring wheat using GWAS. Front. Plant Sci. 10:527. doi: 10.3389/fpls.2019.00527
Singh, D., Mohler, V., and Park, R. F. (2013). Discovery, characterisation and mapping of wheat leaf rust resistance gene Lr71. Euphytica 190, 131–136. doi: 10.1007/s10681-012-0786-x
Singh, D., Park, R. F., McIntosh, R. A., and Bariana, H. S. (2008). Characterisation of stem rust and stripe rust seedling resistance genes in selected wheat cultivars from the United Kingdom. J. Plant Pathol. 90, 553–562. doi: 10.4454/jpp.v90i3.700
Singh, R. P., Herrera-Foessel, S., Huerta-Espino, J., Singh, S., Bhavani, S., Lan, C., et al. (2014). Progress towards genetics and breeding for minor genes based resistance to Ug99 and other rusts in CIMMYT high-yielding spring wheat. J. Integr. Agric. 13, 255–261. doi: 10.1016/S2095-3119(13)60649-8
Singh, R. P., Huerta-Espino, J., and William, H. M. (2005). Genetics and breeding for durable resistance to leaf and stripe rusts in wheat. Turkish J. Agric. For. 29, 121–127. doi: 10.3906/tar-0402-2
Singla, J., Lüthi, L., Wicker, T., Bansal, U., Krattinger, S. G., and Keller, B. (2017). Characterization of Lr75: a partial, broad-spectrum leaf rust resistance gene in wheat. Theor. Appl. Genet. 130, 1–12. doi: 10.1007/s00122-016-2784-1
Skinner, M. E., Uzilov, A. V., Stein, L. D., Mungall, C. J., and Holmes, I. H. (2009). JBrowse: a next-generation genome browser. Genome Res. 19, 1630–1638. doi: 10.1101/gr.094607.109
Stakman, E. C., Stewart, D. M., and Loegering, W. Q. (1962). Identification of Physiologic Races of Puccinia graminis var. tritici. Washington, DC: USDA.
Stich, B., Möhring, J., Piepho, H. P., Heckenberger, M., Buckler, E. S., and Melchinger, A. E. (2008). Comparison of mixed-model approaches for association mapping. Genetics 178, 1745–1754. doi: 10.1534/genetics.107.079707
Sukumaran, S., Reynolds, M. P., and Sansaloni, C. (2018). Genome-wide association analyses identify QTL hotspots for yield and component traits in durum wheat grown under yield potential, drought, and heat stress environments. Front. Plant Sci. 9:81. doi: 10.3389/fpls.2018.00081
VanRaden, P. M. (2008). Efficient methods to compute genomic predictions. J. Dairy Sci. 91, 4414–4423. doi: 10.3168/jds.2007-0980
Vazquez, M. D., Peterson, C. J., Riera-Lizarazu, O., Chen, X., Heesacker, A., Ammar, K., et al. (2012). Genetic analysis of adult plant, quantitative resistance to stripe rust in wheat cultivar “Stephens” in multi-environment trials. Theor. Appl. Genet. 124, 1–11. doi: 10.1007/s00122-011-1681-x
Visioni, A., Gyawali, S., Selvakumar, R., Gangwar, O. P., Shekhawat, P. S., Bhardwaj, S. C., et al. (2018). Genome wide association mapping of seedling and adult plant resistance to barley stripe rust (Puccinia striiformis f. sp. hordei) in India. Front. Plant Sci. 9:520. doi: 10.3389/fpls.2018.00520
Visser, B., Herselman, L., Park, R. F., Karaoglu, H., Bender, C. M., and Pretorius, Z. A. (2011). Characterization of two new Puccinia graminis f. sp. tritici races within the Ug99 lineage in South Africa. Euphytica 179, 119–127. doi: 10.1007/s10681-010-0269-x
Voss-Fels, K., Frisch, M., Qian, L., Kontowski, S., Friedt, W., Gottwald, S., et al. (2015). Subgenomic diversity patterns caused by directional selection in bread wheat gene pools. Plant Genome 8, 1–13. doi: 10.3835/plantgenome2015.03.0013
Wang, S., Wong, D., Forrest, K., Allen, A., Chao, S., Huang, B. E., et al. (2014). Characterization of polyploid wheat genomic diversity using a high-density 90 000 single nucleotide polymorphism array. Plant Biotechnol. J. 12, 787–796. doi: 10.1111/pbi.12183
Watson, A., Ghosh, S., Williams, M. J., Cuddy, W. S., Simmonds, J., Rey, M. D., et al. (2018). Speed breeding is a powerful tool to accelerate crop research and breeding. Nat. Plants 4, 23–29. doi: 10.1038/s41477-017-0083-8
Wiesner-Hanks, T., and Nelson, R. (2016). Multiple disease resistance in plants. Annu. Rev. Phytopathol 54, 229–252. doi: 10.1146/annurev-phyto-080615-100037
Wilkinson, P. A., Winfield, M. O., Barker, G. L. A., Allen, A. M., Burridge, A., Coghill, J. A., et al. (2012). CerealsDB 2.0: an integrated resource for plant breeders and scientists. BMC Bioinformatics 13:219. doi: 10.1186/1471-2105-13-219
Winfield, M. O., Allen, A. M., Burridge, A. J., Barker, G. L. A., Benbow, H. R., Wilkinson, P. A., et al. (2016). High-density SNP genotyping array for hexaploid wheat and its secondary and tertiary gene pool. Plant Biotechnol. J. 14, 1195–1206. doi: 10.1111/pbi.12485
Wu, J., Liu, S., Wang, Q., Zeng, Q., Mu, J., Huang, S., et al. (2018). Rapid identification of an adult plant stripe rust resistance gene in hexaploid wheat by high-throughput SNP array genotyping of pooled extremes. Theor. Appl. Genet. 131, 43–58. doi: 10.1007/s00122-017-2984-3
Wu, J., Wang, Q., Kang, Z., Liu, S., Li, H., Mu, J., et al. (2017). Development and validation of KASP-SNP markers for QTL underlying resistance to stripe rust in common wheat cultivar P10057. Plant Dis. 101, 2079–2087. doi: 10.1094/PDIS-04-17-0468-RE
Wulff, B. B. H., and Moscou, M. J. (2014). Strategies for transferring resistance into wheat: from wide crosses to GM cassettes. Front. Plant Sci. 5:692. doi: 10.3389/fpls.2014.00692
Yang, J., Zaitlen, N. A., Goddard, M. E., Visscher, P. M., and Price, A. L. (2014). Advantages and pitfalls in the application of mixed-model association methods. Nat. Genet. 46, 100–106. doi: 10.1038/ng.2876
Yu, J., and Buckler, E. S. (2006). Genetic association mapping and genome organization of maize. Curr. Opin. Biotechnol. 17, 155–160. doi: 10.1016/j.copbio.2006.02.003
Yu, J., Pressoir, G., Briggs, W. H., Bi, I. V., Yamasaki, M., Doebley, J. F., et al. (2006). A unified mixed-model method for association mapping that accounts for multiple levels of relatedness. Nat. Genet. 38, 203–208. doi: 10.1038/ng1702
Yu, L. X., Morgounov, A., Wanyera, R., Keser, M., Singh, S. K., and Sorrells, M. (2012). Identification of Ug99 stem rust resistance loci in winter wheat germplasm using genome-wide association analysis. Theor. Appl. Genet. 125, 749–758. doi: 10.1007/s00122-012-1867-x
Zanke, C. D., Rodemann, B., Ling, J., Muqaddasi, Q. H., Plieske, J., Polley, A., et al. (2017). Genome-wide association mapping of resistance to eyespot disease (Pseudocercosporella herpotrichoides) in European winter wheat (Triticum aestivum L.) and fine-mapping of Pch1. Theor. Appl. Genet. 130, 505–514. doi: 10.1007/s00122-016-2830-z
Zegeye, H., Rasheed, A., Makdis, F., Badebo, A., and Ogbonnaya, F. C. (2014). Genome-wide association mapping for seedling and adult plant resistance to stripe rust in synthetic hexaploid wheat. PLoS One 9:e105593. doi: 10.1371/journal.pone.0105593
Zeng, Q., Wu, J., Liu, S., Chen, X., Yuan, F., Su, P., et al. (2019). Genome-wide mapping for stripe rust resistance loci in common wheat cultivar Qinnong 142. Plant Dis. 103, 439–447. doi: 10.1094/PDIS-05-18-0846-RE
Zeven, A. C. (2002). Traditional maintenance breeding of landraces: 2. Practical and theoretical considerations on maintenance of variation of landraces by farmers and gardeners. Euphytica 123, 147–158. doi: 10.1023/A:1014940623838
Zhang, P., Yin, G., Zhou, Y., Qi, A., Gao, F., Xia, X., et al. (2017). QTL mapping of adult-plant resistance to leaf rust in the wheat cross Zhou 8425B/Chinese spring using high-density SNP markers. Front. Plant Sci. 8:793. doi: 10.3389/fpls.2017.00793
Zhang, Z., Ersoz, E., Lai, C. Q., Todhunter, R. J., Tiwari, H. K., Gore, M. A., et al. (2010). Mixed linear model approach adapted for genome-wide association studies. Nat. Genet. 42, 355–360. doi: 10.1038/ng.546
Zhao, K., Tung, C. W., Eizenga, G. C., Wright, M. H., Ali, M. L., Price, A. H., et al. (2011). Genome-wide association mapping reveals a rich genetic architecture of complex traits in Oryza sativa. Nat. Commun. 2:467. doi: 10.1038/ncomms1467
Zhou, X. L., Han, D. J., Chen, X. M., Gou, H. L., Guo, S. J., Rong, L., et al. (2014). Characterization and molecular mapping of stripe rust resistance gene Yr61 in winter wheat cultivar Pindong 34. Theor. Appl. Genet. 127, 2349–2358. doi: 10.1007/s00122-014-2381-0
Zhou, Y., Tang, H., Cheng, M. P., Dankwa, K. O., Chen, Z. X., Li, Z. Y., et al. (2017). Genome-wide association study for pre-harvest sprouting resistance in a large germplasm collection of chinese wheat landraces. Front. Plant Sci. 8:401. doi: 10.3389/fpls.2017.00401
Keywords: 35K SNP array, GWAS, leaf rust, resistance, stripe rust, stem rust, wheat
Citation: Kumar D, Kumar A, Chhokar V, Gangwar OP, Bhardwaj SC, Sivasamy M, Prasad SVS, Prakasha TL, Khan H, Singh R, Sharma P, Sheoran S, Iquebal MA, Jaiswal S, Angadi UB, Singh G, Rai A, Singh GP, Kumar D and Tiwari R (2020) Genome-Wide Association Studies in Diverse Spring Wheat Panel for Stripe, Stem, and Leaf Rust Resistance. Front. Plant Sci. 11:748. doi: 10.3389/fpls.2020.00748
Received: 06 March 2020; Accepted: 12 May 2020;
Published: 03 June 2020.
Edited by:
Maria Rosa Simon, National University of La Plata, ArgentinaReviewed by:
Morten Lillemo, Norwegian University of Life Sciences, NorwayUlrike Lohwasser, Leibniz Institute of Plant Genetics and Crop Plant Research (IPK), Germany
Copyright © 2020 Kumar, Kumar, Chhokar, Gangwar, Bhardwaj, Sivasamy, Prasad, Prakasha, Khan, Singh, Sharma, Sheoran, Iquebal, Jaiswal, Angadi, Singh, Rai, Singh, Kumar and Tiwari. This is an open-access article distributed under the terms of the Creative Commons Attribution License (CC BY). The use, distribution or reproduction in other forums is permitted, provided the original author(s) and the copyright owner(s) are credited and that the original publication in this journal is cited, in accordance with accepted academic practice. No use, distribution or reproduction is permitted which does not comply with these terms.
*Correspondence: Dinesh Kumar, ZGluZXNoLmt1bWFyQGljYXIuZ292Lmlu; Ratan Tiwari, cmF0YW4udGl3YXJpQGljYXIuZ292Lmlu
†These authors have contributed equally to this work