 Yi Wen1,2†
 Yunxia Fang3†Peng Hu1†Yiqing Tan1Yueying Wang1Linlin Hou3Xuemei Deng1Hao Wu1Lixin Zhu1
 Li Zhu1
 Guang Chen1
 Dali Zeng1
 Longbiao Guo1
 Guangheng Zhang1Zhenyu Gao1Guojun Dong1Deyong Ren1Lan Shen1
 Qiang Zhang1
 Dawei Xue3
 Qian Qian1,2*
 Jiang Hu1*
- 1State Key Laboratory of Rice Biology, China National Rice Research Institute, Hangzhou, China
- 2Rice Research Institute of Shenyang Agricultural University/Key Laboratory of Northern Japonica Rice Genetics and Breeding, Ministry of Education and Liaoning Province, Shenyang, China
- 3College of Life and Environmental Sciences, Hangzhou Normal University, Hangzhou, China
Leaf shape is an important agronomic trait for constructing an ideal plant type in rice, and high-density genetic map is facilitative in improving accuracy and efficiency for quantitative trait loci (QTL) analysis of leaf trait. In this study, a high-density genetic map contained 10,760 specific length amplified fragment sequencing (SLAF) markers was established based on 149 recombinant inbred lines (RILs) derived from the cross between Rekuangeng (RKG) and Taizhong1 (TN1), which exhibited 1,613.59 cM map distance with an average interval of 0.17 cM. A total of 24 QTLs were detected and explained the phenotypic variance ranged from 9% to 33.8% related to the leaf morphology across two areas. Among them, one uncloned major QTL qTLLW1 (qTLL1 and qTLLW1) involved in regulating leaf length and leaf width with max 33.8% and 22.5% phenotypic variance respectively was located on chromosome 1, and another major locus qTLW4 affecting leaf width accounted for max 25.3% phenotypic variance was mapped on chromosome 4. Fine mapping and qRT-PCR expression analysis indicated that qTLW4 may be allelic to NAL1 (Narrow leaf 1) gene.
Introduction
Most important agronomic traits are quantitatively inherited, and generally controlled or affected by multiple quantitative trait loci (QTL). Previous studies indicated that high-density genetic map has contributed to the improvement of efficiency and precision for QTL analysis (Yu et al., 2011; Gao et al., 2013). So, a genetic linkage map, especially a high-density genetic map is essential for QTL mapping. There are several types of molecular markers have been used to construct genetic maps during the past 30 years, such as RFLP, AFLP, RAPD, SSR, STS, etc (McCouch et al., 1988; Song and Gustafson, 1995; Yoshimura et al., 1995; Prins et al., 2001; McCouch et al., 2002), but these developed markers are difficult to meet the requirement of high-density genetic map due to low density of polymorphism over the whole genome. Excitingly, the emergence of massive single nucleotide polymorphism (SNP) produced by high-throughput genotyping and sequencing method has well solved this problem, which is suitable to build a high-density genetic linkage map to ensure the veracity of QTL mapping, especially in the species of large size genome and fewer polymorphisms (Huang et al., 2009; Liu et al., 2014; Zhang J. et al., 2015).
Specific-locus amplified fragment sequencing (SLAF-seq) is a strategy based on reduced-representation genome sequencing technology (Sun et al., 2013). Through sequencing of SLAF-seq library constructed by genomic DNA of special enzyme digestion, the polymorphic SLAFs obtained from difference sequence analysis. Among them, each SLAF locus corresponds to a specific fragment generated by enzyme digestion, which includes difference sites of insertion-deletion (InDel) and SNP (Sun et al., 2013). The technology enables us to obtain enough polymorphic markers to carry out QTL mapping and marker-assisted selection (MAS), and exhibits several advantages than conventional molecular markers, including rich polymorphism, uniform distribution, avoiding repeated sequences, not missing important regions of chromosome segment, low cost, short cycle and so on (Sun et al., 2013; Chang et al., 2018). Therefore, SLAF-seq has been widely and successfully applied for genetic map construction and QTL analysis in multiple species (Chen et al., 2013; Li et al., 2014; Zhu et al., 2016; Yin et al., 2018; Zhu et al., 2018; Wu et al., 2019; Yu et al., 2019).
Rice is a worldwide food crop and plays a vital role in eliminating hunger. After application of green revolution gene sd1 and utilization of hybrid heterosis, breeding of ideal plant architecture for constructing high-quality rice varieties has been increasingly concerned (Jiao et al., 2010; Yuan, 2011). As an essential part of ideal plant architecture, leaf plays an important role in plant growth and development attributing to the function of photosynthetic and respiratory organ. The appropriate leaf shape and upstanding extension posture ensure the high photosynthetic efficiency, which has a decisive effect on energy distribution and carbohydrate accumulation. Among them, the top three leaves are the main source of carbohydrates, which significantly affects the rice yield (Yan et al., 2008; Du et al., 2018). So, a number of genes and QTLs related to regulating leaf morphology have been identified and located, which laid a solid foundation for molecular breeding to improve plant type in rice (Dong et al., 2004; Hu et al., 2010; Wang et al., 2012; Zhang et al., 2014; Zhang B. et al., 2015; Yin et al., 2017; Tang et al., 2018).
In this study, we obtained 63,538 effective SLAFs genotyped in 149 recombinant inbred lines (RILs) and a high-density genetic linkage map containing 10,760 SLAF markers on 12 chromosomes was constructed, which spanned 1,613.59 cM with 0.17 cM interval on average. The genetic map was employed to identify leaf morphology QTLs, and total of 24 QTLs were detected. Of which, two major loci were identified, one locus qTLLW1 that regulated both leaf length and width explained max 33.8% and 22.5% phenotypic variance, respectively, and another qTLW4 only affected leaf width accounted for max 25.3% phenotypic variance. Using fine mapping approach, the qTLW4 was narrowed to the interval of 62.5kb in which contained the NAL1 gene (Qi et al., 2008). Expression analysis showed that the wide-leaf lines were significantly higher that narrow-leaf lines in RILs, suggesting that qTLW4 may be an allelic gene of NAL1.
Materials and Methods
Plant Materials, Trait Measurement, and DNA Extraction
A set of 149 RILs of F8 generation derived from the cross of japonica cultivar Rekuangeng (RKG) and indica cultivar Taizhong1 (TN1) was applied for genetic map construction and QTL analysis. The RIL population had a stable heredity and self-cultivated for many years at China Rice Research Institute, Hangzhou, Zhejiang China (119°950E, 30°070N) and Lingshui, Hainan, China (110°020E, 18°480N). The third leaf length and width of main stem were measured at the full heading stage in Lingshui in 2017 and Hangzhou in 2017, 2018, respectively, and measurement takes three repetitions per line to ensure data accuracy. Data correlation analysis was conducted by using SPSS 19.0 Statistics. The leaf blades of 149 RILs and two parents were collected at heading stage, and CTAB method was used to extract genome DNA for sequencing and genotyping.
SLAF Library Construction and High-Throughput Sequencing
SLAF library construction was performed following the description by Sun et al. (2013) and Li et al. (2014) with little alteration. The 382Mb rice (Oryza sativa) genome was selected as a reference genome to perform a pilot experiment for evaluating efficiency of restriction enzyme digestion and size of restriction fragments. According to the optimal enzyme digestion protocol summarized from pilot experiment, genome DNA of RILs and parents were finally digested by HaeIII and Hpy166II (NEB) restriction enzyme. After a series of PCR reaction, adapter ligation reactions and agarose gel purification, the production of 264-314bp fragments were isolated and subjected to PCR amplification following the guide of Illumine sample preparation. The sequencing was performed using the IlluminaHiSeq™ 2500 platform (Illumina, Inc; San Diego, CA, USA) at Biomarker Technologies Corporation (Beijing, China).
SLAF-Seq Data Grouping and Genotyping
SLAF-seq data grouping and genotyping were conducted following the description from Sun et al. (2013), and a desired cluster density would ensure that SLAFs corresponding with map requirements. The raw sequencing data were identified by Dual-index paired-end sequencing approach (Kozich et al., 2013) to acquire effective original reads. Then, using the Burrows-Wheeler Alignment (BWA) software (Li and Durbin, 2009), all the reads were mapped to the reference genome (Oryza sativa L.) and SLAFs were developed from the parental cultivars and RILs. Among them, identical reads with 90% similar sequences were considered as one SLAF locus to avoid computational repetition (Kent, 2002). Polymorphism analysis was performed based on the difference between the number of alleles and the sequence of the gene, and SLAFs with polymorphic sites (mainly include SNPs and InDels) were selected for subsequent analysis. Following the general two-element genotype coding rules of genetics, polymorphic SLAFs were then encoded into eight segregation patterns according to the genotype of the parental cultivar (Supplementary Table S1). Because the RIL population (F8) was derived from two fully homozygous parental cultivars with genotype AA and BB, only the SLAFs with AA x BB segregation pattern was valid for succeeding genetic map construction (Supplementary Table S1).
Construction of High-Density Genetic Map and QTL Identification
The obtained high quality SLAF markers were divided into 12 chromosome (Chr) linkage groups and a modified logarithm of odds scores (MLOD) threshold ≥ 5 was set as default (Stam, 1993). HighMap mapping software was employed to convert recombination frequency to centiMorgans (cM) and then a high-density genetic map based on polymorphic SLAF markers was constructed. The collinearity with the rice reference genome and heat map reflecting recombination frequency of SLAF markers were also used to evaluate the quality of genetic map. QTL analysis was performed via high-density genetic map using qgene-4.3.10 software (Joehanes and Nelson, 2008). The composite interval mapping (CIM) method was adopted with a walking distance of 1 milliMorgan to cover the genome completely. The logarithm of odds (LOD) threshold ≥ 3 was considered for statistical significance (P = 0.05), and each QTL interval was determined using 1,000 permutations. The candidate genes of fine mapping regions were analyzed and annotated via the database of NCBI (http://www.ncbi.nlm.nih.gov/) and Rice Genome Annotation Project (http://rice.plantbiology.msu.edu/).
RNA Extraction and qRT-PCR
Total RNA was extracted and purified from fresh leaves at heading stage by Axygen’s RNA Miniprep kit. Subsequently, RNA was converted into cDNA using a reverse transcription reagent kit (ReverTra Ace quantitative PCR RT Master Mix) manufactured by TOYOBO Co., Ltd. All the experimental procedures were carried out following the manufacturer’s instructions. The products were diluted with water in the ratio of 1:10 for quantitative reverse transcription PCR (qRT-PCR). In this study, the 2×SYBR Green PCR Master Mix produced by TOYOBO was employed to amplify the cDNA template on Bio-Rad CFX96 Touch Real-time PCR instrument. Using the 2-ΔΔT method, Relative expression values were obtained by standardization with the Actin transcription, each target sample was subjected to three biological replications. All values represent means ± SD (n=3), *P < 0.05, **P < 0.01, based on a Student’s t-test. All primer sequences were listed in Supplementary Table S2.
Results
Sequencing and Genotyping Based on SLAF-Seq
A total of 47 Gb data containing 211,574,337 reads were obtained by high throughput sequencing, and average Q30 (quality score of 30) and GC (guanine-cytosine) content were 92.54% and 43.54%, respectively (Table 1). These reads were then aligned to the reference rice genome via BWA software (Li et al., 2009), and the single locus without repetition was considered as a valid SLAF locus. According to the sequence difference, the SLAFs were divided into three types: Polymorphic, Non-Polymorphic, and Repetitive. Among them, 78,374 polymorphic SLAFs were identified and accounted for 32.13% of total 243,955 SLAFs (Supplementary Table S3). These SLAFs were evenly distributed on 12 chromosomes (Figure 1) and then 63,538 SLAFs were successfully genotyped according to the general two-element genotype coding rules of genetics. Due to fully homozygous of parents with genotype AA or BB, only SLAFs with AA or BB segregation type were useful, and total 59,155 valid polymorphism were obtained and occupied 24.25% (Supplementary Figure S2). The Raw sequencing data were upload to the NCBI (https://www.ncbi.nlm.nih.gov/sra/, accession number SRR12043868 - SRR12044018)
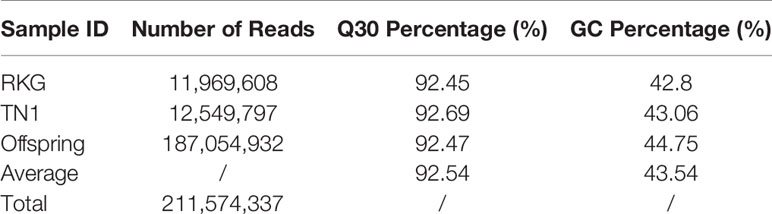
Table 1 Data statistics for each sample.
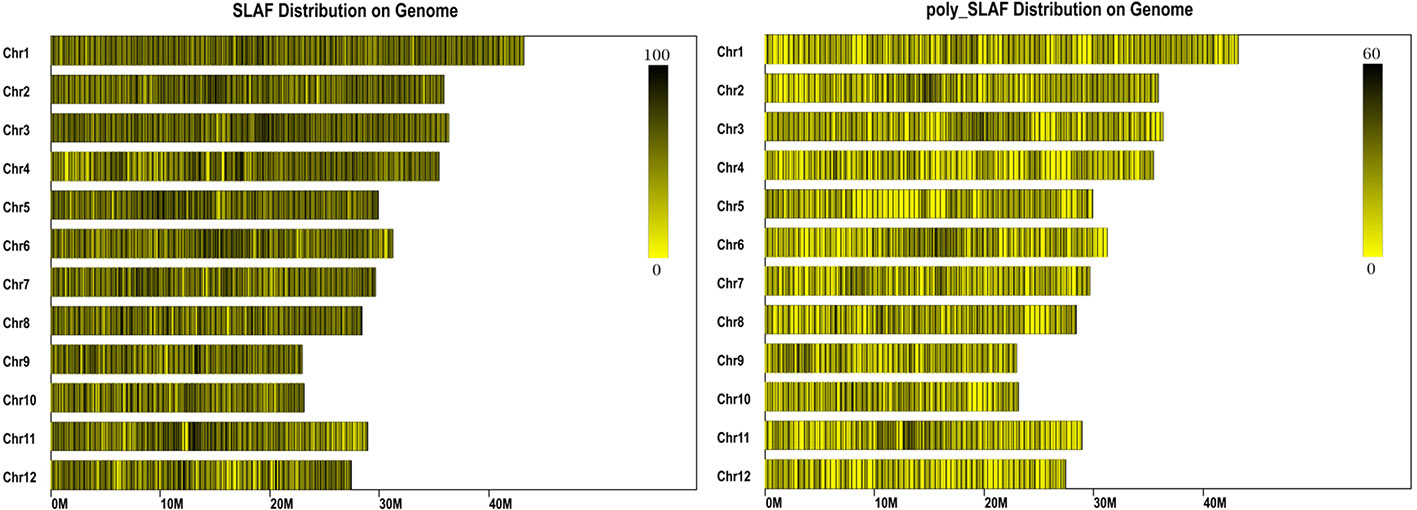
Figure 1 Distribution of specific length amplified fragments (SLAFs) on rice genome. The x-axes indicates chromosome length. Each yellow band represents a chromosome, each black line indicates a SLAF marker.
Construction of High-Density Genetic Linkage Map for Rice
To ensure a high-quality genetic map, the unqualified markers with the MLOD values below 5 were removed and 10,760 SLAF markers were finally used to construct high-density linkage genetic map by screening 59,155 genotyped SLAFs. The obtained 10,760 SLAF markers were mapped to 12 chromosomes by HighMap software with mean coverage depth 110.77-fold in RKG, 106.72-fold in TN1, and 11.39-fold in RILs. The final genetic linkage map exhibited a total map distance of 1,613.59 cM with the average interval distance of 0.17 cM, and gap<5cM value reached 99.66% (Figure 2; Table 2). In addition, the average proportion of the valid markers on the map of each individual in the mapping group reached 89.1%, which ensured the accuracy of the map genotyping (Supplementary Figure S3). In order to further evaluate the quality of markers linkage relationship, two-dimensional heat maps of 12 chromosomes were separately built, and the results showed the closer distance between adjacent markers came along with a relatively lower recombination frequency, which suggested the precision of the high-density genetic map was reliable (Supplementary Figure S4). Collinearity analysis of 12 chromosomes with rice genome was also conducted, and the spearman correlation coefficient between them was close to 1, indicating that most markers on each chromosomes was highly consistent with reference genome and the genetic recombination rate was calculated accurately (Table 2; Supplementary Figure S5).
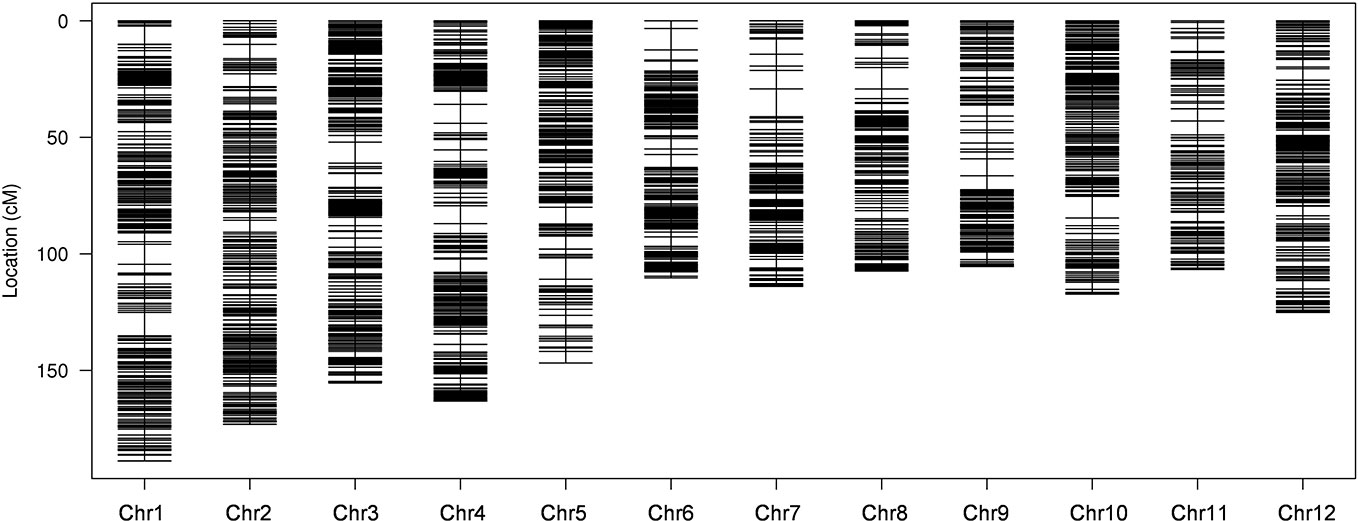
Figure 2 High-density genetic linkage map. The x-and y-axis represent chromosomes and genetic distance, respectively. Each black line indicates a specific length amplified fragment (SLAF) marker.
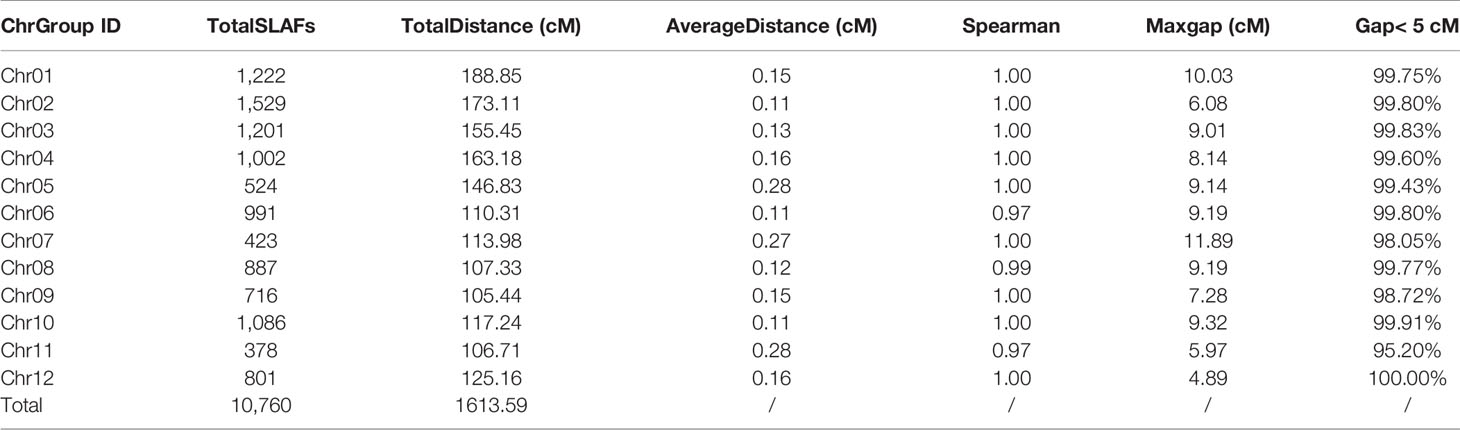
Table 2 Basic information of high-density genetic map.
Leaf Traits and Data Analysis
At the full heading stage, the leaf length and leaf width of two parent cultivars and 149 RILs were investigated in Lingshui Hainan in 2017 and Hangzhou Zhejiang in 2017, 2018, respectively. The male parent RKG exhibted more longer and wider than female parent TN1 at all top-three leaves, and tissue anatomy analysis also showed that the number of small veins in RKG was significantly more than TN1 (Figure 3, Supplementary Figure S1). The spearman correlation coefficients between leaf traits of RILs were analyzed by SPSS, and the result indicated that the leaf length versus leaf length and leaf width versus leaf width all exhibted extremely significant positive correlations in both areas, suggesting the correlation traits may be affected by the same gene or have a linkage effect (Table 3). The distribution of trait statistics showed a significant differences between the two parents and displayed a continuous segregation values among the 149 individuals with less skewness and kurtosis, which suggested all the phenotype data followed a normal distribution (Figure 4 and Table 4), and were suitable for QTL mapping.
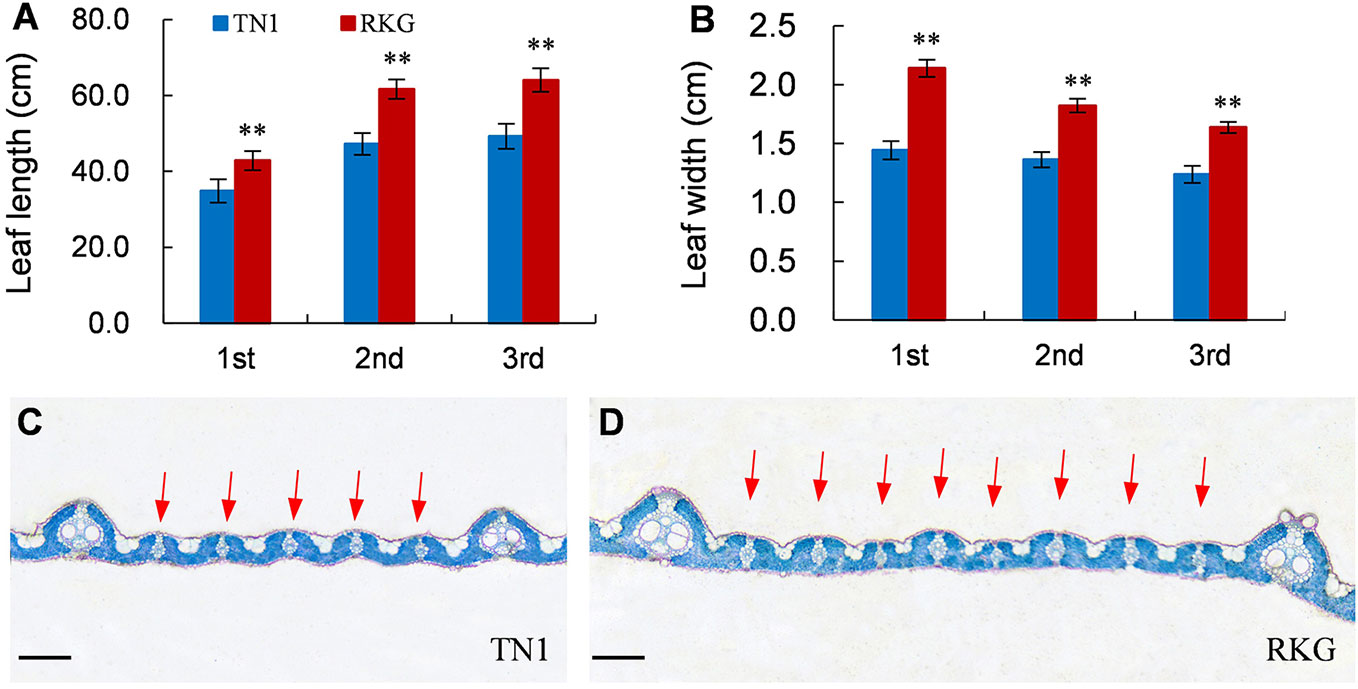
Figure 3 Leaf traits of TN1 and RKG. (A, B) Leaf length and width of top-three leaf (n=10). ** indicates a significant difference (P < 0.01) by student’s t-test. (C, D) Paraffin cross-section of third leaves, the red arrow indicates the small vein, Scale bar = 20μm.
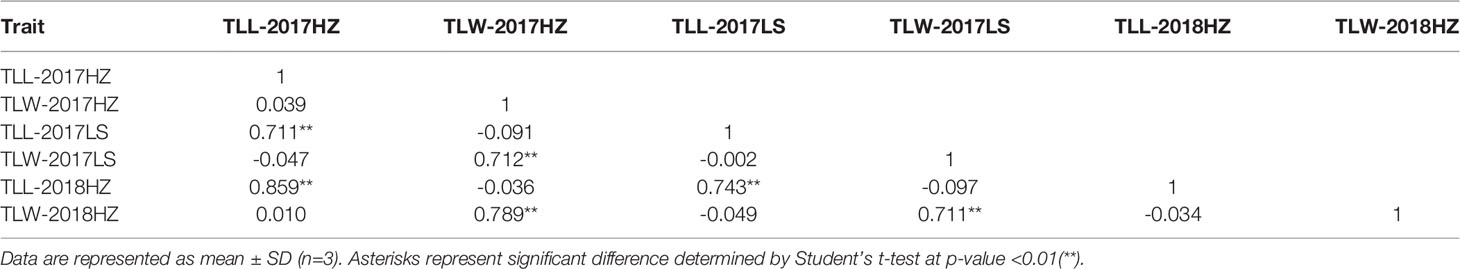
Table 3 Spearman correlation analysis of leaf morphology.
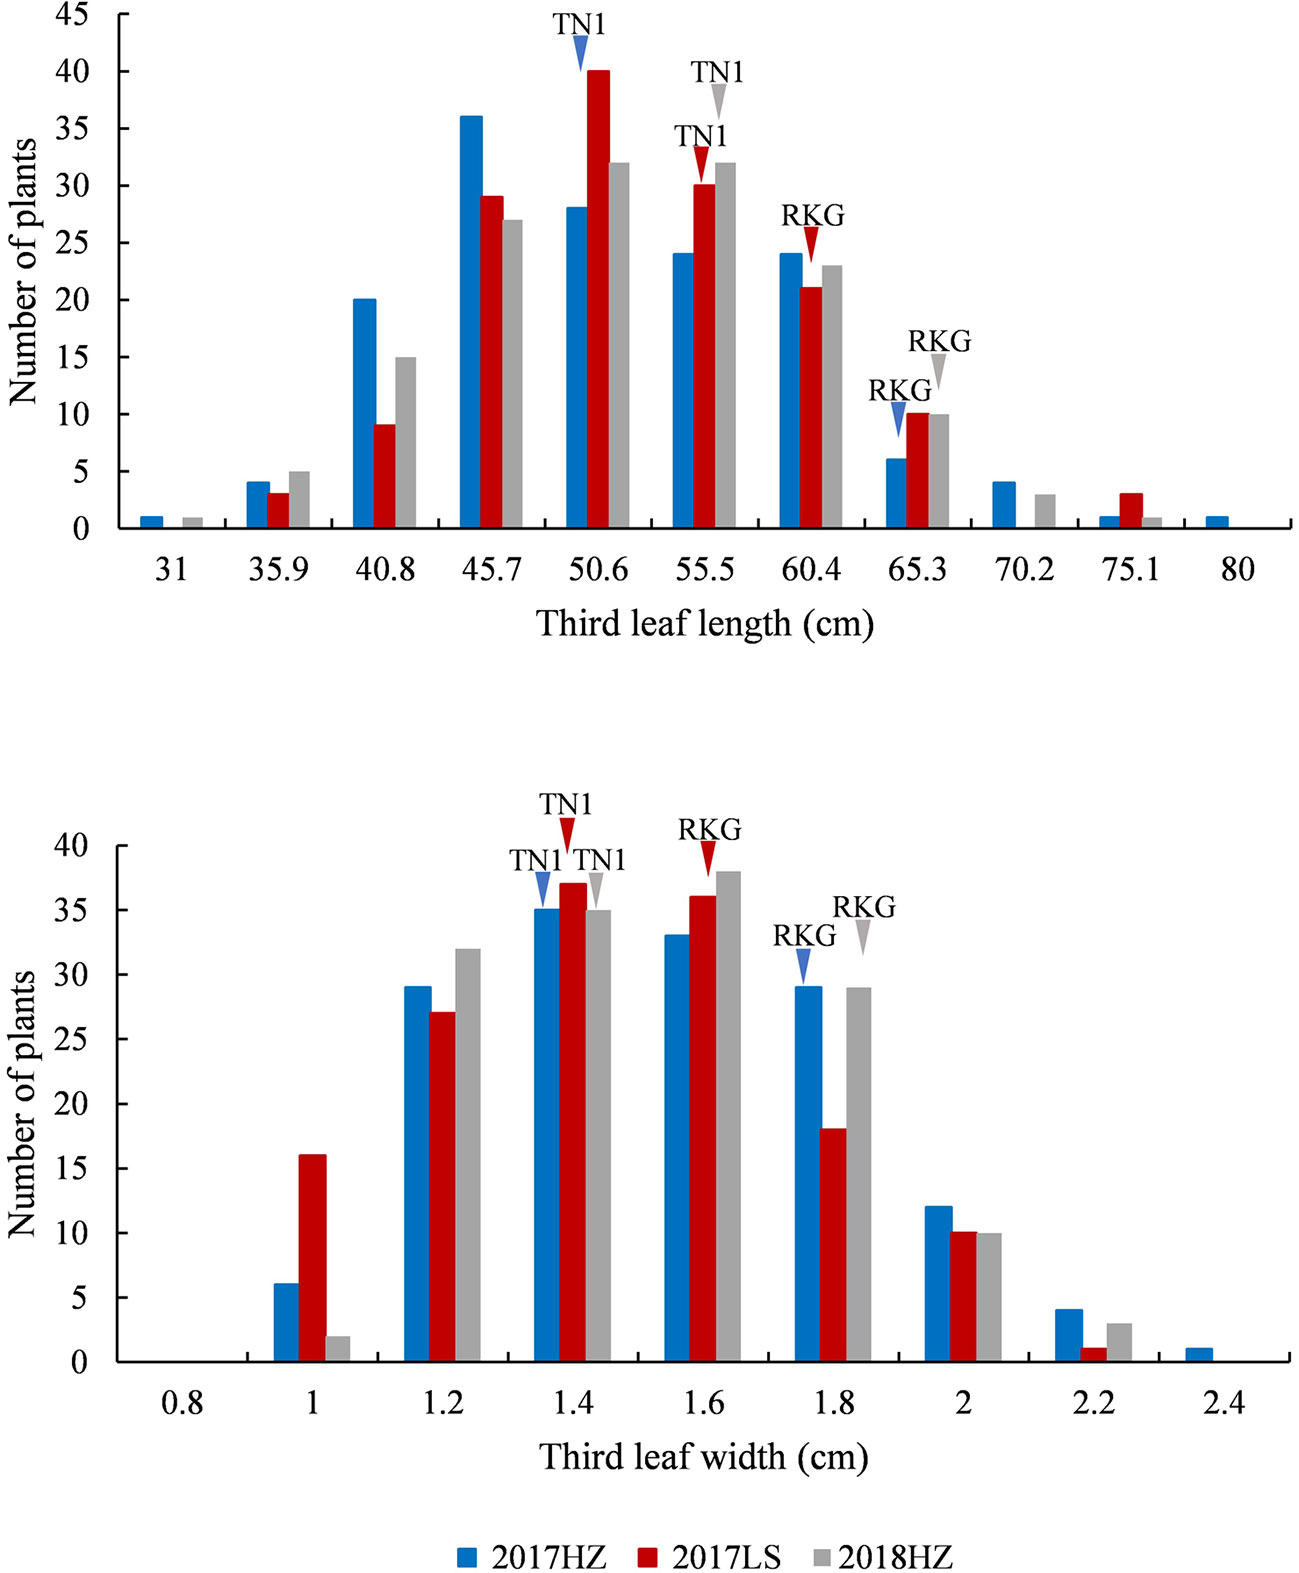
Figure 4 The frequency distribution of third leaf length and width. The x-axis indicates leaf length and leaf width value planted in Lingshui Hainan (LS) in 2017, and Hangzhou Zhejiang (HZ) in 2017 and 2018. The left y-axis indicates the number of individuals, the phenotypic values of the parents (TN1 and RKG) are pointed by arrows, respectively.
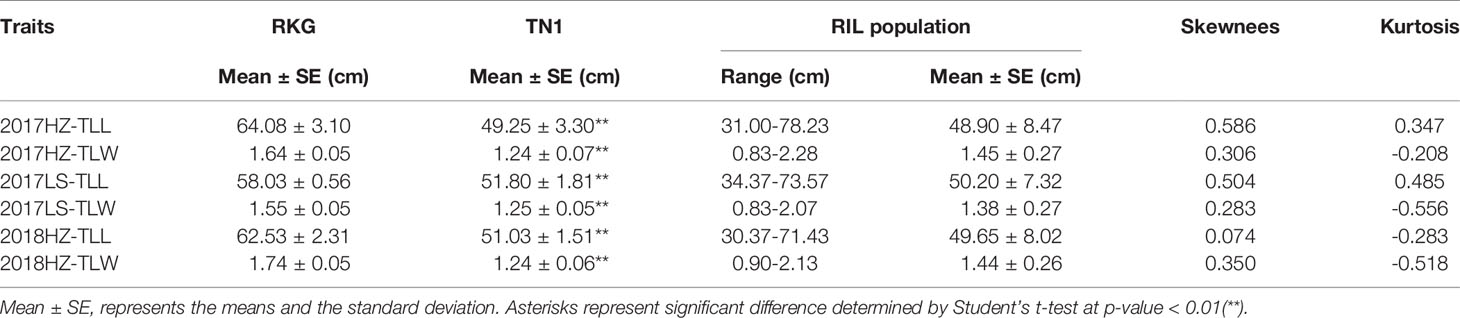
Table 4 Descriptive statistic of leaf morphology.
QTL Mapping of Leaf Length and Leaf Width
Using qgene-4.3.10 software, a total of 24 QTLs underlying leaf morphology were detected on nine chromosomes (1, 2, 3, 4, 5, 6, 8, 9), explained a phenotypic variance ranged from 9% to 33.8% (Figure 5, Table 5 and Supplementary Figure S6). Among them, 3 QTLs for leaf length and 8 QTLs for leaf width were detected in Hangzhou in 2017, 2 QTLs for leaf length and 5 QTLs for leaf width were mapped in Lingshui in 2017, and 3 QTLs for leaf length and 3 QTLs for leaf width were located in Hangzhou in 2018. The number of QTLs in 2018 were significantly less than in 2017, but two major QTLs interval with high LOD value and high phenotypic variance were repeatedly detected in both years. In which, 3 leaf width QTLs of third leaf, qTLW4-2017HZ, qTLW4-2017LS, and qTLW4-2018HZ with 11.9%–25.3% phenotypic variance were all located in the same interval between Marker3557229 and Marker4046323. Therefore, they should be controlled by the same QTL, and named qTLW4 (Third leaf width on chromosome 4, Table 5 and Figure 5). In addition, qTLL1-2017HZ, qTLL1-2017LS, qTLL1-2018HZ, qTLW1-2017HZ, and qTLW1-2017LS were detected in the region of Marker1499909-Marker2090774, the positions of these QTLs were neighboring to each other, and were all located in the region of 1101.7kb. Considering the effects of environmental and measurement errors, we speculated the 5 QTLs were regulated by the same gene, and named it qTLLW1 (Third leaf Length and Width on chromosome 1, Table 5 and Figure 5).
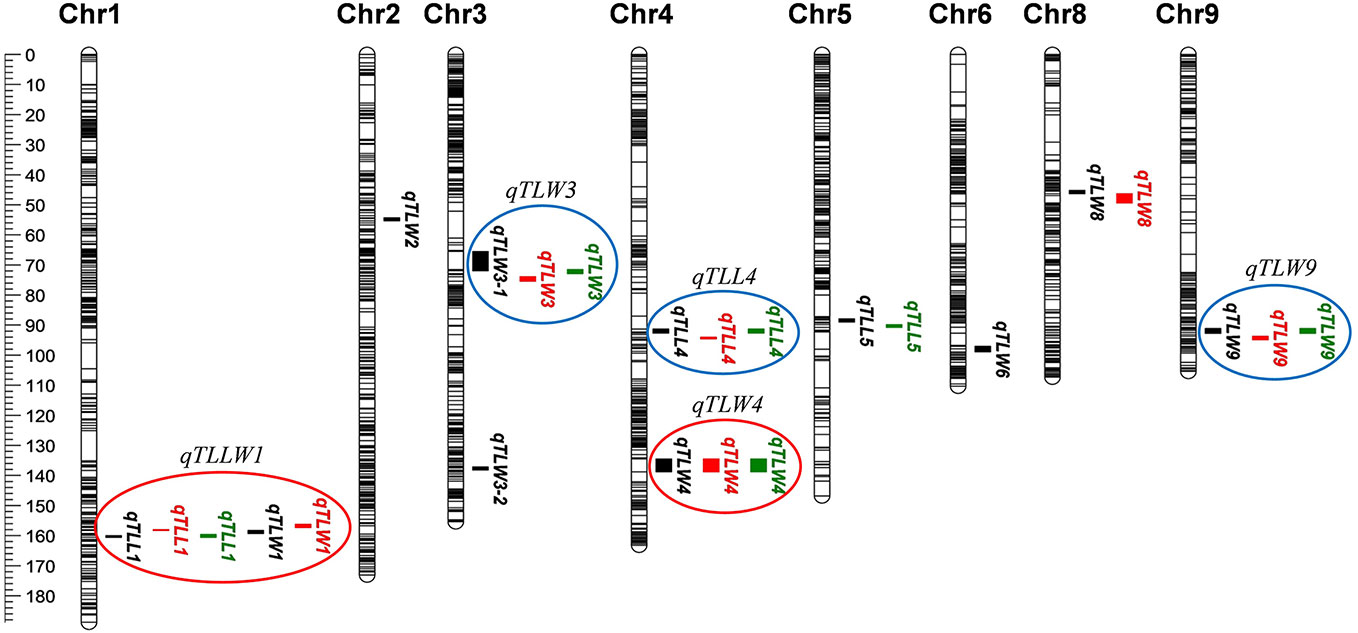
Figure 5 Quantitative trait loci (QTL) analysis of leaf length and width in recombinant inbred lines (RILs). Location of 24 QTLs for leaf length and leaf width. Red circles (major QTLs) and blue circles represent QTLs of repeated detection in both areas, each black line on chromosome indicates a SLAF marker.
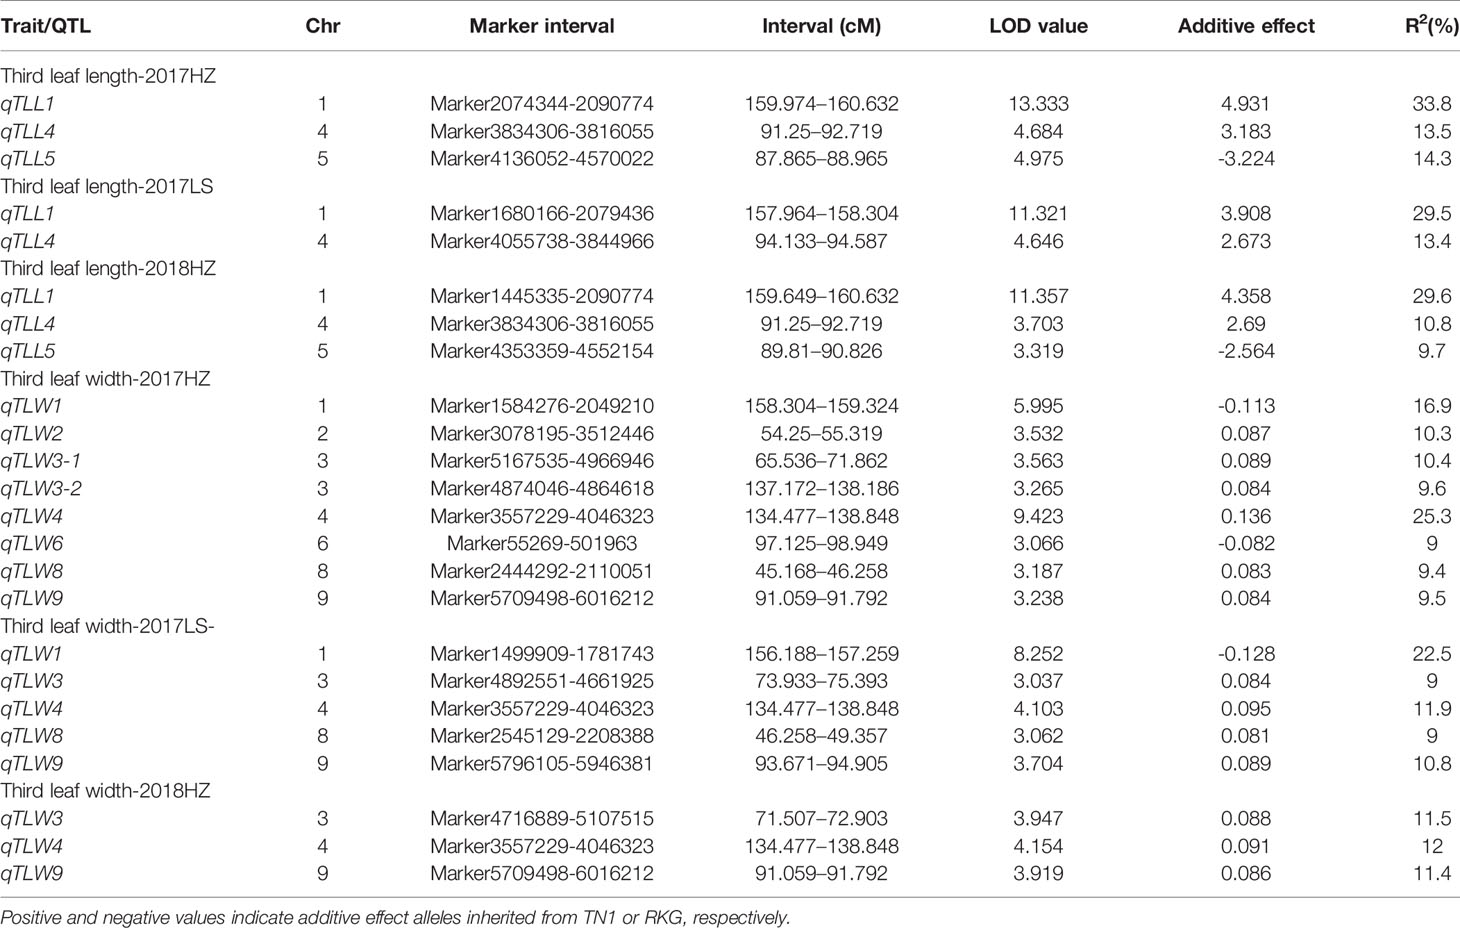
Table 5 Leaf length and leaf width quantitative trait locis (QTLs) detected in the TN1×RKG RIL population at full heading stage.
Fine Mapping of qTLW4
The major leaf width QTL qTLW4 was preliminarily located on chromosome 4 between SLAF Marker3557229 and Marker4046323, which contained 194.2 kb physical region (Figure 6A). In order to further fine mapping the gene, a BC2F2 population was constructed using the TN1 as recurrent parent, and a total of 2409 individuals were obtained in paddy field. First, the 186 extremely typical wide-leaf individuals were collected to confirm the 194.2 kb region of QTL mapping using map-based cloned method, and the results showed the QTL interval is accurate (Figure 6A). Secondly, the 9 pairs of molecular markers were developed to screening the recombinant, and 9 useful recombinant individuals were identified. Finally, through comparing leaf width values, qTLW4 was narrowed to an interval of 62.5 kb between two STS molecular markers qLW4-38 and qLW4-31 (Figure 6B). According to Rice Genome Annotation Project (http://rice.plantbiology.msu.edu/cgi-bin/gbrowse/rice/#search), a total of 8 genes were predicted in the region (Figure 6C and Supplementary Table S4).
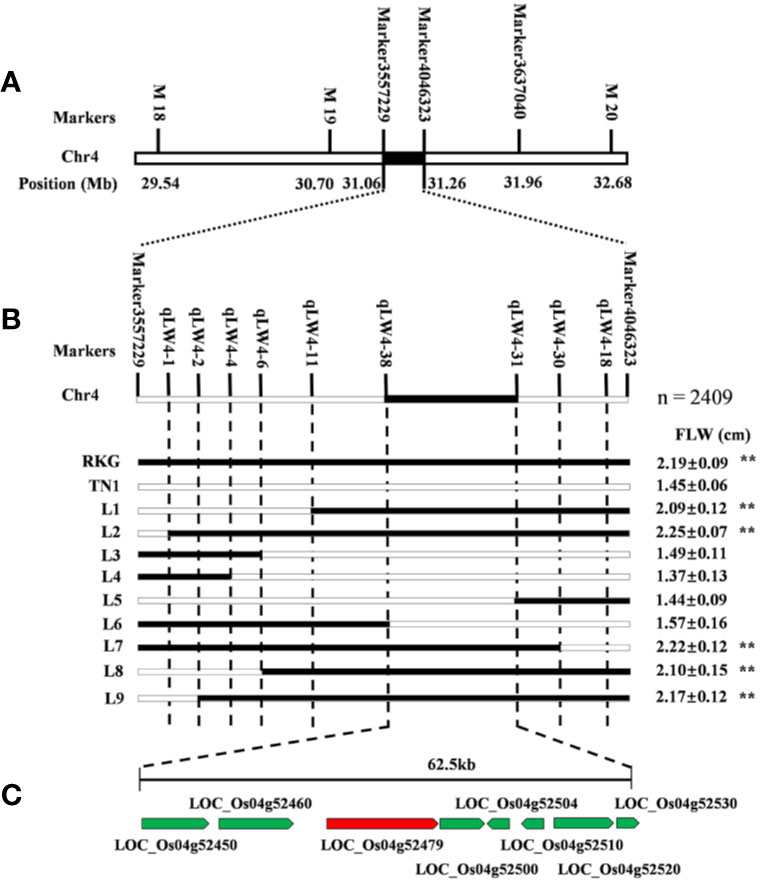
Figure 6 Fine mapping of qTLW4. (A) Primary map of qTLW4. qTLW4 was primarily located into 194.2 kb. (B) Fine-scale map of qTLW4. Black and white rectangles indicates homozygous genotype regions for Rekuangeng (RKG) and TN1, respectively. The leave width of corresponding recombinant plants, ** indicates a significant difference (P < 0.01) compared to TN1 by the Student’s t-test. (C) Total eight annotated open reading frames were predicted in the 62.5 kb region.
Analysis of Candidate Genes
Among the 8 genes, LOC_Os04g52479 encodes a putative trypsin-like serine and cysteine proteases, which is the previously reported gene of NAL1 (Narrow Leaf 1, Qi et al., 2008). Due to NAL1 plays a positive role in regulating leaf width (Qi et al., 2008; Zhang et al., 2014), we carried out a quantitative reverse transcription PCR (qRT-PCR) to analyze the NAL1 expression in two parental cultivars RKG, TN1, five wide-leaf lines and five narrow-leaf lines among RILs (Figure 7). The results indicated that the relative expressions of RKG and wide-leaf lines were significantly higher than TN1 and narrow-leaf lines (Figure 7A). So, we speculated that NAL1 is the candidate gene of qTLW4.
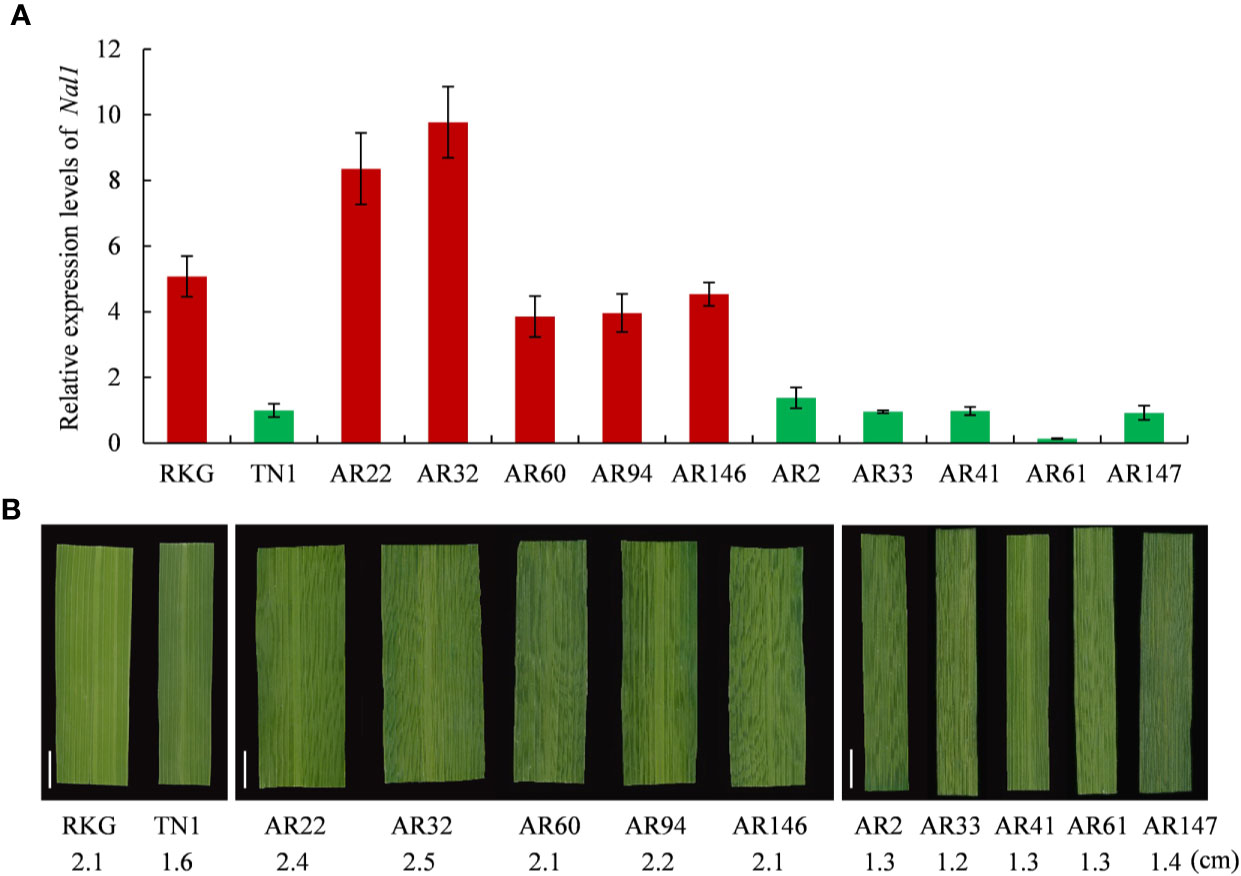
Figure 7 Expression analysis of NAL1 and comparison analysis of leaf width. (A) Relative expression levels of NAL1 in recombinant inbred line (RIL) parents, five wider leaf lines and five narrow leaf lines. (B) The corresponding leaf morphology and leaf width of (A). Scale bar = 1cm.
Discussion
In modern molecular breeding practice of rice cultivar, it is crucial to detect QTLs of important agronomic traits based on elite germplasm resources, and a high-quality genetic map with high-density uniformly distributed markers ensure an efficient tool for QTL mapping (Yu et al., 2011; Gao et al., 2013). However, limited number of traditional markers are difficult to cover the whole genome which affects the accuracy of QTL mapping, and whole-genome sequencing is costly and time-consuming. The rapid development of second-generation sequencing technologies provides an effective way to develop numerous valid markers to construct high-density genetic map in a short time. SLAF-seq technology combines site-specific amplification and high-throughput sequencing. Only specific DNA digested fragments need to be sequenced instead of whole genome sequencing, which greatly reduces the workload and cost (Sun et al., 2013). It has become an effective solution for large-scale genotyping and also has been successfully applied to the linkage map construction and QTL analysis in multiple species (Li et al., 2014; Zhu et al., 2016; Yin et al., 2018; Zhu et al., 2018; Wu et al., 2019; Yu et al., 2019).
In rice, the SLAFs are usually used to construct high-density linkage genetic map, carry out QTL mapping and association analysis (Mao et al., 2015; Chen et al., 2016; Peng et al., 2016; Zheng et al., 2016; Li et al., 2017; Yang et al., 2018). In the present study, we constructed a high-density linkage genetic map by a set of 149 RILs, which contained 10,760 valid SLAF markers with 0.17 cM average distance. Only two chromosomes exhibited max gap > 10 cM, and the distances were 10.03 cM and 11.89 cM on chromosome 1 and 7, respectively. In addition, spearman correlation coefficients of 12 linkage groups were 1 or close to 1, suggesting the good collinearity between genetic map and physical map, which revealed the high accuracy in genetic recombination rate. Also in rice, Mao et al. (2015) constructed a high-density genetic map spanned 1,537.1 cM in length with 0.32 cM intervals on average, and Peng et al. (2016) developed a SLAFs genetic map with 2,508.65 cM genetic length and 0.29 cM average distance. The average interval distance of two maps were both higher than 0.17cM, which indicated that the genetic map we constructed was denser and more suitable to conduct genetic analysis.
Due to the 10,760 molecular mark beyond the maximum calculating capacity in many QTL software, qgene software were finally used to conduct the QTL analysis, and a total of 24 QTLs involved in third leaf size were detected in Lingshui Hainan in 2017 and Hangzhou Zhejiang in 2017, 2018, respectively. In the result, 5 QTLs, qTLLW1, qTLW3, qTLL4, qTLW4, and qTLW9 were repeatedly detected in three areas (Figure 5, Table 5, Supplementary Figure S6), including 3 leaf width related QTLs on chromosome 3, 4, and 9, 1 leaf length related QTL on chromosome 4, and 1 leaf length and width related QTLs on chromosome 1. Among them, qTLLW1 was narrowed in a region of 1101.7 kb and explained phenotypic variance of 16.9% to 33.8%. Using a chromosome segment substitution lines (CSSLs) developed from Habataki and Sasanishiki, Bian et al. (2014) located a major QTL qFLW1.3 for flag leaf width, which accounted for phenotypic variance of 25.45% and 31.4% in two area and exhibited an adjacent region as qTLLW1. However, no major QTL related leaf length was reported in the position of qTLLW1. Furthermore, another major QTL qTLW4 accounting for 11.9%–25.3% phenotypic variance was also repeatedly detected in the same interval in Lingshui and Hangzhou, and had positive effect to increase leaf width. Using BC2F2 population, qTLW4 was finally fine mapped in an interval of 62.5kb, in which contained NAL1 gene. NAL1 encodes a plant-specific protein involved in polar auxin transport and vascular patterns, and its loss-of-function mutation presented narrow leaf phenotype (Qi et al., 2008; Jiang et al., 2015). Moreover, several NAL1 allelic types, including alternative splicing, amino acid substitutions and expression levels difference, were identified from natural variety which exhibited wide leaf phenotype and significantly increased yield (Chen et al., 2012; Fujita et al., 2013; Zhang et al., 2014). We therefore carried out an expression analysis of NAL1, and the results showed the expression in RKG and 5 wide leaf lines were significantly higher than TN1 and 5 narrow leaf lines. Combining the overexpression of NAL1 gene significantly increased leaf width (Fujita et al., 2013; Zhang et al., 2014), so we speculated that qTLW4 is an allele of the NAL1 gene. It provides a new NAL1 allele resource for genetics and breeders.
Leaf is an important vegetative organ, and its leaf shape and spatial posture directly affect photosynthesis, which in turn affects rice yield. In this study, we identified two major QTLs, qTLW4 and qTLLW1, accounted for maximum 25.3% phenotypic variance in leaf width, and 33.8% and 22.5% in leaf length and width, respectively. Among them, qTLLW1 exhibited positive additive effect on leaf length and negative effect on leaf width, indicated that the locus from RKG played a promoting effect on elongating leaf length and reducing leaf width. Another major QTL qTLW4 presented positive additive effect on leaf width, also revealed that the segment of RKG had a positive effective in increasing leaf width. Therefore, the two QTLs, especially the new locus qTLLW1, are useful for facilitate breeding process of elite rice in ideal leaf type.
Conclusion
In this study, a high-density genetic map with 10,760 SLAF markers was constructed, which spanned 1,613.59 cM genetic distance with 0.17 cM interval on average. Based on the map, a total of 24 QTLs underlying leaf morphology of third leaf were detected, accounted for a phenotypic variance ranged from 9% to 33.8%. Among them, two major QTLs, qTLLW1 regulating both leaf length and width, and qTLW4 only affecting leaf width were identified. Further fine mapping and expression analysis indicated that qTLW4 may be the allelic gene to NAL1. The results laid a theoretical and material basis for rice molecular breeding of ideal plant architecture, especially in leaf morphology.
Data Availability Statement
The raw sequencing data were uploaded to the NCBI (https://www.ncbi.nlm.nih.gov/sra/, accession number SRR12043868-SRR12044018).
Author Contributions
Experimental design: JH and QQ. Map construction: YiW, YF, PH, YT, and YuW. Trait measurement and experiments: YiW, YF, LH, XD, HW, and LixZ. Data analysis: LiZ, GC, DZ, LG, GZ, ZG, GD, DR, LS, QZ, and DX. Manuscript preparation: YiW, YF, PH, QQ, and JH.
Funding
This research was supported by the National GMO New Variety Breeding Program of PRC (2016ZX08011-001), the Zhejiang Province Outstanding Youth Fund (LR19C130001), the Natural Science Foundation of China (No. 31671666, 31871594, 31861143006), the National Science Foundation of Zhejiang Province (Y19C130005), and the Open Foundation of State Key Laboratory of Rice Biology (20190103).
Conflict of Interest
The authors declare that the research was conducted in the absence of any commercial or financial relationships that could be construed as a potential conflict of interest.
Supplementary Material
The Supplementary Material for this article can be found online at: https://www.frontiersin.org/articles/10.3389/fpls.2020.01143/full#supplementary-material
References
Bian, J. M., He, H. H., Shi, H., Zhu, G. Q., Li, C. J., Zhu, C. L., et al. (2014). Quantitative trait loci mapping for flag leaf traits in rice using a chromosome segment substitution line population. Plant Breed. 133 (2), 203–209. doi: 10.1111/pbr.12146
Chang, Y. Q., Ding, J., Xu, Y. H., Li, D., Zhang, W. J., Li, L., et al. (2018). SLAF-based high-density genetic map construction and QTL mapping for major economic traits in sea urchin strongylocentrotus intermedius. Sci. Rep. 8 (1), 820. doi: 10.1038/s41598-017-18768-y
Chen, M. L., Luo, J., Shao, G. N., Wei, X. J., Tang, S. Q., Sheng, Z. H., et al. (2012). Fine mapping of a major QTL for flag leaf width in rice, qFLW4, which might be caused by alternative splicing of NAL1. Plant Cell Rep. 31 (5), p.863–p.872. doi: 10.1007/s00299-011-1207-7
Chen, S., Huang, Z., Dai, Y., Qin, S., Gao, Y., Zhang, L., et al. (2013). The development of 7E chromosome-specific molecular markers for Thinopyrum elongatum based on SLAF-seq technology. PloS One 8 (6), e65122. doi: 10.1371/journal.pone.0065122
Chen, S., Wang, W. J., Su, J., Wang, C. Y., Feng, A. Q., Yang, J. Y., et al. (2016). Rapid identification of rice blast resistance gene by specific length amplified fragment sequencing. Biotechnol. Biotec. Eq. 30 (3), 462–468. doi: 10.1080/13102818.2016.1159528
Dong, Y. J., Kamiunten, H., Ogawa, T., Tsuzuki, E., Terao, H., Lin, D. Z., et al. (2004). Mapping of QTLs for leaf developmental behavior in rice (Oryza sativa L.). Euphytica 138 (2), 169–175. doi: 10.1023/b:euph.0000046799.21410.13
Du, F., Guan, C. M., Jiao, Y. L. (2018). Molecular mechanisms of leaf morphogenesis. Mol. Plant 11 (9), 1117–1134. doi: 10.1016/j.molp.2018.06.006
Fujita, D., Trijatmiko, K. R., Tagle, A. G., Sapasap, M. V., Koide, Y., Sasaki, K., et al. (2013). NAL1 allele from a rice landrace greatly increases yield in modern indica cultivars. Proc. Natl Acad. Sci 110 (51), 20431–20436. doi: 10.1073/pnas.1310790110
Gao, Z. Y., Zhao, S. C., He, W. M., Guo, L. B., Peng, Y. L., Wang, J. J., et al. (2013). Dissecting yield-associated loci in super hybrid rice by resequencing recombinant inbred lines and improving parental genome sequences. Proc. Natl Acad. Sci 110 (35), 14492–14497. doi: 10.1073/pnas.1306579110
Hu, J., Zhu, L., Zeng, D. L., Gao, Z. Y., Guo, L. B., Fang, Y. X., et al. (2010). Identification and characterization of narrow and rolled leaf 1, a novel gene regulating leaf morphology and plant architecture in rice. Plant Mol. Biol. 73, 283–292. doi: 10.1007/s11103-010-9614-7
Huang, X., Feng, Q., Qian, Q., Zhao, Q., Wang, L., Wang, A., et al. (2009). High-throughput genotyping by whole-genome resequencing. Genome Res. 19 (6), 1068–1076. doi: 10.1101/gr.089516.108
Jiang, D., Fang, J. J., Lou, L. M., Zhao, J. F., Yuan, S. J., Yin, L., et al. (2015). Characterization of a null allelic mutant of the rice NAL1 gene reveals its role in regulating cell division. PloS One 10 (2), e0118169. doi: 10.1371/journal.pone.0118169
Jiao, Y. Q., Wang, Y. H., Xue, D. W., Wang, J., Yan, M. X., Liu, G. F., et al. (2010). Regulation of OsSPL14 by OsmiR156 defines ideal plant architecture in rice. Nat. Genet. 42 (6), 541–544. doi: 10.1038/ng.591
Joehanes, R., Nelson, J. C. (2008). Qgene 4.0, an extensible java QTL-analysis platform. Bioinformatics 24 (23), 2788–2789. doi: 10.1093/bioinformatics/btn523
Kent, W. J. (2002). Blat - the blast-like alignment tool. Genome Res. 12 (4), 656–664. doi: 10.1101/gr.229202
Kozich, J. J., Westcott, S. L., Baxter, N. T., Highlander, S. K., Schloss, P. D. (2013). Development of a dual-index sequencing strategy and curation pipeline for analyzing amplicon sequence data on the miseq illumina sequencing platform. Appl. Environ. Microbiol. 79 (17), 5112–5120. doi: 10.1128/AEM.01043-13
Li, H., Durbin, R. (2009). Fast and accurate short read alignment with burrows-wheeler transform. Bioinformatics 25, 14. doi: 10.1093/bioinformatics/btp324
Li, B., Tian, L., Zhang, J., Huang, L., Han, F., Yan, S., et al. (2014). Construction of a high-density genetic map based on large-scale markers developed by specific length amplified fragment sequencing (SLAF-seq) and its application to QTL analysis for isoflavone content in Glycine max. BMC Genomics 15 (1), 1086. doi: 10.1186/1471-2164-15-1086
Li, Y., Zeng, X. F., Zhao, Y. C., Li, J. R., Zhao, D. G. (2017). Identification of a new rice low-tiller mutant and association analyses based on the SLAF-seq method. Plant Mol. Biol. Rep. 35 (1), 72–82. doi: 10.1007/s11105-016-1002-2
Liu, D. Y., Ma, C. X., Hong, W. G., Huang, L., Liu, M., Liu, H., et al. (2014). Construction and analysis of high-density linkage map using high-throughput sequencing data. PloS One 9 (6), e98855. doi: 10.1371/journal.pone.0098855
Mao, D. H., Yu, L., Chen, D. Z., Li, L. Y., Zhu, Y. X., Xiao, Y. Q. (2015). Multiple cold resistance loci confer the high cold tolerance adaptation of Dongxiang wild rice (Oryza rufipogon) to its high-latitude habitat. Theor. Appl. Genet. 128 (7), 1359–1371. doi: 10.1007/s00122-015-2511-3
Mccouch, S. R., Kochert, G., Yu, Z. H., Wang, Z. Y., Khush, G. S., Coffman, W. R., et al. (1988). Molecular mapping of rice chromosomes. Theor. Appl. Genet. 76 (6), 815–829. doi: 10.1007/bf00273666
Mccouch, S. R., Leonid, T., Yunbi, X., Lobos, K. B., Karen, C., Mark, W., et al. (2002). Development and mapping of 2240 new SSR markers for rice (oryza sativa L.). DNA Res. (6), 6. doi: 10.1093/dnares/9.6.199
Peng, Q., Ye, S. X., Huang, L., Zhang, D. S., Liu, Y., Wu, J. Q., et al. (2016). Construction of a high-density genetic map in rice by using specific-length amplified fragment sequencing (SLAF-seq) technology. Mol. Plant Breeding 14 (8), 2127–2132. doi: 10.13271/j.mpb.014.002127
Prins, R., Groenewald, J. Z., Marais, G. F., Snape, J. W., Koebner, R. M. D. (2001). AFLP and STS tagging of Lr19, a gene conferring resistance to leaf rust in wheat. Theor. Appl. Genet. 103 (4), 618–624. doi: 10.1007/pl00002918
Qi, J., Qian, Q., Bu, Q. Y., Li, S. Y., Chen, Q., Sun, J. Q., et al. (2008). Mutation of the rice Narrow leaf1 gene, which encodes a novel protein, affects vein patterning and polar auxin transport. Plant Physiol. 147 (4), 1947–1959. doi: 10.1104/pp.108.118778
Song, Y. C., Gustafson, J. P. (1995). The physical location of fourteen RFLP markers in rice (oryza sativa L.). Theor. Appl. Genet. 90 (1), 113–119. doi: 10.1007/bf00221003
Stam, P. (1993). Construction of integrated genetic linkage maps by means of a new computer package: Join Map. Plant J. 3 (5), 739–744. doi: 10.1111/j.1365-313x.1993.00739.x
Sun, X. W., Liu, D. Y., Zhang, X. F., Li, W. B., Liu, H., Hong, W. G., et al. (2013). SLAF-seq: an efficient method of large-scale de novo SNP discovery and genotyping using high-throughput sequencing. PloS One 8 (3), e58700. doi: 10.1371/journal.pone.0058700
Tang, X. X., Gong, R., Sun, W. Q., Zhang, C. P., Yu, S. B. (2018). Genetic dissection and validation of candidate genes for flag leaf size in rice (Oryza sativa L.). Theor. Appl. Genet. 131 (4), 801–815. doi: 10.1007/s00122-017-3036-8
Wang, P., Zhou, G., Cui, K., Li, Z., Yu, S. (2012). Clustered QTL for source leaf size and yield traits in rice (Oryza sativa L.). Mol. Breed. 29 (1), 99–113. doi: 10.1007/s11032-010-9529-7
Wu, L., Wang, P., Wang, Y. H., Cheng, Q., Lu, Q. H., Liu, J. Q., et al. (2019). Genome-wide correlation of 36 agronomic traits in the 287 pepper (capsicum) accessions obtained from the SLAF-seq-based GWAS. Int. J. Mol. Sci. 20 (22), 5675. doi: 10.3390/ijms20225675
Yan, S., Yan, C. J., Gu, M. H. (2008). Molecular mechanism of leaf development. Hereditas (Beijing) 30 (9), 1127–1135. doi: 10.3724/SP.J.1005.2008.01127
Yang, X., Xia, X. Z., Zeng, Y., Nong, B. X., Zhang, Z. Q., Wu, Y. Y., et al. (2018). Identification of candidate genes for gelatinization temperature, gel consistency and pericarp color by GWAS in rice based on SLAF-sequencing. PloS One 13 (5), e0196690. doi: 10.1371/journal.pone.0196690
Yin, C. B., Li, H. H., Zhao, Z. G., Wang, Z. Q., Liu, S. J., Chen, L. M., et al. (2017). Genetic dissection of top three leaf traits in rice using progenies from a japonica × indica cross. J. Integr. Plant Biol. 59 (12), 866–880. doi: 10.1111/jipb.12597
Yin, J. L., Fang, Z. W., Sun, C., Zhang, P., Zhang, X., Lu, C., et al. (2018). Rapid identification of a stripe rust resistant gene in a space-induced wheat mutant using specific locus amplified fragment (SLAF) sequencing. Sci. Rep. 8 (1), 3086. doi: 10.1038/s41598-018-21489-5
Yoshimura, S., Yoshimura, A., Iwata, N., Mccouch, S. R., Nelson, R. J. (1995). Tagging and combining bacterial blight resistance genes in rice using RAPD and RFLP markers. Mol. Breed. 1 (4), 375–387. doi: 10.1007/BF01248415
Yu, H., Xie, W., Wang, J., Xing, Y., Xu, C., Li, X., et al. (2011). Gains in QTL detection using an ultra-high density SNP map based on population sequencing relative to traditional RFLP/SSR markers. PloS One 6 (3), e17595. doi: 10.1371/journal.pone.0017595
Yu, H., Wang, J., Zhao, Z., Sheng, X., Shen, Y., Branca, F., et al. (2019). Construction of a high-density genetic map and identification of loci related to hollow stem trait in broccoli (Brassic oleracea L. italica). Front. Plant Sci. 10, 45. doi: 10.3389/fpls.2019.00045
Yuan, L. P. (2011). Progress of new plant type breeding. Hybrid Rice 26 (4), 72–74. doi: 10.16267/j.cnki.1005-3956.2011.04.031
Zhang, G. H., Li, S., Yu, Wang, L., Ye, W. J., Zeng, D. L., et al. (2014). LSCHL4 from japonica cultivar, which is allelic to NAL1, increases yield of indica super rice 93-11. Mol. Plant 7 (8), 1350–1364. doi: 10.1093/mp/ssu055
Zhang, B., Ye, W. J., Ren, D. Y., Tian, P., Peng, Y. L., Gao, Y., et al. (2015). Genetic analysis of flag leaf size and candidate genes determination of a major QTL for flag leaf width in rice. Rice 8, 2. doi: 10.1186/s12284-014-0039-9
Zhang, J., Zhang, Q., Cheng, T., Yang, W., Pan, H., Zhong, J., et al. (2015). High-density genetic map construction and identification of a locus controlling weeping trait in an ornamental woody plant (prunus mume sieb. et zucc). DNA Res. 22 (3), 183–191. doi: 10.1093/dnares/dsv003
Zheng, W. J., Wang, Y., Wang, L. L., Ma, Z. B., Zhao, J. M., Wang, P., et al. (2016). Genetic mapping and molecular marker development for Pi65(t), a novel broad-spectrum resistance gene to rice blast using next-generation sequencing. Theor. Appl. Genet. 129 (5), 1035–1044. doi: 10.1007/s00122-016-2681-7
Zhu, W. Y., Long, H., Long, C., Yang, J. T., Wu, J. N., Qu, M. L., et al. (2016). A high-density genetic linkage map for cucumber (Cucumis sativus L.): based on specific length amplified fragment (SLAF) sequencing and QTL analysis of fruit traits in cucumber. Front. Plant Sci. 7, 437. doi: 10.3389/fpls.2016.00437
Keywords: rice, leaf, quantitative trait loci, genetic map, specific length amplified fragment sequencing, fine mapping
Citation: Wen Y, Fang Y, Hu P, Tan Y, Wang Y, Hou L, Deng X, Wu H, Zhu L, Zhu L, Chen G, Zeng D, Guo L, Zhang G, Gao Z, Dong G, Ren D, Shen L, Zhang Q, Xue D, Qian Q and Hu J (2020) Construction of a High-Density Genetic Map Based on SLAF Markers and QTL Analysis of Leaf Size in Rice. Front. Plant Sci. 11:1143. doi: 10.3389/fpls.2020.01143
Received: 13 May 2020; Accepted: 14 July 2020;
Published: 31 July 2020.
Edited by:
Hanwei Mei, Shanghai Agrobiological Gene Center, ChinaReviewed by:
Yanjun Dong, Shanghai Normal University, ChinaGuihua Zou, ZheJiang Academy of Agricultural Sciences, China
Copyright © 2020 Wen, Fang, Hu, Tan, Wang, Hou, Deng, Wu, Zhu, Zhu, Chen, Zeng, Guo, Zhang, Gao, Dong, Ren, Shen, Zhang, Xue, Qian and Hu. This is an open-access article distributed under the terms of the Creative Commons Attribution License (CC BY). The use, distribution or reproduction in other forums is permitted, provided the original author(s) and the copyright owner(s) are credited and that the original publication in this journal is cited, in accordance with accepted academic practice. No use, distribution or reproduction is permitted which does not comply with these terms.
*Correspondence: Qian Qian, cWlhbnFpYW4xODhAaG90bWFpbC5jb20=; Jiang Hu, aHVqaWFuZzU4OEAxNjMuY29t
†These authors have contributed equally to this work