 Qingzhu Li
 Junxu Xu
- Forestry and Pomology Research Institute, Shanghai Academy of Agricultural Sciences, Shanghai Key Laboratory of Protected Horticultural Technology, Shanghai, China
Lycoris longituba is a traditional medicinal plant containing the bioactive compound galanthamine (Gal), a type of Amaryllidaceae alkaloid and can be used to treat Alzheimer’s disease. However, research on its genome or transcriptome and associated genes in the biosynthetic pathway is incomplete. In this study, we estimated the nuclear genome size of this species to be 29.33 Gb by flow cytometry. Then, RNA sequencing of the leaves, roots, and bulbs of L. longituba was carried out. After de novo assembly, 474,589 all-transcripts and 333,440 all-unigenes were finally generated. In addition, the differentially expressed genes (DEGs) were identified, and genes involved in the galanthamine metabolic pathway encoding tyrosine decarboxylase (TYDC), phenylalanine ammonia-lyase (PAL), cinnamate 4-hydroxylase (C4H), p-coumarate 3-hydroxylase (C3H), norbelladine synthase (NBS), norbelladine 4’-O-methyltransferase (OMT), and noroxomaritidine synthase (CYP96T1) were detected and validated by real-time quantitative PCR analysis. One candidate gene, Lycoris longituba O-Methyltransferase (LlOMT), was identified in the proposed galanthamine biosynthetic pathway. Sequence analysis showed that LlOMT is a class I OMT. LlOMT is localized in the cytoplasm, and biochemical analysis indicated that the recombinant LlOMT catalyzes norbelladine to generate 4′-O-methylnorbelladine. The protoplast transformation result showed that the overexpression of LlOMT could increase the Gal content. Our results indicate that LlOMT may play a role in galanthamine biosynthesis in L. longituba. This work provides a useful resource for the metabolic engineering of Amaryllidaceae alkaloids.
Introduction
Lycoris longituba is a traditional medicinal plant of the Amaryllidaceae family and is endemic to the eastern temperate regions of China. Like other species in the Lycoris genus, the dried bulbs of L. longituba are used as a Chinese medicinal herb to treat carbuncle, sore throat, and edema (Wu et al., 2008). It has been reported that L. longituba contains an abundance of Amaryllidaceae alkaloids and is a valuable medicinal plant source (Guo et al., 2014; Li Q. Z. et al., 2018). To date, more than 500 alkaloids with different structures have been isolated (Jin, 2013; Singh and Desgagné-Penix, 2014). Phytochemical studies show that these alkaloids have many pharmacological functions. For example, narciclasine has antitumor activity (Kornienko and Evidente, 2008), lycorine can block the cell cycle and induce apoptosis of the HL-60 cancer cell line (Liu et al., 2004), and haemanthamine has anticancer activity (Pellegrino et al., 2018). Galanthamine (Gal) is a unique isoquinoline alkaloid. As an acetylcholinesterase inhibitor, it can affect the brain nicotine receptor and inhibit the activity of acetylcholinesterase (Barnes et al., 2000; Wang et al., 2010). Gal is one of the drugs used for the treatment of Alzheimer’s disease, and its efficacy and safety in the treatment of Alzheimer’s disease have been confirmed by a clinical trial (Repantis et al., 2010).
In contrast to the extensive literature on the pharmaceutical effects of Gal, information on its biosynthesis pathway is incomplete. The proposed Gal biosynthesis pathway in Narcissus showed that the core intermediate norbelladine was synthesized from 3,4-dihydroxybenzaldehyde and tyramine, and then transformed into 4’-O-methylnorbelladine under the catalysis of norbelladine 4’-O-methyltransferase (OMT). 4’-O-Methylnorbelladine is oxidized to N-demethylnarwedine, following which it is reduced to N-demethylgalanthamine, and then finally N-demethylgalanthamine is methylated to galanthamine (Kilgore et al., 2014). The NpN4OMT and CYP96T1 genes have been reported to be involved in the Gal biosynthesis pathway in Narcissus (Kilgore et al., 2014; Kilgore et al., 2016). In Lycoris, only a few studies on L. radiata and L. aurea have reported genes, including LrPAL, LrC4H, and LaOMT1, that may be involved in the Gal pathway (Li et al., 2018; Sun et al., 2018).
In this study, the genome size of L. longituba was determined by flow cytometry. RNA from the roots, leaves, and bulbs was extracted to construct cDNA libraries for transcriptome analysis. Our aim was to explore the transcriptome of the non-model plant L. longituba and to study the biosynthesis of the Amaryllidaceae alkaloid Gal. One of the key genes in the pathway name LlOMT1 was characterized, and six putative genes involved in the galanthamine biosynthetic pathway of L. longituba were discovered. This work will provide a useful resource for the metabolic engineering of Amaryllidaceae alkaloids.
Materials and Methods
Plant Materials
Lycoris longituba plant materials were collected from the resource nursery at the Shanghai Academy of Agricultural Sciences in China (31.23°N, 121.10°E) and identified by Prof. Zheng Yuhong (Institute of Botany, Chinese Academy of Sciences, Jiangsu Province). The material consistency was maintained through micropropagation. Voucher specimens of L. longituba (0653969) were deposited at the herbarium of the Institute of Botany, Chinese Academy of Sciences. Total RNA was extracted from the leaves (L), roots (R), and bulbs (B) of actively growing three-year-old samples. Experiments were conducted in three independent biological replicates (Figure 1).
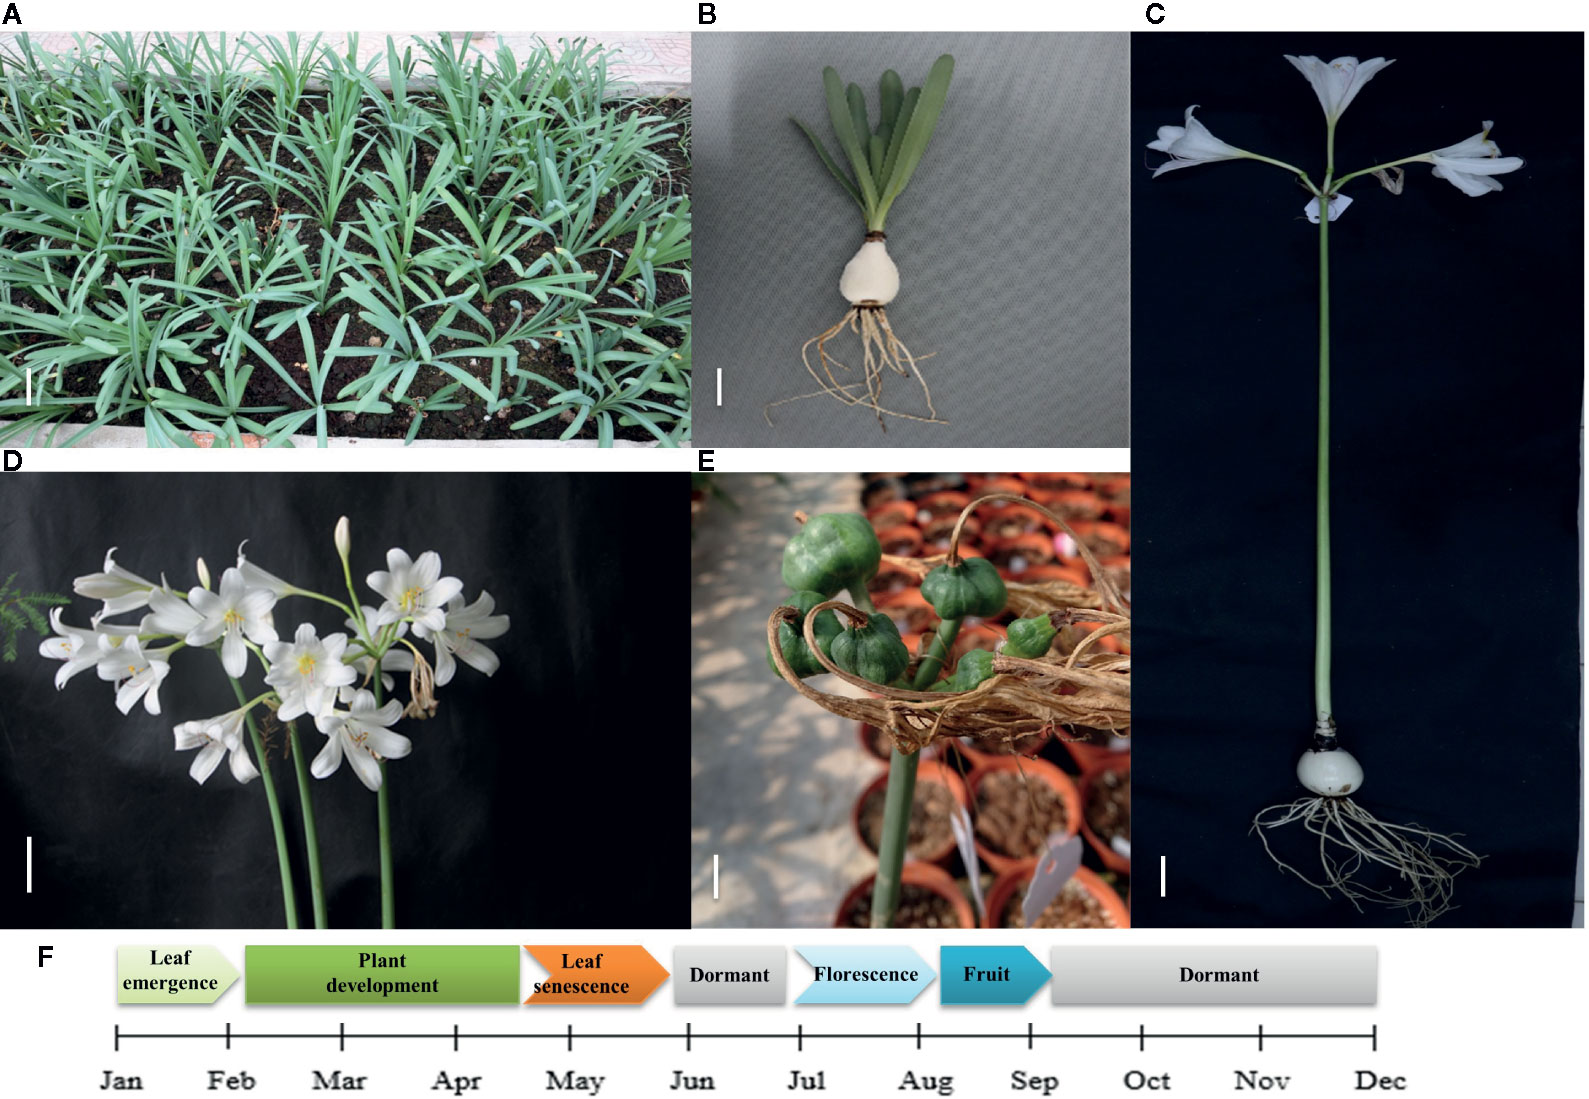
Figure 1 Growth cycle of L. longituba in this study. (A) The plant growth of L. longituba at the plant development stage. (B) The leaf, bulb, and root of L. longituba at the plant development stage. (C) The whole plant of L. longituba at the flowering stage. (D) Inflorescence of L. longituba at the flowering stage. (E) Fruit of L. longituba. (F) Growth period of L. longituba during the growth cycle.
Nuclear DNA Content Determination
Seedlings of Hordeum vulgare L. cv. Morex were supplied by Longhua Zhou (Shanghai Academy of Agriculture Sciences, Shanghai, China), which was used as standard [≈5.1 Gb (Mayer et al., 2012)]. The young leaves were collected from Hordeum vulgare L. and L. longituba seedlings. The leaves were homogenized in 2 ml of homogenization buffer [45 mM MgCl2; 30 mM sodium citrate; 20 mM 3-morpholinopropanesulfonic acid; 0.1% (w/v) TritonX-100; pH 7.0] and then filtered with a 200-mesh nylon net (Galbraith et al., 1983). Centrifugation of the filtrate was conducted at 1500 rpm for 5 min to obtain the nuclear fraction. The obtained fraction was then stained with propidium iodide (PI; 50 µg/ml), incubated at 4°C for 20 min, and again filtered through a 500-mesh nylon net. The resulting nuclear suspensions were sorted via flow cytometry. Experiments were conducted in three independent biological replicates.
RNA Extraction and cDNA Library Construction
mRNA extraction, cDNA library construction, and library sequencing were all performed by Shanghai Personal Biotechnology Co., Ltd (Shanghai, China). Total RNA was extracted from plant materials using the TRlzol reagent from nine samples (three tissues with three independent biological replicates), followed by digestion with DNase I and enrichment with Oligo (dT) magnetic beads. The RNAs were then fragmented with a fragmentation buffer. First-strand cDNA was synthesized from the RNA pools by using random primers and conversion to double-stranded cDNA with RNase H and DNA polymerase I. A QIAquick PCR Extraction Kit (Qiagen, Valencia, CA, USA) was then used to purify fragments of appropriate length. The termini of the DNA fragments were end-repaired and ligated with sequencing adapters. AMPure XP beads (Beckman Coulter, Shanghai, China) were used to remove fragments that were incorrectly synthesized. Polymerase chain reaction (PCR) was then used to construct fragment libraries that were quantified using the PicoGreen kit (Quantifluor™-ST fluorometer E6090, Promega, CA, USA) and fluorospectrophotometry (Quant-iT PicoGreen dsDNA Assay Kit; Invitrogen, P7589). The cDNA pools were then quantified with an Agilent 2100 Bioanalyzer (Agilent Technologies, Santa Clara, CA, USA; Agilent High Sensitivity DNA Kit, Agilent, 5067–4626). Synthesized cDNA libraries were normalized to 2-nM concentrations. The nine sample libraries were then gradually diluted, quantified to 4–5 pM, and sequenced on the Illumina HiSeq X Ten platform.
Sequencing, de novo Assembly, and Transcript Annotation
A total of approximately 20 Gbp of sequence data were generated for each sample (three tissues with three independent biological replicates). The raw data were quality filtered to remove reads with adapters or those that contained more than five ambiguous nucleotides (“N”). Low-quality reads were then removed before subsequent analysis. The Trinity software program (Grabherr et al., 2011) was used to assemble the remaining high-quality “clean” reads. Annotations were conducted via Basic Local Alignment Search Tool (BLAST) searches of sequences against the Kyoto Encyclopedia of Genes and Genomes (KEGG) (Kanehisa and Goto, 2000) and National Centre for Biotechnology Information (NCBI) non-redundant (nr) protein databases and Swiss-Prot database in addition to the NCBI non-redundant nucleotide (nt) database. An E-value cutoff of 10−5 was used to assign annotations based on matches in the databases.
Differential Gene Expression Analysis and Functional Enrichment
Clean reads were aligned to unigenes, and the reads per kilobase of exon per million mapped reads (RPKM) values were calculated for the unigenes from the L, R, and B samples. Differential expression of the unigenes was then calculated using the DEGseq software package, with fold-change thresholds set a priori to P ≤ 0.05 and a log2 (fold change) > 1. The Gene Ontology (GO), KEGG, and eggNOR databases (Mortazavi et al., 2008; Wang et al., 2009; Kanehisa et al., 2012) were then used to further analyze the differentially expressed genes (DEGs). Analysis was conducted in three independent biological replicates.
Real-Time Quantitative PCR (RT-qPCR) Validation of Gene Expression
Total RNA was extracted from the L, R, and B samples of L. longituba using the TRIzol reagent (Invitrogen) according to the manufacturer’s instructions. RNA samples were then treated with DNAase I (Promega, USA) and reverse-transcribed using the M-MLV reverse transcriptase (Promega, USA) to generate cDNA for gene expression analysis. RT-qPCR assays were conducted using the SYBR Green Mix (Applied Biosystems) and amplification in a StepOne Plus real-time PCR system with the following conditions: pre-incubation (95°C for 5 min), followed by 40 cycles of 95°C for 15 s and 60°C for 30 s. The CT value comparative method (Schmittgen and Livak, 2008) was used to determine expression level fold changes for the target genes. Gene specific primers were designed on the basis of the cDNA sequences for real-time PCR amplification of corresponding genes according to the instructions of real-time PCR system. The Actin gene from L. longituba was used as an internal reference. Primer sequence information used in RT-qPCR assays is provided in Supplementary Table 1. Experiments were conducted in three independent biological replicates.
Alkaloid Extraction and Quantification
GAL was determined according to a previous method (Li W. et al., 2018). Approximately 0.2 g plant tissue was freeze-dried and extracted in 2 ml of 70% high-performance liquid chromatography (HPLC)–grade ethanol by sonication. After centrifugation at 12,000 rpm for 10 min, the supernatants were vacuum-dried and re-dissolved in 1 ml of 0.1% formic acid-acetonitrile (V/V = 95/5) for LC tandem mass-spectrometry (MS/MS) analysis. Gal was purchased from TCI Development Co., Ltd (Shanghai, China). HPLC-grade solvents (methanol, formic acid, water, ethanol, acetonitrile) were obtained from Thermo Fisher Scientific (USA). Analysis of the GAL was performed with a Nexera ultra(U)HPLC LC-30A (Shimadzu) equipped with a Waters ACQUITY UPLC BEH C18 column (150 mm×2.1 mm, 1.7 μm). Separation was conducted using 0.1% formic acid (v/v) (A) and acetonitrile (B) with a 6-min linear gradient of 5%–60% B at a flow rate of 0.2 ml/min. The LC elution was monitored using an API-5500-QTRAP mass spectrometer (AB SCIEX) operating in positive detection mode. The transition reactions m/z 288→231 were used for the quantification of GAL. Experiments were conducted in three independent biological replicates.
Cloning and Sequence Analysis of the LlOMT Gene
LlOMT coding sequences were amplified by PCR with gene-specific primers (Supplementary Table 1). The amino acid sequences of the different OMTs were then aligned using Clustal Omega (http://www.clustal.org/omega/). Phylogenetic analysis was conducted with 29 OMT proteins using MEGA X 10.1 (https://www.megasoftware.net/) with the neighbor-joining method, and node support was determined using 1,000 bootstrap replicates.
Localization Analysis of LlOMT
The LlOMT coding region was cloned in-frame with the green fluorescent protein (GFP) gene in the pBWA(V)HS-35S-NOS vector. Agrobacterium tumefaciens (strain GV3101) cultures harboring this construct were adjusted to OD600 = 0.8 in MES buffer (10 mM MES, pH 5.5, and 10 mM MgSO4) and then infiltrated in 6-week-old Nicotiana benthamiana leaves, as described previously (Liu et al., 2016). After 3 days, the fluorescent signals in the inoculated leaves were examinedwith confocal microscopy (LSM710, Carl Zeiss Microscopy). Experiments were conducted in three independent biological replicates.
Enzyme Activity Assay and Kinetics Parameters of LlOMT
The LlOMT coding sequence with a His tag was cloned in-frame in the pET–28a vector (Novagen) and transformed into Escherichia coli BL21 (DE3) cells to express the recombinant protein. The His-tag fusion protein was then purified using Ni-NTA agarose (Qiagen) following the manufacturer’s instructions. LlOMT enzyme activity assays were conducted according to Kilgore’s method (2014). The 100-μl (final volume) solution contained 10 μg recombinant protein, 200 μM AdoMet, and 100 μM norbelladine in 30 mM potassium phosphate buffer (pH 8.0). Reactions were incubated at 30°C for 2 h and terminated by adjusting the pH to 9.5 with two volumes of sodium bicarbonate, followed by two extractions in ethyl acetate. The extracts were vacuum-dried and re-dissolved in 100 μl of 50% methanol for measurement in LC-MS/MS analysis. To determine the kinetics parameters of LlOMT-catalyzed O-methylation, the reactions were performed in 100 μl solution contained 10 μM recombinant protein, 200 μM AdoMet, and 50 μM-2 mM norbelladine in 30 mM potassium phosphate buffer (pH 8.0), reactions were incubated at 30°C for 2 h. Reaction products were measured by a Nexera UHPLC LC-30A system (Shimadzu) equipped with a Waters ACQUITY UPLC BEH C18 (150 mm × 2.1 mm, 1.7 μm). Separation was carried out using 0.1% formic acid (v/v) (A) and methanol (B) with a 6-min linear gradient of 5%–40% B at a flow rate of 0.4 ml/min. The LC elution was monitored using an API-4000-QTRAP mass spectrometer (AB SCIEX) operating in positive detection mode for norbelladine and 4’-O-methylnorbelladine. Identification was based on retention times and MS/MS spectra compared to authentic standards (Shanghai spectrum chemical Biotechnology Co., Ltd), The transition reactions m/z 260→138 and 274→137 were used for the quantification of norbelladine and 4’-O-methylnorbelladine. Experiments were conducted in three independent technical replicates.
Protoplast Transformation
The LlOMT-GFP fusion constructs were transformed into L. longituba protoplasts using polyethylene glycol (PEG)-mediated transformation according to our patent (CN 201910010502.5). The GFP empty vector was used as a negative control. Experiments were conducted in three independent biological replicates. Generally, 1.5 g leaf of L. longituba seedlings was cut into small pieces and quickly transferred into 10 ml A buffer (1.5% cellulose R10 (Yakult), 0.75% macerozyme R10 (Yakult), 0.5M mannitol, 10mM CaCl2, 0.1% bovine serum albumin, 10mM MES pH = 5.7), following which the samples were incubated for 4 h at 28°C with gentle shaking. Afterward, the enzyme solution was filtered through a 50-µm cell strainer to collect the protoplasts, and the residue was combined with B buffer (154mM NaCl, 125mM CaCl2, 5 mM KCl, 2mM MES pH = 5.7) and filtered again. The flow-through was centrifuged at 150 g for 5 min and the pellet was washed twice with B buffer. The protoplasts were re-suspended in C buffer (0.5 M mannitol, 15mM MgCl2, 4mM MES pH = 5.7) and adjusted to 1 × 10⁷ cells per ml. Protoplasts were mixed with plasmids and D buffer [40% (W/V) polyethylene glycol, 0.1M CaCl2, 0.2M mannitol]. The mixture was incubated at 28°C for 15 min and then diluted with 1 ml B solution, followed by centrifugation at 150 g for 5 min. The protoplasts were re-suspended in 1 ml B buffer and incubated at 28°C for 12 h. After incubation, fluorescent signals in the transformed protoplasts were examined by confocal microscopy (LSM710, Carl Zeiss Microscopy).
Results
Genome Size Estimation
To determine the genome size of L. longituba, the young leaf nucleus of L. longituba was analyzed using flow cytometry with H. vulgare [≈5.1 Gb (Mayer et al., 2012; Mascher et al., 2017)] as an internal standard. The genome size of L. longituba [2n = 16 (Ke et al., 1998)] was estimated to be 29.33 ± 0.08 Gb (Table 1 and Supplementary Figure 1). This result is similar with a previous estimation of about 30.675 Gb (Jiang et al., 2017) and will provide a reference for the genomic research of L. longituba and for the evaluation of sequencing depth.
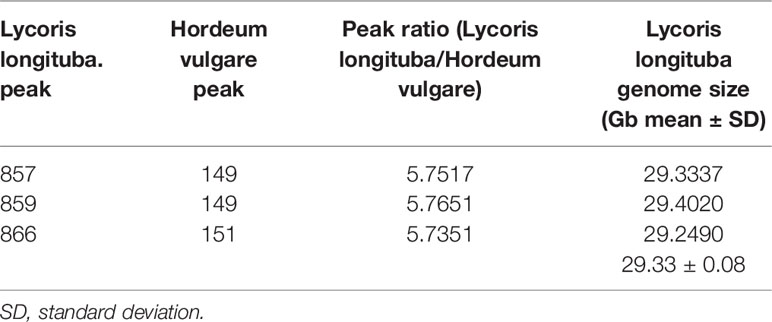
Table 1 Flow cytometry determination of the nuclear genome size of L. longituba (N = 3).
Illumina Sequencing and Reads Assembly
For a non-model species that lacks genome information, such as L. longituba, de novo transcriptome analysis can facilitate the discovery of novel genes and elucidate complex metabolic pathways. To generate a transcriptome database, nine total mRNA libraries were generated by Illumina sequencing, including three from L. longituba leaves, three from bulbs, and three from roots.
A total of approximately 133 million raw reads were recovered from the root libraries, 134 million from the leaves, and 139 million from the bulbs. After filtering out adapter sequences and low-quality reads, over 131, 132, and 137 million clean reads were recovered for the R, L, and B samples, respectively. The clean reads from each sample were assembled resulting in 360,593 (R), 320,299 (L), and 326,962 (B) transcripts. The average transcript size exceeded 750 bp for each tissue library, with an N50 of 1,133–1,195 bp. A total of 223,969 (R), 185,467 (L), and 191,716 (B) unigenes were identified in the datasets. After conducting long-sequence clustering of the nine samples, 474,589 all-transcripts and 333,440 all-unigenes were ultimately generated. These datasets had mean lengths of 647 and 521 bp and N50s of 981 and 644 bp, respectively. The length distributions of the transcripts and unigenes are shown in Supplementary Figure 2, while a summary of the sequencing and assembly results is provided in Table 2. All raw data have been deposited in the NCBI Sequence Reads Archive (SRA) with the accession number PRJNA590043.
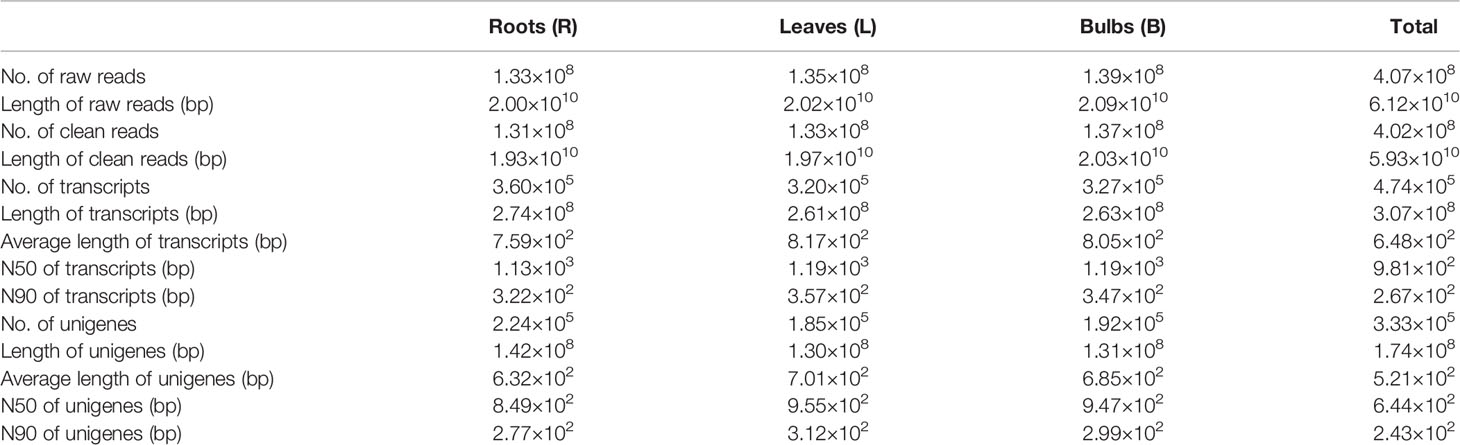
Table 2 Summary of the Illumina sequencing and reads assembly for L. longituba (N = 3).
Functional Annotation
BLAST comparisons of the all-unigenes datasets against non-redundant (nr), eggNOG, Swiss-Prot, and KEGG databases indicated that 85,622 (25.68%) of the unigenes possessed homologous sequences in at least one of the above databases. A total of 80,405 (24.11%), 74,402 (22.31%), 56,000 (16.79%), and 5716 (1.71%) unigenes had homologs in the nr, eggNOG, Swiss-Prot, and KEGG databases, respectively. A total of 2917 (0.87%) unigenes exhibited homologs in all three databases, while 247,817 (74.32%) unigenes did not have representative homologs in the databases (Figure 2). These transcripts may thus represent novel proteins, long non-coding RNAs in the L. longituba genome, or they could be derived from less conserved 3′- or 5′-untranslated regions of genes.
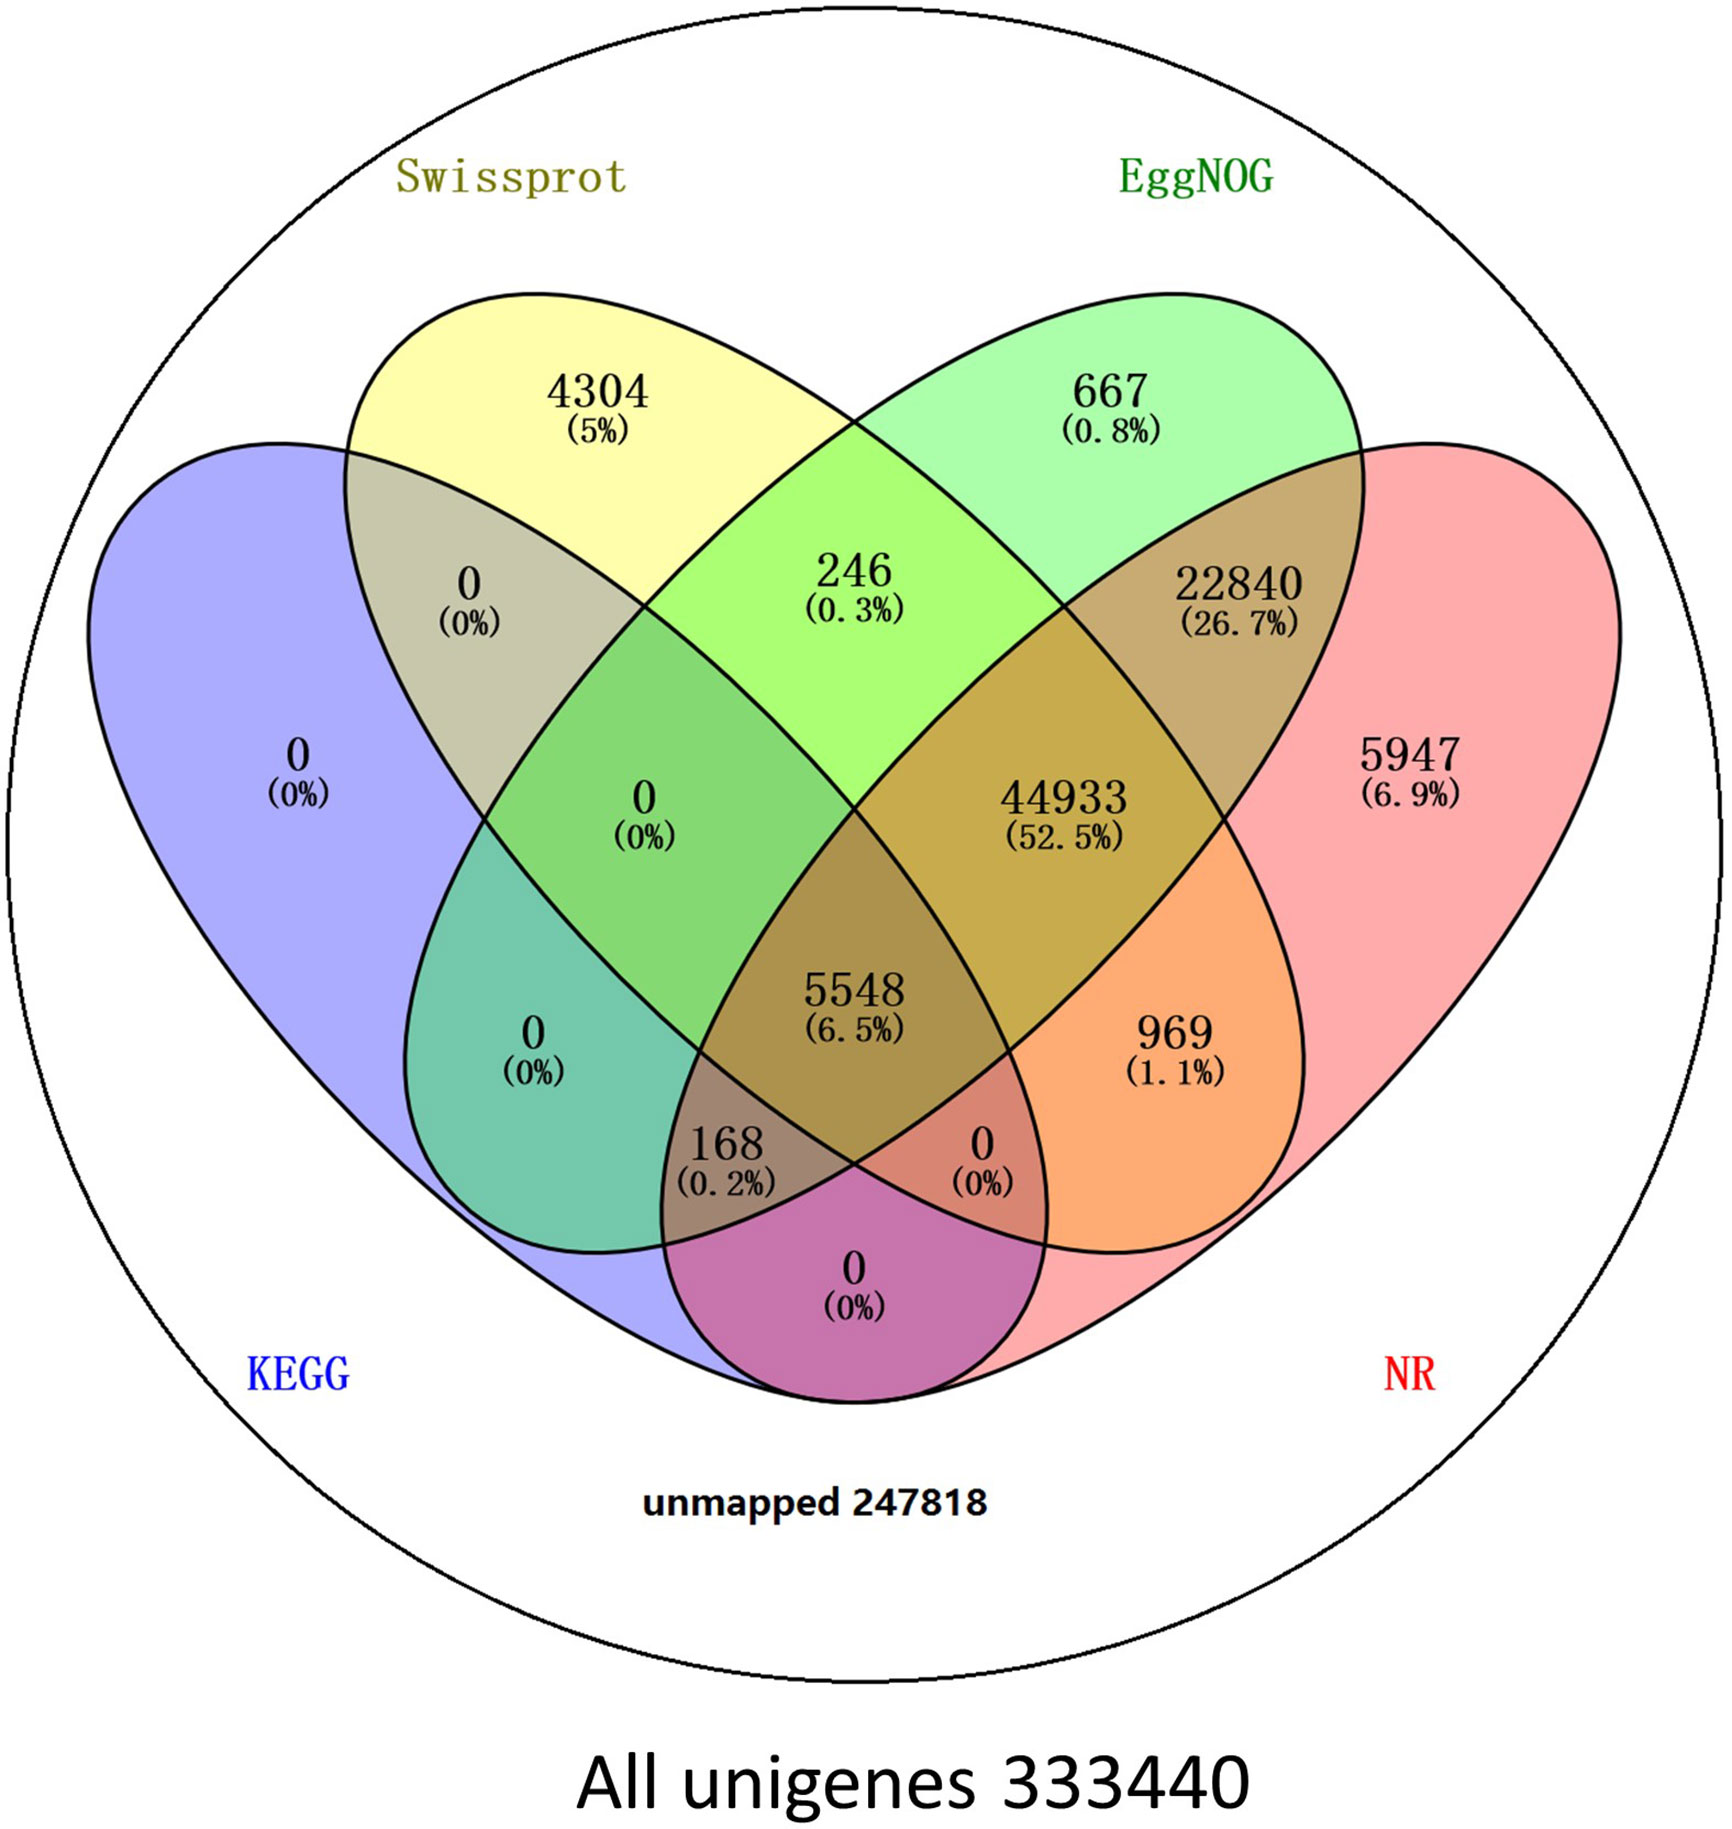
Figure 2 Number of unigenes blasted to Nr, eggNOG, Swiss-Prot, and KEGG (E < 0.00001). KEGG, Kyoto encyclopedia of genes and genomes (N = 3).
We obtained the species homology distribution of the L. longituba unigenes via nr annotations. Comparisons against 1,172 plant species with homologous mRNA sequences to those of L. longituba indicated that the annotated unigenes were most similar to those of Elaeis guineensis (12.91%), Phoenix dactylifera (12.73%), and Musa acuminata subsp. malaccensis (4.83%) (Supplementary Figure 3).
Transcription factors (TFs) comprise diverse gene families that play key regulatory roles in plant growth and development by controlling the expression of genes through specific binding to cis-regulatory elements that are present in the promoter regions of target genes. Many TF families are known to regulate secondary metabolite biosynthesis in plants including the MYB, MYB-related, WRKY, and bHLH families (Park et al., 2008; Hichri et al., 2010; Xie et al., 2016; Yin et al., 2017; Yu et al., 2018). Our analysis of the L. longituba transcriptome data revealed that 38347 unigenes (11.50%) encode putative TFs that can be classified into 58 TF families (Supplementary Table 2). Members of the bHLH TF family were the most abundant (3115, 8.12%) followed by ERF (2882, 7.51%), NAC (2466, 6.43%), TCP (2312, 6.03%), and MYB-related (2250, 5.87%) (Supplementary Figure 4 and Supplementary Table 2). The identification of these abundant TFs combined with their expression profiles in individual tissues provides a rich resource for future characterization of specific TFs in various biochemical pathways of L. longituba.
To further evaluate the primary biological functions represented within the transcriptomes, GO, eggNOG, and KEGG pathway analyses were performed. GO mapping provides a description of gene products based on their associated biological processes (BPs), cellular components (CCs), and molecular functions (MFs) (Berardini et al., 2004) (Supplementary Figure 5). A total of 32,128 unigenes were categorized into 67 major functional groups. Metabolic process (GO:0008152), cell (GO:0005623), and binding (GO:0005488) were the most highly represented GO terms in the BP, CC, and MF transcriptomes, respectively (Supplementary Table 3 and Supplementary Figure 5).
eggNOG mapping was also performed to further evaluate the function of the assembled unigenes. A total of 74,402 annotated unigenes were grouped into 26 eggNOG classification groups (Supplementary Table 4 and Supplementary Figure 6). The three most abundant groups represented in the transcriptomes [excluding groups R (general function prediction only) and S (function unknown)] were group L (replication, recombination, and repair), group O (post-translational modification, protein turnover, and chaperones), and group T (signal transduction mechanisms) (Supplementary Table 4).
A total of 5,716 unigenes were mapped to 35 major KEGG pathways (Supplementary Tables 3, 5). The pathways with the highest unigene representations were translation (516 unigenes), carbohydrate metabolism (403 unigenes), and signal transduction (398 unigenes).
Differential Expression Analysis
The DEGs were identified based on the normalized RPKM value for each transcript in individual tissues (Supplementary Figure 7 and Supplementary Tables 6, 7). A total of 14,825 DEGs were detected in at least one pairwise comparison among the R/B, L/B, and R/L comparisons (Figure 3A). DEGs were further compared in each tissue relative to the other two tissues using thresholds of P < 0.05 and at least a two-fold expression change among different tissues. Specifically, DEGs were identified by comparing their RPKM values from one tissue against those of the other two tissues in order to compare an equivalent statistical parameter. A total of 3,574 unigenes were up-regulated in roots, while 5,864 unigenes were down-regulated relative to their expression in the other two tissues (Figure 3B). The bulbs had the largest number of DEGs (9748), with 4,633 up-regulated and 5,115 down-regulated unigenes. The leaves had the largest number of up-regulated unigenes, with 5,540 up-regulated and 3,679 down-regulated unigenes (Figure 3B).
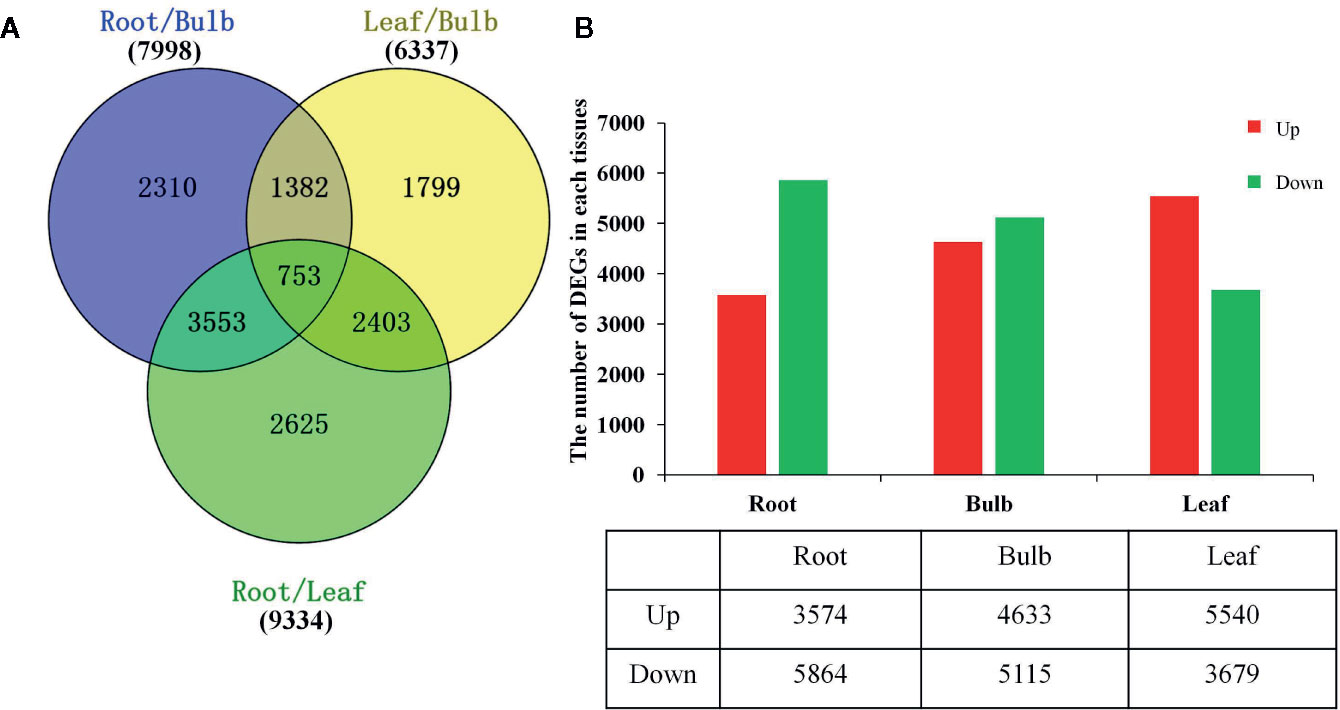
Figure 3 Differential expression analysis of L. longituba unigenes. (A) Venn diagram representing the number of DEGs in different pairwise comparisons. (B) The number of significantly (P-value ≤ 0.05 and at least two-fold change) Up- and Down- regulated unigenes in each tissue compared to all other tissues. DEGs, differentially expressed genes (N = 3).
Furthermore, we identified 324 DEGs that were assigned functions within 28 secondary metabolic pathways of KEGG (Table 3). Among these, 40 unigenes encoded key enzymes involved in terpenoid biosynthesis pathways, including the synthesis of the terpenoid backbone (28 unigenes), monoterpenoids (two unigenes), diterpenoids (seven unigenes), and sesquiterpenoids and triterpenoids (three unigenes). Further, 29 DEG unigenes were identified in the flavonoid biosynthesis pathway, including biosynthetic pathways for phenylpropanoid (17 unigenes), flavonoids (11 unigenes), and flavones and flavonols (one unigene). Thirty unigenes were associated with porphyrin and chlorophyll metabolism pathways, while only seven unigenes were associated with isoquinoline alkaloid biosynthesis. The identification and future characterization of these unigenes that are involved in various metabolic pathways will help to better understand their functions in the biosynthesis of active compounds by L. longituba plants.
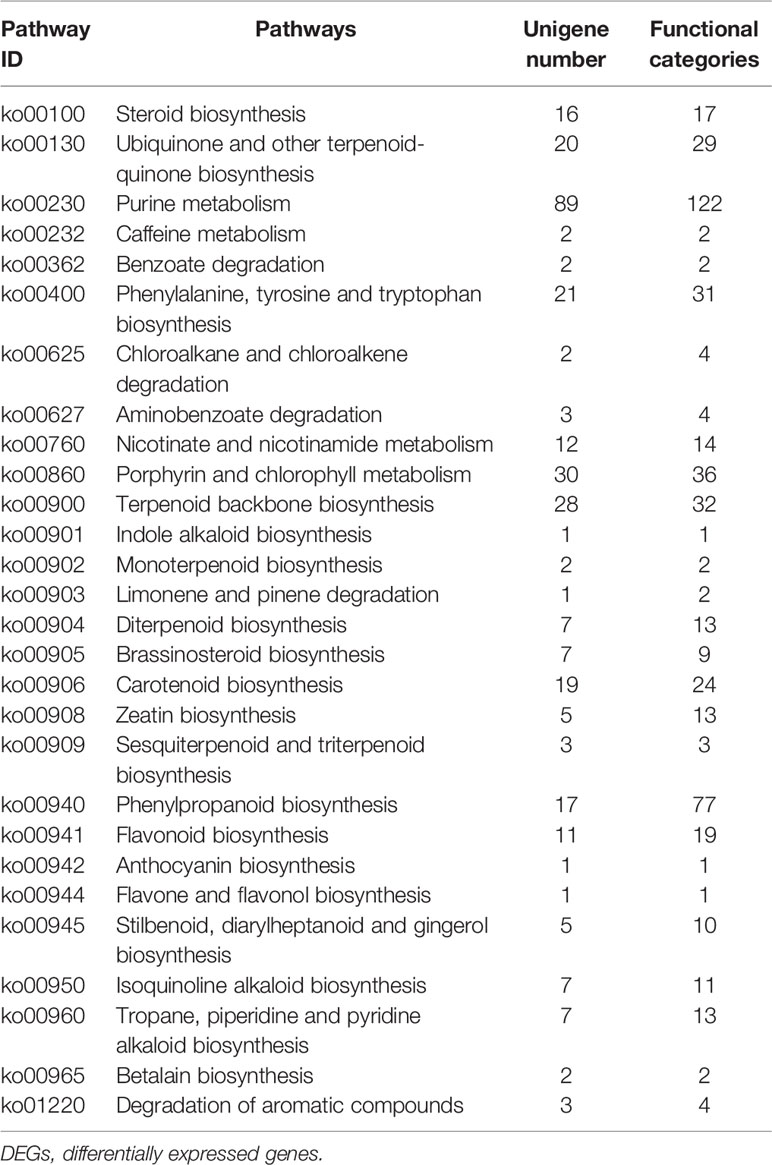
Table 3 Secondary metabolic pathways and their related number of DEGs in the two samples as compared with bulbs (N = 3).
Gene Expression Analysis of the DEGs Involved in Gal Biosynthesis in the Different Tissues of L. longituba
Local BLASTx analyses were conducted to identify gene transcripts encoding enzymes that are putatively involved in Gal biosynthesis (Figure 4). Several transcript isoforms of orthologous genes were identified from the precursor pathway leading to norbelladine. For example, the PAL gene has been cloned and characterized from L. radiata, from which LrPAL3 was identified (Li et al., 2018). BLASTx searches for the PAL3 gene in the transcriptome led to the identification of one transcript with 93.1% similarity to the PAL3 sequence, with an E-value of zero. Thus, we identified this as LlPAL (Table 4). Similarly, one gene transcript showed 91.8% similarity to the Narcissus aff. pseudonarcissus TYDC, with an E-value of zero (Singh and Desgagné-Penix, 2017). Thus, we were able to find seven transcripts with E-values corresponding to genes encoding enzymes involved in Gal biosynthesis (Kilgore et al., 2014; Kilgore et al., 2016; Singh and Desgagné-Penix, 2017; Li et al., 2018; Sun et al., 2018). In the central Gal biosynthetic pathway, sequence reads corresponding to OMT, C4H, and C3H were more abundant than those operating in precursor pathways including PAL, TYDC, and others (Figure 5A). This result was confirmed by FPKM digital expression comparisons and through RT-qPCR analysis (Figures 5B–H).
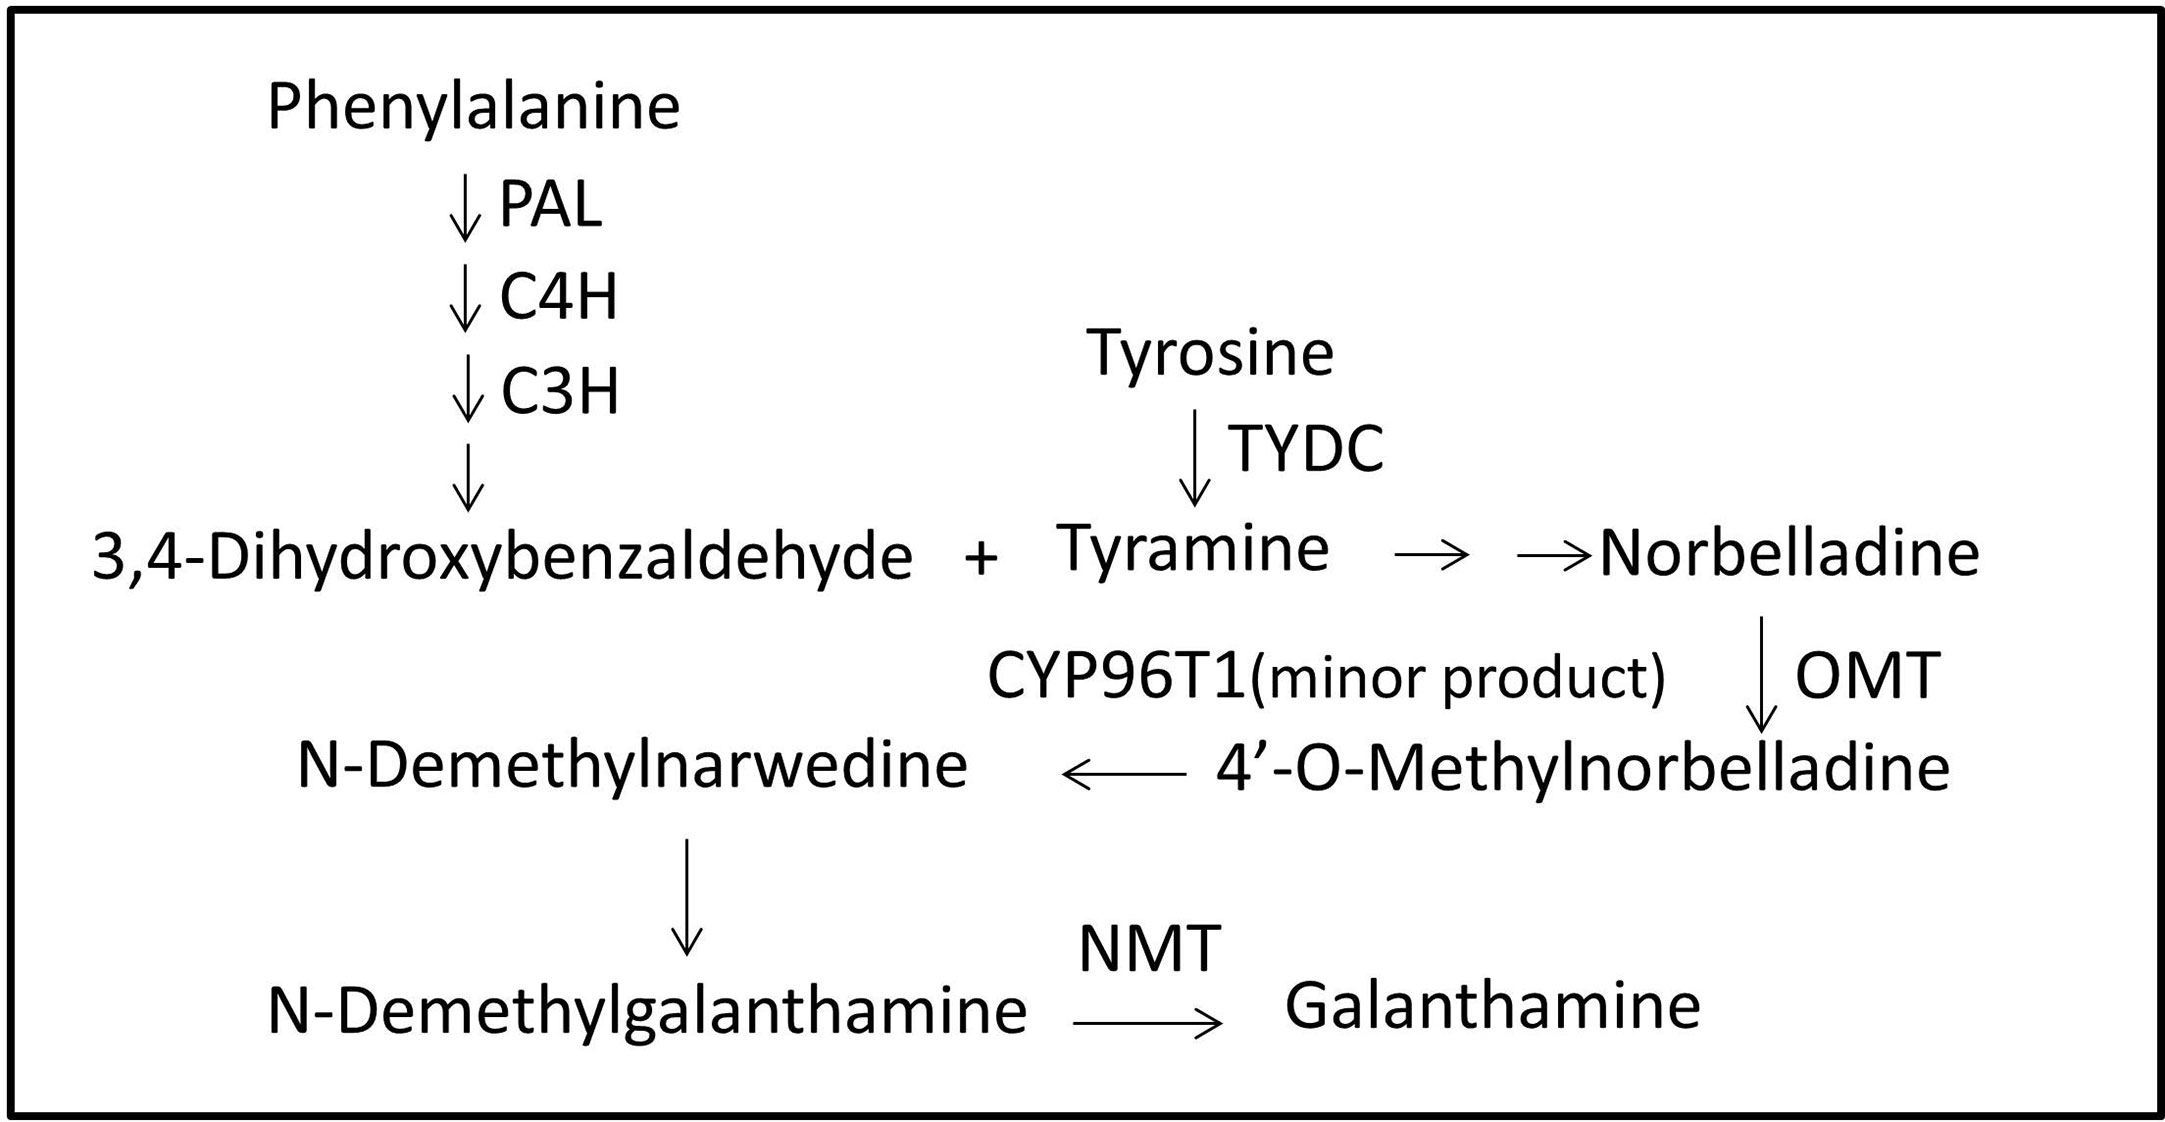
Figure 4 Proposed Gal biosynthesis pathway in L. longituba. Norbelladine is synthesized from 3,4-dihydroxybenzaldehyde and tyramine, and then transformed into 4’-O-methylnorbelladine under the catalysis of OMT. 4’-O-methylnorbelladine is oxidized to N-demethylnarwedine, and then, it is reduced to N-demethylgalanthamine, and finally N-demethylgalanthamine is methylated to galanthamine. C3H, p-coumarate 3-hydroxylase; C4H, Cinnamate 4-hydroxylase; CYP96T1, noroxomaritidine synthase; Gal, galanthamine; NBS, norbelladine synthase; NMT, N-methyltransferase; OMT, norbelladine 4’-O-methyltransferase; PAL, phenylalanine ammonia; TYDC, tyrosine decarboxylase.
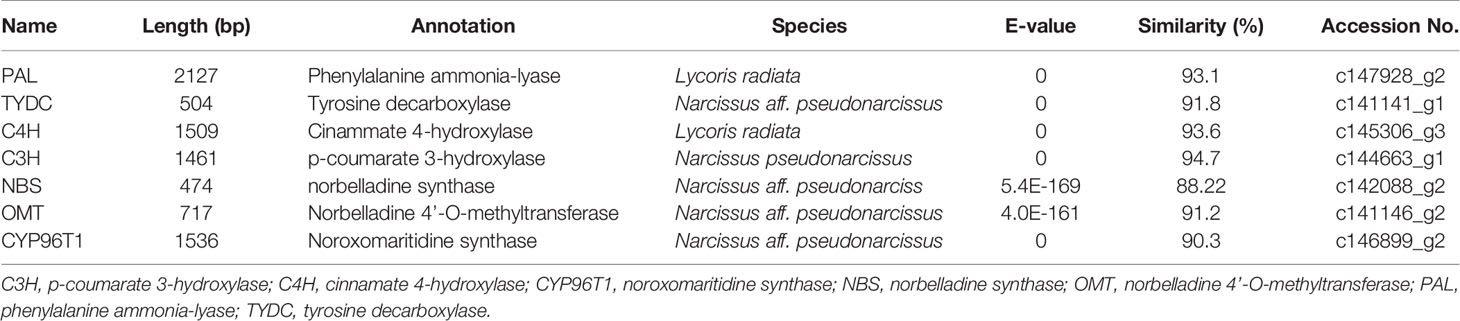
Table 4 Summary of the putative biosynthetic genes involved in Gal biosynthesis in different tissues of L. longituba (N = 3).
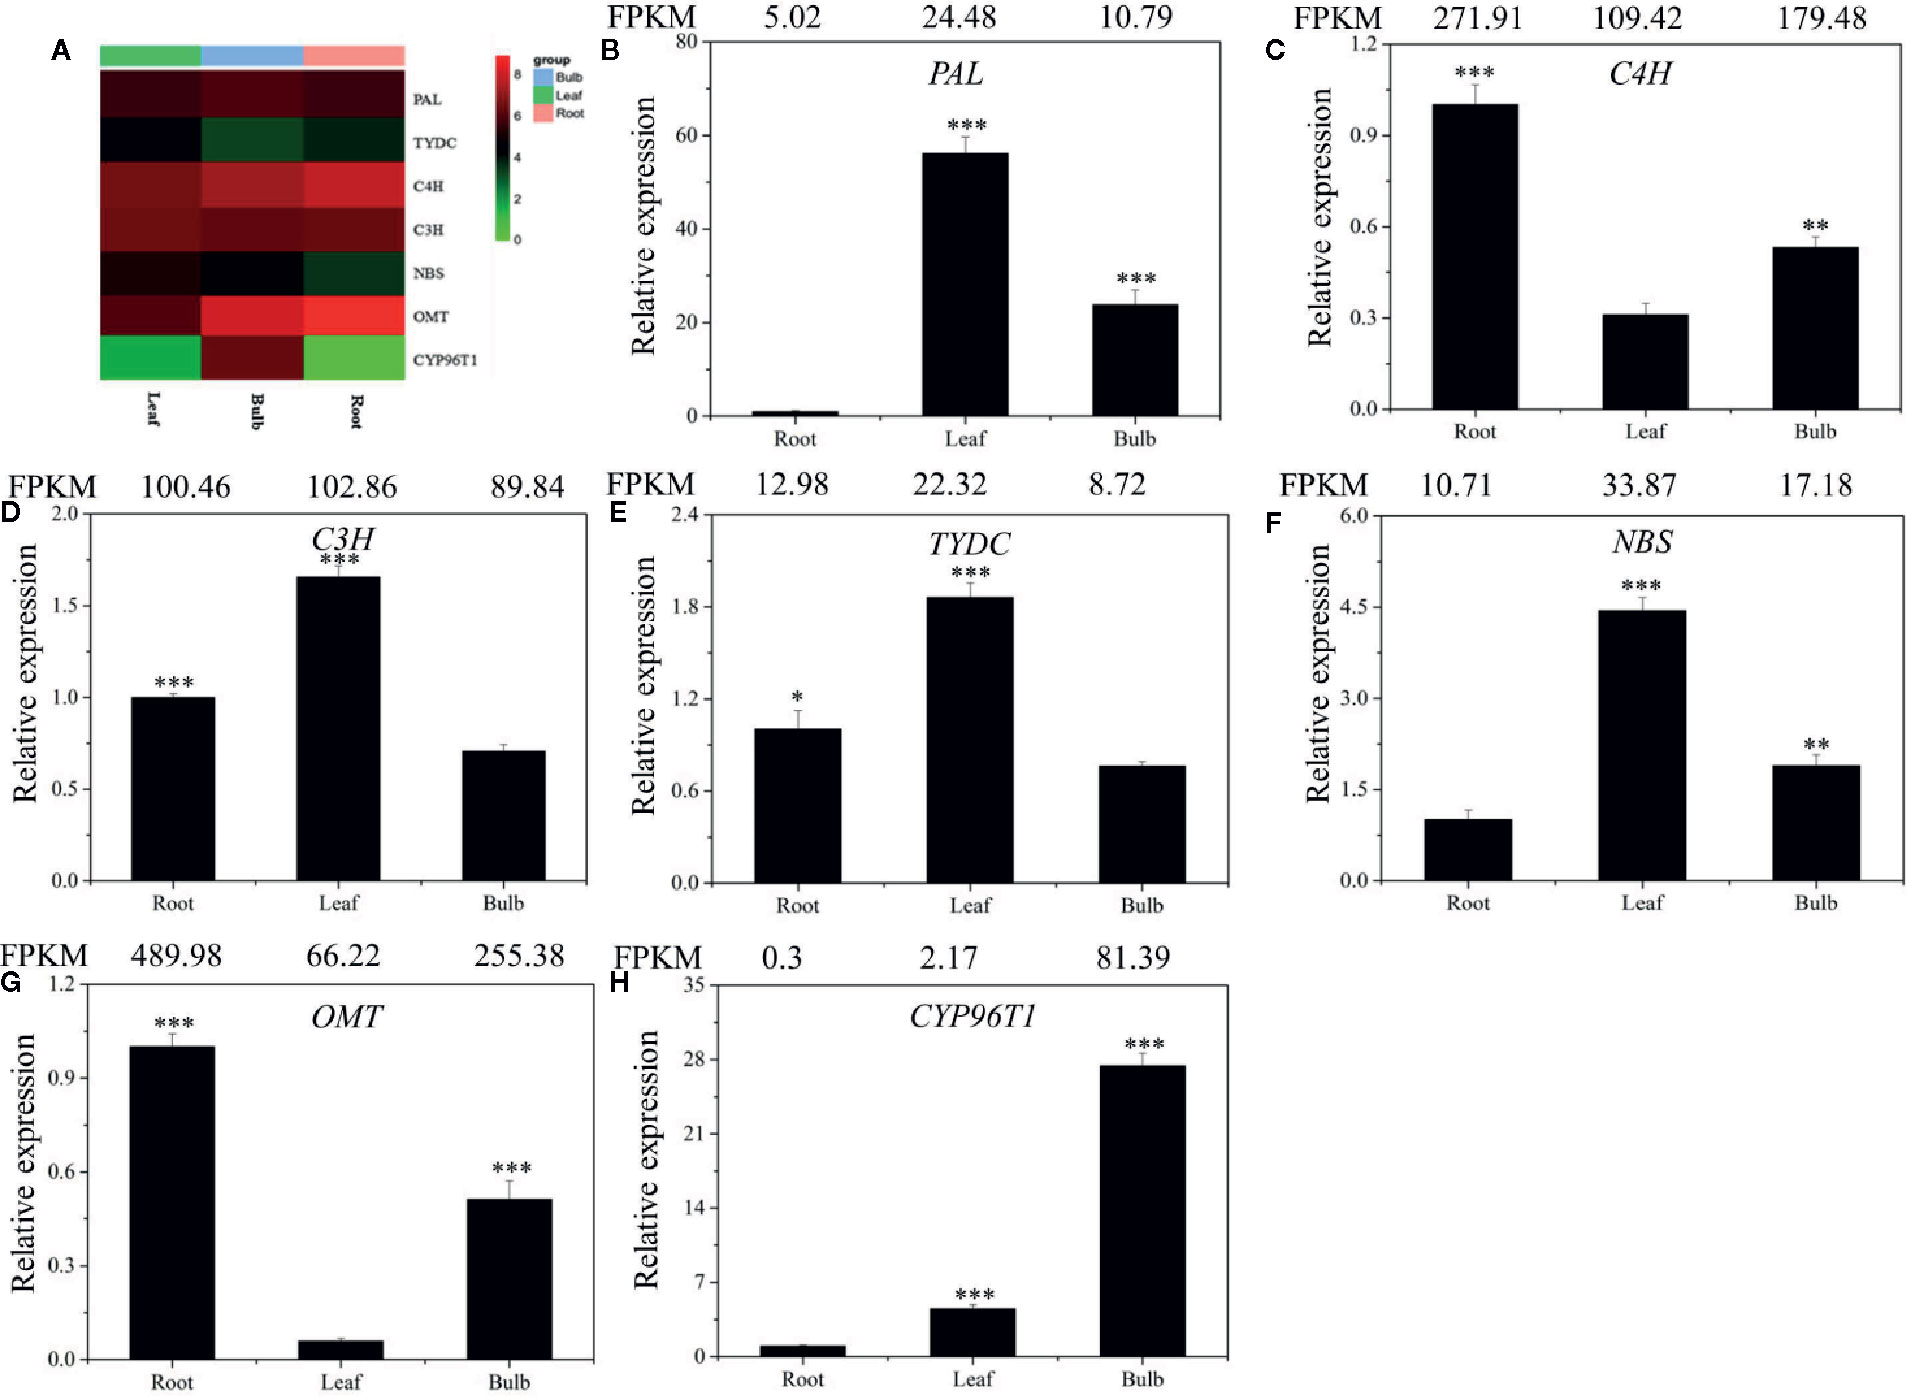
Figure 5 Expression analysis of the DEGs involved in Gal biosynthesis in the different tissues of L. longituba. Heatmap (A) and RT-qPCR analysis of PAL (B), C4H (C), C3H (D), TYDC (E), NBS (F), OMT (G), and CYP96T1 (H). The genes selected for validation were the RNA-Seq data. The bar chart shows the relative expression levels as measured by RT-qPCR values, while the top vertical axis shows the relative RPKM values. Experiments were conducted in triplicate. Error values indicate the standard deviation (SD). C3H, p-coumarate 3-hydroxylase; C4H, Cinnamate 4-hydroxylase; CYP96T1, noroxomaritidine synthase; DEGs, differentially expressed genes; NBS, norbelladine synthase; OMT, norbelladine 4’-O-methyltransferase; PAL, phenylalanine ammonia; RPKM, Reads Per Kilobase per Million mapped reads; RT-qPCR, real-time quantitative polymerase chain reaction; TYDC, tyrosine decarboxylase (N = 3, *P < 0.05, **P < 0.01, ***P < 0.001 by Student’s t-test).
To validate the gene expression profiles across tissues, we performed RT-qPCR analysis. The expression profiles of the seven proposed Gal biosynthetic genes were analyzed in the different plant tissues (B, R, and L) (Figures 5B–H). C4H and OMT showed high expression in R compared to the other tissues. PAL, C3H, TYDC, and NBS were relatively highly expressed in L. CYP96T1 was highly expressed in B compared to the other tissues, which did not correlate with the expression of OMT (Figure 5). The RT-qPCR results matched the FPKM results well. Taken together, these results indicated that the different genes are expressed differently across the tissues.
Cloning and Sequence Analysis of LlOMT
The LlOMT gene was obtained from transcriptome sequencing of L. longituba (GenBank IDMK883815). The open reading frame (ORF) of the LlOMT gene was 720 bp, encoding a protein of 239 amino acids with a molecular weight of approximately 29.17 kDa and an isoelectric point (pI) of 4.87 (Supplementary Figure 8). LlOMT is a conserved homolog of NpN4OMT and LaOMT1 with 91.2% and 98.7% amino acid sequence identity (Supplementary Figure 8A) (Kilgore et al., 2014; Sun et al., 2018). To infer the phylogeny of LlOMT, phylogenetic analysis was conducted with LlOMT homologs from taxonomically diverse plant species using neighbor-joining phylogenetic reconstruction methods. As shown in Supplementary Figure 8B, two distinct clusters of OMT homologs were identified. Like NpN4OMT, LlOMT belongs to the class I OMT group and harbors the same types of functional domains (Supplementary Figure 8).
Subcellular Localization Analysis of LlOMT
To elucidate the subcellular localization of LlOMT, translational fusions with enhanced GFP at the C-terminus that was driven by the CaMV 35S promoter were constructed for evaluating Agrobacterium-mediated infiltration of N. benthamiana leaves. Confocal microscopy revealed the occurrence of the LlOMT-GFP fluorescence signals in the cytoplasm of the mesophyll cells (Figure 6). The GPF vector fluorescent signal was also detected in the cytoplasm of the mesophyll cells (Figure 6).
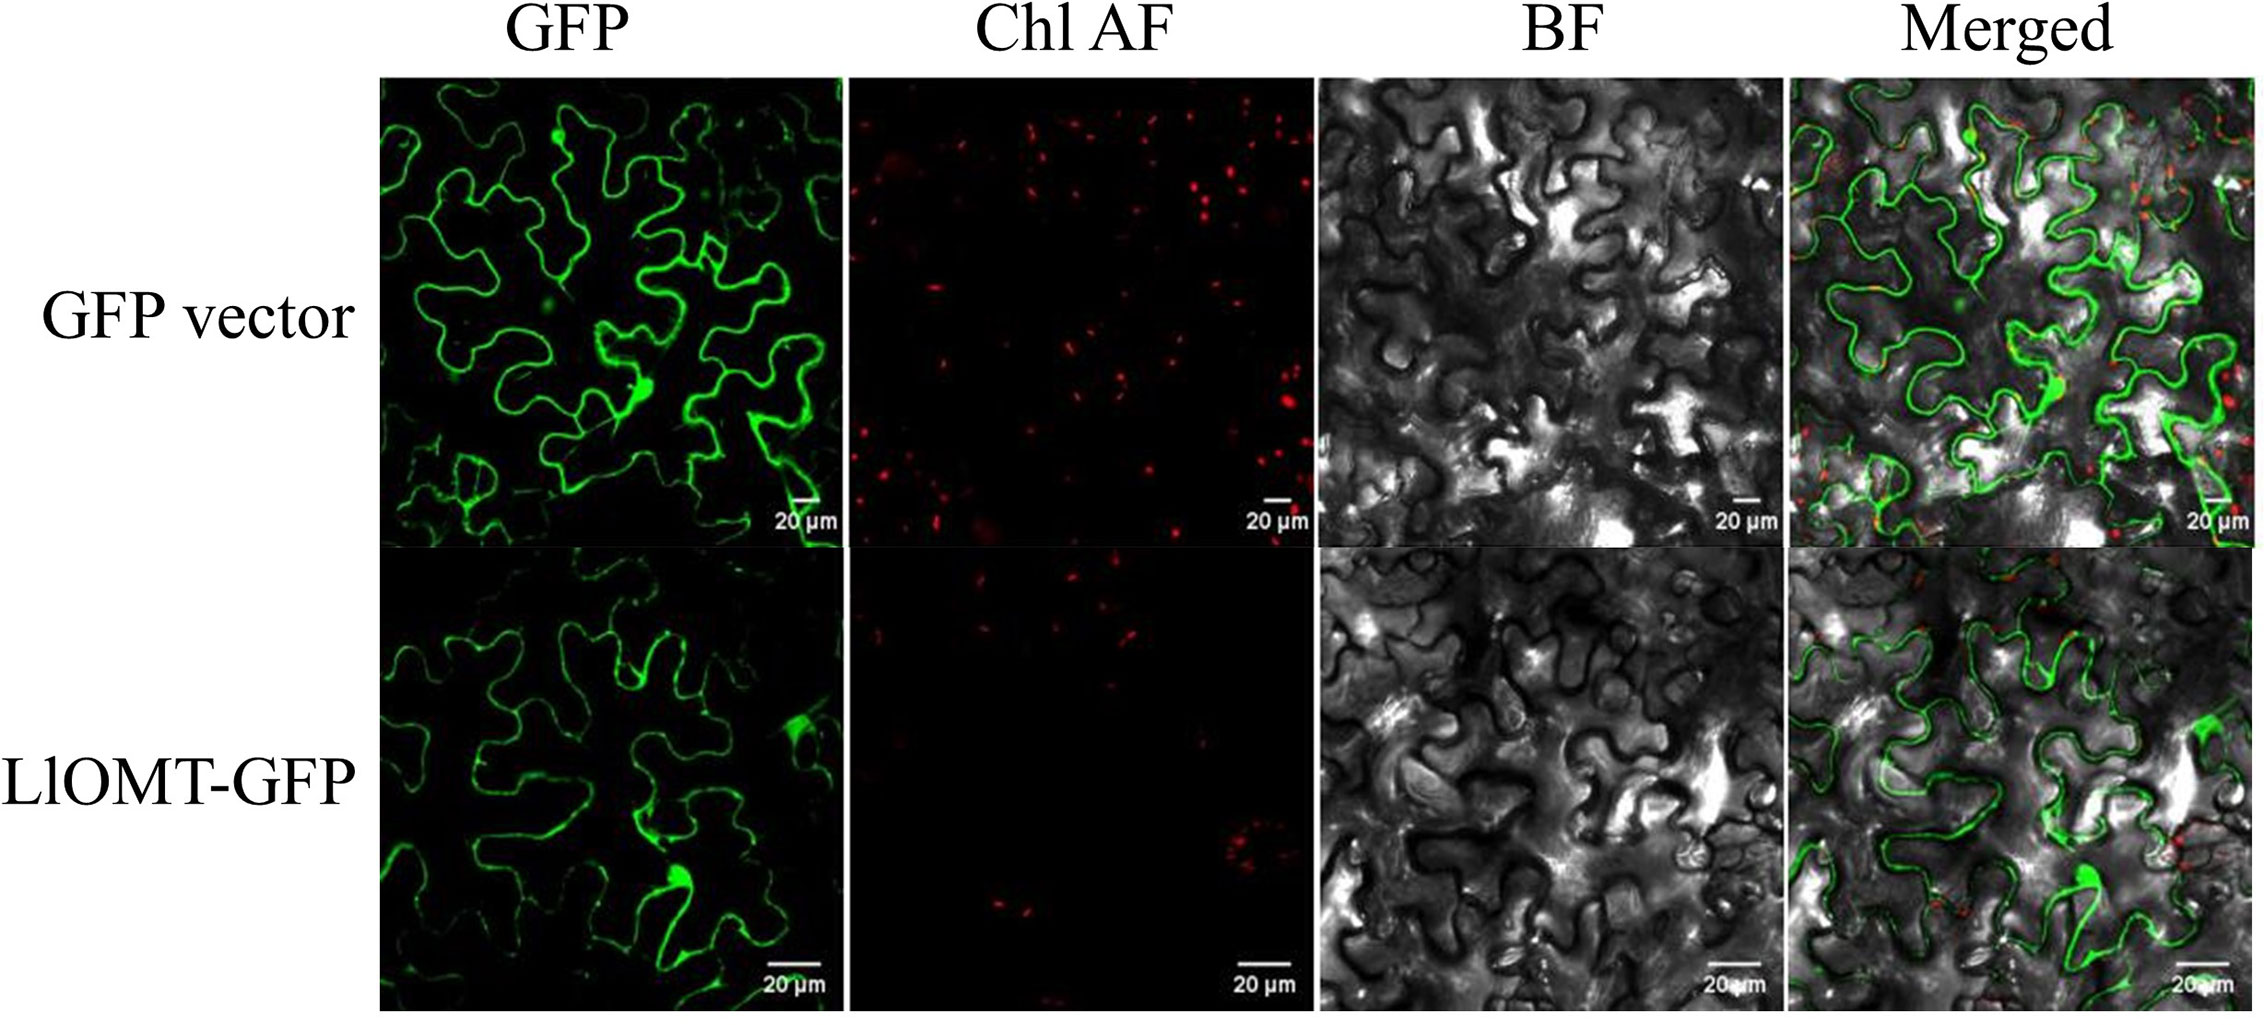
Figure 6 Subcellular localization of LlOMT-GFP fusion proteins transiently expressed in N. benthamiana leaves by Agrobacterium infiltration. Fluorescent signals of the GFP vector and LlOMT-GFP were observed by confocal microscopy. All bars = 20 μm. BF, bright field; Chl AF, chloroplast autofluorescence; GFP, green fluorescent protein; LlOMT, Lycoris longituba O-Methyltransferase (N = 3).
Expression of LlOMT and Gal Content in L. longituba
Gene expression of LlOMT in the different tissues at different stages was first examined by RT-qPCR. LlOMT expression was detected in all tissues of L. longituba, with high levels detected in R and B at the vegetative and reproductive stages (Figure 7). The Gal contents in the different tissues at the vegetative phase were then detected. The results showed that root had the highest Gal content (976.14 μg/g DW), which was significantly higher than other tissues. Gal content in bulb was 263.51 μg/g DW, and leaf tissue had the lowest Gal content (61.63 μg/g DW). The results indicated that Gal mainly accumulated in R, and the Gal content showed a similar pattern with LlOMT expression at the vegetative stage.
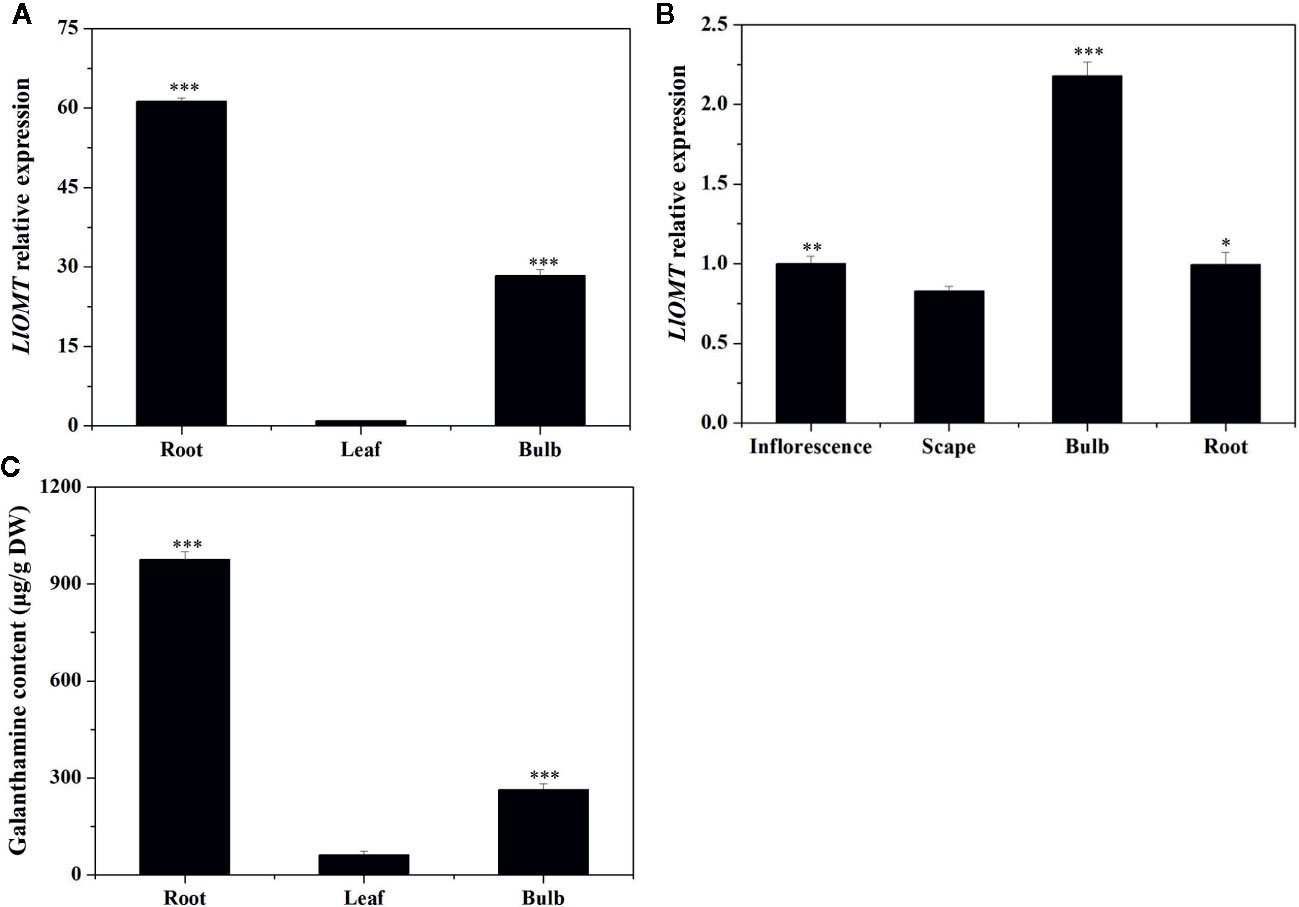
Figure 7 Expression of LlOMT and Gal content in L. longituba. LlOMT gene expression in the different tissues at the vegetative (A) and reproductive (B) phases; (C) Gal content in the different tissues at the vegetative phase. Gal, galanthamine; LlOMT, Lycoris longituba O-Methyltransferase (N = 3, *P < 0.05, **P < 0.01, ***P < 0.001 by Student’s t-test).
LlOMT Enzyme Activity Assays
NpN4OMT and LaOMT1 enzymes play key roles in the galanthamine biosynthesis pathway via the methylation of norbelladine to 4’-O-methylnorbelladine (Kilgore et al., 2014; Sun et al., 2018). Consequently, we also examined whether LlOMT exhibits catalytic activities. LlOMT was expressed as a His-tagged protein in E. coli. Following Ni2+ affinity purification, the recombinant protein was identified as a major band with the expected size of LIOMT (~29 kDa) after SDS-PAGE (Figure 8A). The purified His-tagged LlOMT protein was then tested with norbelladine as a substrate. The reaction assays indicated that 4’-O-methylnorbelladine was detected as a major peak in LC-MS/MS analysis (Figures 8B–D). The LlOMT-catalyzed O-methylation of norbelladine was found to follow the Michaelis and Menten kinetics pattern, the Km and Vmax values for the formation of 4′-O-methylnorbelladine was 317 ± 17 μM and 3.61 ± 0.14 μM min−1, respectively (Supplementary Figure 9 and Supplementary Table 8).
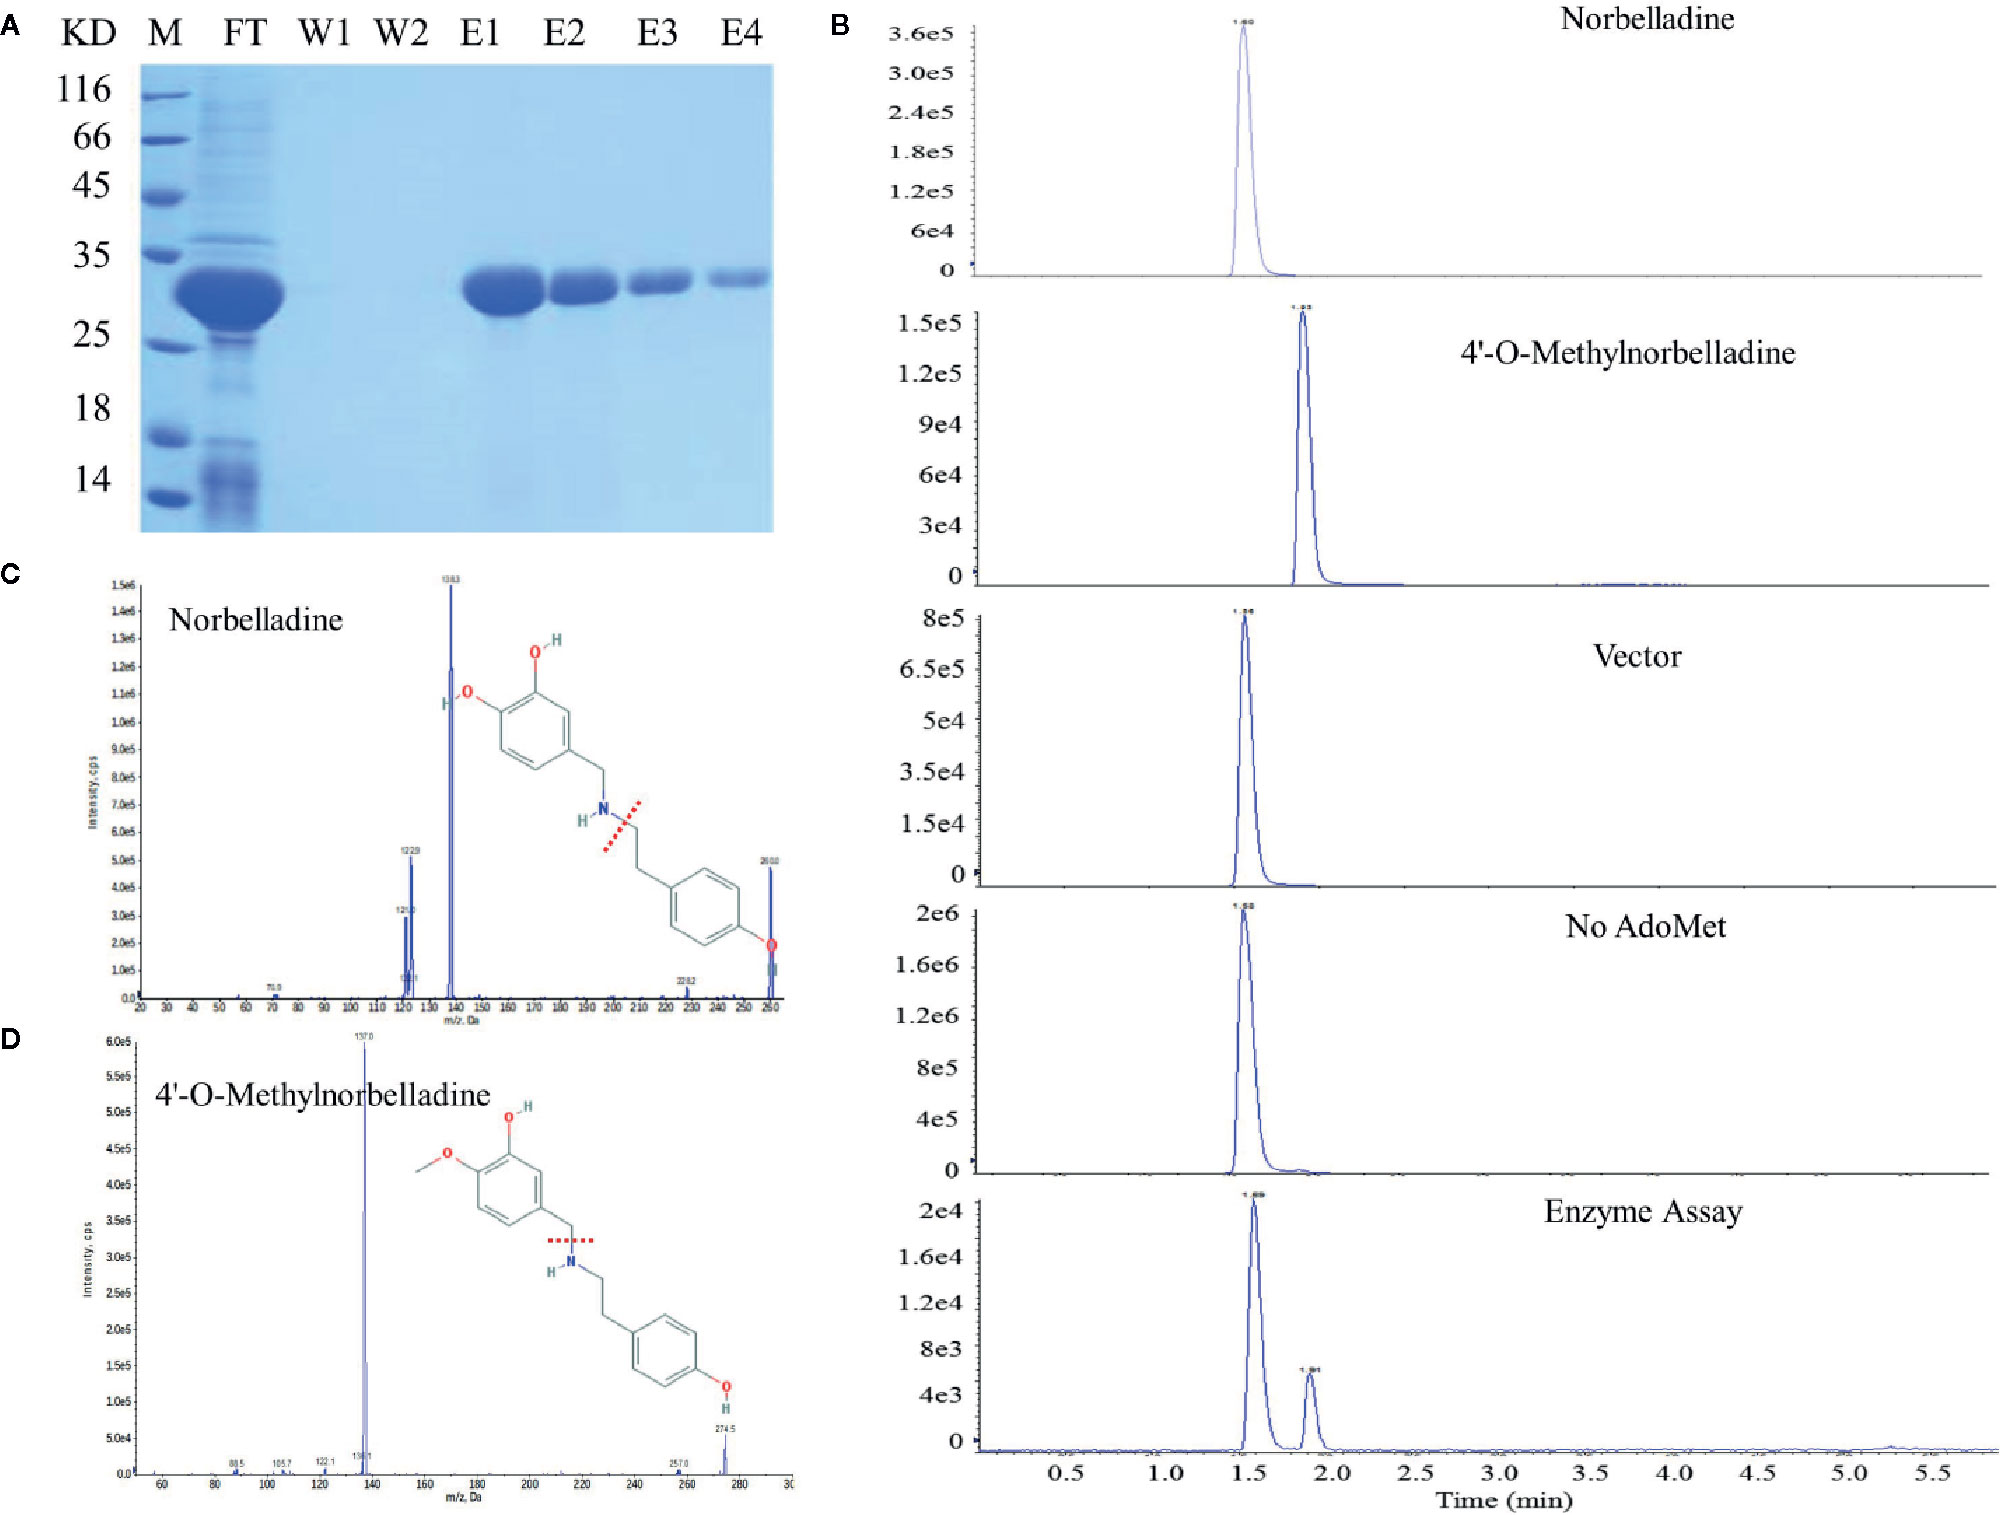
Figure 8 LlOMT enzyme activity assays of recombinant LlOMT. (A) SDS-PAGE gel image of LlOMT expression in E. coli. The recombinant His-tagged protein was purified from the culture lysates by Ni2+ affinity chromatography. FT, column flow-through sample; W1–W2, washing fractions. E1–E4, elution fractions. M, molecular weight marker. (B) LC-MS/MS analysis of the enzyme assay of LlOMT using norbelladine as a substrate. The reaction product 4’-O-methylnorbelladine was detected in an assay using recombinant LlOMT. The identity was confirmed by MS/MS fragmentation of norbelladine (C) and 4’-O-methylnorbelladine (D). LlOMT, Lycoris longituba O-Methyltransferase; SDS-PAGE, sodium salt-polyacrylamide gel electrophoresis (N = 3).
To determine whether overexpressing LlOMT in L. longituba could increase Gal content, we transformed the LlOMT-GFP vector into L. longituba protoplasts using the GFP empty vector as a control. Confocal microscopy revealed the occurrence of the both fluorescence signals in the cytoplasm of the mesophyll cells (Figure 9A). Gal content analysis showed that overexpressing LlOMT could increase the Gal content by 1.45-fold compared with the control (Figure 9B).
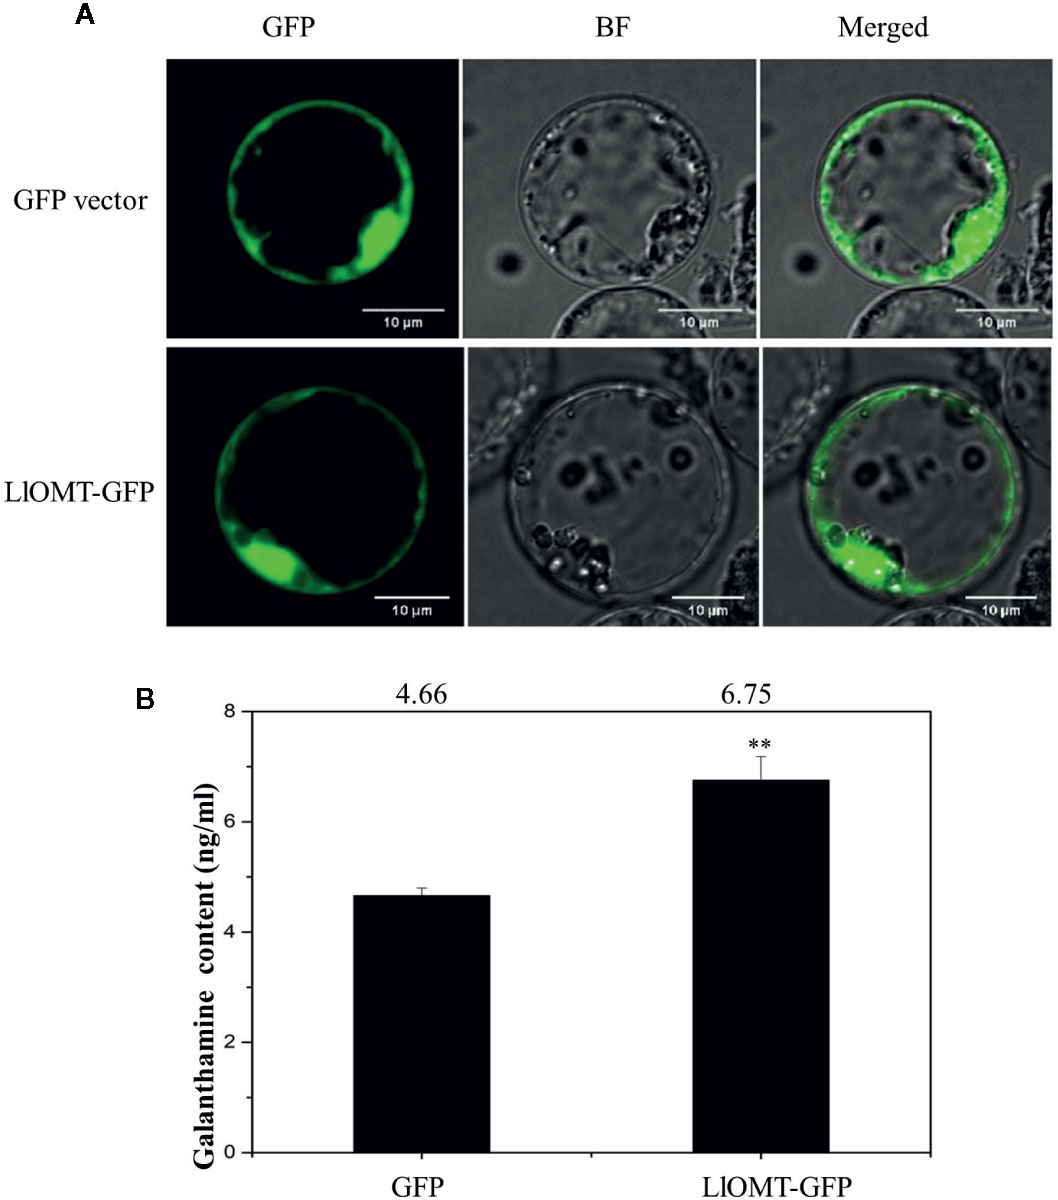
Figure 9 Overexpression of LlOMT in L. longituba protoplasts. Fluorescent signals of the GFP vector and LlOMT-GFP in the protoplast observed by confocal microscopy (A) and the Gal content in the protoplasts overexpressing the GFP vector and LlOMT-GFP (B). Gal, galanthamine; GFP, green fluorescent protein; LlOMT, Lycoris longituba O-Methyltransferase (N = 3, **P < 0.01 by Student’s t-test).
Discussion
The combination of sequencing technology and metabolite profiling has become a powerful tool for candidate genes identifications, and such integrated omics methods have been successfully used in non-model plants. For example, in mayapple, the six missing genes in etoposide aglycone biosynthetic pathways have been successfully characterized through transcriptome sequencing and metabolites analysis (Lau and Sattely, 2015); in Narcissussp. aff. pseudonarcissus, transcriptome sequencing and LC-MS/MS, NMR technology have been used to isolate N4OMT and CYP96T1 genes (Kilgore et al., 2014; Kilgore et al., 2016).
In this study, transcriptome profiling and metabolite analysis of leaves, roots and bulbs of L. longituba were carried out, and 59 Gb of clean data was obtained with approximate 401 million clean reads and a total of 333,440 unigenes (average length 521 bp) were obtained by de novo assembly. Among them, 85,622 unigenes were successfully annotated. Recently, a transcriptome report of this specie was published by using 12 tepals samples at different stages as materials, and a large number of unigenes were also obtained (Yue et al., 2019). Although our study only use nine samples, we focused on diverse tissues including leaves, roots, and bulbs at vegetative growth stages. Our data is also the only transcriptome data including other tissues except the flower of L. longituba currently deposited in GenBank. The number of genes encoding different TF families varies among plant species and they often perform species-, tissue-, or developmental stage-specific function(s) (Smetanska, 2008; Yang et al., 2012; Wang et al., 2017). In this study, 38,347 unigenes encoding putative TFs were found, which could be divided into 58 TF families. Among them, the bHLH, MYB-related and MRKY families had been reported to regulate plant secondary metabolite biosynthesis (Shoji et al., 2010; Kazan and Manners, 2013; Phukan et al., 2016; Wang et al., 2017). These data sets will help us to further identify genes and metabolites in the secondary metabolic pathways. In particular, by comparing gene expression and metabolite accumulation, it is possible to generate a hypothesis for candidate genes involved in a particular biosynthetic pathway, as recently demonstrated by similar approaches (Geu-Flores et al., 2012; Yamazaki et al., 2013; Yonekura-Sakakibara et al., 2013; Enrique et al., 2017; Singh and Desgagné-Penix, 2017).
There are diverse groups of alkaloids in Amaryllidaceae plant family, and many biosynthetic enzymes are waiting to be discovered (Singh and Desgagné-Penix, 2014; He et al., 2015). Galanthamine (Gal) is a typical representative of amaryllidaceae alkaloids which is one of the main drugs for Alzheimer’s disease (Howes and Houghton, 2003; Repantis et al., 2010; Wang et al., 2010). Gal biosynthesis including several types of reactions, such as condensation, hydroxylation, oxidation, reduction, methylation, and phenol-phenol’ coupling (Figure 4; Singh and Desgagné-Penix, 2014). It has been reported that the initial steps of Gal biosynthetic pathway are also parts of phenylpropanoid metabolism (Hahlbrock and Scheel, 1989; Singh and Desgagné-Penix, 2014; Jaini et al., 2017). The catechol portion and non-catechol portion of Gal were derived from L-phenylalanine and L-tyrosine respectively (Barton and Kirby, 1962; Suhadolnik et al., 1962; Sandmeier et al., 1994). Phenylalanine ammonia lyase (PAL), cinnamate-4-hydroxylase (C4H) and coumarate-3-hydroxylase (C3H) were involved in the formation of 3,4-dihydroxybenzaldehyde from L-phenylalanine (Eichhorn et al.,1998). Tyrosine decarboxylase (TYDC) was involved in the formation of tyramine from L-tyrosine (Eichhorn et al.,1998; Takos and Rook, 2013). Recently, LrPAL3 and LrC4H genes were cloned and characterized from Lycoris radiata, which may indicate the involvement of these genes in Gal biosynthesis (Li et al., 2018).
The core biosynthetic pathway of Gal required the formation of 3,4-dihydroxybenzaldehyde and tyramine, then the norbelladine and 4’-O-methylnorbelladine were produced through condensation, reduction, and methylation of the precursors (Kilgore et al., 2014; Kilgore et al., 2016). Recently, a transcriptome report of L. radiata was published by using six samples (two biological replicates) including leaves, roots and bulbs, and candidate genes involved in Gal biosynthesis were predicated without functional characterization (Park et al., 2019). In this work, seven genes which may be involved in the galanthamine metabolic pathway encoding tyrosine decarboxylase (TYDC), phenylalanine ammonia-lyase (PAL), cinnamate 4-hydroxylase (C4H), p-coumarate 3-hydroxylase (C3H), norbelladine synthase (NBS), norbelladine 4’-O-methyltransferase (OMT), and noroxomaritidine synthase (CYP96T1) were detected from the transcriptome data and validated by real-time quantitative PCR analysis (Table 4). The results of RT-qPCR showed that, these genes were differentially expressed in three tissues, and the highest expression level of OMT in roots may explained the highest amounts of Gal in this tissue. Similar relationships between OMT gene expression and Gal content could be observed in N. pseudonarcissus (Kilgore et al., 2014), L. aurea (Sun et al., 2018) and L. radiata (Park et al., 2019). Our results also found that Gal was mainly accumulated in root which was different from the results in L. radiata, L. aurea, and N. pseudonarcissus, among which high amounts of Gal were accumulated in bulb, ovary and bulb, respectively (Kilgore et al., 2014; Sun et al., 2018; Park et al., 2019). Such variations may due to species specificity, growth stages as well as environmental factors (Szakiel et al., 2011; Quan et al., 2012; Petruczynik et al., 2016). Our current study is likely to narrow down the genes involved in this pathway by homology, expression and metabolite analysis. The functional characterizations of these genes will be carried out in the future.
O-methyltransferase catalyzes a methylation reaction by transferring a methyl group from SAM to the acceptor’s hydroxyl group (Ibrahim et al., 1998). The identification of NpN4OMT and LaOMT1 showed that it is responsible for the methylation of norbelladine to 4’-O-methylnorbelladine which is the central intermediate in galanthamine biosynthesis (Kilgore et al., 2014; Singh and Desgagné-Penix, 2014; Sun et al., 2018; Li et al., 2019). In this study, LlOMT gene was identified from L. longituba in the proposed galanthamine biosynthetic pathway. Sequence analysis showed that LlOMT is a class I OMT and showed high protein similarity with NpN4OMT and LaOMT1 (Supplementary Figure 8). Similar with NpN4OMT and LaOMT1, LlOMT is localized in the cytoplasm (Figure 6), and biochemical analysis indicated that the recombinant LlOMT catalyzes norbelladine to generate 4’-O-methylnorbelladine (Figure 8). What’s more, the protoplast transformation result showed that the overexpression of LlOMT could increase the Gal content (Figure 9). Previous works on NpN4OMT1, LaOMT1 and LrOMT suggested different O-methylation preferences and substrate specificities of these proteins, LaOMT1 and LrOMT could form both meta- and para-O-methylated products, while NpN4OMT1 only generated para-O-methylated product (Kilgore et al., 2014; Sun et al., 2018; Li et al., 2019). These differences were speculated to be related with the amino acid differences in catalytic pocket (Li et al., 2019). In the future, substrate scope investigation should be carried out to better understanding the O-methylation type and preference of this protein. The higher expression of LlOMT and the larger concentration of Gal were observed in the root and bulb (Figure 7), suggesting a correlation between Gal accumulation and LlOMT gene expression. Our results indicate that LlOMT may play a role in galanthamine biosynthesis in L. longituba.
Conclusions
Here, the genome size of L. longituba was determined and leaf, root, and bulb transcriptomes were generated from L. longituba for the first time. A very large dataset of transcripts and unigenes was generated, providing a rich genomic database from which to identify genes involved in secondary metabolite pathways. Notably, seven genes involved in the galanthamine biosynthesis pathway were identified in the transcriptomes. Moreover, the LlOMT gene was cloned and functionally characterized in L. longituba for the first time. These valuable gene candidates involved in the biosynthesis of galanthamine could be useful for producing larger quantities of bioactive compounds that are used in medical applications.
Data Availability Statement
The datasets generated for this study can be found in the NCBI Sequence Reads Archive (SRA) with the accession number PRJNA590043.
Author Contributions
QL, YZ, and YC designed the research. QL, JX, LY, and XZ performed the research. QL wrote the paper.
Funding
This work was supported by the National Natural Science Foundation of China (No. 31801889), and by the Shanghai Rising-Star Program, China (No. 20QB1404100), and by the Shanghai plant seedling tissue culture professional technical service platform (No. 18DZ2291400).
Conflict of Interest
The authors declare that the research was conducted in the absence of any commercial or financial relationships that could be construed as a potential conflict of interest.
Acknowledgments
We thank LetPub (www.letpub.com) for its linguistic assistance during the preparation of this manuscript.
Supplementary Material
The Supplementary Material for this article can be found online at: https://www.frontiersin.org/articles/10.3389/fpls.2020.519752/full#supplementary-material
References
Barnes, C. A., Meltzer, J., Houston, F., Orr, G., McGann, K., Wenk, G. L. (2000). Chronic treatment of old rats with donepezil or galantamine: effects on memory, hippocampal plasticity and nicotinic receptors. Neuroscience 99, 17–23. doi: 10.1016/s0306-4522(00)00180-9
Barton, D. H. R., Kirby, G. W. (1962). Phenol oxidation and biosynthesis. part v. the synthesis of galanthamine. J. Chem. Soc. 806, 806–817. doi: 10.1039/jr9620000806. (Resumed).
Berardini, T. Z., Mundodi, S., Reiser, L., Huala, E., Garcia-Hernandez, M., Zhang, P., et al. (2004). Functional annotation of the Arabidopsis genome using controlled vocabularies. Plant Physiol. 135, 745–755. doi: 10.1104/pp.104.040071
Eichhorn, J., Takada, T., Kita, Y., Zenk, M. H. (1998). Biosynthesis of the Amaryllidaceae alkaloid galanthamine. Phytochemistry 49 (4), 1037–1047. doi: 10.1016/S0031-9422(97)01024-8
Enrique, G., García-Villaraco, A., Lucas José, A., Ana, G., Javier, G. M. F., Beatriz, R. S. (2017). Transcriptomics, targeted metabolomics and gene expression of blackberry leaves and fruits indicate flavonoid metabolic flux from leaf to red fruit. Front. Plant Sci. 8, 472. doi: 10.3389/fpls.2017.00472
Galbraith, D. W., Harkins, K. R., Maddox, J. M., Ayres, N. M., Sharma, D. P., Firoozabady, E. (1983). Rapid flow cytometric analysis of the cell cycle in intact plant tissues. Science 220, 1049–1051. doi: 10.1126/science.220.4601.1049
Geu-Flores, F., Sherden, N. H., Courdavault, V., Burlat, V., Glenn, W. S., Wu, C., et al. (2012). An alternative route to cyclic terpenes by reductive cyclization in iridoid biosynthesis. Nature. 492, 138–142. doi: 10.1038/nature11692
Grabherr, M. G., Haas, B. J., Yassour, M., Levin, J. Z., Thompson, D. A., Amit, I., et al. (2011). Full-length transcriptome assembly from RNA-Seq data without a reference genome. Nat. Biotechnol. 29, 644–652. doi: 10.1038/nbt.1883
Guo, Y., Pigni, N. B., Zheng, Y., de Andrade, J. P., Torras-Claveria, L., Borges, S., et al. (2014). Analysis of bioactive Amaryllidaceae alkaloid profiles in Lycoris species by GC-MS. Nat. Prod. Commun. 9, 1081–1086. doi: 10.1002/mnfr.201300861
Hahlbrock, K., Scheel, D. (1989). Physiology and molecular biology of phenylpropanoid metabolism. Annu. Rev. Plant Physiol. Plant Mol. Biol. 40, 347–369. doi: 10.1146/annurev.pp.40.060189.002023
He, M., Qu, C., Gao, O., Hu, X., Hong, X. (2015). Biological and pharmacological activities of amaryllidaceae alkaloids. RSC Adv. 5, 16562–16574. doi: 10.1039/C4RA14666B
Hichri, I., Heppel, S. C., Pillet, J., Léon, C., Czemmel, S., Delrot, S., et al. (2010). The basic helix-loop-helix transcription factor MYC1 is involved in the regulation of the flavonoid biosynthesis pathway in grapevine. Mol. Plant 3, 509–523. doi: 10.1093/mp/ssp118
Howes, M. J. R., Houghton, P. J. (2003). Plants used in chinese and indian traditional medicine for improvement of memory and cognitive function. Pharmacol. Biochem. Behav. 75, 513–527. doi: 10.1016/s0091-3057(03)00128-x
Ibrahim, R. K., Bruneau, A., Bantignies, B. (1998). Plant O-methyltransferases: Molecular analysis, common signature and classification. Plant Mol. Biol. 36, 1–10. doi: 10.1023/A:1005939803300
Jaini, R., Wang, P., Dudareva, N., Chapple, C., Morgan, J. A. (2017). Targeted metabolomics of the phenylpropanoid pathway in Arabidopsis thaliana using reversed phase liquid chromatography coupled with tandem mass spectrometry. Phytochem. Analysis 28, 267–276. doi: 10.1002/pca.2672
Jiang, Y., Xu, S., Han, X., Wang, R., He, J., Xia, B. (2017). Investigation of nuclear DNA contents of lycoris species (Amaryllidaceae) with different chromosome number by flow cytometry. Pak. J. Bot. 49, 2197–2200.
Jin, Z. (2013). Amaryllidaceae and Sceletium alkaloids. Nat. Prod. Rep. 30, 849–868. doi: 10.1039/c3np70005d
Kanehisa, M., Goto, S. (2000). KEGG: Kyoto encyclopedia of genes and genomes. Nucleic Acids Res. 28, 27–30. doi: 10.1093/nar/28.7.e27
Kanehisa, M., Goto, S., Sato, Y., Furumichi, M., Tanabe, M. (2012). KEGG for integration and interpretation of large-scale molecular data sets. Nucleic Acids Res. 40, 109–114. doi: 10.1093/nar/gkr988
Kazan, K., Manners, J. M. (2013). MYC2: the master in action. Mol. Plant 6, 686–703. doi: 10.1093/mp/sss128
Ke, L., Sun, Y., Zheng, Y., Zhang, D. (1998). Karyotype analysis of three species of Lycoris herb. J. Anhui Norm. Univ. 4, 39–42+44 (in Chinese). doi: 10.14182/j.cnki.1001-2443.1998.04.008
Kilgore, M. B., Augustin, M. M., Starks, C. M., O’Neil-Johnson, M., May, G. D., Crow, J. A., et al. (2014). Cloning and characterization of a norbelladine 4’-O-methyltransferase involved in the biosynthesis of the Alzheimer’s drug galanthamine in Narcissus sp. aff. pseudonarcissus. PloS One 9, e103223. doi: 10.1371/journal.pone.0103223
Kilgore, M. B., Augustin, M. M., May, G. D., Crow, J. A., Kutchan, T. M. (2016). CYP96T1 of Narcissus sp. aff. pseudonarcissus Catalyzes Formation of the Para-Para’ C-C Phenol Couple in the Amaryllidaceae Alkaloids. Front. Plant Sci. 7, 1069–1072. doi: 10.3389/fpls.2016.00225
Kornienko, A., Evidente, A. (2008). Chemistry, biology, and medicinal potential of narciclasine and its congeners. Chem. Rev. 108, 1982–2014. doi: 10.1002/chin.200840228
Lau, W., Sattely, E. S. (2015). Six enzymes from mayapple that complete the biosynthetic pathway to the etoposide aglycone. Science. 349, 1224–1228. doi: 10.1126/science.aac7202
Li, Q. Z., Zhang, Y. C., Zheng, Y. H., Yang, L. Y., Cai, Y. M. (2018). Simultaneous determination of three alkaloids in Lycoris spp.by UPLC-QTRAP-MS/MS. J. Instrum. Anal. 37, 211–216. doi: 10.3969/j.issn.1004-4957.2018.02.010. (in Chinese).
Li, W., Yang, Y., Qiao, C., Zhang, G., Luo, Y. (2018). Functional characterization of phenylalanine ammonia-lyase- and cinnamate 4-hydroxylase-encoding genes from Lycoris radiata, a galanthamine-producing plant. Int. J. Biol. Macromol. 117, 1264–1279. doi: 10.1016/j.ijbiomac.2018.06.046
Li, W., Qiao, C., Pang, J., Zhang, G., Luo, Y. (2019). The versatile o-methyltransferaseLrOMT catalyzes multiple o-methylation reactions in amaryllidaceae alkaloids biosynthesis. Int. J. Biol. Macromol. 141, 680–692. doi: 10.1016/j.ijbiomac.2019.09.011
Liu, H., Li, Q., Yang, F., Zhu, F., Sun, Y., Tao, Y., et al. (2016). Differential regulation of protochlorophyllide oxidoreductase abundances by VIRESCENT 5A (OsV5A) and VIRESCENT 5B (OsV5B) in rice seedlings. Plant Cell Physiol. 57, 2392–2402. doi: 10.1093/pcp/pcw151
Liu, J., Hu, W. X., He, L. F., Ye, M., Li, Y. (2004). Effects of lycorine on hl-60 cells via arresting cell cycle and inducing apoptosis. Febs Letters 578 (3), 245–250. doi: 10.1016/j.febslet.2004.10.095
Mascher, M., Gundlach, H., Himmelbach, A., Beier, S., Twardziok, S. O., Wicker, T., et al. (2017). A chromosome conformation capture ordered sequence of the barley genome. Nature 544, 427–433. doi: 10.1038/nature22043
Mayer, K., Waugh, R., Langridge, P., Close, T., Wise, R., Graner, A., et al. (2012). A physical, genetic and functional sequence assembly of the barley genome. Nature 491, 711–716. doi: 10.1038/nature11543
Mortazavi, A., Williams, B. A., McCue, K., Schaeffffer, L., Wold, B. (2008). Mapping and quantifying mammalian transcriptomes by RNA-Seq. Nat. Methods 5, 621–628. doi: 10.1038/nmeth.1226
Park, J. S., Kim, J. B., Cho, K. J., Cheon, C., II, Sung, M. K., Choung, M. G., et al. (2008). Arabidopsis R2R3-MYB transcription factor AtMYB60 functions as a transcriptional repressor of anthocyanin biosynthesis in lettuce (Lactuca sativa). Plant Cell Rep. 27, 985–994. doi: 10.1007/s00299-008-0521-1
Park, C. H., Yeo, H. J., Park, Y. E., Baek, S. A., Park, S. U. (2019). Transcriptome analysis and metabolic profiling of lycoris radiata. Biology 8 (3), 63. doi: 10.3390/biology8030063
Pellegrino, S., Meyer, M., Zorbas, C., Bouchta, S. A., Saraf, K., Pelly, S. C., et al. (2018). The amaryllidaceae alkaloid haemanthamine binds the eukaryotic ribosome to repress cancer cell growth. Structure 26, 416–425. doi: 10.1016/j.str.2018.01.009
Petruczynik, A., Misiurek, J., Tuzimski, T., Uszyński, R., Szymczak, G., Chernetskyy, M., et al. (2016). Comparison of different HPLC systems for analysis of galantamine and lycorine in various species of Amaryllidaceae family. J. Liq. Chromatogr. Relat. Technol. 39, 574–579. doi: 10.1080/10826076.2016.1204615
Phukan, U. J., Jeena, G. S., Shukla, R. K. (2016). WRKY transcription factors:molecular regulation and stress responses in plants. Front. Plant Sci. 7, 760. doi: 10.3389/fpls.2016.00760
Quan, M., Ou, L., She, C., Wu, X., Chen, D., Lu, J. (2012). Photosynthetic characteristics of Lycoris aurea and monthly dynamics of alkaloid contents in its bulbs. Afr. J. Biotechnol. 11, 3686–3691. doi: 10.5897/AJB11.3265
Repantis, D., Laisney, O., Heuser, I. (2010). Acetylcholinesterase inhibitors and memantine for neuroenhancement in healthy individuals: A systematic review. Pharmacol. Res. 61, 473–481. doi: 10.1016/j.phrs.2010.02.009
Sandmeier, E., Hale, T., II, Christen, P. (1994). Multiple evolutionary origin of pyridoxal-5′-phosphate-dependent amino acid decarboxylases. FEBS J. 221, 997–1002. doi: 10.1111/j.1432-1033.1994.tb18816.x
Schmittgen, T. D., Livak, K. J. (2008). Analyzing real-time PCR data by the comparative CT method. Nat. Protoc. 3, 1101–1108. doi: 10.1038/nprot.2008.73
Shoji, T., Kajikawa, M., Hashimoto, T. (2010). Clustered transcription factor genes regulate nicotine biosynthesis in tobacco. Plant Cell. 22, 3390–3409. doi: 10.1105/tpc.110.078543
Singh, A., Desgagné-Penix, I. (2014). Biosynthesis of the Amaryllidaceae alkaloids. Plant Sci. Today 1, 114–120. doi: 10.14719/pst.2014.1.3.41
Singh, A., Desgagné-Penix, I. (2017). Transcriptome and metabolome profiling of Narcissus pseudonarcissus ‘King Alfred’ reveal components of Amaryllidaceae alkaloid metabolism. Sci. Rep. 7, 17356. doi: 10.1038/s41598-017-17724-0
Smetanska, I. (2008). Production of secondary metabolites using plant cell cultures. Adv. Biochem. Eng. Biotechnol. 111, 187–228. doi: 10.1007/10_2008_103
Suhadolnik, R. J., Fischer, A. G., Zulalian, J. (1962). The biogenic origin of the C6-C1 unit of lycorine. J. Am. Chem. Soc 84, 4348–4349. doi: 10.1021/ja00881a032
Sun, B., Wang, P., Wang, R., Li, Y., Xu, S. (2018). Molecular cloning and characterization of a meta/para-o-methyltransferase from lycoris aurea. Int. J. Mol. Sci. 19, 1911. doi: 10.3390/ijms19071911
Szakiel, A., P ˛aczkowski, C., Henry, M. (2011). Influence of environmental abiotic factors on the content of saponins in plants. Phytochem. Rev. 10, 471–491. doi: 10.1007/s11101-010-9177-x
Takos, A. M., Rook, F. (2013). Towards a molecular understanding of the biosynthesis of amaryllidaceae alkaloids in support of their expanding medical use. Int. J. Mol. Sci. 14, 11713–11741. doi: 10.3390/ijms140611713
Wang, L. K., Feng, Z. X., Wang, X., Wang, X. W., Zhang, X. G. (2009). DEGseq: An R package for identifying differentially expressed genes from RNA-seq data. Bioinformatics 26, 136–138. doi: 10.1093/bioinformatics/btp612
Wang, Y., Huang, L., Tang, X., Zhang, H. (2010). Retrospect and prospect of active principle from Chinese herbs in the treatment of dementia. Acta Pharm. Sin. 31, 649–664. doi: 10.1038/aps.2010.46
Wang, R., Xu, S., Wang, N., Xia, B., Jiang, Y., Wang, R. (2017). Transcriptome analysis of secondary metabolism pathway, transcription factors, and transporters in response to methyl jasmonate in Lycoris aurea. Front. Plant Sci. 7, 1971. doi: 10.3389/fpls.2016.01971
Wu, Z., Chen, Y., Feng, X., Xia, B. (2008). Pharmacological study on alkaloids of Amaryllidaceae medicinal plants. Chin. Wild Plant Res. 27, 26–31. doi: 10.3969/j.issn.1006-9690.2008.05.007. (in Chinese).
Xie, Q., Liu, Z., Meir, S., Rogachev, I., Aharoni, A., Klee, H. J., et al. (2016). Altered metabolite accumulation in tomato fruits by coexpressing a feedback-insensitive AroG and the PhODO1 MYB-type transcription factor. Plant Biotechnol. J. 14 (12), 2300–2309. doi: 10.1111/pbi.12583
Yamazaki, M., Mochida, K., Asano, T., Nakabayashi, R., Chiba, M., Udomson, N., et al. (2013). Coupling deep transcriptome analysis with untargeted metabolic profiling in ophiorrhiza pumila to further the understanding of the biosynthesis of the anti-cancer alkaloid camptothecin and anthraquinones. Plant Cell Physiol. 54, 686–696. doi: 10.1093/pcp/pct040
Yang, C. Q., Fang, X., Wu, X. M., Mao, Y. B., Wang, L. J., Chen, X. Y. (2012). Transcriptional regulation of plant secondary metabolism. J. Integr. Plant Biol. 54, 703–712. doi: 10.1111/j.1744-7909.2012.01161.x
Yin, J., Li, X., Zhan, Y., Li, Y., Qu, Z., Sun, L., et al. (2017). Cloning and expression of BpMYC4 and BpbHLH9 genes and the role of BpbHLH9 in triterpenoid synthesis in birch. BMC Plant Biol. 17, 214. doi: 10.1186/s12870-017-1150-z
Yonekura-Sakakibara, K., Fukushima, A., Saito, K. (2013). Transcriptome data modeling for targeted plant metabolic engineering. Curr. Opin. Biotech. 24, 285–290. doi: 10.1016/j.copbio.2012.10.018
Yu, H., Guo, W., Yang, D., Hou, Z., Liang, Z. (2018). Transcriptional profiles of SmWRKY family genes and their putative roles in the biosynthesis of tanshinone and phenolic acids in Salvia miltiorrhiza. Int. J. Mol. Sci. 19, 1593. doi: 10.3390/ijms19061593
Keywords: Lycoris longituba, galanthamine biosynthesis, transcriptomics, O-methyltransferase, functional characterization
Citation: Li Q, Xu J, Yang L, Zhou X, Cai Y and Zhang Y (2020) Transcriptome Analysis of Different Tissues Reveals Key Genes Associated With Galanthamine Biosynthesis in Lycoris longituba. Front. Plant Sci. 11:519752. doi: 10.3389/fpls.2020.519752
Received: 13 December 2019; Accepted: 01 September 2020;
Published: 16 September 2020.
Edited by:
Goetz Hensel, Heinrich Heine University Düsseldorf, GermanyReviewed by:
Ren Wang, Jiangsu Province and Chinese Academy of Sciences, ChinaVasil Georgiev Georgiev, Bulgarian Academy of Sciences, Bulgaria
Matthew Kilgore, Donald Danforth Plant Science Center, United States
Copyright © 2020 Li, Xu, Yang, Zhou, Cai and Zhang. This is an open-access article distributed under the terms of the Creative Commons Attribution License (CC BY). The use, distribution or reproduction in other forums is permitted, provided the original author(s) and the copyright owner(s) are credited and that the original publication in this journal is cited, in accordance with accepted academic practice. No use, distribution or reproduction is permitted which does not comply with these terms.
*Correspondence: Youming Cai, c2Fhc2N5bTFAMTYzLmNvbQ==; Yongchun Zhang, c2Fhc2Zsb3dlcmJ1bGJAMTYzLmNvbQ==