Abstract
The accuracy of nitrogen (N) diagnosis is essential to improve N use efficiency. The standard critical N concentration (standard Nc) dilution curves, an expression of the dynamics of N uptake and dry matter accumulation in plants, are widely used to diagnose the N status of crops. Several standard Nc dilution curves were proposed and validated for several crops, based on experiments involving different N fertilizer treatments. However, standard Nc dilution curves are affected by crop water status, e.g., resulting from differences in irrigation management. This paper aimed at developing a N diagnostic model under the coupling effect of irrigation and fertilizer managements. For this purpose, Nc dilution curves were developed under different irrigation rates. Additionally, plant water content (PWC), leaf water content (LWC), leaf area index (LAI), equivalent water thickness (EWT), and leaf area duration (LAD) were introduced into the model, to construct a modified Nc (mNc) dilution curve. The mNc dilution curves were designed using the principle of hierarchical linear model (HLM), introducing aboveground dry biomass (AGB) as the first layer of information, whereas the second layer of information included the different agronomic variables (PWC, LWC, LAI, EWT, and LAD). The results showed that parameters “a” and “b” of the standard Nc dilution curves ranged from 5.17 to 6.52 and −0.69 to −0.38 respectively. Parameter “a” was easily affected by different management conditions. The performance of standard Nc dilution models obtained by the cross-validation method was worse than that of mNc dilution models. The Nc dilution curve based on 4 years of data was described by the negative power equation Nc = 5.05 × AGB–0.47, with R2 and nRMSE of 0.63 and 0.21, respectively. The mNc dilution curve considers different treatments and was represented by the equation mNc = a×AGB−b, where a = 2.09 × PWC + 3.24, b = −0.02 × LAI + 0.51, with R2 and nRMSE of 0.79 and 0.13, respectively. For winter wheat, C3 crop, there would be a few problems in using standard Nc dilution methods to guide field management, however, this study provides a reliable method for constructing mNc dilution curves under different water and N fertilizer management. Due to the significant differences in hereditary, CO2 fixation efficiency and N metabolism pathways for C3 and C4 crops, the construction of mNc dilution curve suitable for different N response mechanisms will be conducive to the sustainable N management in crop plants.
Introduction
Nitrogen (N) is the element used in the largest quantity, as chemical fertilizer in agricultural production, causing environmental concerns worldwide (Reis et al., 2016). China is the largest user of N fertilizers in the world (FAO, 2015). Over-application of N fertilizers not only wastes tremendous resources, but also threatens the health of the environment (Wei et al., 2018). Rapid and accurate diagnosis of the N status of crops is needed to improve its management and achieve sustainable agricultural development goals in China and worldwide, given the usually low efficiency of use of this element in most cropping systems (Cassman, 1999). How to improve the accurately of nitrogen diagnosis is one of the keys to alleviating the environmental problems caused by an unreasonable N use.
The standard critical N (standard Nc) dilution curve has been widely used to diagnose the N status of crops (Justes et al., 1994; Lemaire and Meynard, 1997). The standard Nc is defined as the minimum N concentration required to achieve maximum growth at a certain aboveground dry biomass (AGB) accumulation, which is expressed as Nc = a × AGB–b, where the parameter “a” represents standard Nc for per 1 Mg AGB ha–1, and parameter “b” is a statistical parameter governing the slope of the relationship (Lemaire and Meynard, 1997). Different approaches, in addition to the original one based on AGB (Nc-AGB) (Justes et al., 1994), have been developed to derive the standard Nc dilution curve, e.g., using the development stages (Nc-stage) (Zhao et al., 2014), or the leaf area index (LAI) (Ata-Ul-Karim et al., 2014b). As a practical tool for N status diagnosis, the N Nutrition Index (NNI) was proposed, based on the standard Nc model (Lemaire and Meynard, 1997) and has become widely used on a range of different crops (Dordas, 2011; Caviglia et al., 2014; Huang et al., 2015). The NNI, as established using agronomic data or remote sensing data, has been applied to diagnose N status, recommend appropriate N fertilizer inputs, predict the grain protein content, and estimate yields (Xue and Yang, 2008; Gaju et al., 2014; Qu et al., 2017). The standard Nc dilution model for winter wheat was first established by Justes et al. (1994) and has been extensively applied in many studies. However, the standard Nc dilution model is strongly influenced by climate, topography, and agronomic management in different regions (Ziadi et al., 2010; Yue et al., 2012; Huang et al., 2018). Besides, the shape of the standard Nc dilution curve is determined by allometric relationships between N concentration and structural growth and metabolism, which could vary across genotypes. Greenwood et al. (1990) established independent standard Nc dilution models for species with different carbon cycles. One model was for C3 species (Nc = 5.7AGB–0.5: tall fescue, lucerne, potato, wheat, rape, and cabbage) and another was for C4 plants (Nc = 4.1 × AGB–0.5: sorghum and maize). Dry matter partitioning among different plant organs affects the shape of the standard Nc curve (Kage et al., 2002). Therefore the introduction of correction factors taking into account these effects has been proposed (Ratjen and Kage, 2016). Previous models have taken into account differences in Nc dilution curves based on stem biomass, leaf biomass, LAI, and spike biomass, although differences due to environmental factors, such as crop water availability have been less investigated (Ata-Ul-Karim et al., 2014a, b; Yao et al., 2014; Zhao et al., 2016). Errecart et al. (2014) have shown that the critical N dilution curve for tall fescue in water deficit conditions was lower than the critical curve in irrigated conditions. Their conclusions postulated that water limited plants should have an intrinsic lower critical N concentration (for a similar biomass) than well-watered plants. More recently, Kunrath et al. (2018) analyzed more deeply N-water interactions for tall fescue and alfalfa by using N dilution curves. They concluded that (i) water deficit had a strong effect on both mineral N availability for grass and N biological fixation for alfalfa; (ii) the reduction of water transpiration efficiency of both grass and legume crop was strictly proportional the reduction of their N status; and (iii) the ratio N uptake/transpiration was a relevant estimator of the effect of water-N interactions.
Practically, the effect of irrigation and fertilization on standard Nc dilution curves was considered by constructing a piecewise Nc model under different irrigation conditions (Rong and Nong, 2017). Pandey et al. (2000) analyzed water deficit effects on shoot growth, N uptake and water extraction with varying level of N supply. Their results showed that crops differ in their ability to maintain AGB at different levels of water deficit and N supply. Therefore, it seems worth considering the effect of water status on the standard Nc dilution curve if different irrigation regimes are used. Irrigation not only affects the availability of soil nitrogen, but also affects N uptake, transport, and assimilation. Insufficient water supply limits the efficient use of N, whereas excessive water supply results in N leaching, increased N loss, and reduced crop yields. Numerous studies have shown that the interacting effect of water and N is a complex problem that affects crop growth and development (Wang et al., 2015, 2018). Adequate N supply is essential to utilize the benefits of additional water from rainfall and irrigation. Conversely, adequate water supply is required to use the benefits of N fertilization. The parameters “a” and “b,” defined above, are therefore affected by both irrigation and N rates. A significant issue is how to modify the standard Nc dilution curve, in order to include the information on water status, e.g., considering irrigation volumes.
The hierarchical linear model (HLM) has been introduced for the analysis of hierarchically structured data. It is a statistically sound methodology with regression models that explicitly take into account variability at different levels (Kuo et al., 2000; Chakraborty et al., 2018). The model provides an analytical method that resolves the complex interactions of nesting in social, economic, and environmental contexts (Hebblewhite and Merrill, 2008). Li et al. (2020) used the HLM model to determine the protein content of grain under diverse environmental conditions and obtained a higher accuracy than linear regression models.
Leaf or stem water potential (ψ) (Meron et al., 1987), crop water stress index (CWSI) (Idso et al., 1981), relative leaf water content (Bowman, 1989; Hunt and Rock, 1989; Ceccato et al., 2001) and other indicators are often used to characterize water deficit status of plants. Pre-dawn or midday leaf water potential measurements have been widely used to assess plant water status (Meron et al., 1987; Donovan et al., 2001), but they are incredibly impractical. There has been much interest in the CWSI as a potential tool for water stress monitoring from remote platforms (Cohen et al., 2005; Veysi et al., 2017). However, it requires thermal infrared data, which are typically acquired at a lower resolution than optical data. On the other hand, leaf (LWC) or plant water content (PWC) can be obtained more easily from optical remote sensing platforms (Ceccato et al., 2001).
Our objectives in this study were: (i) to investigate the effects of different irrigation treatments on the standard Nc dilution model for winter wheat, (ii) to construct modified Nc (mNc) dilution models that include different agronomic variables, i.e., PWC, LWC, LAI, equivalent water thickness (EWT), and leaf area duration (LAD), as correction factors; (iii) to validate the standard Nc dilution model and the newly proposed mNc dilution models using independent data.
Materials and Methods
Experimental Design
Experiments were carried out during the 2013 to 2016 growing seasons at the Xiaotangshan Experimental site (40°11′31″∼40°11′18″N, 116°26′10″∼117°27′05″E) in Beijing, China. The soil was classified as heavy loam (FAO, 2015) with 15.3∼19.1 mg kg–1 organic matter, 8.21 ∼ 41.71 mg kg–1 nitrate-N, 0.45 ∼ 8.20 mg kg–1 ammonium-N, 60.58 ∼ 109.61 mg kg–1 available potassium, and 3.14 ∼ 21.18 mg kg–1 available phosphorus at 0 ∼ 30 cm soil depth. Precipitation data were obtained from the European Center for Medium-Range Weather Forecasts (ECMWF)1 (Figure 1). The ERA-Interim data at 0.125° resolution has been proved to be reliable and applied to the prediction of crop production (Poli et al., 2010; Xu et al., 2020).
FIGURE 1
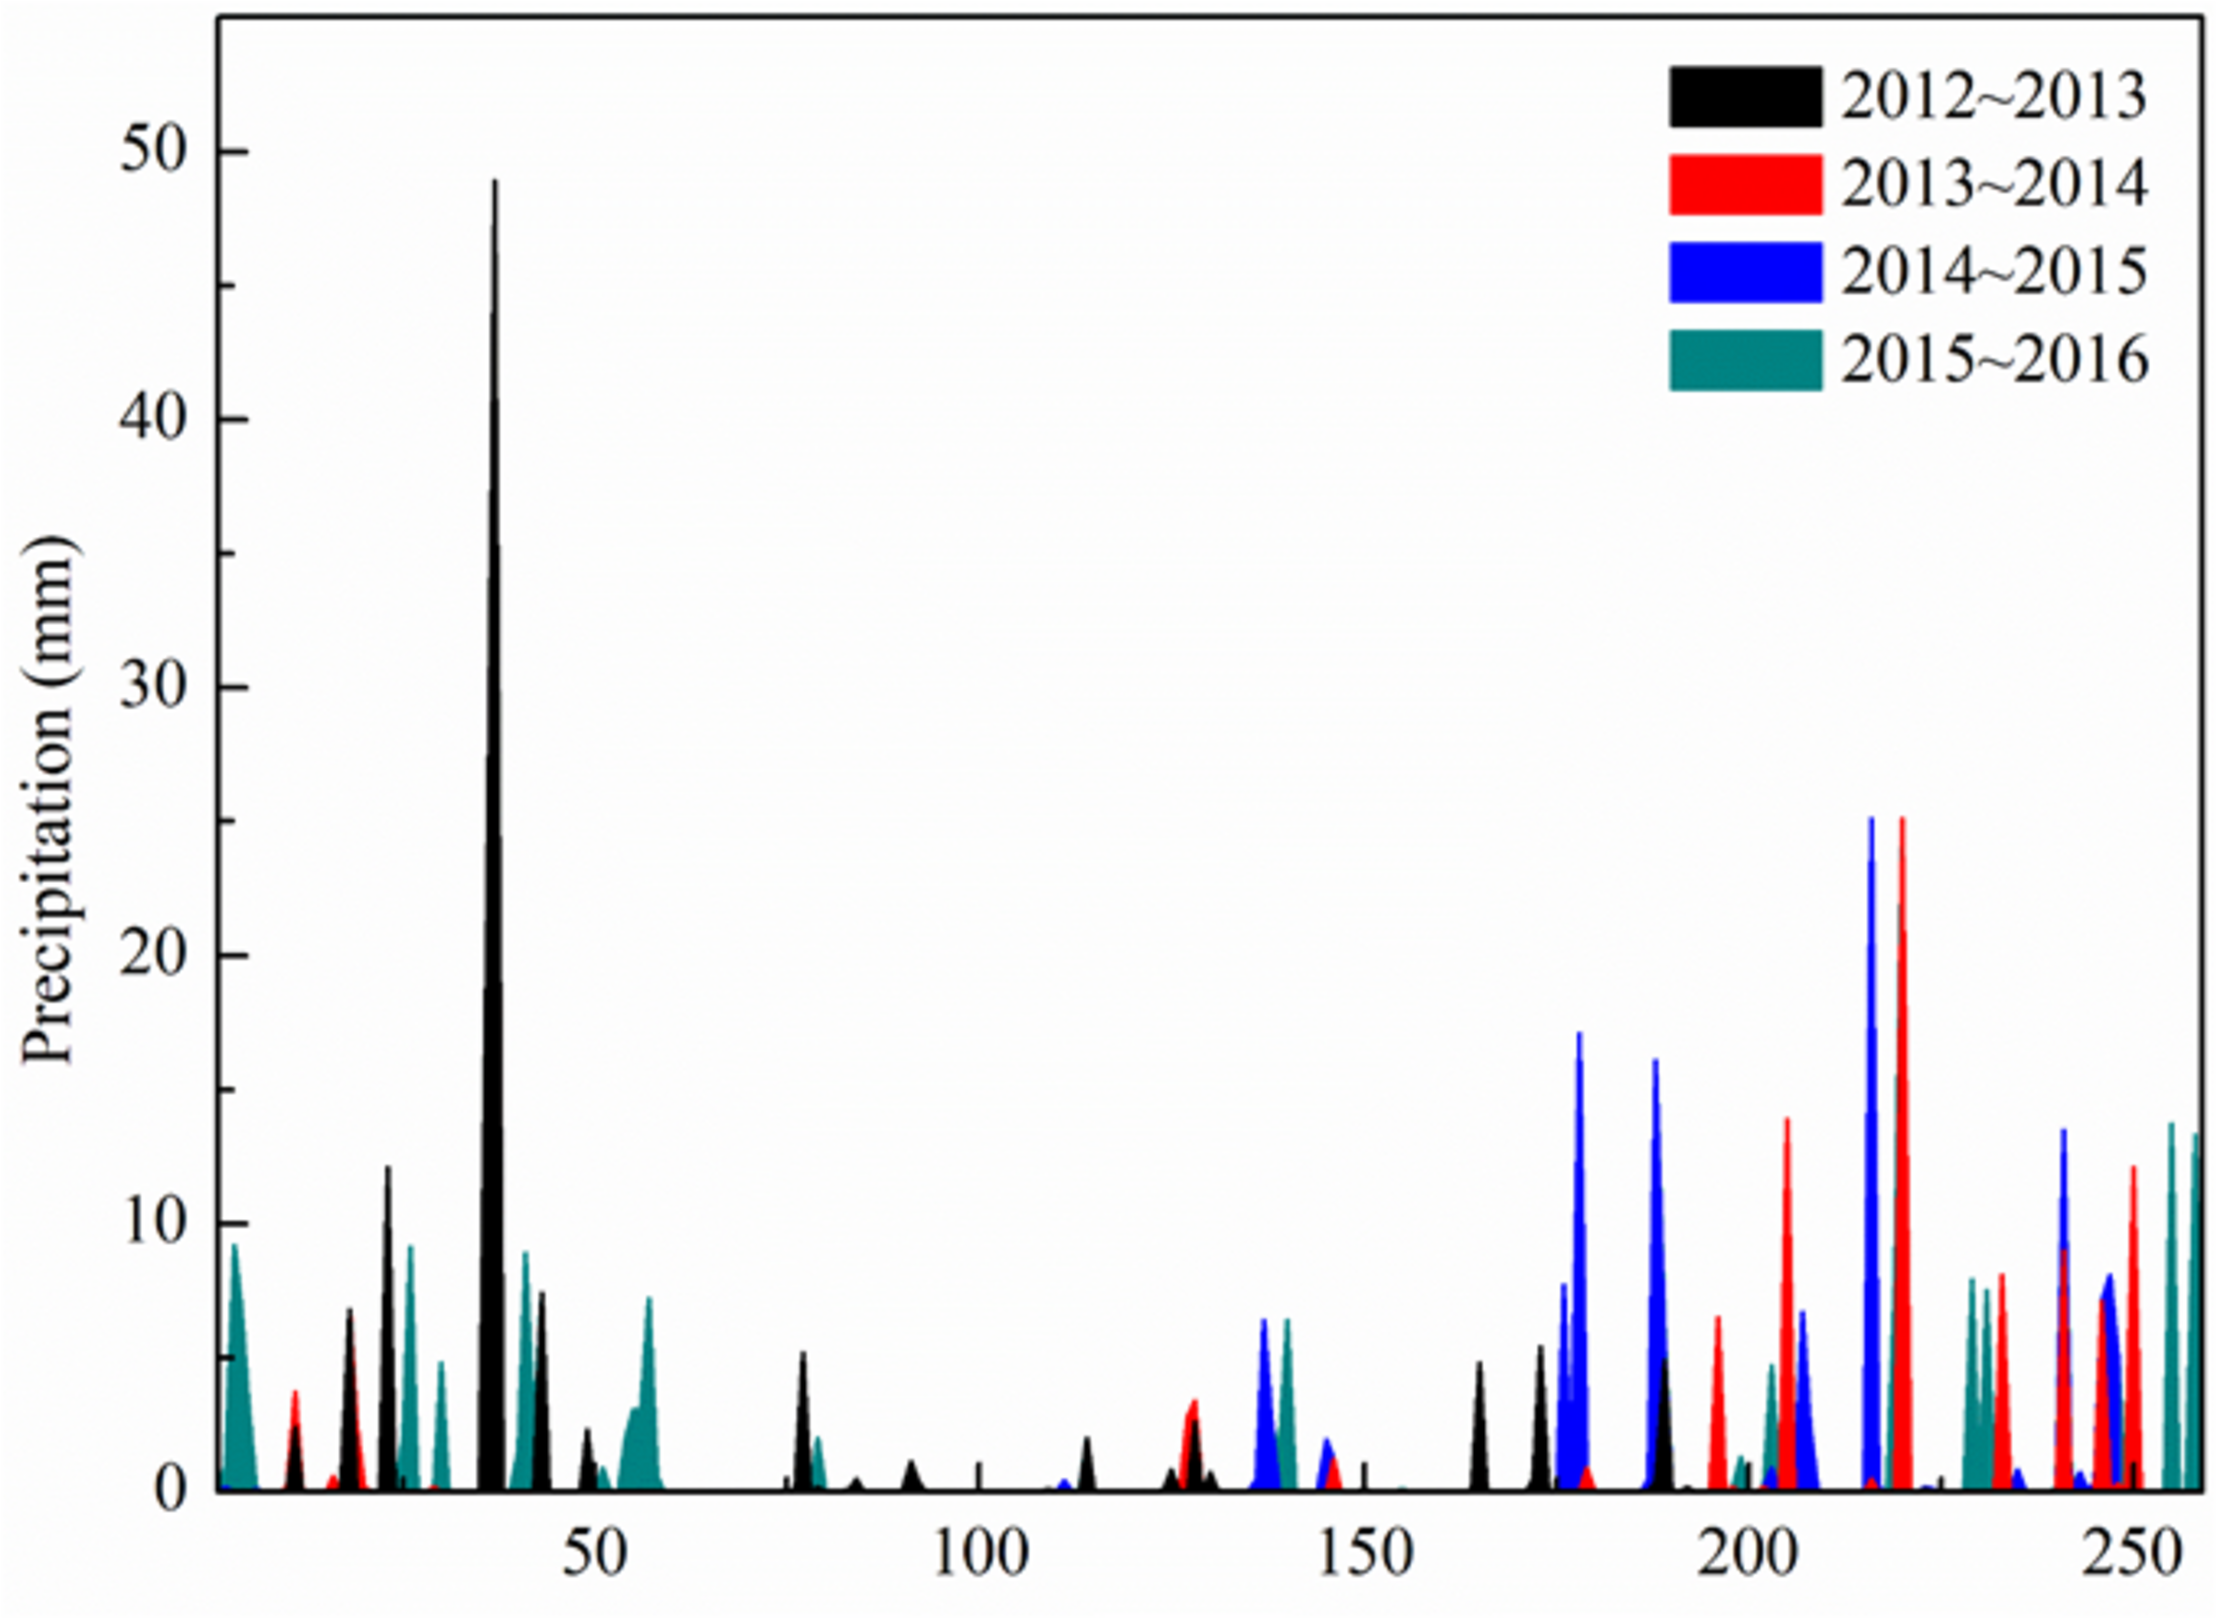
Precipitation at the experimental site during each growing season.
Data were obtained from four winter wheat growing seasons, as summarized in Table 1. Experiment 1 was conducted during the 2012 ∼ 2013 growing season, using a randomized complete block design with two replicates of two factors: N fertilizer and wheat verities [Nongda211(P1), Zhongmai 175 (P2), Jing9843 (P3) and Zhongyou 206(P4)]. The N fertilizer treatments in experiment 1 were as follows: (i) 0 kg N ha–1 (N1); (ii) 110 kg N ha–1 (N2); (iii) 220 kg N ha–1 (N3), and (iv) 440 kg N ha–1 (N4). Experiments 2 and 3 were conducted during the 2013 ∼ 2014 and 2014 ∼ 2015 growing seasons, using an orthogonal design of L16(34), with three replicates and testing three factors: N fertilizer rates, wheat varieties, and irrigation rates. The N fertilizer treatments were as follows: (i) 0 kg N ha–1 (N1); (ii) 90 kg N ha–1 (N2); (iii) 180 kg N ha–1 (N3), and (iv) 270 kg N ha–1 (N4). Irrigation rates in experiment 2 were 0 mm (W0), 146 mm (W1), and 292 mm (W2). Irrigation rates in experiment 3 included 0 mm (W0), 192 mm (W1), and 384 mm (W2). Experiment 4 was conducted during the 2015 ∼ 2016 growing season, using a randomized complete block design with three replicates. N fertilizer was applied with the following rates: (i) 0 kg N ha–1 (N1), (ii) 90 kg N ha–1 (N2), (iii) 180 kg N ha–1 (N3), and (iv) 270 kg N ha–1 (N4). Wheat varieties included Lunxuan 167 and Jingdong 18. Fertilizers included urea (46% of N), superphosphate (12% of P2O5), and potassium sulfate (50% of KCl). The N fertilizer was applied in two splits for all experiments: 50% as a basal application before sowing and 50% at the jointing stage. For all treatments, sufficient P (45 kg P2O5 ha–1) and K (75 kg KCl ha–1) fertilizers were incorporated into the soil before sowing. Plot designs for the different growing seasons are inconsistent with Xu et al. (2020).
TABLE 1
| Experimenta | Season | Sowing date | Sampling period | Zadoks stage | No.a |
| Exp1 | 2012 ∼ 2013 | 27th September | Jointing Booting Anthesis Filling |
31 47 65 75 |
48 48 48 48 |
| Exp2 | 2013 ∼ 2014 | 4th October | Jointing Booting Anthesis Filling |
31 45 65 75 |
48 48 48 48 |
| Exp3 | 2014 ∼ 2015 | 7th October | Jointing Booting Anthesis Filling |
31 47 65 75 |
48 48 48 48 |
| Exp4 | 2015 ∼ 2016 | 27th September | Jointing Booting Anthesis Filling |
31 47 65 75 |
24 24 24 24 |
Experimental field information of each growing season.
a Exp and No. represent the experiment code (see text) and the number of samples, respectively.
Plant Sampling and Analysis
Twenty tillers of winter wheat plants per experimental plot were randomly sampled at jointing, booting, anthesis and filling stages, i.e., respectively, Zadoks stage (ZS) 31, 47, 65, 75 (Zadoks et al., 1974), to determine AGB, PNC, PWC, LWC, LAI, EWT, and LAD. The number of samples collected in each experiment is reported in Table 1. The wheat samples collected were sealed in a plastic bag. Upon returning from the field, leaves and stems were separated and weighed. Samples were then packed in paper bags, green-killed for 30 min at 105°C, and dried at 80°C to a constant weight. Fresh AGB and dry AGB were calculated according to the number of winter wheat stems per unit area during each growth period. The formula for calculating PWC and LWC was as follows:
Where AGBfresh, AGB, AGBl–fresh, and AGBl represent the fresh plant aboveground biomass, aboveground dry biomass, fresh leaf biomass and dry leaf biomass, respectively.
The N content of leaves, stems, and spikes were determined using the standard Kjeldahl method. PNC was calculated using the following formula:
Where Nl, Ns, and Np represent leaf N concentration, stem N concentration, and panicles N concentration, respectively. AGBl, AGBs, and AGBp represent dry leaf biomass, dry stem biomass, and dry panicles biomass, respectively.
Leaf area was measured with a laser leaf area meter (CI-203, CID Inc., Camas, WA, United States), and the calculation formula of LAI is as follows:
Where LAm, n, T, and A represent the leaf area of collected wheat, the number of collected tillers, the number of tillers in the survey area and the size of the survey area, respectively.
The calculation formula of leaf EWT and LAD is as follows:
Where T and LAI represent time and leaf area index.
Critical N (Nc) Concentration Dilution Curve
Standard Nc Model
With the standard Nc dilution curve approach, it is essential to determine standard Nc points at which N fertilizer neither limits plant growth nor enhances it. We used the same computational procedures followed by Justes et al. (1994). A standard Nc point was determined as follows: (a) the AGB and PNC under different applied N rates were compared through the least significant difference test (LSD) at the 95% level of significance (SPSS Inc., Chicago. IL, United States). The N-limiting treatment was defined as a treatment in which an additional N fertilizer application led to a statistically significant increase in the AGB. The non-N-limiting treatment was identified as a treatment in which an additional N fertilizer application did not lead to a significant increase in the AGB, but resulted in a significant increase in the PNC. The AGB and PNC were used to determine whether N treatments limited crop growth. A simple linear regression was utilized to fit data from the N-limiting treatments. For each sampling period, a critical point was defined as follows: (a) the data of AGB and PNC were used to identify if a N treatment limited the growth of the crop; (b) a simple linear regression was used to fit data from the N-limiting treatments (the oblique line); (c) The maximum AGB was calculated with data from the non-N-limiting treatments as the average of the observed data (the vertical line); (d) the Nc point corresponded to the ordinate of the intersection point of the oblique and vertical lines. Figure 2 is a schematic diagram of standard Nc point selection procedure. The Nc points were then fitted using a power regression equation to construct the standard Nc curve. The standard Nc dilution curve is calculated as:
FIGURE 2
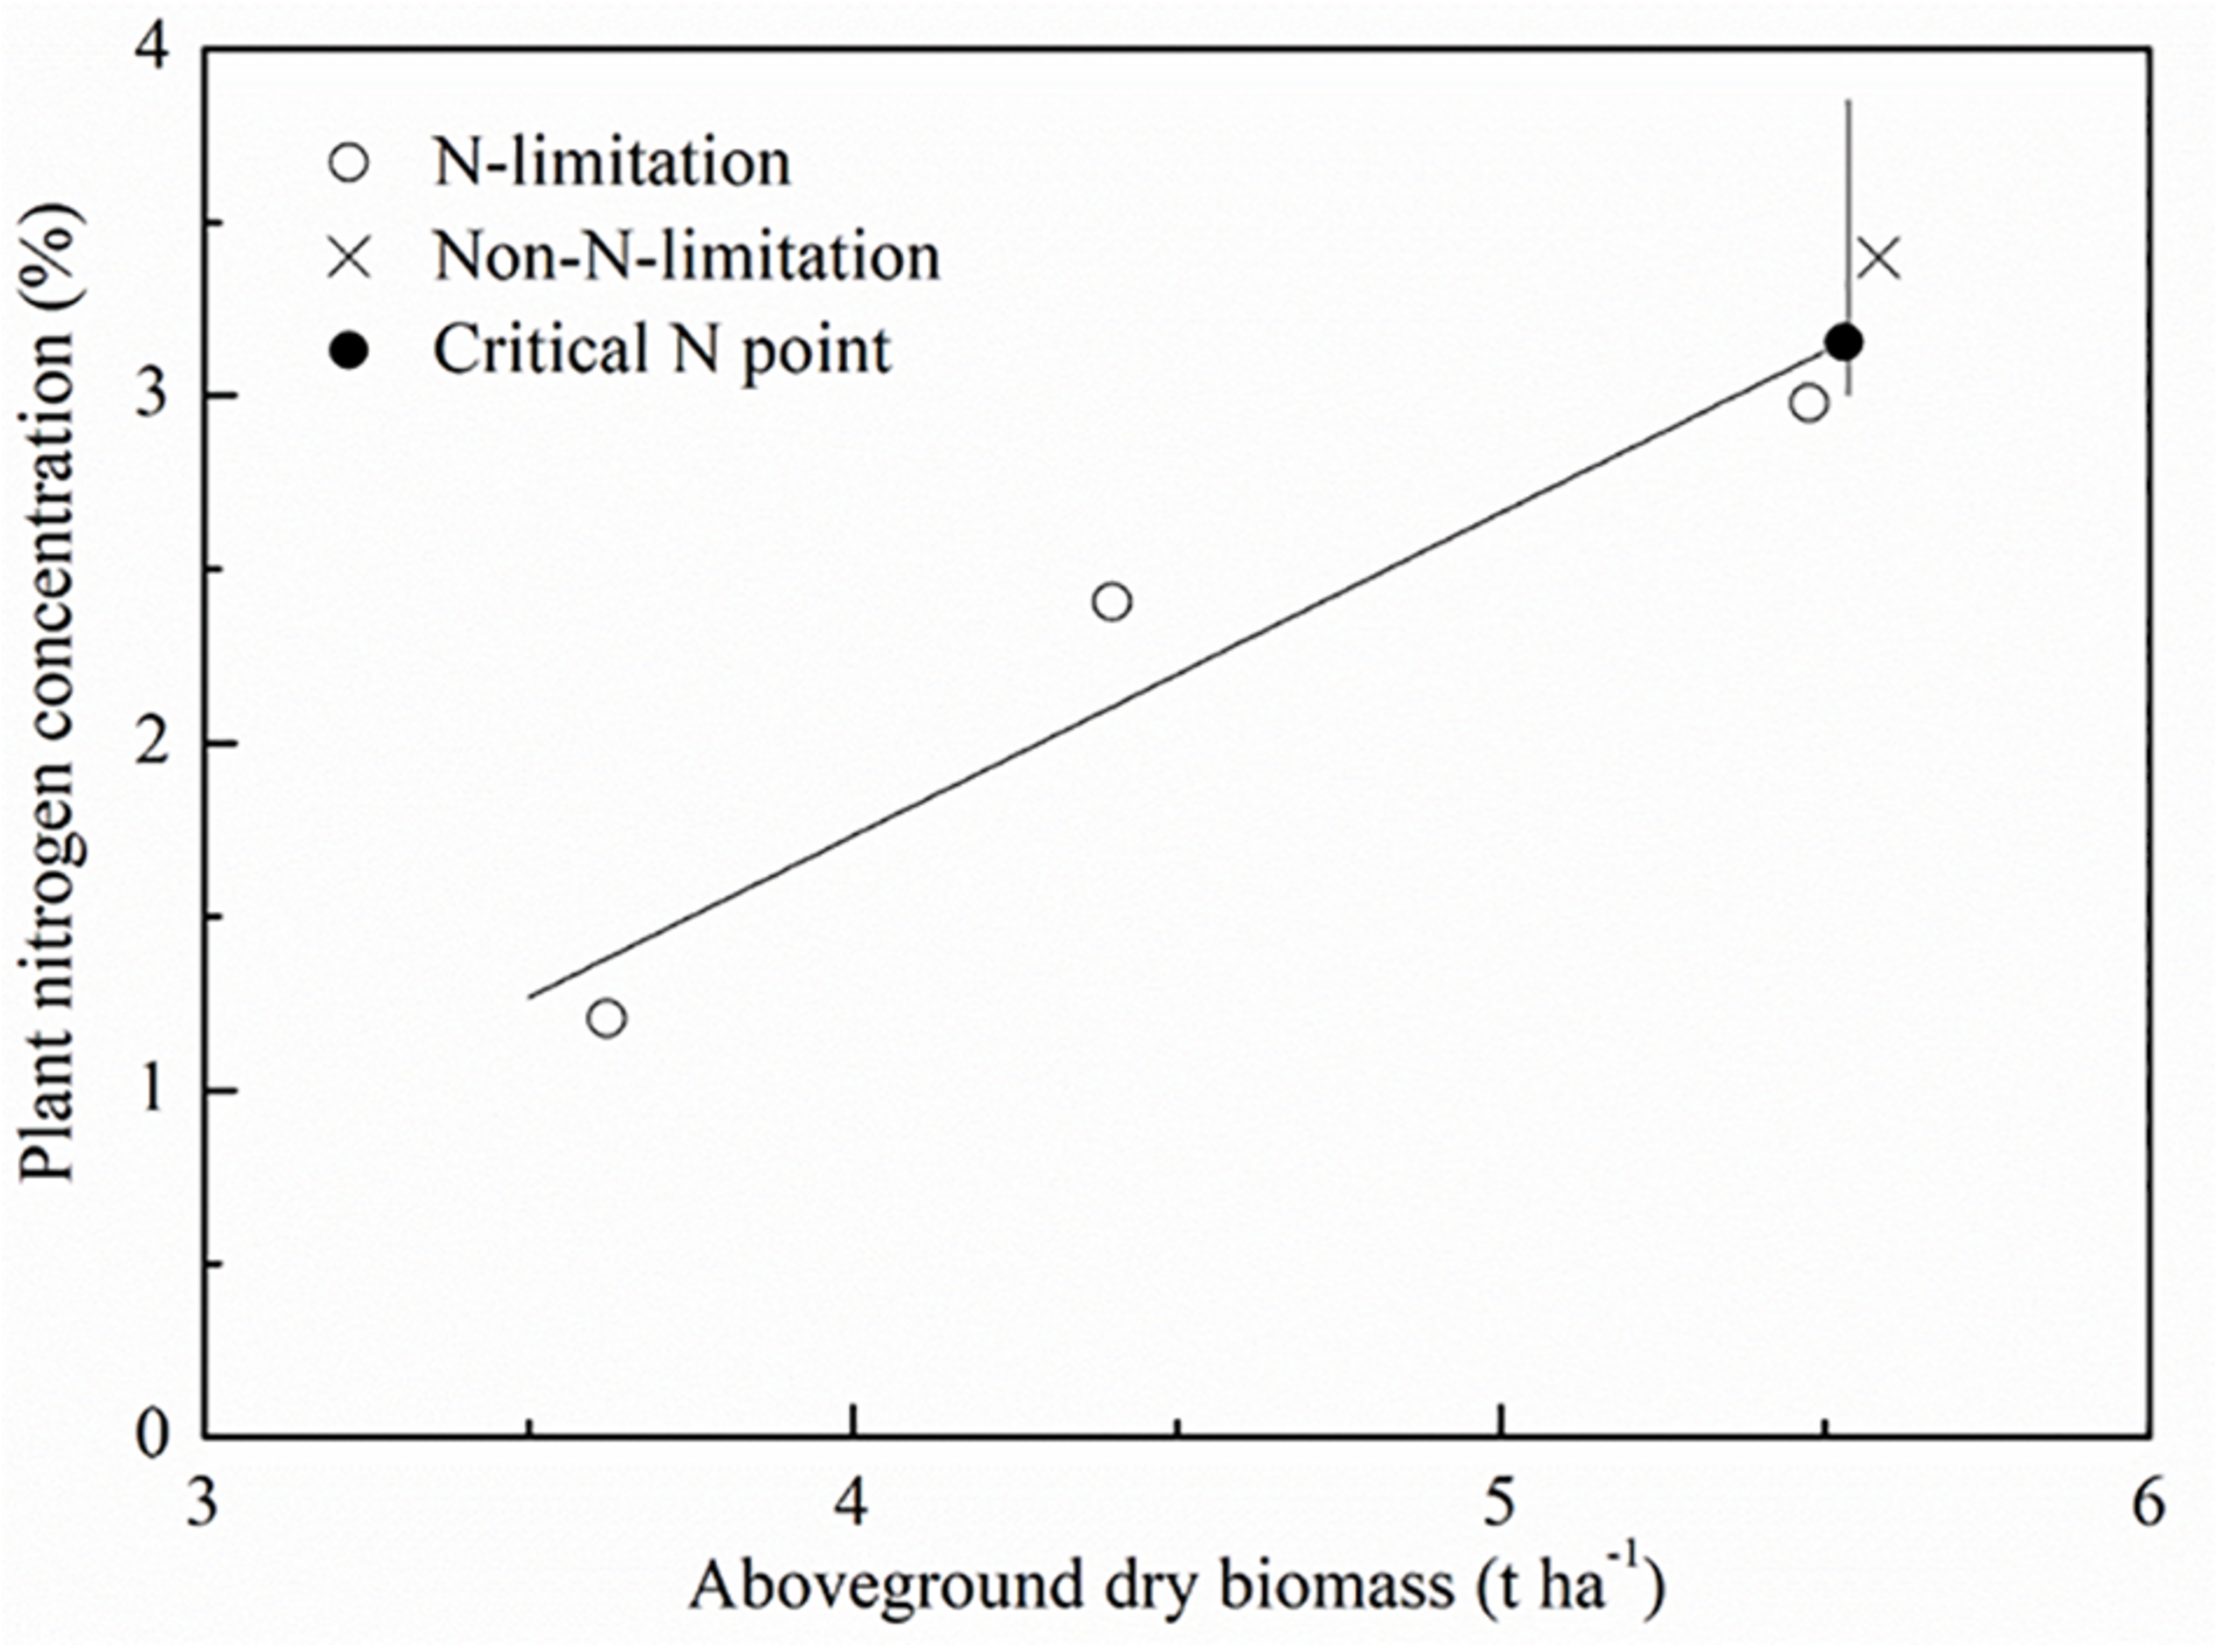
Schematic diagram of standard critical N (Nc) concentration point selection. The symbols (O) and (X) represent the data points for N-limiting treatments and N-limiting treatments. The symbol (•) represents the calculated standard Nc points.
Where “a” and “b” are parameters obtained by calibrating the standard Nc dilution curve.
Modified Nc (mNc) Dilution Curve Under Different Irrigation and N Rates
In the standard approach, parameters “a” and “b” are considered as constant, regardless of different irrigation and fertilizer treatments, although it is known that these factors influence the parameters (Errecart et al., 2014). We propose here a mNc dilution curve that allows parameters “a” and “b” vary under different irrigation and fertilizer treatments, for a better characterization of the N diagnosis. Other agronomic variable, i.e., PWC, LWC, LAI, EWT, and LAD, are assessed to improve the standard Nc dilution curve calculation.
The hierarchical linear model (HLM) was introduced for the analysis of nested structured data (Lininger et al., 2015). It is a statistically sound methodology with regression models that explicitly consider variability at different levels. We followed the common approach suggested in the literature (Lininger et al., 2015) to build HLMs, considering the sources of variation at two levels. At level 1, mNc varies over time as a negative power function of a specific irrigation rate. The change function describes the trajectory of standard Nc over AGB and is characterized by a set of specific change parameters. At level 2, these specific change parameters are viewed as varying across irrigation treatments, possibly a function of different agronomic variables. For the mNc dilution curve there are two additional independent variables passed to the next level in the HLM (Level-2) that again considered parameter “a” and “b” as a function of agronomic variables. Therefore, the parameters to be estimated for mNc dilution curve are the four parameters in Level-2 (β1, β2, β3, and β4). The HLM model parameters were obtained using optimization algorithm in Matlab 2016 (Mathworks, Inc., Natick, MA, United States) programming. The mNc dilution curve is described as follows:
Where β1, β2, β3, and β4 are the parameters to be estimated of the mNc model, respectively. β1 and β3 represent slopes of each agronomic variable. β1 and β3 represent the intercept. AC represents one of the different agronomic variables tested. AC1 and AC2 are one of five agronomic variables (i.e., PWC, LWC, LAI, EWT or LAD) randomly selected, respectively, including 25 combinations. Figure 3 shows a diagram of the methodologies used to obtain the standard Nc and the mNc models.
FIGURE 3
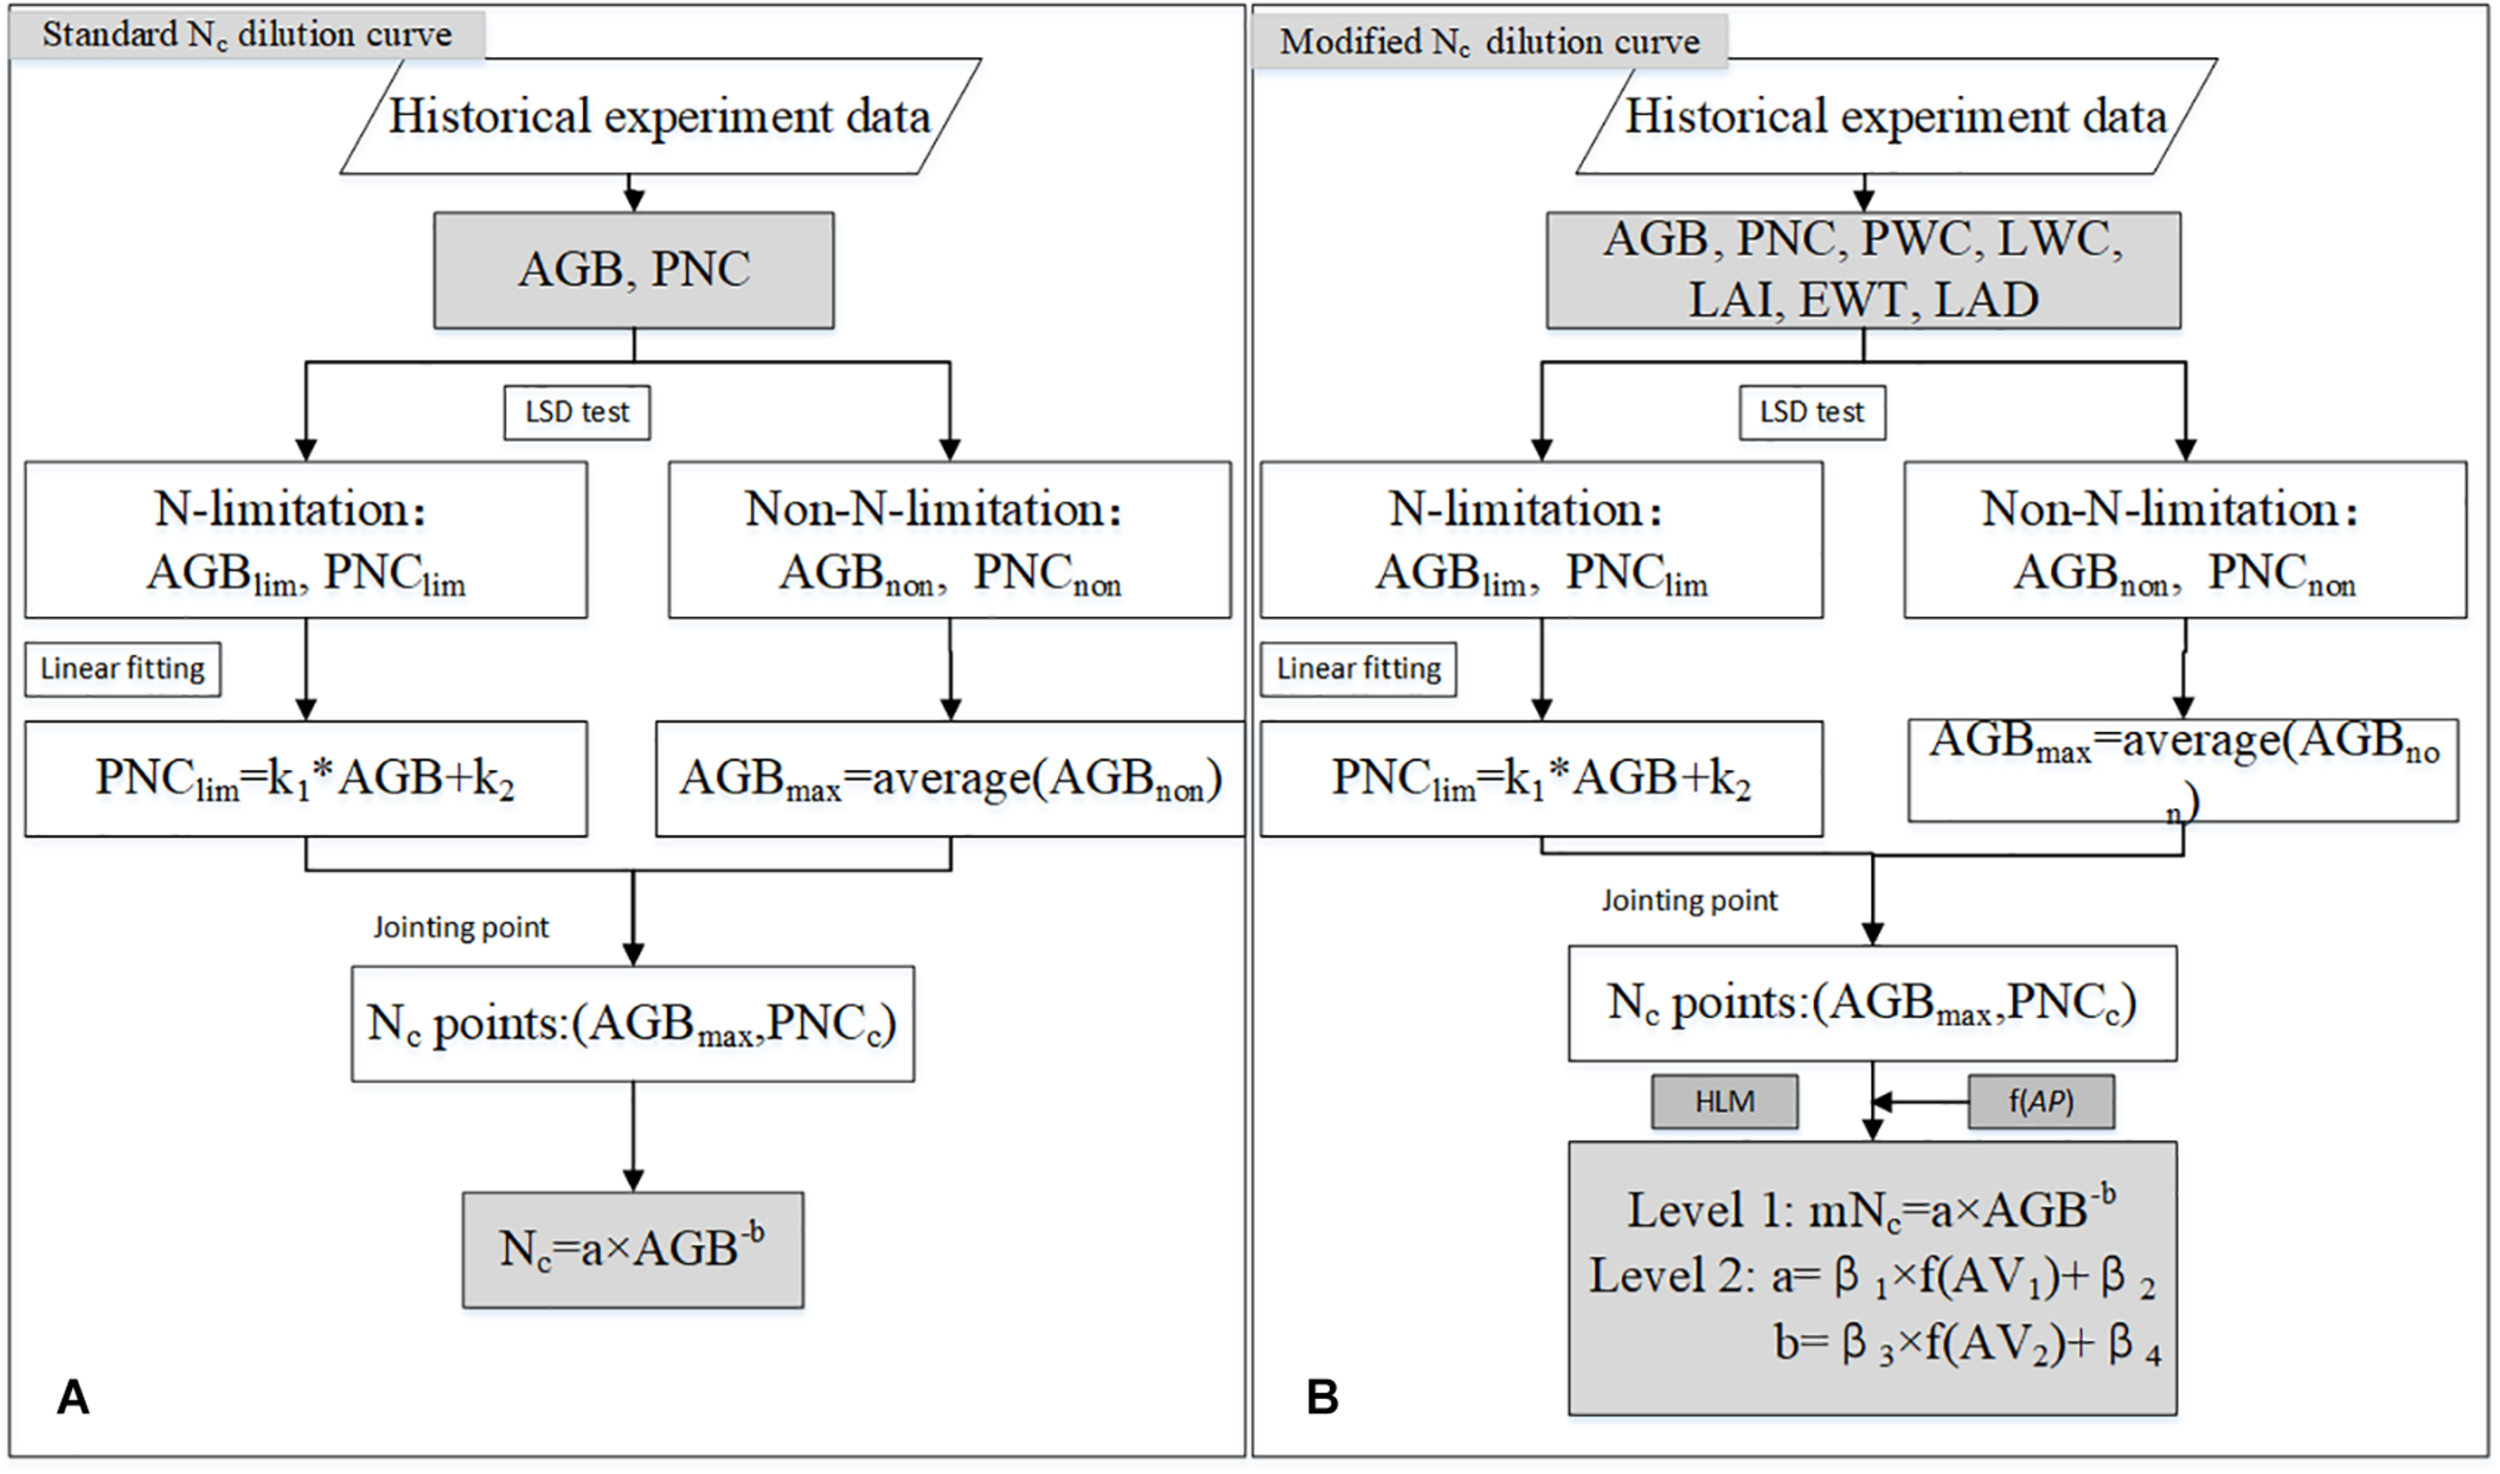
Flow chart for standard Nc dilution model (A) and the mNc dilution model (B). AGBlim and PNClim represent AGB and PNC corresponding to N limitation plots, respectively. AGBnon and PNCnon represent AGB and PNC corresponding to non-N -limitation plots, respectively. The k1 and k2 were parameters obtained by calibrating PNClim with AGBlim.
Nitrogen Nutrition Index (NNI)
NNI is the ratio of the actual plant N concentration to the mNc value for the corresponding biomass value. In order to verify the N diagnostic function of mNc dilution curve, the corresponding prediction NNI was calculated as:
where NNI, PNC, and mNc represent nitrogen nutrition index, plant N concentration and predicted critical nitrogen concentration points using the mNc method, respectively.
Model Evaluation
To test whether there was a significant difference in the regression relationships under different management conditions, we examined the difference of regression coefficients using the F-test (SPSS Inc., Chicago, IL, United States). We evaluated model performance using the determination coefficient (R2) and the normalized root mean squared error (nRMSE). These were calculated as follows:
Where, n, , Yi, and p represented the number of samples, predicted value, measured value and the number of independent variables, respectively.
Akaike information criterion (AIC) was used to find out whether the mNc dilution curve, in which more parameters are included, performed better than the standard Nc dilution curve. The AIC value is closely related to L and K value. Among them, the smaller the K value is, the more concise the model is, and the larger the L value is, the more accurate the model is. The general equation is (Bartholomeus, 1987):
Where L and K represent log-likelihood function and the numbers of estimated parameters, respectively. The PI, Sse and n represent circular constant, residual sum of squares and the samples number, respectively.
Results
Standard Nc Dilution Curve for Winter Wheat
According to the standard Nc dilution theory, the Nc dilution curve divides the data points into three categories: N-limited status below the curve, N-excess states above the curve, and N optimum close to the curve. The average standard Nc dilution curve based on all the data pooled together could be characterized by the negative power equation Nc = 5.05×AGB–0.47, with R2 and nRMSE, of 0.63 and 0.21. However, using the standard Nc dilution curve, there was a large variability depending on the year and water availability conditions (Figure 4A). Additionally, it is known that in water limited conditions (W0) the N uptake is also affected (Kunrath et al., 2018), thus the estimation of standard Nc dilution curve is influenced by uncertainty and possibly underestimated.
FIGURE 4
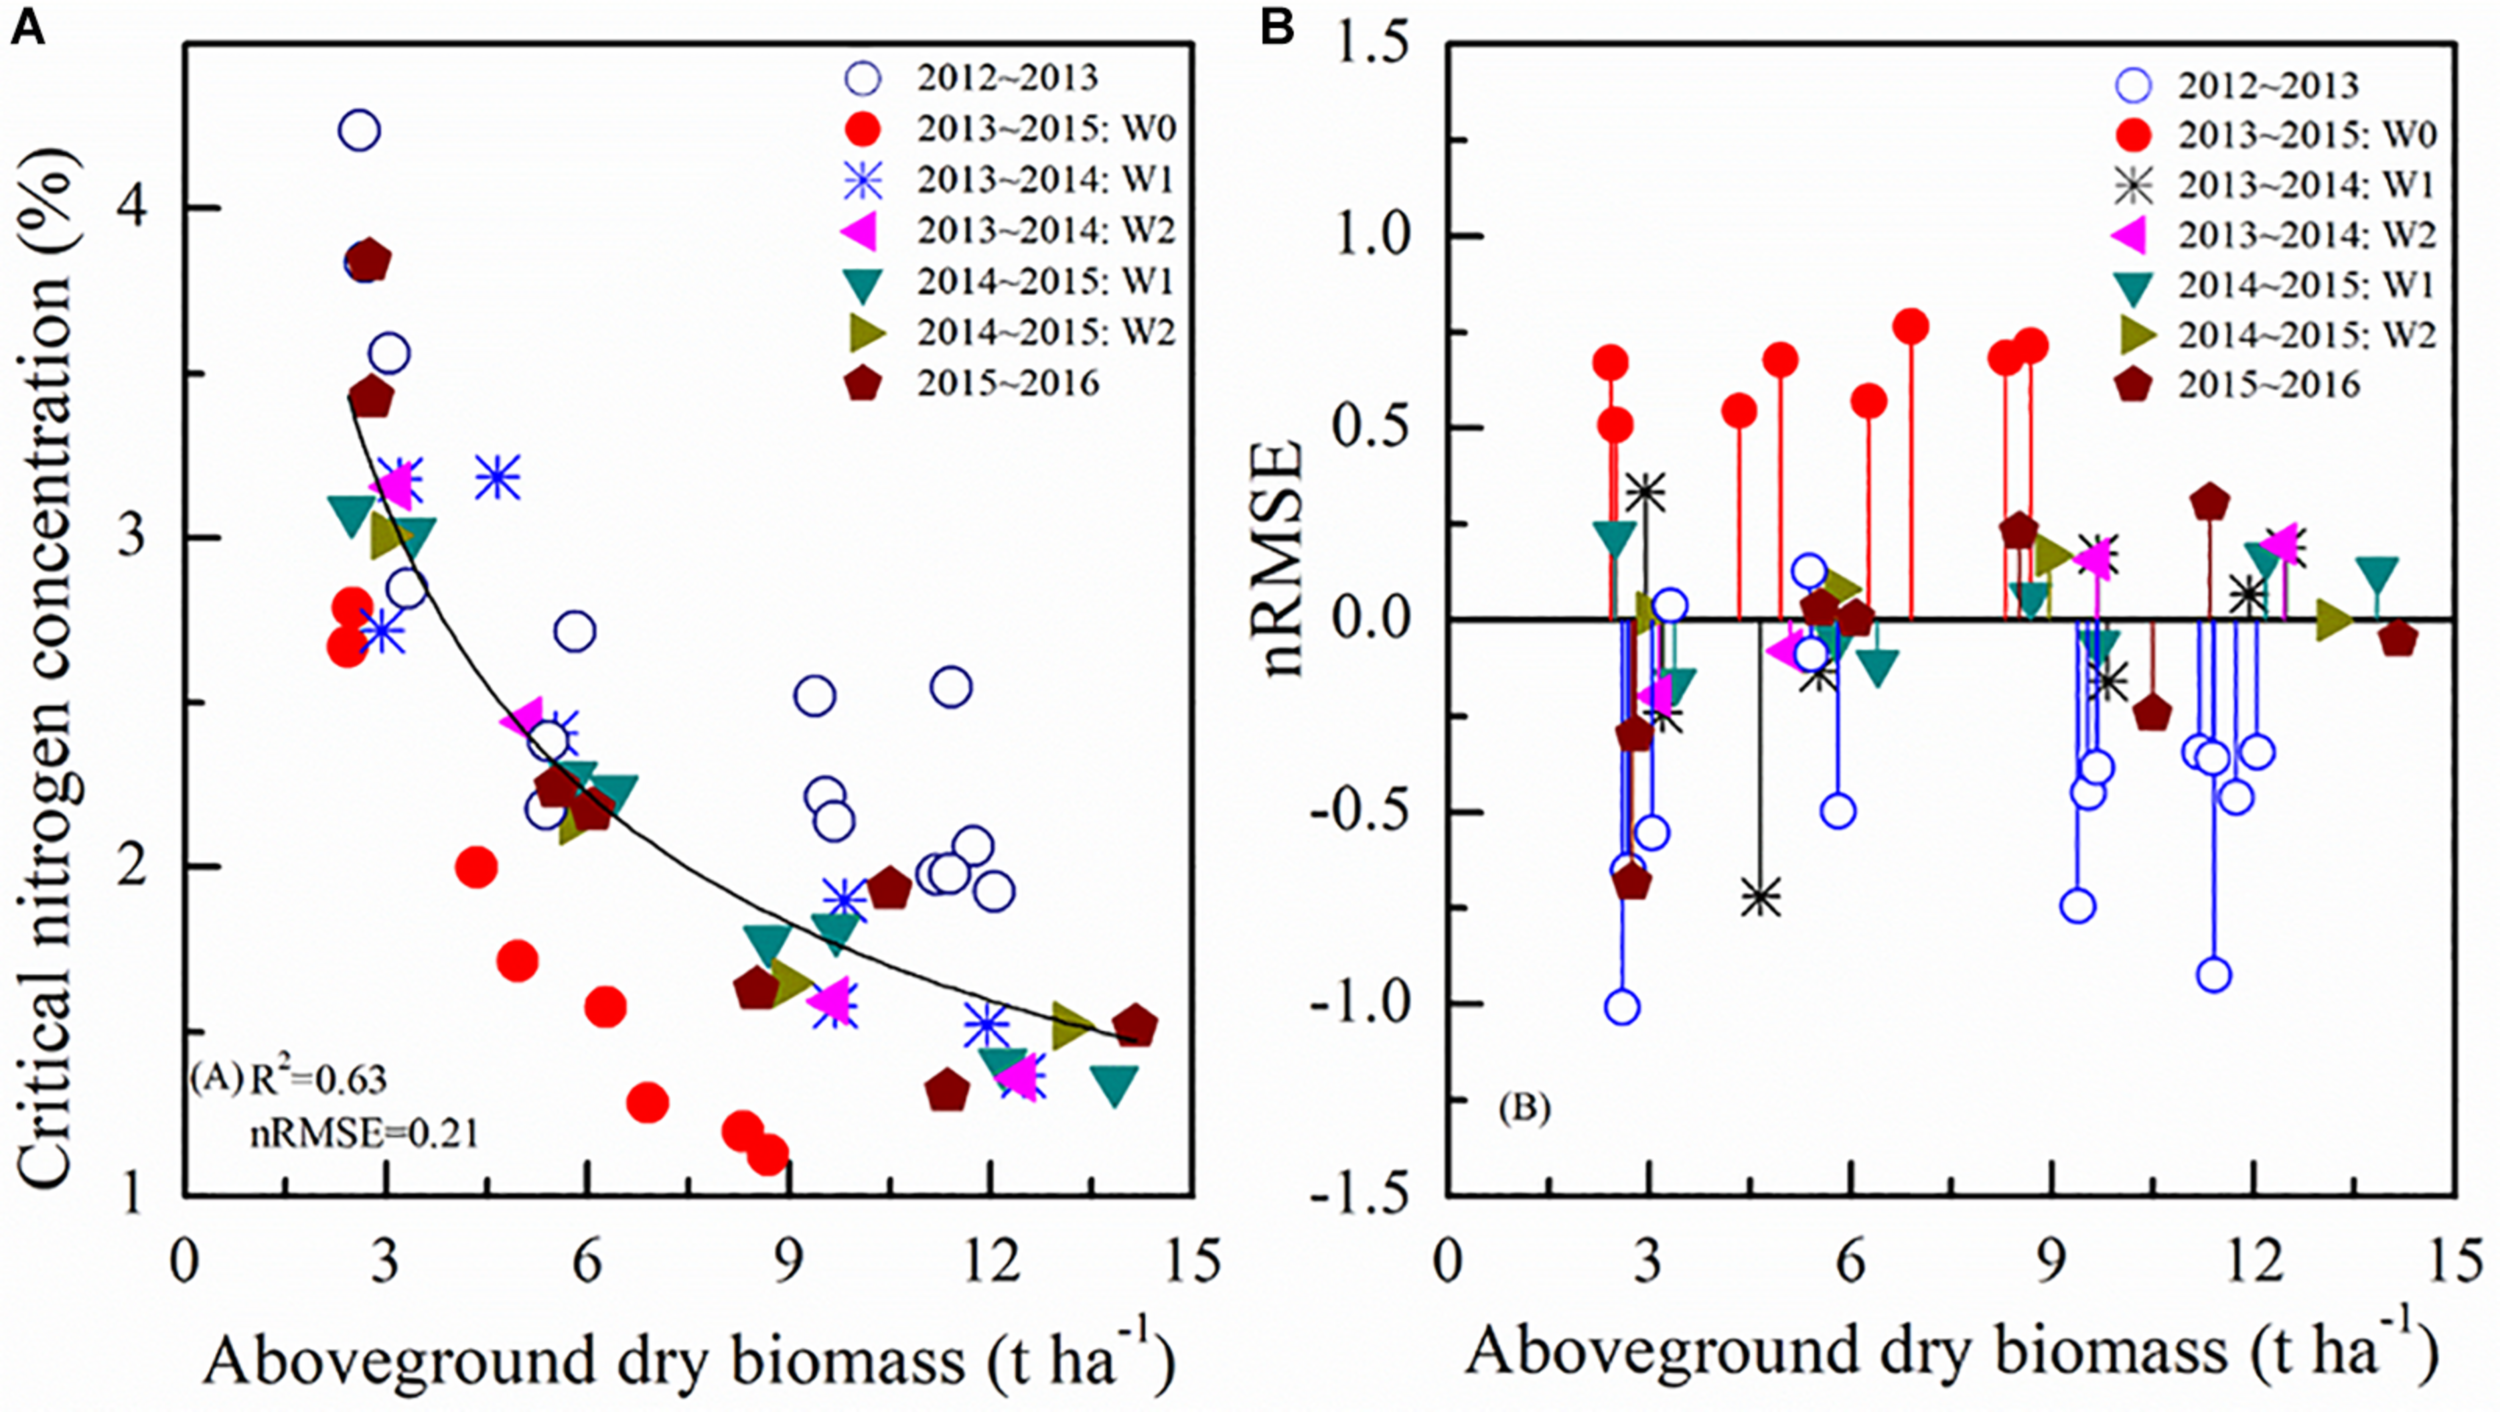
Standard Nc dilution curve (A) during different growing seasons and nRMSE values using standard Nc method (B). 2012∼2013 and 2015∼2016 represent different winter wheat growing seasons. W represents irrigation treatments.
Figure 4B represents the nRMSE between the value of selected points using the standard Nc method and the predicted Nc value using the average standard Nc dilution curve. It shows greater nRMSE values for the most diverse irrigation conditions. The average standard Nc dilution curve overestimated or underestimated the data from 2013 to 2015 W0 and 2012 to 2013 respectively, greatly impacting the N status assessment, needed e.g., to carry out reasonable N applications in the field.
Instead, when specific Nc dilution curves were developed for the different treatments, i.e., developing different models for each experiment, significant differences in the parameters “a” and “b” were found (Figure 5). The parameter “a” ranged from 5.17 to 6.52, whereas parameter “b” ranged from −0.69 to −0.38 (Table 2). Standard Nc models based on different water management conditions showed better performances, with ranges of R2 and nRMSE respectively of 0.78 to 0.96 and 0.03 to 0.20. The value of parameter “a,” i.e., the Nc for an AGB of 1 Mg ha–1, obtained from the 2012–2013 and from the 2013–2015 non-irrigated data (W0) data was significantly different from that derived from all the other experiments. In general, whereas parameter “a” was significantly different among the experiments, there was no significant difference in parameter “b.”
FIGURE 5
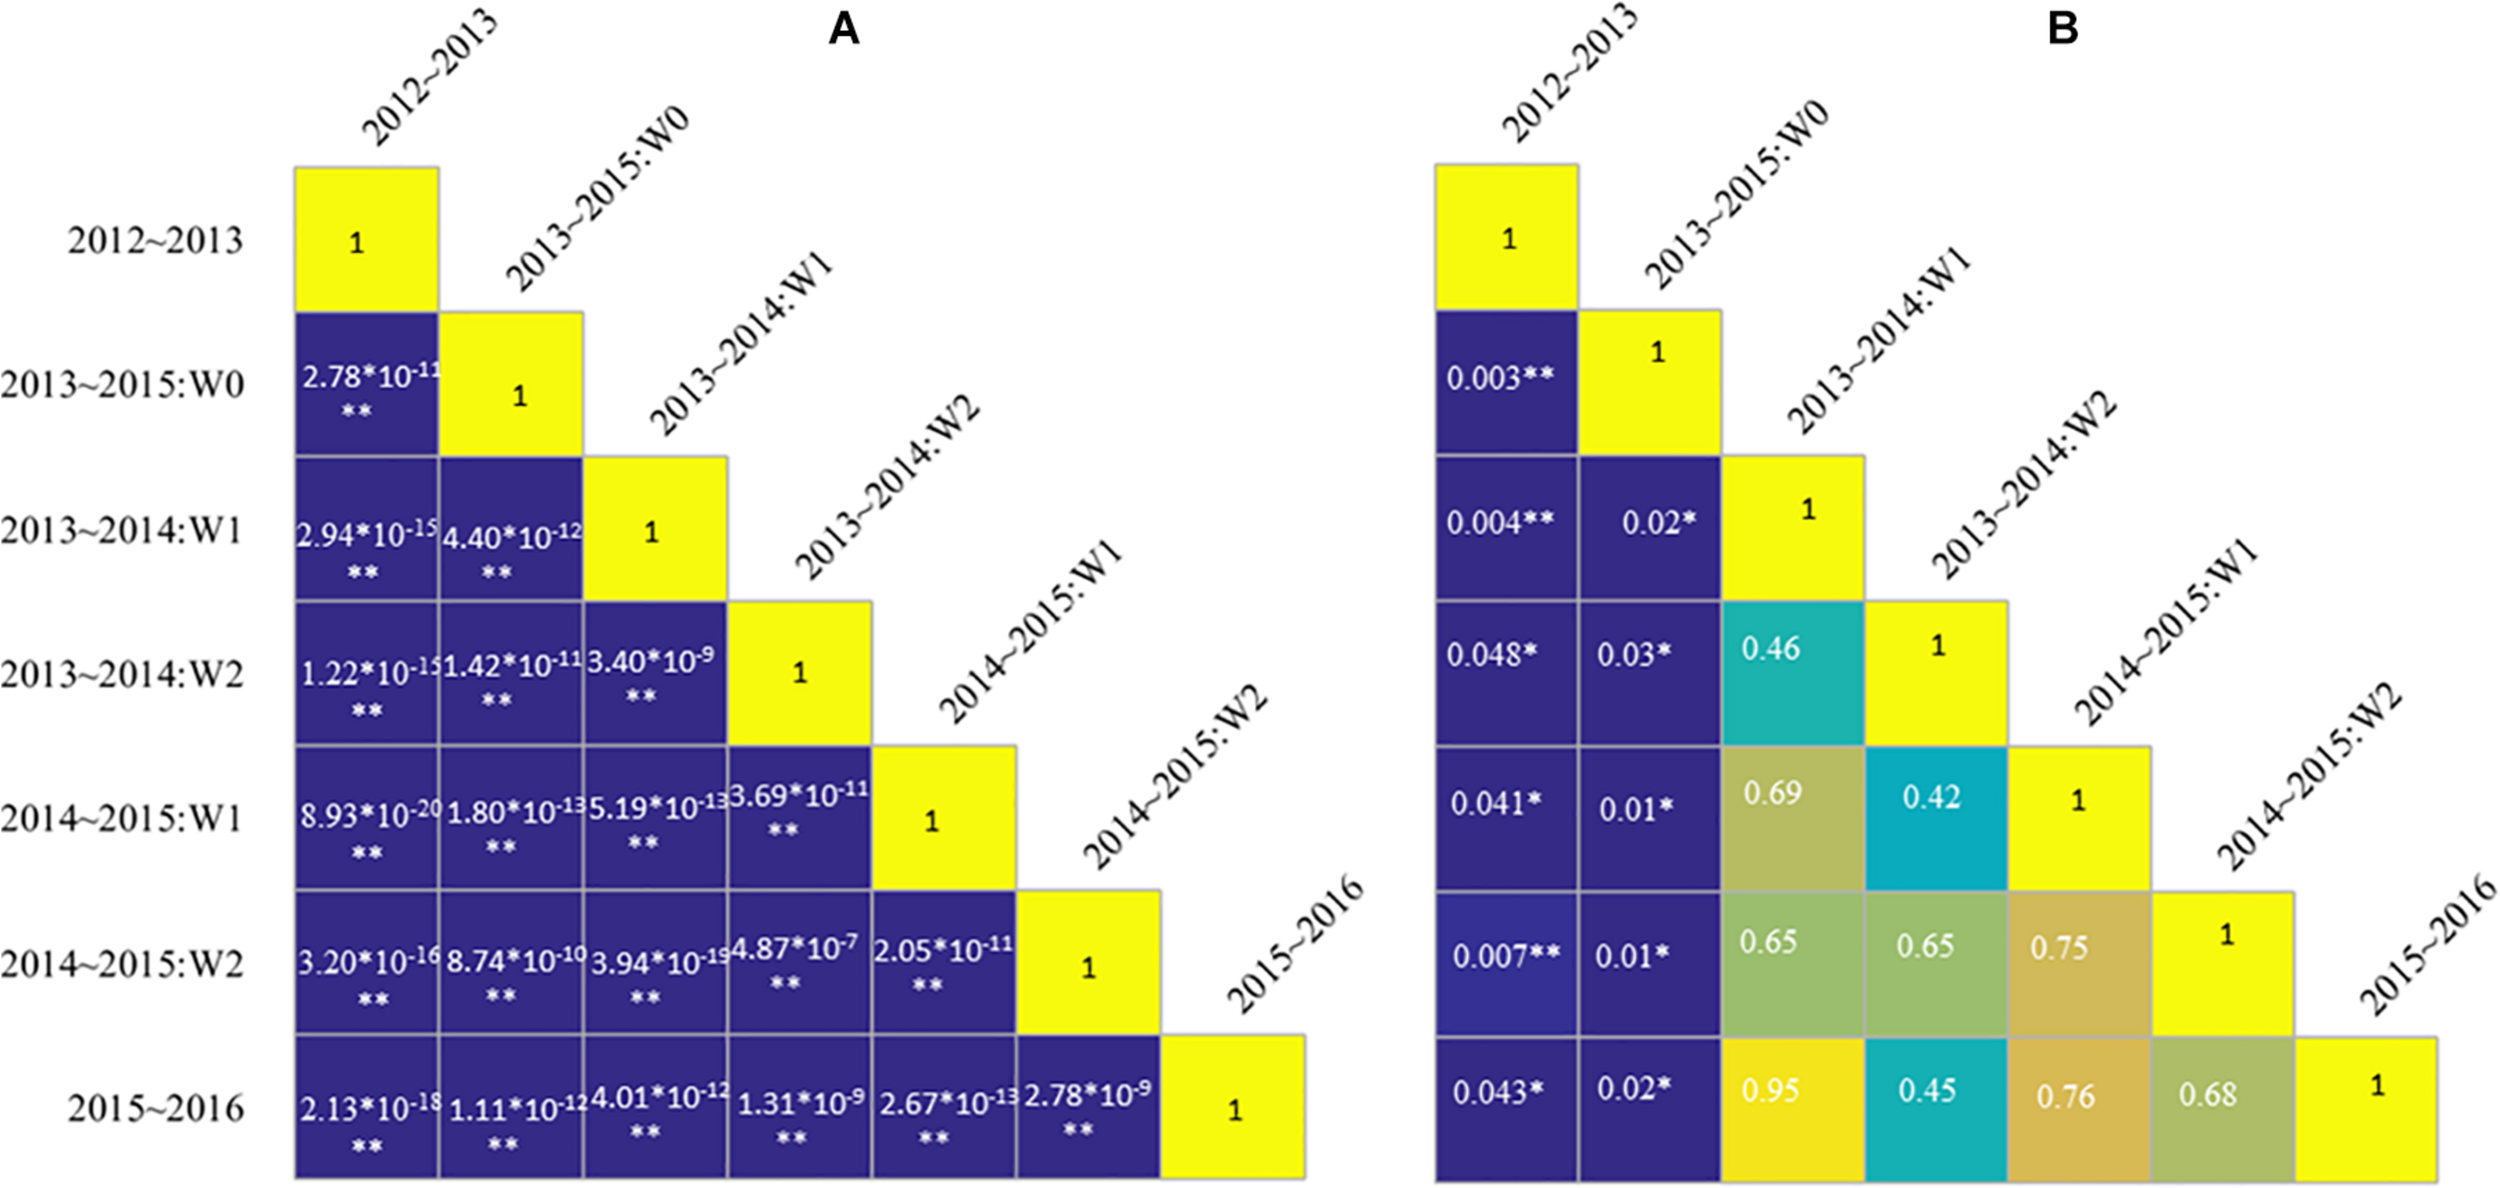
Matrix of significant differences among parameters “a” (A) and “b” (B) of standard Nc dilution curves obtained separately for the different experiments. A significant level P < 0.05 and P < 0.01 is indicated by the symbol * and **, respectively. W represents irrigation treatments.
TABLE 2
| Treatments | Irrigation rates | a | b | R 2 | nRMSE |
| 2012∼2013 | 187 mm | 5.17 | −0.38 | 0.78 | 0.12 |
| 2013∼2015: W0 | 25 mm | 5.19 | −0.69 | 0.96 | 0.05 |
| 2013∼2014: W1 | 171 mm | 5.86 | −0.54 | 0.86 | 0.14 |
| 2013∼2014: W2 | 317 mm | 6.52 | −0.62 | 0.95 | 0.03 |
| 2014∼2015: W1 | 217 mm | 5.35 | −0.51 | 0.85 | 0.04 |
| 2014∼2015: W2 | 409 mm | 5.30 | −0.48 | 0.64 | 0.20 |
| 2015∼2016 | 180 mm | 6.33 | −0.58 | 0.91 | 0.09 |
Parameters of the standard Nc dilution curve for winter wheat obtained in the different experiments.
W represents different irrigation treatments.
Agronomic Variables of Winter Wheat Under Different N Fertilizer and Irrigation Treatments
In order to further analyze the coupled effect of irrigation and fertilizer management on different agricultural variables, we examined their differences in different growth periods under irrigation and fertilizer management, using the LSD methodology. The results of the differences (P-values) between separate management on the agronomic variables considered are reported in Table 3. There was significant (P < 0.05) influence of management on LAI at jointing, booting and anthesis stages under different irrigation and N rates, but not in the filling stage. There was no significant influence of irrigation or fertilization treatments on PWC, LWC, EWT, and LAD.
TABLE 3
| Jointing stage ZS = 31 | Booting stage ZS = 45 | Anthesis stage ZS = 65 | Filling stage ZS = 75 | |
| PWC | 0.44 | 0.74 | 0.65 | 0.99 |
| LWC | 0.56 | 0.99 | 0.95 | 0.98 |
| LAI | 2.71 × 10⁻²* | 0.04* | 3.00 × 10⁻³* | 0.76 |
| EWT | 0.99 | 0.98 | 0.99 | 0.80 |
| LAD | 0.53 | 0.17 | 0.58 | 0.68 |
P-value between irrigation and N rates on PWC, LWC, LAI, EWT, and LAD.
A significant level P < 0.05 is indicated by the symbol*. PWC, plant water content; LWC, leaf water content; LAI, leaf area index; EWT, equivalent water thickness; LAD, leaf area duration; ZS, Zadoks stage.
The mNc Dilution Curve
A mNc dilution model was constructed employing agronomic variables as an additional layer of information for the different treatments. Figure 6 presents R2 and nRMSE of the mNc dilution curve using calibrated sets. Compared to the standard method, all the mNc dilution models obtained better performances. During Exp1.3.4, Exp2.3.4, Exp1.4, and Exp2.4, the mNc models using PWC and LAI, representing parameter “a” and “b,” obtained best performance with R2 of 0.78, 0.86, 0.88, and 0.88 and nRMSE of 0.16, 0.12, 0.11, and 0.11, respectively. During Exp1.2.3, Exp1.2.4, and Exp1.3, the mNc models using LAI and LAD, representing parameter “a” and “b,” obtained best performance with R2 of 0.76, 0.76, and 0.76 and nRMSE of 0.16, 0.15, and 0.16, respectively. During Exp1.2 and Exp2.3, the mNc models using LAI and LAI, representing parameter “a” and “b,” obtained best performance with R2 of 0.75 and 0.92 and nRMSE of 0.15 and 0.09, respectively.
FIGURE 6
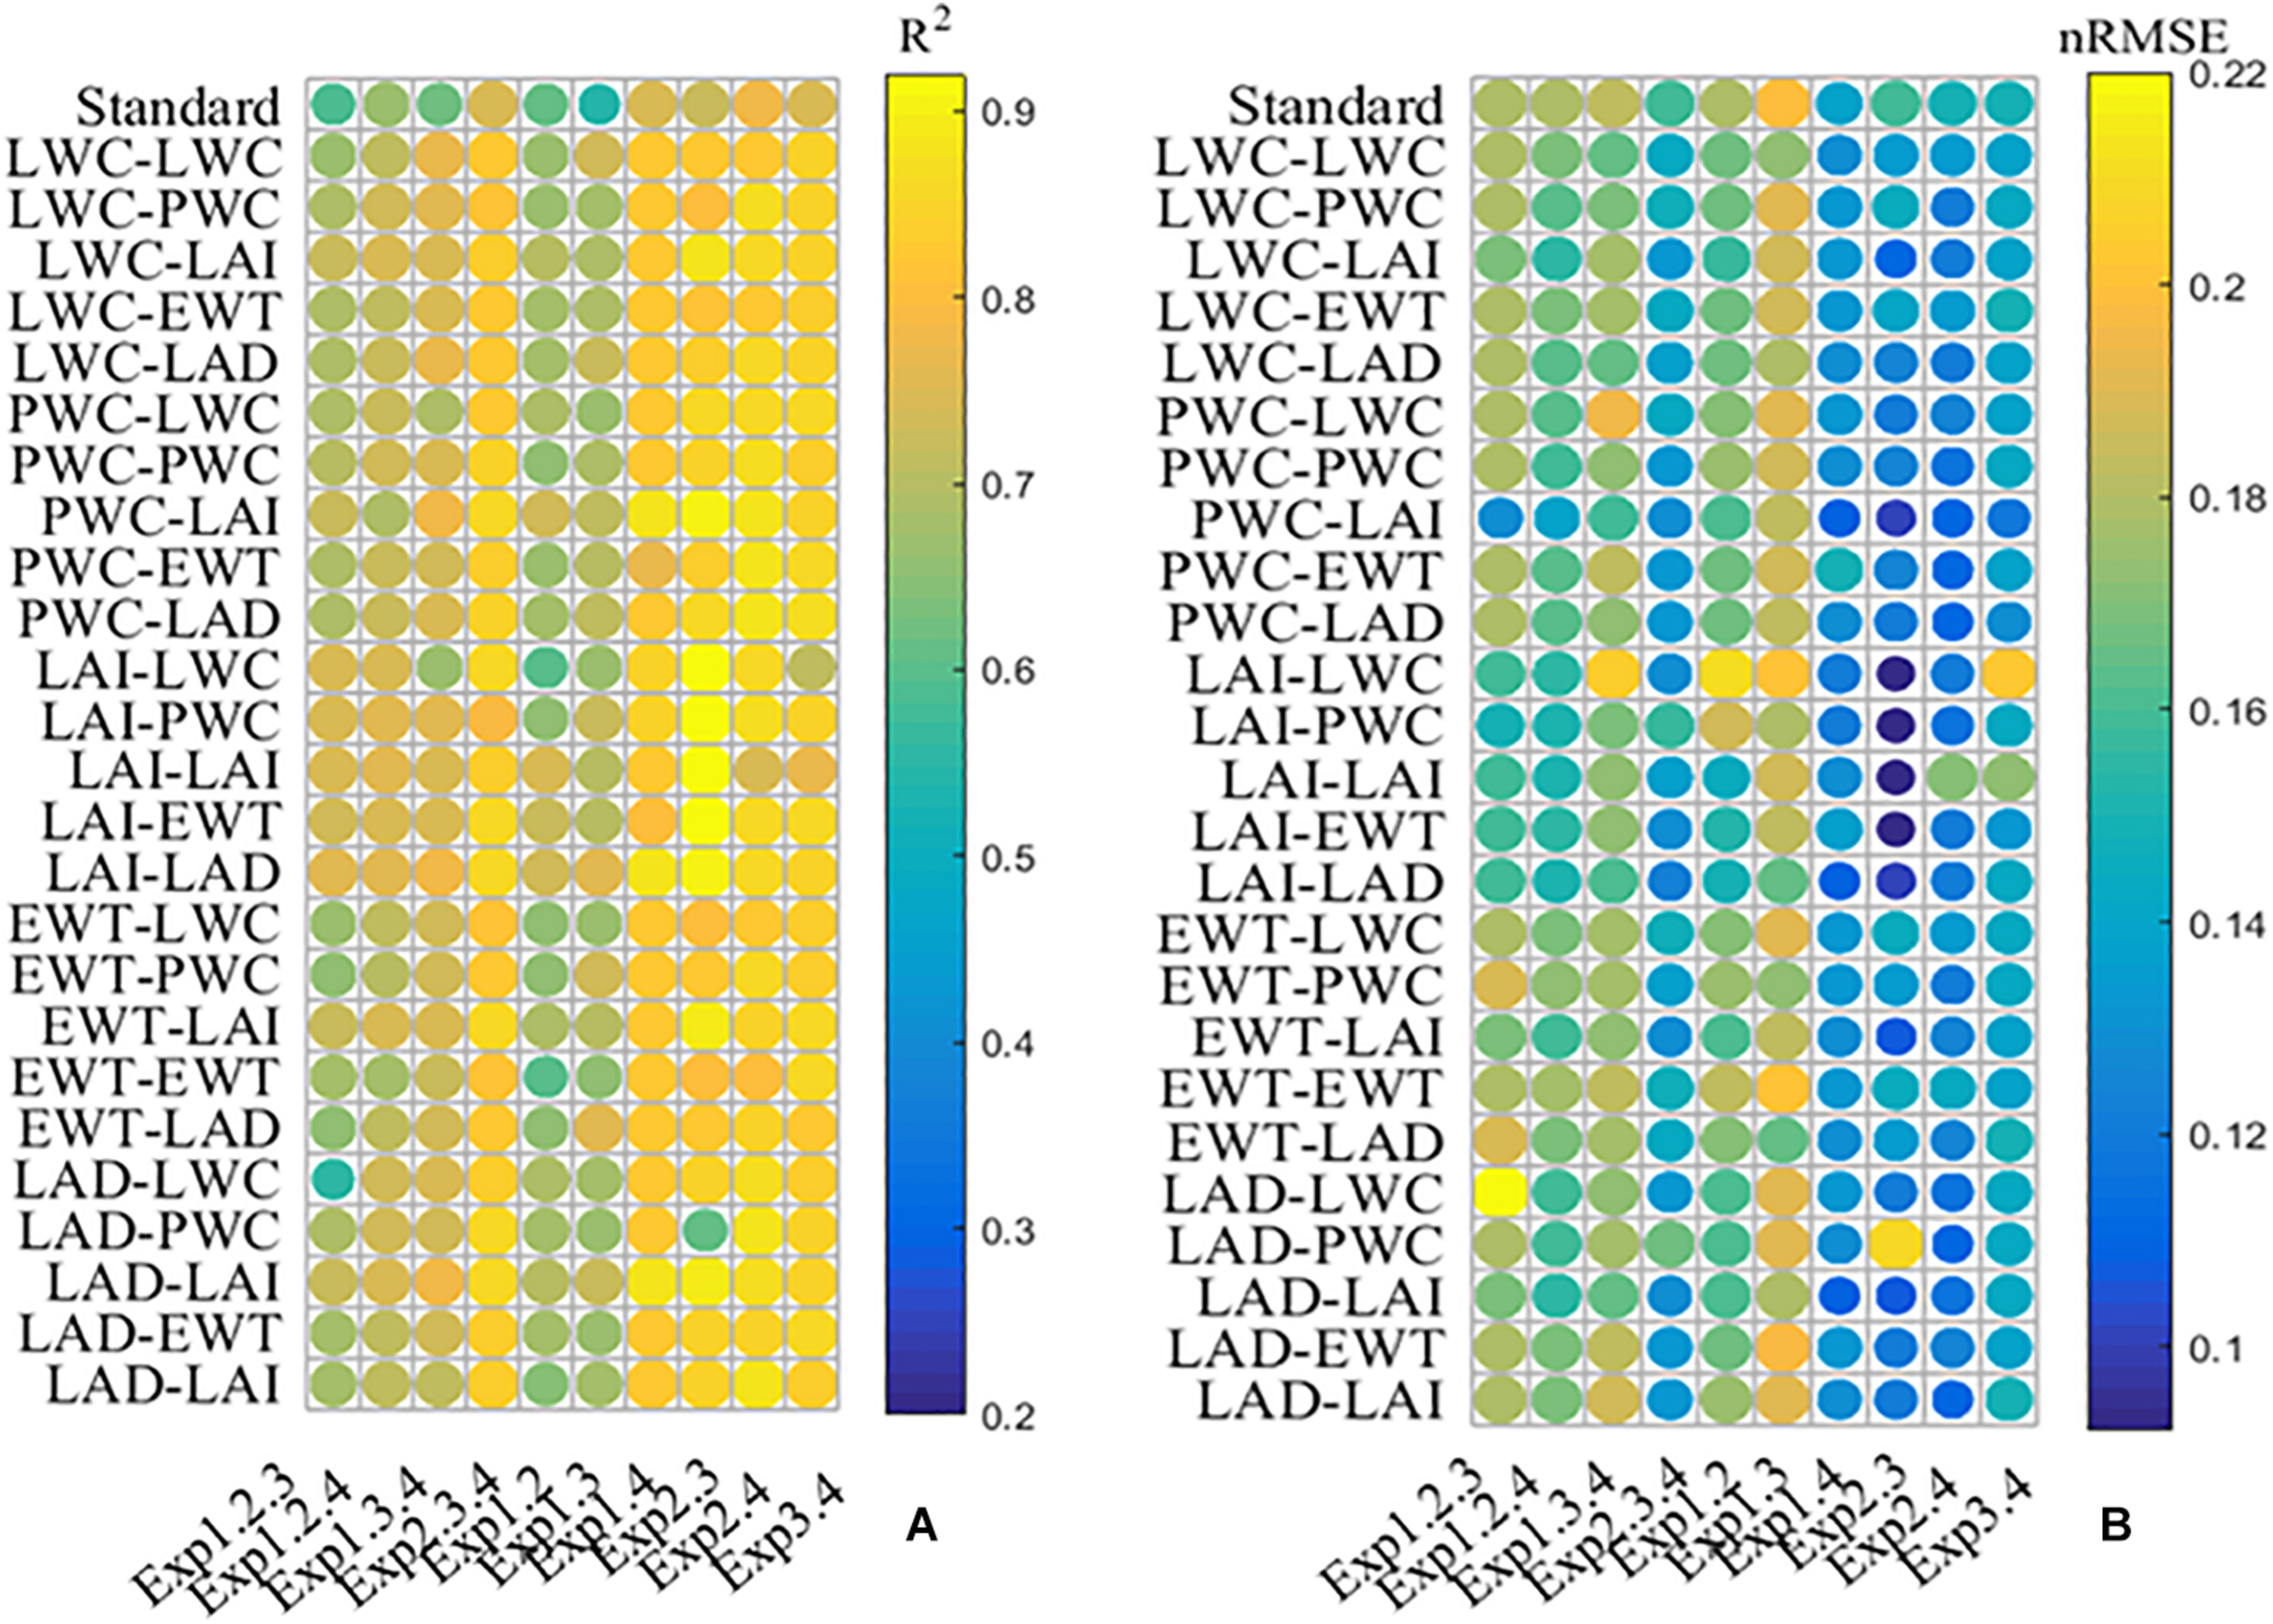
The determination coefficient (A) and the normalized root mean squared error (B) between all possible mNc dilution models. The values of ordinates are composed of two agronomic parameters (API-AP2) (see Eqs. 9 and 10). API and API represent coefficients “a” and “b,” respectively.
We selected the model using PWC and LAI, representing parameter “a” and “b” respectively, for further analysis. Although this model did not have the highest R2 across all experiments, the nRMSE was always quite low. The relationship between measured mNc and predicted mNc using validation sets is shown in Supplementary Figure S1. The mNc dilution models from the corresponding calibration sets, achieved a satisfactory performance with nRMSE range of 0.11 to 0.23 on the validation sets.
Nitrogen Nutrition Index Based on mNc Dilution Curve
In order to have a unique model for all the experiments and to evaluate its effectiveness in N diagnosis, we constructed the standard Nc dilution model and the mNc dilution model with all the data and compared their performance (Figure 7). The standard Nc dilution model was expressed as Nc = 5.05 × AGB–0.47, with R2 and nRMSE of 0.63 and 0.21. The mNc dilution curve was represented by the equation mNc = a×AGB−b, where a = 2.09 × PWC + 3.24, b = −0.02∗LAI + 0.51, with R2 and nRMSE of 0.79 and 0.13, respectively.
FIGURE 7
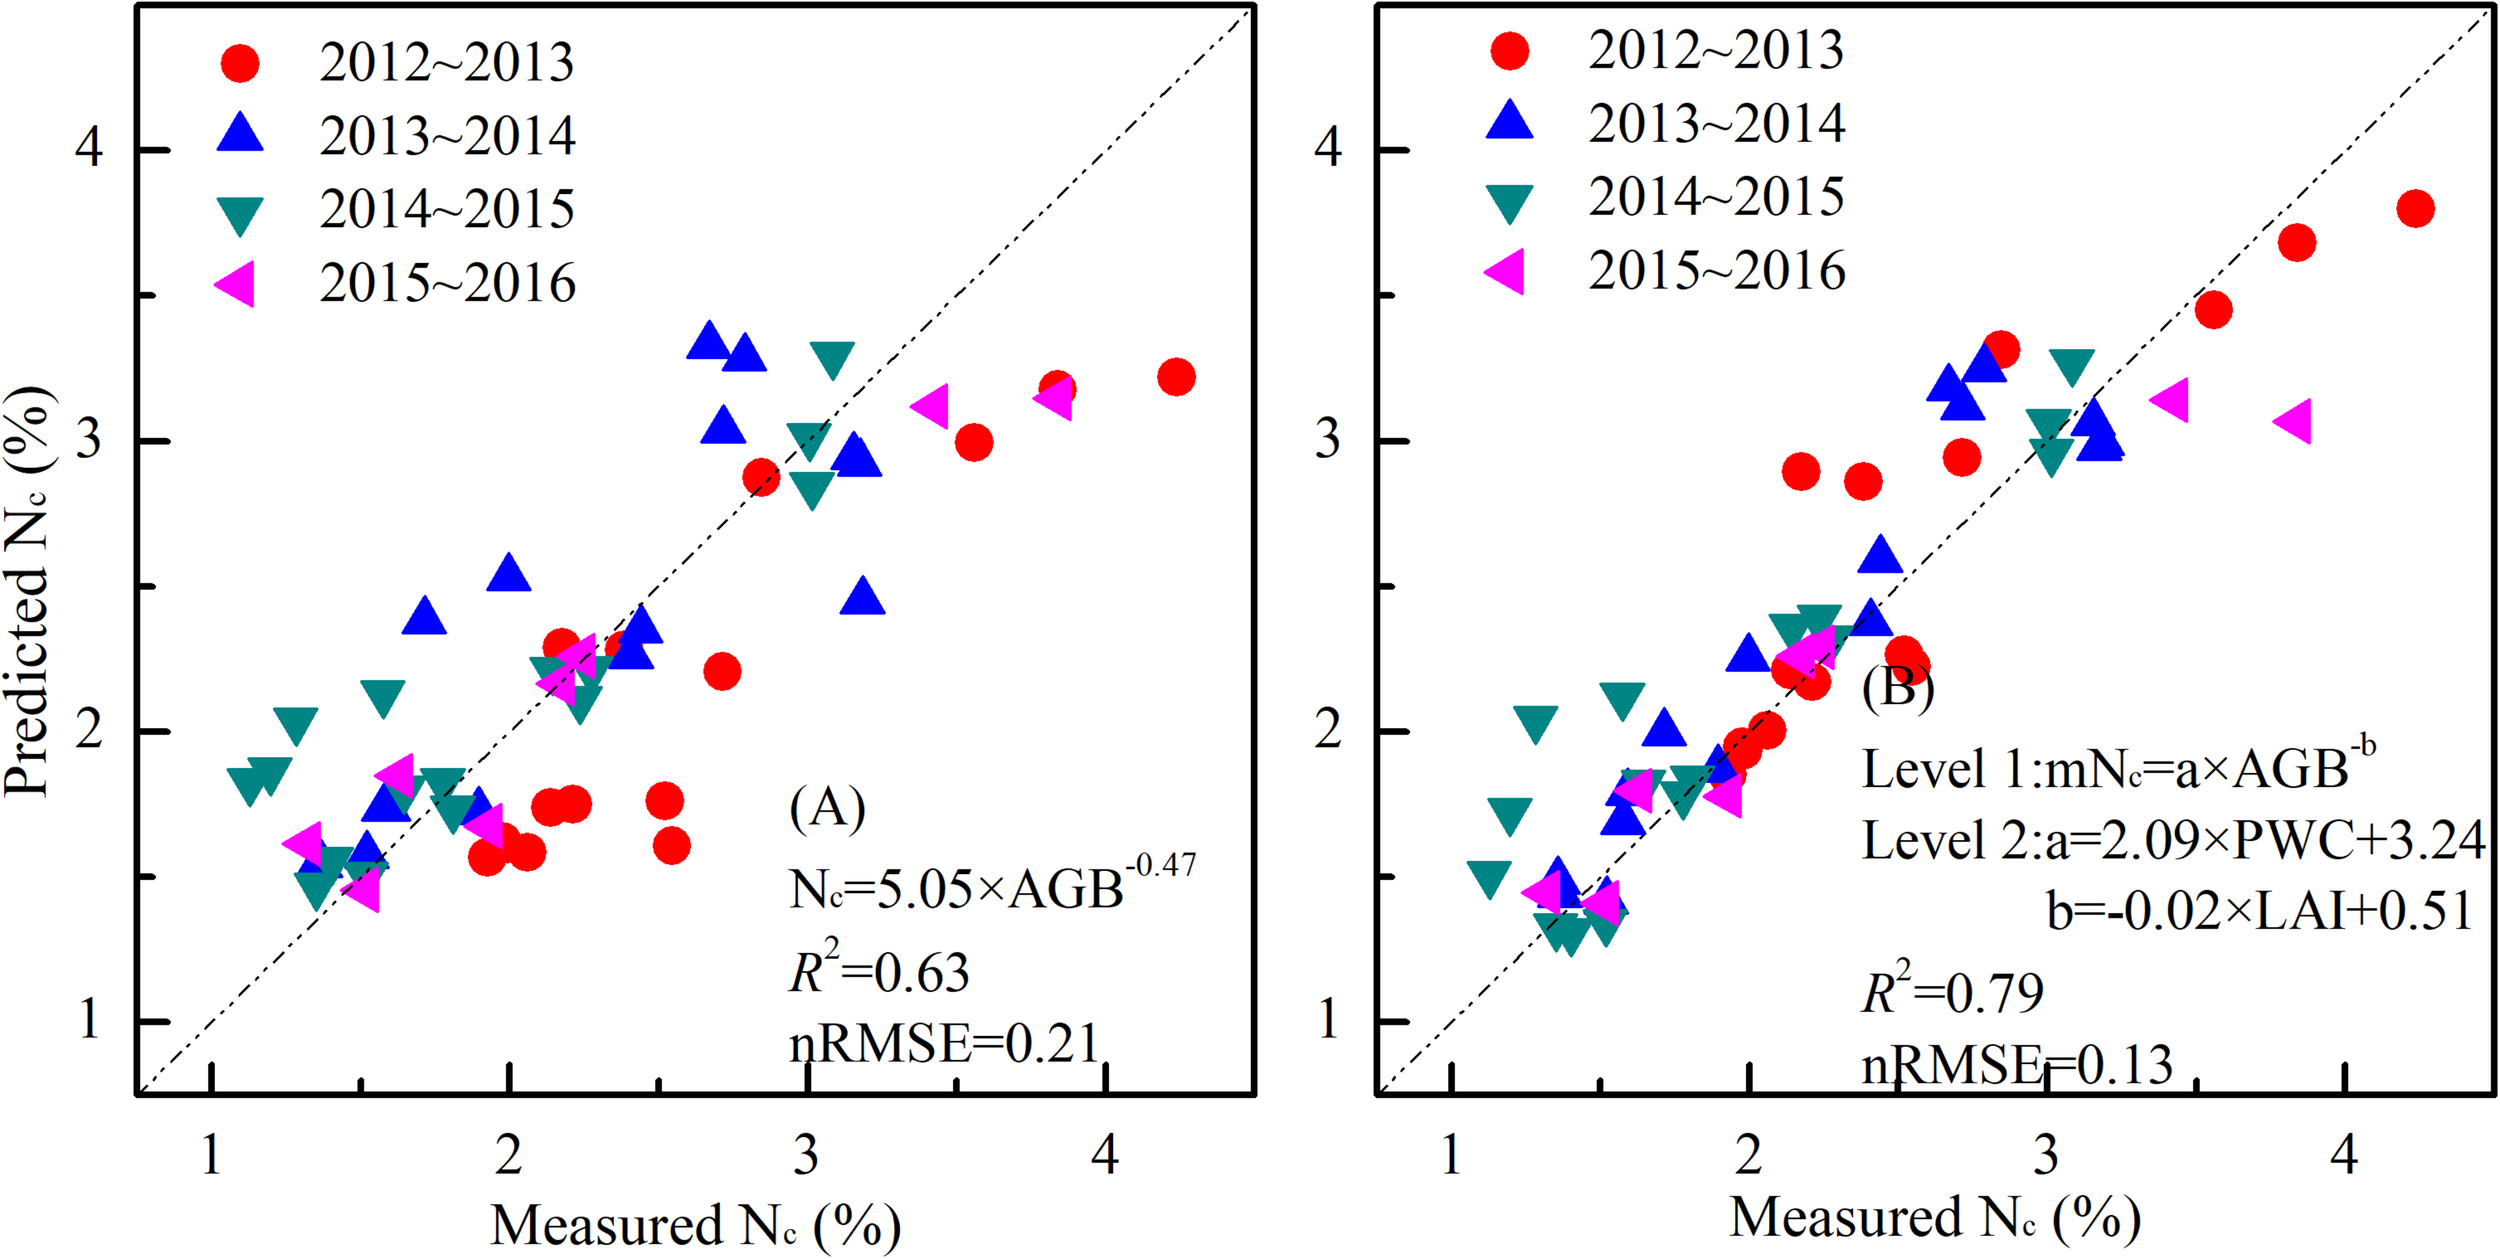
Relationships between measured standard Nc and predicted standard Nc using a unique standard Nc method (A) mNc method (B) for all the experiments.
Our results showed that NNI decreased with the declining rate of N application, and NNI was significantly different at different growth periods (Figure 8). NNI values were less than 1 for N1 treatments for both the calibration and the validation set. NNI values of N2 treatments and N3 treatments were close to 1, indicating that these treatments were optimal for winter wheat. NNI values of N4 treatments were almost always greater than 1. These results illustrate that NNI based on the mNc dilution curve can be used as a more robust diagnostic tool for N status of winter wheat as compared to the standard methodology.
FIGURE 8
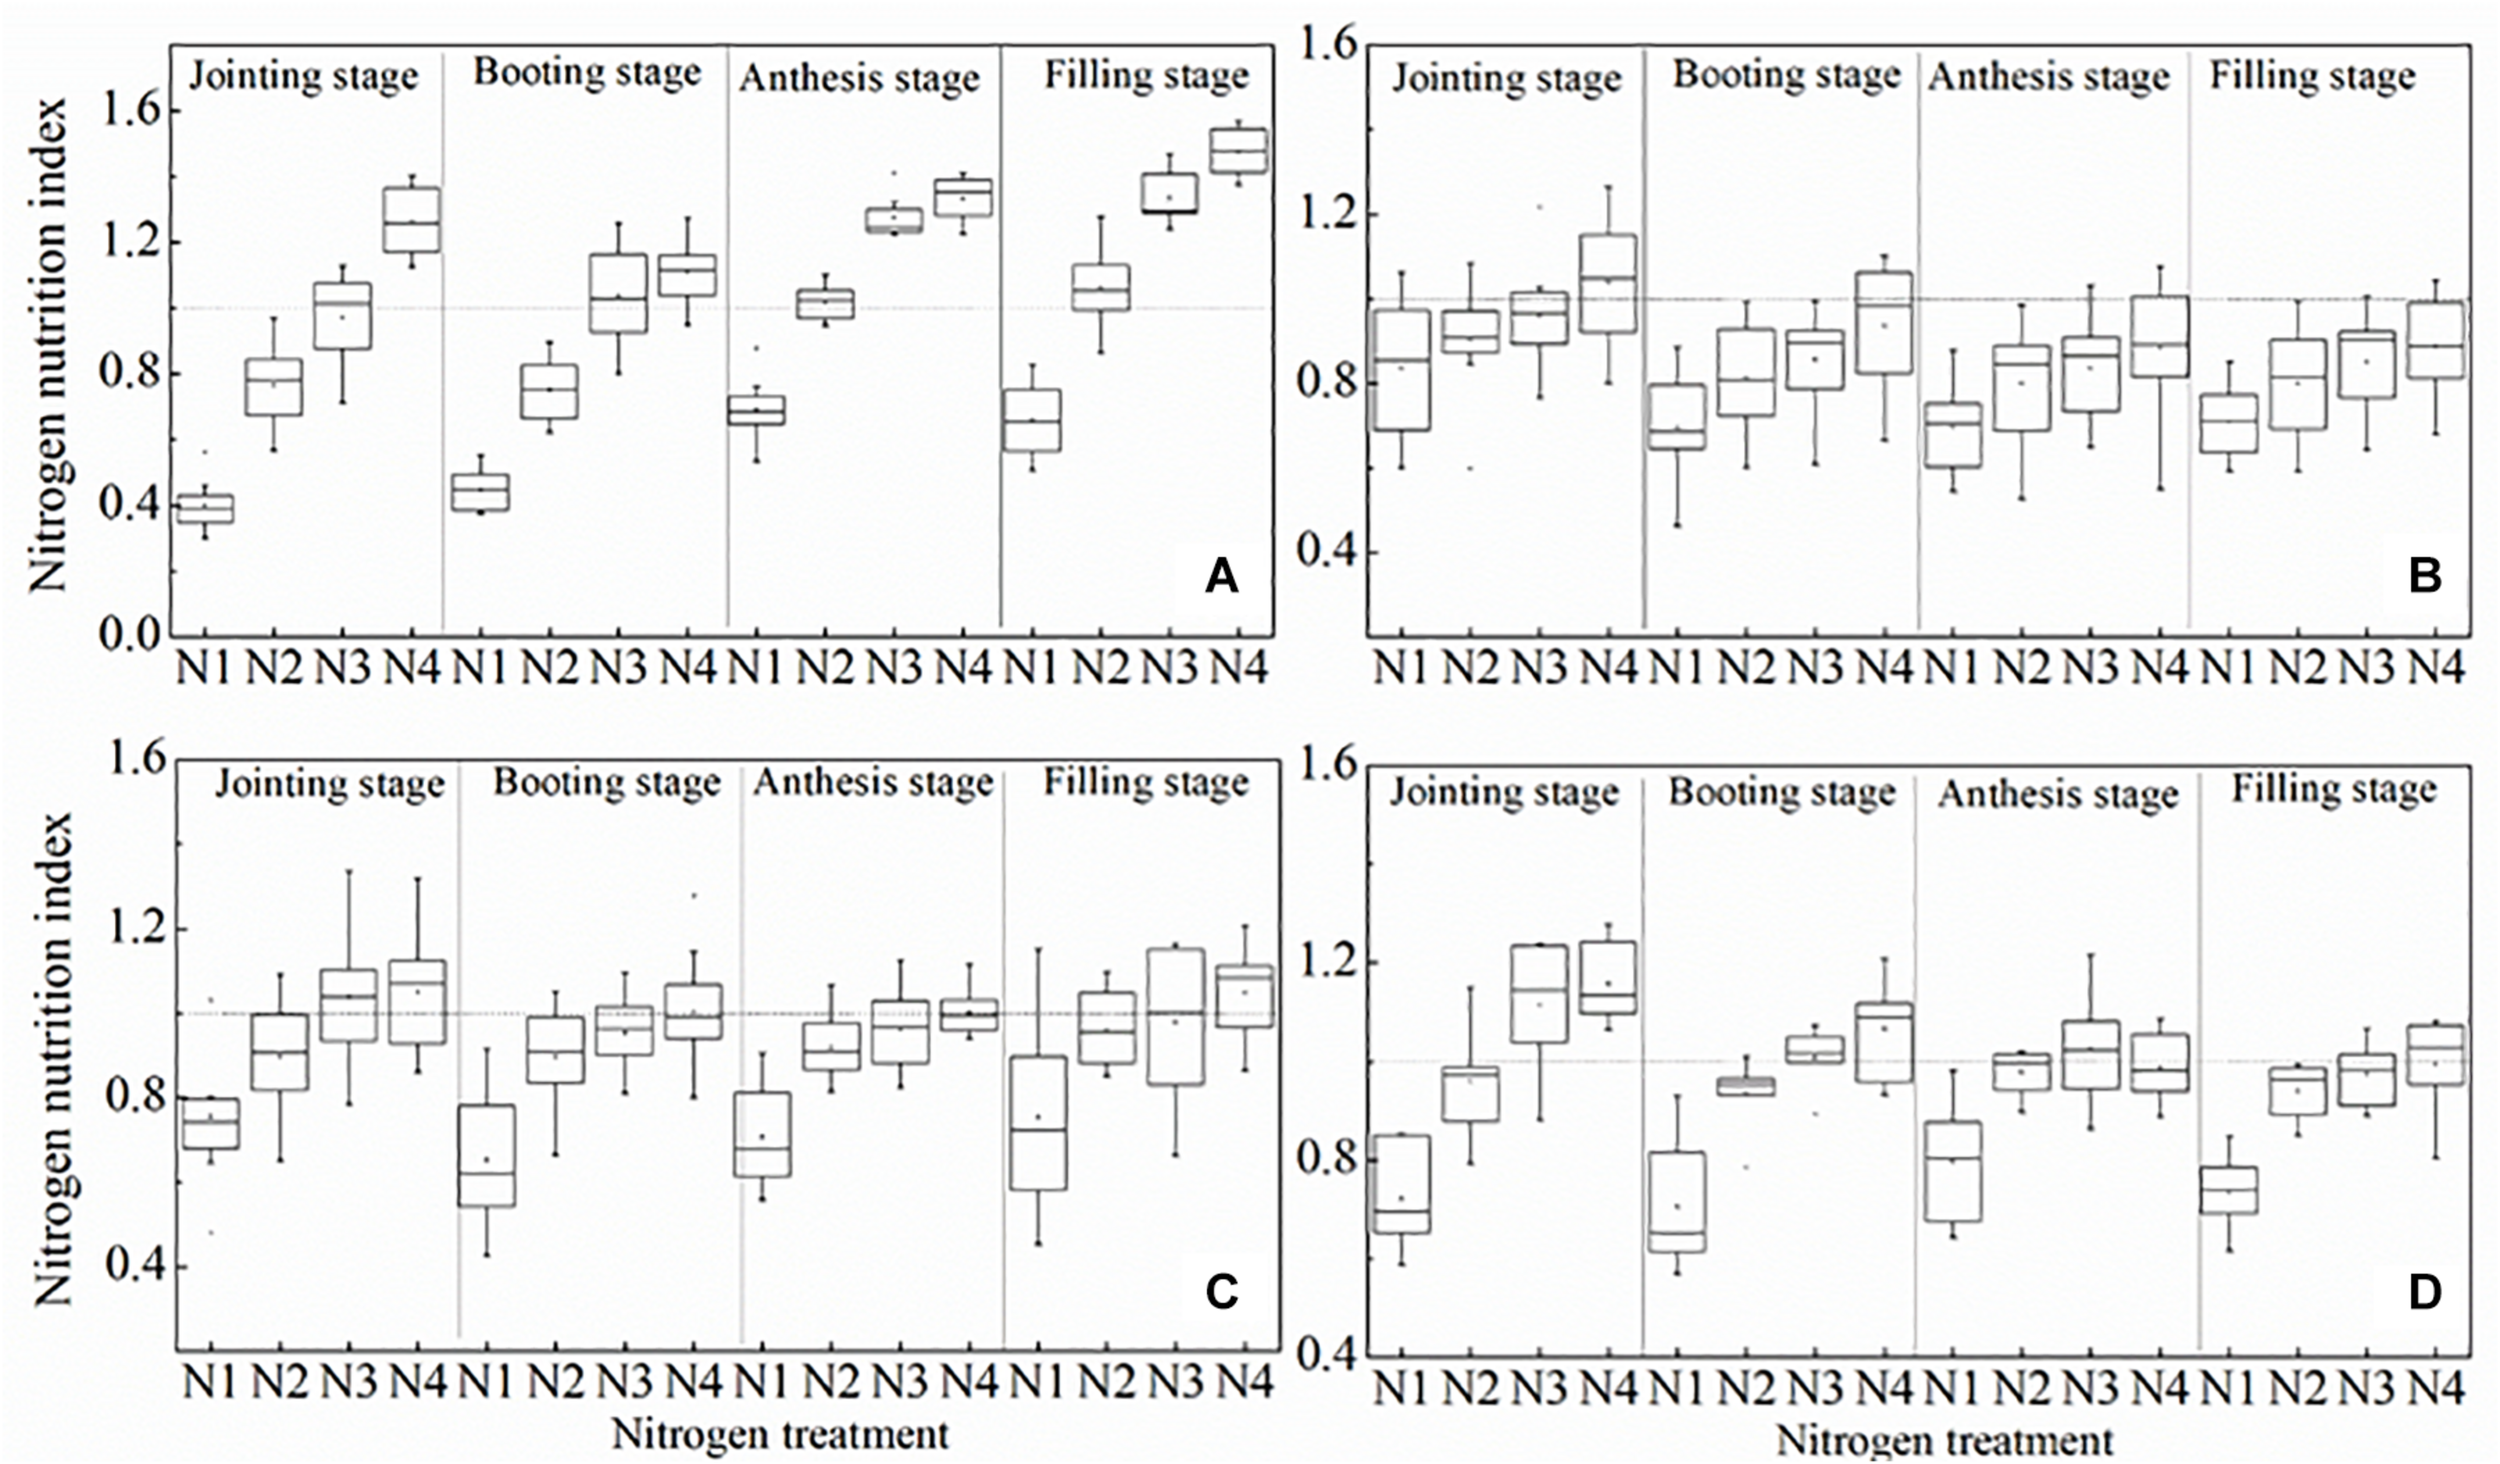
Changes in the N nutrition index on mNc dilution curve at different growth period. (A) 2012 ∼ 2013, (B) 2013 ∼ 2014, (C) 2014 ∼ 2015, (D) 2015 ∼ 2016.
Since the mNc dilution model, employs more parameters than the standard methodology, the AIC was calculated to assess differences in terms of how concise the models are considering the number of parameters (Table 4). The results showed that the AIC index of mNc dilution model was lower than standard Nc dilution model, even after additional input variables were added in the mNc dilution model, which further confirmed that the mNc dilution model is a more efficient model in addition to being a better predictor for different irrigation rates than the standard Nc dilution model.
TABLE 4
| SSe | K | L | AIC | |
| Nc | 19.25 | −186.86 | 2 | 3.43 |
| mNc | 9.311 | −146.92 | 4 | 2.74 |
Predicting AIC value of Nc and mNc for winter wheat.
Discussion
Critical Nitrogen Dilution Curves in Wheat
The standard Nc dilution curve of winter wheat was expressed using the negative power relationship between AGB and PNC in this paper. The developing morphology of tissues and organs, the N proportion and the internal physiological mechanisms of winter wheat at different growth stages may result in declining PNC (Kage et al., 2002). Figure 9 showed the contribution of dry stem matter toward total plant dry matter is significantly higher than that of leaf dry matter. The main components of winter wheat stems are carbohydrates such as cellulose, hemicellulose, and lignin, which results in a lower N concentration in stems. The stem standard Nc dilution curve and the plant standard Nc dilution curve are shown in Figure 9A. Similar results were achieved by Ata-Ul-Karim et al. (2014a), when they analyzed the crop model of rice stems and plant standard Nc. Future studies will consider the ratio of carbon and N and material distribution in plants to further explore the standard Nc dilution curve.
FIGURE 9
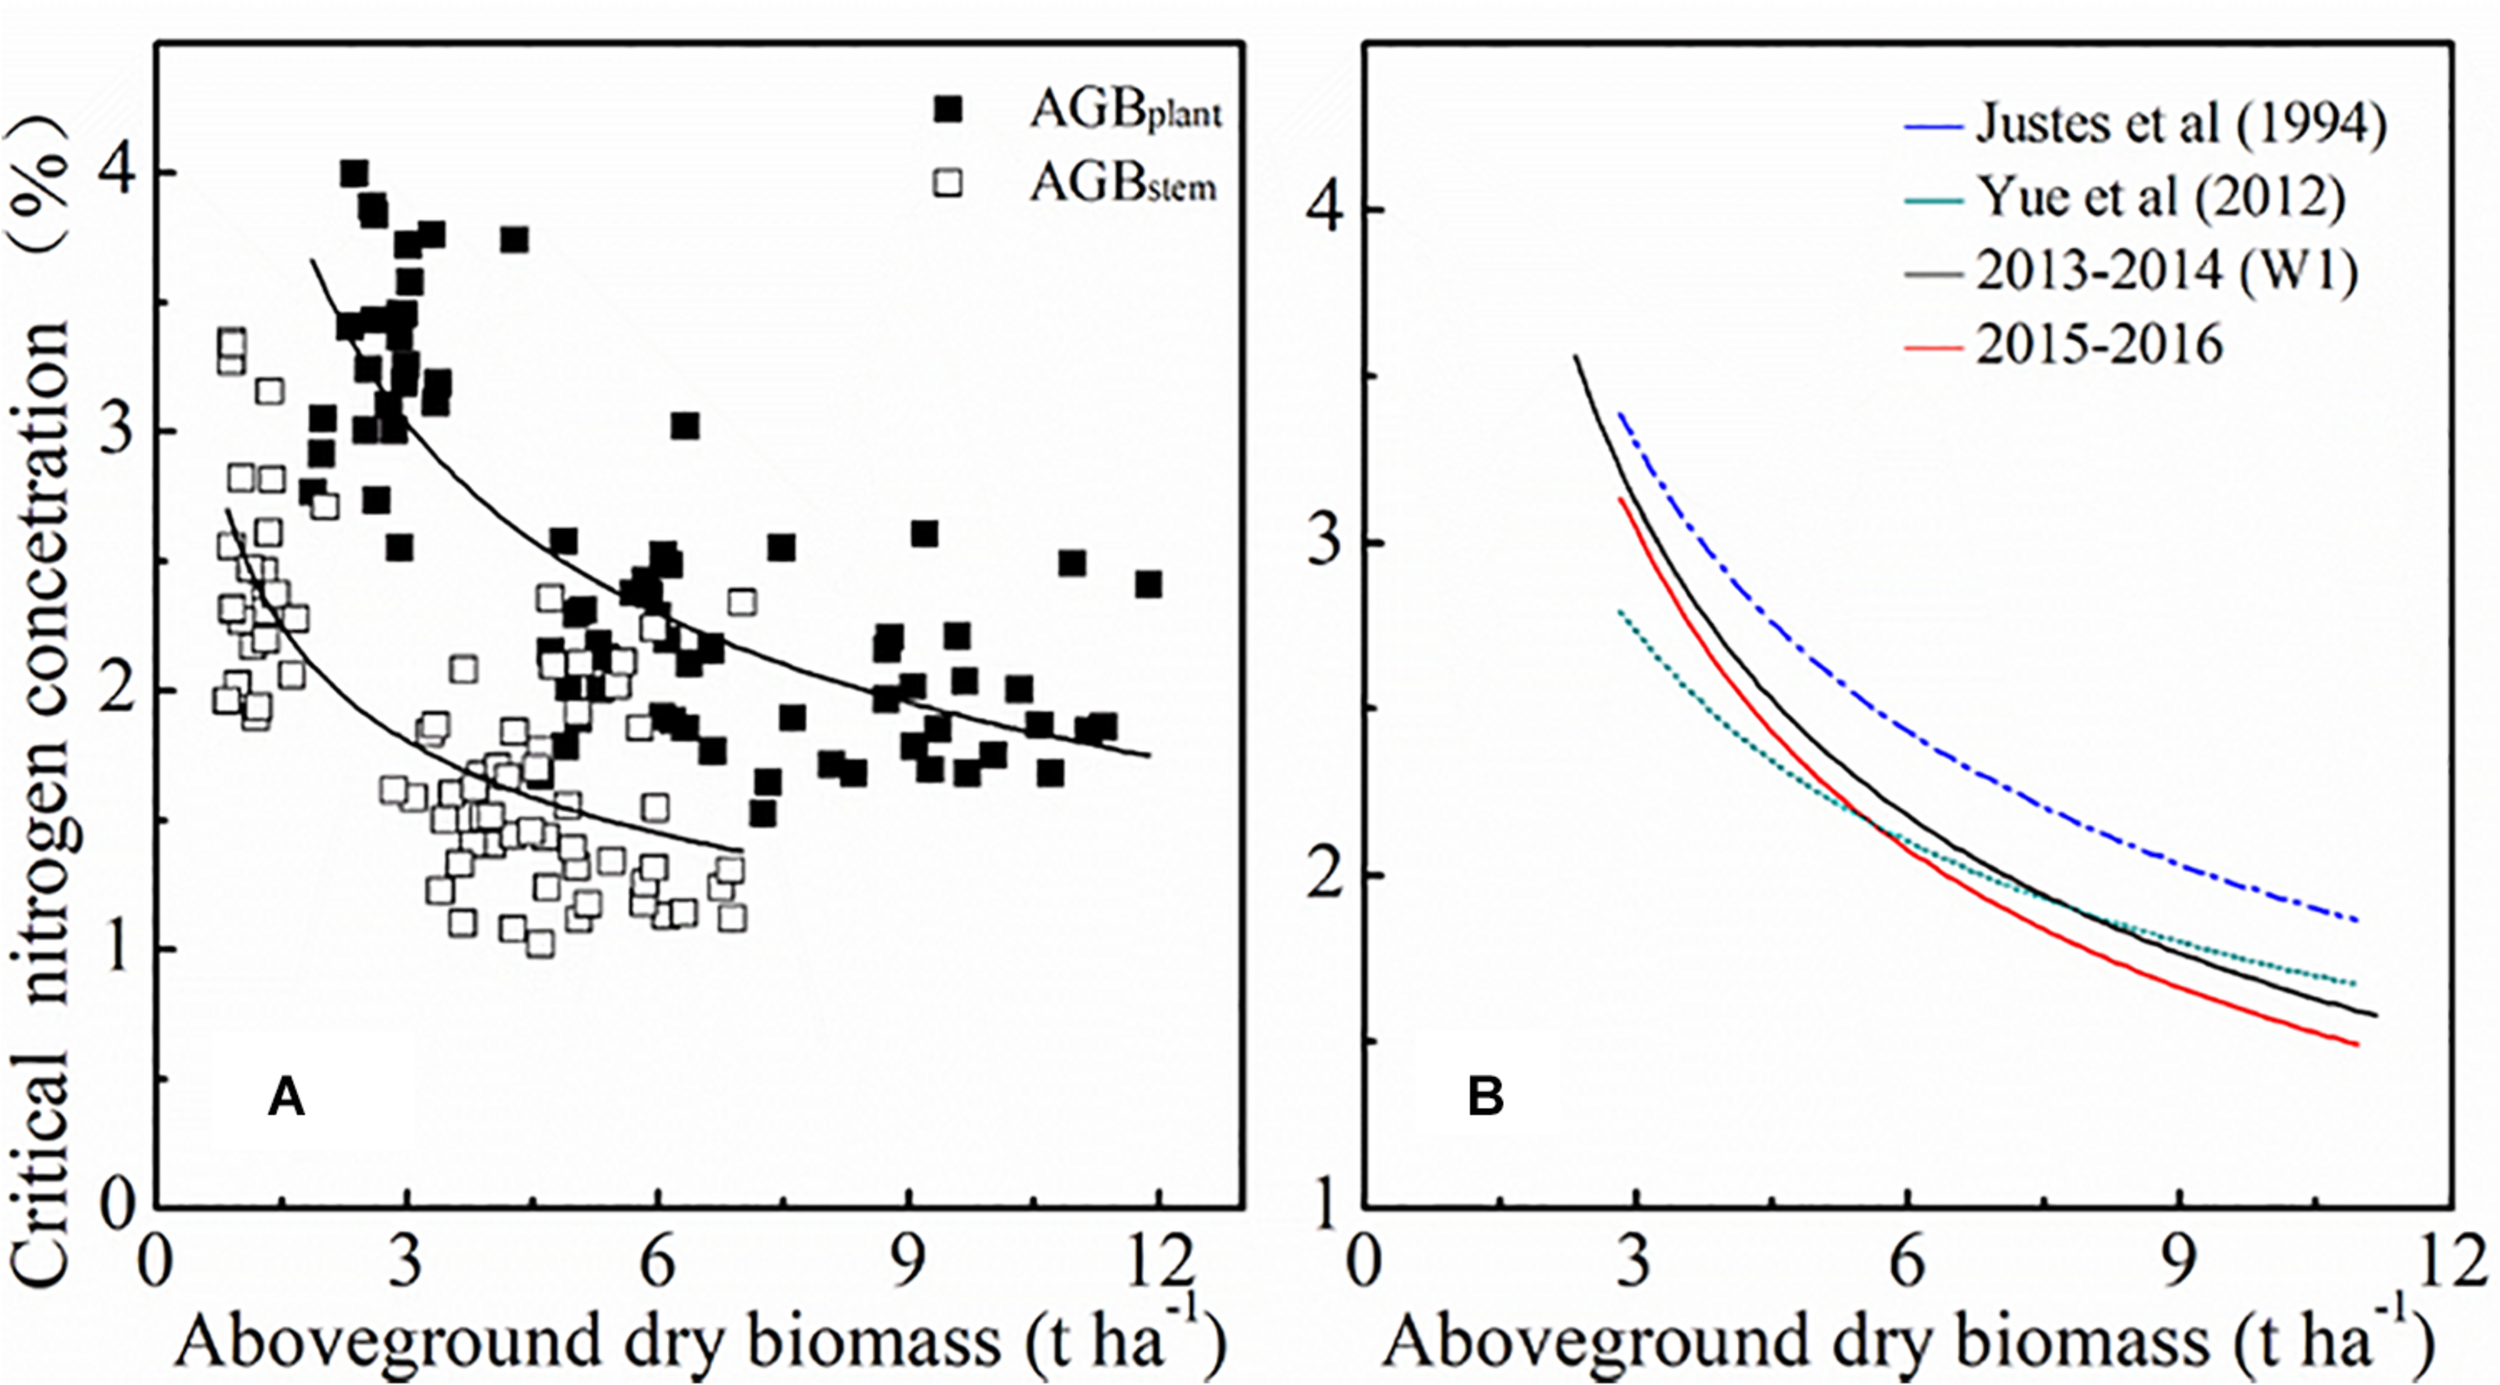
Comparison of standard Nc dilution curves for different plant organs (A) and produced by different studies (B). Blue line represents the standard Nc dilution curve of Justes et al. (1994) (Nc=535×AGB0.44). Brown line represents the standard Nc dilution curve of Yue et al. (2012) (Nc=4.15×AGB–0.38). Black line represents the standard Nc dilution curve of the current study [2013 ∼ 2014 (Wl): Nc=5.35×AGB–0.53]. Red line represents the standard Nc dilution curve of the current study (2014 ∼ 2015: Nc=5.30×AGB–0.50).
The parameters of the standard Nc dilution curve under local irrigation management established in this paper were different from those of predecessors, as shown in Figure 9B. The standard Nc dilution curves in the current study were lower than that of Justes et al. (1994). The reasons for this discrepancy could be related to a relatively longer growing period and more favorable weather conditions (lower spring temperature and more rainfall) in Europe. Higher temperatures will reduce the growth days, which give winter wheat less time to accumulate N in AGB. However, the standard Nc dilution curves in this study were similar to the curve constructed by Yue et al. (2012). In that study, the two experimental sites were both located in the North China Plain which has a continental monsoon climate. Therefore, climatic conditions may possibly explain some differences in standard Nc dilution curves. The standard Nc dilution curve in this study was constructed for different irrigation rates, varieties, and N rates. In future studies, more dataset from different ecological sites should be introduced to improve the universality of the model.
The mNc Dilution Curve for Winter Wheat Based on HLM Model
Figure 3A showed that the standard Nc value at the same biomass level was different under different treatments. In this study, the effects of irrigation and N rates on standard Nc dilution curves were analyzed using rain-fed, moderate, and excessive irrigation treatments, but the effects of water on the internal structure and physiological mechanisms of crops were not investigated. Subsequent studies may further explore the duration of irrigation, irrigation frequency, and irrigation gradient. Based on the above results, standard Nc value was affected not only by N rates, but also by irrigation rates. The standard Nc dilution model (Figure 4B) overestimated Nc value for the 2013 ∼ 2014 rainfed (W0) condition, but underestimated predicted Nc value in 2012 ∼ 2013. The Nc dilution curves constructed in this paper under different irrigation conditions were all a negative power type, but there were some differences among the parameters. Parameter “a” and “b” under different treatment were dissimilar. As shown in Figure 5B, the parameter “a” of different management had a significant difference. There was no significant difference for parameter “b” under most treatments. Therefore, different management was shown to affect mainly parameter “a”. The reason for the above results maybe that parameter “a” represents standard Nc for 1 t AGB ha–1. This biomass value might be occurring at different stages for different irrigation treatments. Instead, parameter “b” is a statistical parameter governing the slope of the relationship (Ziadi et al., 2008). While an appropriate level of irrigation is conducive to improving N absorption rate, excessive irrigation accelerates N leaching and reduces fertilizer efficiency (Sandhu et al., 2000). Therefore, this paper argues that the standard Nc dilution curve could be inaccurate for field management under the coupling effect of water and N fertilizer. The validation results in this paper also proved these problems.
This paper proposed a standard mNc dilution model under different N and irrigation management using different agronomic variables. Plant water provides a medium for enzymatic reactions and is also the raw material of photosynthesis. Plant water directly or indirectly affects the accumulation of plant material (Evans, 1989). In addition, LAI has a strong correlation with photosynthesis and respiration. Ata-Ul-Karim et al. (2014b) demonstrated that the Nc dilution curve as a function of LAI efficiently identified the N-limiting and non-N-limiting conditions. In addition, through the analysis of variance of multiple factors, different irrigation and fertilization treatments have a significant influence on LAI, but not on PWC. These results were similar to the results of significant differences of parameter “a” and parameter “b.” Therefore, it is feasible to express parameter “a” and parameter “b” using PWC and LAI, respectively. Both parameters are affected concurrently by water and N and show a decline ontogenically (Thornton et al., 1999), so they have a strong interaction with the critical dilution curve. However, in the present work they turned out to be useful for the improvement of the estimation of the mNc dilution curve across years and experiments. Moreover LAI and PWC can be readily estimated from remote sensing (Ceccato et al., 2001; Upreti et al., 2019), it has great potential in promoting large-scale N status monitoring.
The accuracy of nitrogen diagnosis is vital to improve N use efficiency. The mNc dilution model created in this study has more advantages in N diagnosis than standard LAI dilution model. In this paper, C3 crop, which has different N metabolism pathway and characteristics from C4 crop (Oaks, 1994; Bräutigam et al., 2014), the standard Nc dilution curves of C3 and C4 counstructed by Greenwood et al. (1990) also had significant differences. In order to improve N use efficiency, it is necessary to further construct mNc dilution curve by combining N absorption, transport and signal transduction functions and regulatory mechanisms. This study was based on field-scale agronomic data for analysis and verification and did not address mNc dilution curve over considerable areas. In order to establish a real-time, widely-applicable LAI diagnosis model, an appropriate N diagnosis model should be established under multiple cultivation modes, data sources, and scales.
Conclusion
The accuracy of nitrogen diagnosis is vital to improve nitrogen utilization efficiency. It was shown that the standard LAI dilution curve could not be accurate across year under variable irrigation regimes. The PWC and LAI could be used to modify the standard Nc dilution curve by integrating the effect of water and N fertilizer. Under different management conditions, parameter “a” is more affected than “b.” The mNc dilution curve considers different treatments and is represented by the equation mNc = a×AGB−b, where a = 2.09 × PWC + 3.24, b = −0.02 × LAI + 0.51, with R2 and nRMSE of 0.79 and 0.13, respectively. We conclude that the N diagnostic approach developed in the present study provides a new procedure and an easy alternative tool to assess plant N status for guiding precision N management during the vegetative growth period.
Statements
Data availability statement
The raw data supporting the conclusions of this article will be made available by the authors, without undue reservation.
Author contributions
YZ, ZL, and WY conceived, designed, and performed the experiments and analyzed the data. YZ, ZL, WY, PC, and GY discussed and drafted the manuscript. YZ, XX, JW, HF, and RC revised the manuscript and edited the English language. All authors read and approved the final version.
Funding
This study was supported by the earmarked fund for China Agriculture Research System (CARS-03), the National Key Research and Development Program (Grant Nos. 2017YFD0201501 and 2016YFD0300609), and Beijing Outstanding Talents Program (Grant No. 2017000020060G128).
Conflict of interest
The authors declare that the research was conducted in the absence of any commercial or financial relationships that could be construed as a potential conflict of interest.
Supplementary material
The Supplementary Material for this article can be found online at: https://www.frontiersin.org/articles/10.3389/fpls.2020.549636/full#supplementary-material
Footnotes
References
1
Ata-Ul-Karim S. T. Yao X. Liu X. Cao W. Zhu Y. (2014a). Determination of critical nitrogen dilution curve based on stem dry matter in rice.PLoS One9:e104540. 10.1371/journal.pone.0104540
2
Ata-Ul-Karim S. T. Zhu Y. Yao X. Cao W. (2014b). Determination of critical nitrogen dilution curve based on leaf area index in rice.Field Crops Res.16776–85. 10.1016/j.fcr.2014.07.010
3
Bartholomeus H. (1987). Model selection and Akaike’s Information criterion (AIC): the general theory and its analytical extensions.Psychometrika52345–370. 10.1007/bf02294361
4
Bowman W. D. (1989). The relationship between leaf water status, gas exchange, and spectral reflectance in cotton leaves.Remote Sens. Environ.30249–255. 10.1016/0034-4257(89)90066-7
5
Bräutigam A. Schliesky S. Külahoglu C. Osborne C. P. Weber A. P. M. (2014). Towards an integrative model of C4 photosynthetic subtypes: insights from comparative transcriptome analysis of NAD-ME, NADP-ME, and PEP-CK C4 species.J. Exp. Bot.65:3579. 10.1093/jxb/eru100
6
Cassman K. G. (1999). Ecological intensification of cereal production systems: yield potential, soil quality, and precision agriculture.Proc. Natl. Acad. Sci. U.S.A.965952–5959. 10.1073/pnas.96.11.5952
7
Caviglia O. P. Melchiori R. J. M. Sadras V. O. (2014). Nitrogen utilization efficiency in maize as affected by hybrid and N rate in late-sown crops.Field Crops Res.16827–37. 10.1016/j.fcr.2014.08.005
8
Ceccato P. Flasse S. Tarantola S. Jacquemoud S. Grégoire J. M. (2001). Detecting vegetation leaf water content using reflectance in the optical domain.Remote Sens. Environ.7722–33. 10.1016/s0034-4257(01)00191-2
9
Chakraborty A. Datta G. S. Mandal A. (2018). Robust hierarchical bayes small area estimation for the nested error linear regression model.Int. Stat. Rev.871–19.
10
Cohen Y. Alchanatis V. Meron M. Saranga Y. Tsipris J. (2005). Estimation of leaf water potential by thermal imagery and spatial analysis.J. Exp. Bot.561843–1852. 10.1093/jxb/eri174
11
Donovan L. Linton M. Richards J. (2001). Predawn plant water potential does not necessarily equilibrate with soil water potential under well-watered conditions.Oecologia129328–335. 10.2307/4223091
12
Dordas C. A. (2011). Nitrogen nutrition index and its relationship to N use efficiency in linseed.Eur. J. Agron.34124–132. 10.1016/j.eja.2010.11.005
13
Errecart P. M. Agnusdei M. G. Lattanzi F. A. Marino M. A. Berone G. D. (2014). Critical nitrogen concentration declines with soil water availability in tall fescue.Crop Sci.54318–330. 10.2135/cropsci2013.08.0561
14
Evans J. R. (1989). Photosynthesis and nitrogen relationships in leaves of C?Plants. Oecologia789–19. 10.2307/4218825
15
FAO (2015). World Fertilizer Trends and Outlook to 2018.Rome: Food and Agriculture Organization of United Nations.
16
Gaju O. Allard V. Martre P. Le Gouis J. Moreau D. Bogard M. et al (2014). Nitrogen partitioning and remobilization in relation to leaf senescence, grain yield and grain nitrogen concentration in wheat cultivars.Field Crops Res.155213–223. 10.1016/j.fcr.2013.09.003
17
Greenwood D. J. Lemaire G. Gosse G. Cruz P. Draycott A. Neeteson J. J. (1990). Decline in percentage N of C3 and C4 crops with increasing plant mass.Ann. Bot.66425–436. 10.1093/oxfordjournals.aob.a088044
18
Hebblewhite M. Merrill E. (2008). Modelling wildlife-human relationships for social species with mixed-effects resource selection models.J. Appl. Ecol.45834–844. 10.2307/20144037
19
Huang S. Miao Y. Cao Q. Yao Y. Zhao G. Yu W. et al (2018). A new critical nitrogen dilution curve for rice nitrogen status diagnosis in Northeast China.Pedosphere28814–822. 10.1016/s1002-0160(17)60392-8
20
Huang S. Yuxin M. Guangming Z. Fei Y. Xiaobo M. Chuanxiang T. et al (2015). Satellite remote sensing-based in-season diagnosis of rice nitrogen status in Northeast China.Remote Sens.710646–10667. 10.3390/rs70810646
21
Hunt E. R. Rock B. N. (1989). Detection of changes in leaf water content using Near- and Middle-Infrared reflectances.Remote Sens. Environ.3043–54. 10.1016/0034-4257(89)90046-1
22
Idso S. B. Jackson R. D. Pinter P. J. Reginato R. J. Hatfield J. L. (1981). Normalizing the stress-degree-day parameter for environmental variability.Agric. Meteorol.2445–55. 10.1016/0002-1571(81)90032-7
23
Justes E. Mary B. Jean-Marc M. Machet J. M. Huché-Thélier L. (1994). Determination of a critical nitrogen dilution curve for winter wheat Crops.Ann. Bot.74397–407. 10.1006/anbo.1994.1133
24
Kage H. Alt C. Stützel H. (2002). Nitrogen concentration of cauliflower organs as determined by organ size, n supply, and radiation environment.Plant Soil246201–209.
25
Kunrath T. R. Lemaire G. Sadras V. O. Gastal F. (2018). Water use efficiency in perennial forage species: interactions between nitrogen nutrition and water deficit.Field Crops Res.2221–11. 10.1016/j.fcr.2018.02.031
26
Kuo M. Mohler B. Raudenbush S. L. Earls F. J. (2000). Assessing exposure to violence using multiple informants: application of hierarchical linear model.J. Child Psychol. Psychiatry All. Discipl.411049–1056. 10.1111/1469-7610.00692
27
Lemaire G. Meynard J. M. (1997). “Use of the nitrogen nutrition index for the analysis of agronomical data,” in Diagnosis of the Nitrogen Status in Crops, ed.LemaireG. (Berlin: Springer).
28
Li Z. Taylor J. Yang H. Casa R. Jin X. Li Z. et al (2020). A hierarchical interannual wheat yield and grain protein prediction model using spectral vegetative indices and meteorological data.Field Crops Res.248:107711. 10.1016/j.fcr.2019.107711
29
Lininger M. Spybrook J. Cheatham C. C. (2015). Hierarchical linear model: thinking outside the traditional repeated-measures analysis-of-variance box.J. Athletic Train.50438–441. 10.4085/1062-6050-49.5.09
30
Meron M. Grimes D. W. Phene C. J. Davis K. R. (1987). Pressure chamber procedures for leaf water potential measurements of cotton.Irrigation Sci.8215–222. 10.1007/BF00259382
31
Oaks A. (1994). Efficiency of nitrogen utilization in C3 and C4 Cereals.Plant Physiol.106407–414. 10.1104/pp.106.2.407
32
Pandey R. K. Maranville J. W. Admou A. (2000). Deficit irrigation and nitrogen effects on maize in a Sahelian environment_ I. Grain yield and yield components.Agric. Water Manag.461–13. 10.1016/s0378-3774(00)00073-1
33
Poli P. Healy S. B. Dee D. P. (2010). Assimilation of Global Positioning System radio occultation data in the ECMWF ERA–Interim reanalysis.Q. J. R. Meteorol. Soc.1361972–1990. 10.1002/qj.722
34
Qu S. Li Z. Qiu C. Yang G. Song X. Chen Z. et al (2017). Remote sensing prediction of winter wheat grain protein content based on nitrogen nutrition index at anthesis stage.Nongye Gongch. Xuebao Trans. Chin. Soc. Agric. Eng.33186–193. 10.11975/j.issn.1002-6819.2017.12.024
35
Ratjen A. M. Kage H. (2016). Modelling N and dry matter partitioning between leaf and stem of wheat under varying N Supply.J. Agron. Crop Sci.202576–586. 10.1111/jac.12180
36
Reis S. Bekunda M. Howard C. M. Karanja N. Winiwarter W. Yan X. et al (2016). Synthesis and review: tackling the nitrogen management challenge: from global to local scales.Environ. Res. Lett.11:120205. 10.1088/1748-9326/11/12/120205
37
Rong W. Nong L. Y. (2017). Growth and nitrogen nutrition diagnosis of winter wheat under different water and nitrogen conditions.Water Saving Irrigat.27–32.
38
Sandhu K. S. Arora V. K. Chand R. Sandhu B. S. Khera K. L. (2000). Optimizing time distribution of water supply and fertilizer nitrogen rates in relation to targeted wheat yields.Exp. Agric.36115–125. 10.1017/s0014479700361105
39
Thornton B. Lemaire G. Millard P. Duff E. I. (1999). Relationships between nitrogen and water concentration in shoot tissue of Molinia caerulea during shoot development.Ann. Bot.83631–636. 10.3390/rs11050481
40
Upreti D. Huang W. Kong W. Pascucci S. Pignatti S. Zhou X. et al (2019). A comparison of hybrid machine learning algorithms for the retrieval of wheat biophysical variables from Sentinel-2.Remote Sens.11:481.
41
Veysi S. Naseri A. A. Hamzeh S. Bartholomeus H. (2017). A satellite based crop water stress index for irrigation scheduling in sugarcane fields.Agric. Water Manag.18970–86. 10.1016/j.agwat.2017.04.016
42
Wang H. Wu L. Cheng M. Fan J. Zhang F. Zou Y. et al (2018). Coupling effects of water and fertilizer on yield, water and fertilizer use efficiency of drip-fertigated cotton in northern Xinjiang. China.Field Crops Res.219169–179. 10.1016/j.fcr.2018.02.002
43
Wang Y. Fu D. Pan L. Sun L. Ding Z. (2015). The coupling effect of water and fertilizer on the growth of tea plants (Camellia sinensis (L.) O. Kuntz).J. Plant Nutr.39620–627. 10.1080/01904167.2015.1047521
44
Wei W. Yang M. Liu Y. Huang H. Ye C. Zheng J. et al (2018). Fertilizer N application rate impacts plant-soil feedback in a sanqi production system.Sci. Total Environ.633796–807. 10.1016/j.scitotenv.2018.03.219
45
Xu X. Teng C. Zhao Y. Du Y. Zhao C. Yang G. et al (2020). Prediction of wheat grain protein by coupling multisource remote sensing imagery and ECMWF Data.Remote Sens.12:1349. 10.3390/rs12081349
46
Xue L. Yang L. (2008). Recommendations for nitrogen fertiliser topdressing rates in rice using canopy reflectance spectra.Biosyst. Eng.100524–534. 10.1016/j.biosystemseng.2008.05.005
47
Yao X. Ata-Ul-Karim S. T. Zhu Y. Tian Y. Cao W. (2014). Development of critical nitrogen dilution curve in rice based on leaf dry matter.Eur. J. Agron.5520–28. 10.1016/j.eja.2013.12.004
48
Yue S. Meng Q. Zhao R. Li F. Chen X. Zhang F. et al (2012). Critical nitrogen dilution curve for optimizing nitrogen management of winter wheat production in the North China Plain.Agron. J.104523–529. 10.2134/agronj2011.0258
49
Zadoks J. C. Chang T. T. Konzak C. F. (1974). A decimal code for the growth stages of cereals.Weed Res.14415–421. 10.1111/j.1365-3180.1974.tb01084.x
50
Zhao B. Tahir A.-U.-K. S. Xia Y. YongChao T. WeiXing C. Yan Z. et al (2016). A new curve of critical nitrogen concentration based on spike dry matter for winter Wheat in Eastern China.PLoS One11:e0164545. 10.1371/journal.pone.0164545
51
Zhao Z. Wang E. Wang Z. Zang H. Liu Y. Angus J. F. (2014). A reappraisal of the critical nitrogen concentration of wheat and its implications on crop modeling.Field Crops Res.16465–73. 10.1016/j.fcr.2014.05.004
52
Ziadi N. Bélanger G. Claessens A. Lefebvre L. Cambouris A. N. Tremblay N. et al (2010). Determination of a critical nitrogen dilution curve for spring Wheat.Agron. J.102241–250. 10.2134/agronj2009.0266
53
Ziadi N. Brassard M. Bélanger G. Cambouris A. N. Tremblay N. Nolin M. C. et al (2008). Critical nitrogen curve and nitrogen nutrition index for corn in Eastern Canada.Agron. J.78355–364. 10.2134/agronj2007.0059
Summary
Keywords
water and nitrogen coupling effect, nitrogen nutrition index, plant water content, hierarchical linear model, modified critical nitrogen dilution curve
Citation
Zhao Y, Chen P, Li Z, Casa R, Feng H, Yang G, Yang W, Wang J and Xu X (2020) A Modified Critical Nitrogen Dilution Curve for Winter Wheat to Diagnose Nitrogen Status Under Different Nitrogen and Irrigation Rates. Front. Plant Sci. 11:549636. doi: 10.3389/fpls.2020.549636
Received
07 April 2020
Accepted
16 September 2020
Published
21 October 2020
Volume
11 - 2020
Edited by
Susanne Schmidt, The University of Queensland, Australia
Reviewed by
Jan Schripsema, Darcy Ribeiro State University of the North of the State of Rio de Janeiro, Brazil; Ralf Uptmoor, University of Rostock, Germany
Updates
Copyright
© 2020 Zhao, Chen, Li, Casa, Feng, Yang, Yang, Wang and Xu.
This is an open-access article distributed under the terms of the Creative Commons Attribution License (CC BY). The use, distribution or reproduction in other forums is permitted, provided the original author(s) and the copyright owner(s) are credited and that the original publication in this journal is cited, in accordance with accepted academic practice. No use, distribution or reproduction is permitted which does not comply with these terms.
*Correspondence: Zhenhai Li, lizh323@126.comWude Yang, sxauywd@126.com
This article was submitted to Plant Physiology, a section of the journal Frontiers in Plant Science
Disclaimer
All claims expressed in this article are solely those of the authors and do not necessarily represent those of their affiliated organizations, or those of the publisher, the editors and the reviewers. Any product that may be evaluated in this article or claim that may be made by its manufacturer is not guaranteed or endorsed by the publisher.