 Yongtan Li
 Yan Dong
 Yichao Liu
 Xiaoyue Yu
 Minsheng Yang
 Yinran Huang
- 1Forest Department, Forestry College, Hebei Agricultural University, Baoding, China
- 2Hebei Key Laboratory for Tree Genetic Resources and Forest Protection, Baoding, China
- 3Institute of Landscaping, Hebei Academic of Forestry and Grassland, Shijiazhuang, China
In this study, we assembled and annotated the chloroplast (cp) genome of the Euonymus species Euonymus fortunei, Euonymus phellomanus, and Euonymus maackii, and performed a series of analyses to investigate gene structure, GC content, sequence alignment, and nucleic acid diversity, with the objectives of identifying positive selection genes and understanding evolutionary relationships. The results indicated that the Euonymus cp genome was 156,860–157,611bp in length and exhibited a typical circular tetrad structure. Similar to the majority of angiosperm chloroplast genomes, the results yielded a large single-copy region (LSC) (85,826–86,299bp) and a small single-copy region (SSC) (18,319–18,536bp), separated by a pair of sequences (IRA and IRB; 26,341–26,700bp) with the same encoding but in opposite directions. The chloroplast genome was annotated to 130–131 genes, including 85–86 protein coding genes, 37 tRNA genes, and eight rRNA genes, with GC contents of 37.26–37.31%. The GC content was variable among regions and was highest in the inverted repeat (IR) region. The IR boundary of Euonymus happened expanding resulting that the rps19 entered into IR region and doubled completely. Such fluctuations at the border positions might be helpful in determining evolutionary relationships among Euonymus. The simple-sequence repeats (SSRs) of Euonymus species were composed primarily of single nucleotides (A)n and (T)n, and were mostly 10–12bp in length, with an obvious A/T bias. We identified several loci with suitable polymorphism with the potential use as molecular markers for inferring the phylogeny within the genus Euonymus. Signatures of positive selection were seen in rpoB protein encoding genes. Based on data from the whole chloroplast genome, common single copy genes, and the LSC, SSC, and IR regions, we constructed an evolutionary tree of Euonymus and related species, the results of which were consistent with traditional taxonomic classifications. It showed that E. fortunei sister to the Euonymus japonicus, whereby E. maackii appeared as sister to Euonymus hamiltonianus. Our study provides important genetic information to support further investigations into the phylogenetic development and adaptive evolution of Euonymus species.
Introduction
Chloroplasts (cps) are ubiquitous in plants and originate from symbiotic cyanobacteria (Jin and Daniell, 2015; Gao et al., 2019) with independent genomes and evolutionary routes. It plays important roles in energy conversion, photosynthesis, and the synthesis of fatty acids, chlorophyll, carotene, amino acids, starch, and other compounds (Neuhaus and Emes, 2000; Jensen, 2013). Plant photosynthesis is strictly controlled by heredity, so understanding the gene function and phylogenetic relationships of cp genomes is critical to understanding the origin and evolution of organelles, and has applications in crop improvement and enhancing photosynthetic efficiency (Zhao et al., 2019). The cp genome is mostly a quadripartite structure comprising one large single-copy region (LSC), one small single-copy region (SSC), and two reverse repeats (Abdullah et al., 2019a; Mehmood et al., 2020). However, linear cp genomes have been reported (Oldenburg and Bendich, 2015). Despite the cp genome is relatively conservative in terms of structure, gene order, and gene content (Shahzadi et al., 2019). Many mutational events often occur in cp genomes, including indels, substitutions, inversion, contraction, and expansion of inverted repeats and its effect on the number of genes such as gene loss, duplication, and pseudogenes (Abdullah et al., 2020a; Henriquez et al., 2020). Moreover, Sequence rearrangements have also been reported from various kinds of plants (Sun et al., 2017; Liu et al., 2018).
The Euonymus genus belonging to family Celastraceae comprises 220 species, including approximately 111 that occur in China (Lin et al., 2009; Duan and Zhang, 2019; Song et al., 2019a). Species in this genus exhibit rapid growth, tolerance of various light conditions, extreme pruning resistance, resistance to cold and salt, and high resistance to harmful gases, and have the capacity to improve soil and ecological conditions (Chen et al., 2015; Song et al., 2019b). Euonymus trees are characterized by attractive shapes and autumn foliage, brightly-colored fruits, and distinctive, winged branches, making them ideal ornamental plants. The morphologically diverse of Euonymus species make themselves to different horticultural applications. For example, Euonymus species can be planted alone or in rows, as greenbelts, hedgerows, or potted ornamental plants, and can be planted with other tree species; as a result, they are widely used in landscaping in both private gardens and public green spaces. The study of Euonymus cp genome is conducive to interspecific relationships, species identification research, plant breeding, resource conservation, development of molecular markers for DNA barcoding, and studies of phylogenetic evolution in Euonymus (Huang et al., 2014; Daniell et al., 2016; Zhang et al., 2017). It provides some reference value to make better use of them. Meanwhile, comparative analyses based on cp genome data can provide a more comprehensive interpretation of phylogenetic relationships than using only one or a few DNA fragments (Ruhfel et al., 2014). However, just a few cp genome of Euonymus species was sequenced at present. So we need to require more cp genome of Euoymus species resolving the phylogenetic relationships among Euonymus.
In this study, we sequenced, assembled and annotated the cp genomes of Euonymus fortunei, Euonymus phellomanus, and Euonymus maackii, and compared their sequences with related species including three Euonymus species and one Catha species from the NCBI. The objectives of this study were to provide whole chloroplast genome data for the three Euonymus species; to compare the genomic structure and sequence variation of the chloroplast genome among Euonymus species; to identify loci with suitable polymorphism for use in Euonymus species identification and phylogenetic studies; to identify positive selection genes as genes potentially contributing to the adaptive evolution of Celastrineae species; and to use data from various sources to construct an evolutionary tree elucidating the phylogenetic relationships in the genus Euonymus.
Materials and Methods
Plant Materials
In July 2019, fresh leaves of E. maackii, E. fortunei, and E. phellomanus were collected in Hengshui, Hebei Province, China. Leaves were preserved and sent to Beijing Medical Technology Co., Ltd. for chloroplast genome sequencing. Material from nine other Celastrineae species was obtained from the NCBI (Table 1), including four Celastraceae species (Euonymus japonicus, Euonymus hamiltonianus, Euonymus schensianus, and Catha edulis), three Ilexaceae species (Ilex paraguariensis, Ilex cornuta, and Ilex integra), one Pentaphylacaceae species (Pentaphylax euryoides), and one Staphyleaceae species (Tapiscia sinensis) for structural comparison and systematic genomic analysis. Moreover, the complete chloroplast genomes of Ampelopteris elegans was also obtained as outgroup.
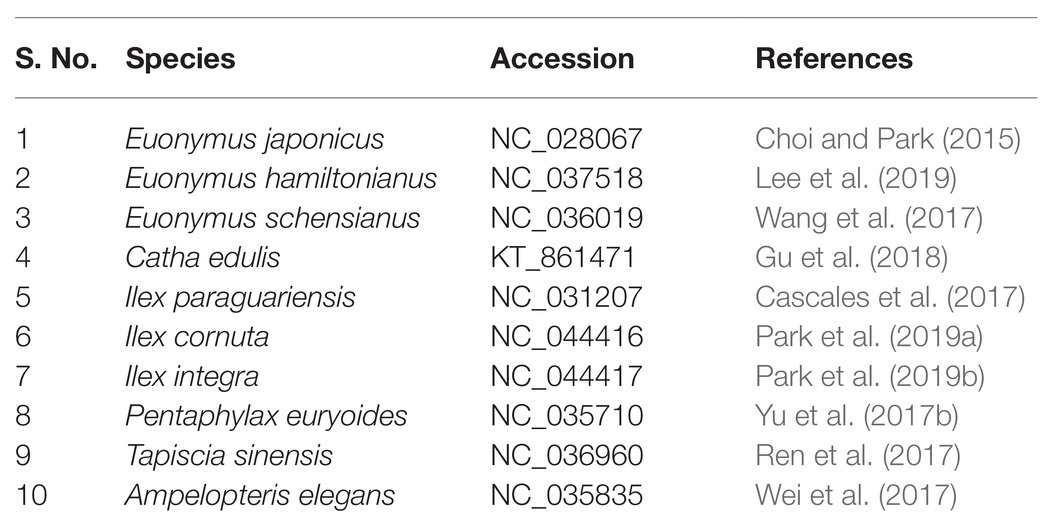
Table 1. Chloroplast (cp) genomes of species along with their NCBI accessions numbers used in the analysis.
Sequencing, Genome Assembly, and Annotation
Total DNA of fresh young leaves was extracted using a plant DNA extraction kit (TIANGEN Biotech, Beijing, China). Based on the quality, integrity, and concentration of the extracted DNA, the Illumina HiSeq PE150 double-end sequencing strategy was used to build the library. Then FastQC was used to evaluate raw read quality and then raw reads were filtered by removing low-quality reads at the cutoff of Q20 using Trimmomatic (Bolger et al., 2014) to obtain clean reads. GetOrganelle1 was used to assemble the plastid genome sequence by selecting 15 million reads from the dataset of clean reads. Both our newly acquired plastid genomes and the downloaded plastid genomes from NCBI website were annotated using the online annotation tool GeSeq (Tillich et al., 2017). All the annotations were manually curated. In addition, we used HMMER (Wheeler and Eddy, 2013) and ARAGORN Version 1.2.38 (Laslett and Canback, 2004) to ensure the prediction accuracy of the encoded protein and RNA genes, respectively. Finally, the resulting plastid genome maps were drawn with Chloroplot (Zheng et al., 2020).
Indices of Codon Usage
CodonW 1.4.42 (Peden, 2000) was used to evaluate gene codon usage. Five indices, namely, the codon adaptation index (CAI), codon bias index (CBI), optimal codon frequency (FOP), GC content (GC3s), and effective codon number (ENC), were used to evaluate codon preference.
SSRs and Repeat Sequences Analysis
Simple-sequence repeats were analyzed using MISA (Thiel et al., 2003), with parameters set to 10, 5, 4, 3, 3, and 3 for mono-, di-, tri-, tetra-, penta-, and hexa-nucleotides, respectively. REPuter software (Kurtz et al., 2001) was used to identify forward (F), reverse (R), palindrome (P), and complementary (C) repeats in Celastraceae species that met the requirements of a minimum repeat size of 30bp and 90% or greater sequence identity (Hamming Distance = 3). Tandem Repeats Finder Version 4.04 (Benson, 1999) was used to detect tandem repeats, with parameters set to two for the alignment parameter match and seven for mismatches and indels.
Comparative Analysis of cp Genomes
The mVISTA program in LAGAN mode3 was used to compare the six Euonymus cp genomes using the E. phellomanus cp genome as a reference. DnaSP version 5.1 (Librado and Rozas, 2009) was used to calculate nucleotide variability (Pi) of the LSC, SSC, and IR regions among the six Euonymus species and loci with suitable polymorphism were identified for evolutionary analysis. The step size was set to 200bp and window length to 300bp. MUMmer 4.0 (Kurtz et al., 2004) was used for dot plot analysis. And IRscope (Amiryousefi et al., 2018) was used for the analyses of inverted repeat (IR) region contraction and expansion at the junctions of chloroplast genomes. Gene rearrangements were also observed based on collinear blocks using Geneious R8.1(Kearse et al., 2012) integrated Mauve alignment (Darling et al., 2004).
Ka/Ks and Positive Selection Analyses
To assess the impact of environmental pressures on the evolution of Celastrineae plants, we calculated the Ka/Ks ratios of the common single copy genes of all species. MAFFT Version 7.453 (Katoh and Standley, 2013) was used to perform multiple sequence alignments of the amino acid sequences of 60 single genes. Pal2nal Version 14 (Suyama et al., 2006) was used to convert amino acid sequence alignment results into nucleic acid alignments. We then combined all alignment results together and used KaKs_Calculator Version 2.0 (Wang et al., 2010) to calculate the Ka and Ks values of SNP differential genes. We used the Optimized Branch-Site model (Yang and Dos, 2010) and the Bayesian Empirical Bayes (BEB; Yang et al., 2005) method to identify genes that were positively selected. TrimAL Version 1.4 (Capellagutiérrez et al., 2009) was used to trim the results of single-gene nucleic acid multiple sequence alignments, and codeml in paml was used for branch-site analysis by calculating the null hypothesis (null model, model = 2, NSsites = 2, Fix-omega = 1, omega = 1) and alternative hypothesis (alternative model, model = 2, NSsites = 2, Fix-omega = 0, omega = 0.2). We ran a Chi Square test in paml Version 4.9 for the LRT test (Yang, 2007), with values of p < 0.05 considered indicative of positively selected genes. Finally, the BEB method was used to calculate posterior probabilities of amino acid sites to determine whether sites were positively selected.
Phylogenomic Analysis
We downloaded the chloroplast genome sequences of the nine aforementioned Celastrineae species from the NCBI, combined them with the three sequenced Euonymus species, and conducted a phylogenetic analysis using A. elegans as an outgroup. Phylogenetic analysis based on the whole cpDNAs, single copy gene, LSC, SSC and IR were as follows. MAFFT v7.149 (Katoh et al., 2005) was used to align the cpDNAs sequences under default parameters, and the alignment was trimmed by Gblocks_0.91b (Gerard and Jose, 2007) to remove low-quality regions with the parameters: −t = d −b4 = 5 −b5 = h (Castresana, 2000). Nucleotide substitution model selection was estimated with jModelTest 2.1.10 (Darriba et al., 2012) and Smart Model Selection in PhyML 3.0 (Guindon et al., 2010). Then the best fitting GTR+I+G model was selected. As far as the orthologs gene families, they were identified by ORTHOMCL v2.0 program (Li et al., 2003; reciprocal all-by-all BLASTP analysis) with an E-value of 10−5. Multiple alignments were generated with the MUSCLE v3.8.31 program (Edgar, 2004), and the alignments were examined visually. The best fitting LG+I+G+F model was determined. Finally, the Maximum-likelihood (ML) methods with 1,000 bootstrap replicates to calculate the bootstrap values were performed for all phylogenetic analyses using PhyML 3.0 and the results were treated with iTOL 3.4.3 (Letunic and Bork, 2016).
Results and Analysis
Features of the Chloroplast Genome
The chloroplast genome of the sequenced Euonymus species comprised a typical covalently closed, double-stranded circular molecule without the large fragment missing (Figure 1). Dot plot analysis indicated that genome content and structure were similar among Euonymus species, and no substantial rearrangement was detected (Supplementary Figure S1). And the chloroplast genomes of Euonymus species revealed similarity and formed similar collinear blocks (Supplementary Figure S2). The complete chloroplast genomes of the three species of Euonymus ranged from 156,860 (E. maackii) to 157,611bp (E. fortunei), with 37.26–37.31% GC content (Table 2). It had a typical circular structure including a LSC region of 85,826–86,299bp, a SSC region of 18,319–18,536bp, and a pair of IRs (IRa, IRb) each 26,341–26,700bp (Table 2; Figure 1). Besides, the length of the coding region ranged from 78,552 (E. fortunei) to 79,239bp (E. maackii) and the length of the non-coding region ranged from 77,621 (E. maackii) to 79,059bp (E. fortunei). A total of 130–131 chloroplast genes, comprising 85–86 protein coding genes, 37 tRNA genes, and eight rRNA genes were detected. The GC content of the chloroplast genome differed among locations and among genes coding for different functions. The gene coding region (38.14–38.15%) had significantly higher GC content than the non-coding region (36.40–36.48%). Moreover, GC content was highest in the IR region (42.66–42.71%), followed by the LSC region (35.08–35.20%) and the SSC region (31.74–31.78%). The rRNA genes had the highest GC content of the entire coding region (55.36–55.40%). The total GC content (37.26–37.31%) was lower than in the IR region, but higher than in the SSC and LSC regions. And the GC% content of the first position was higher compared to those of the second and third positions (Figure 2). A total of 16 genes harbored introns, of which clpP and ycf3 contained two introns (Supplementary Table S1).
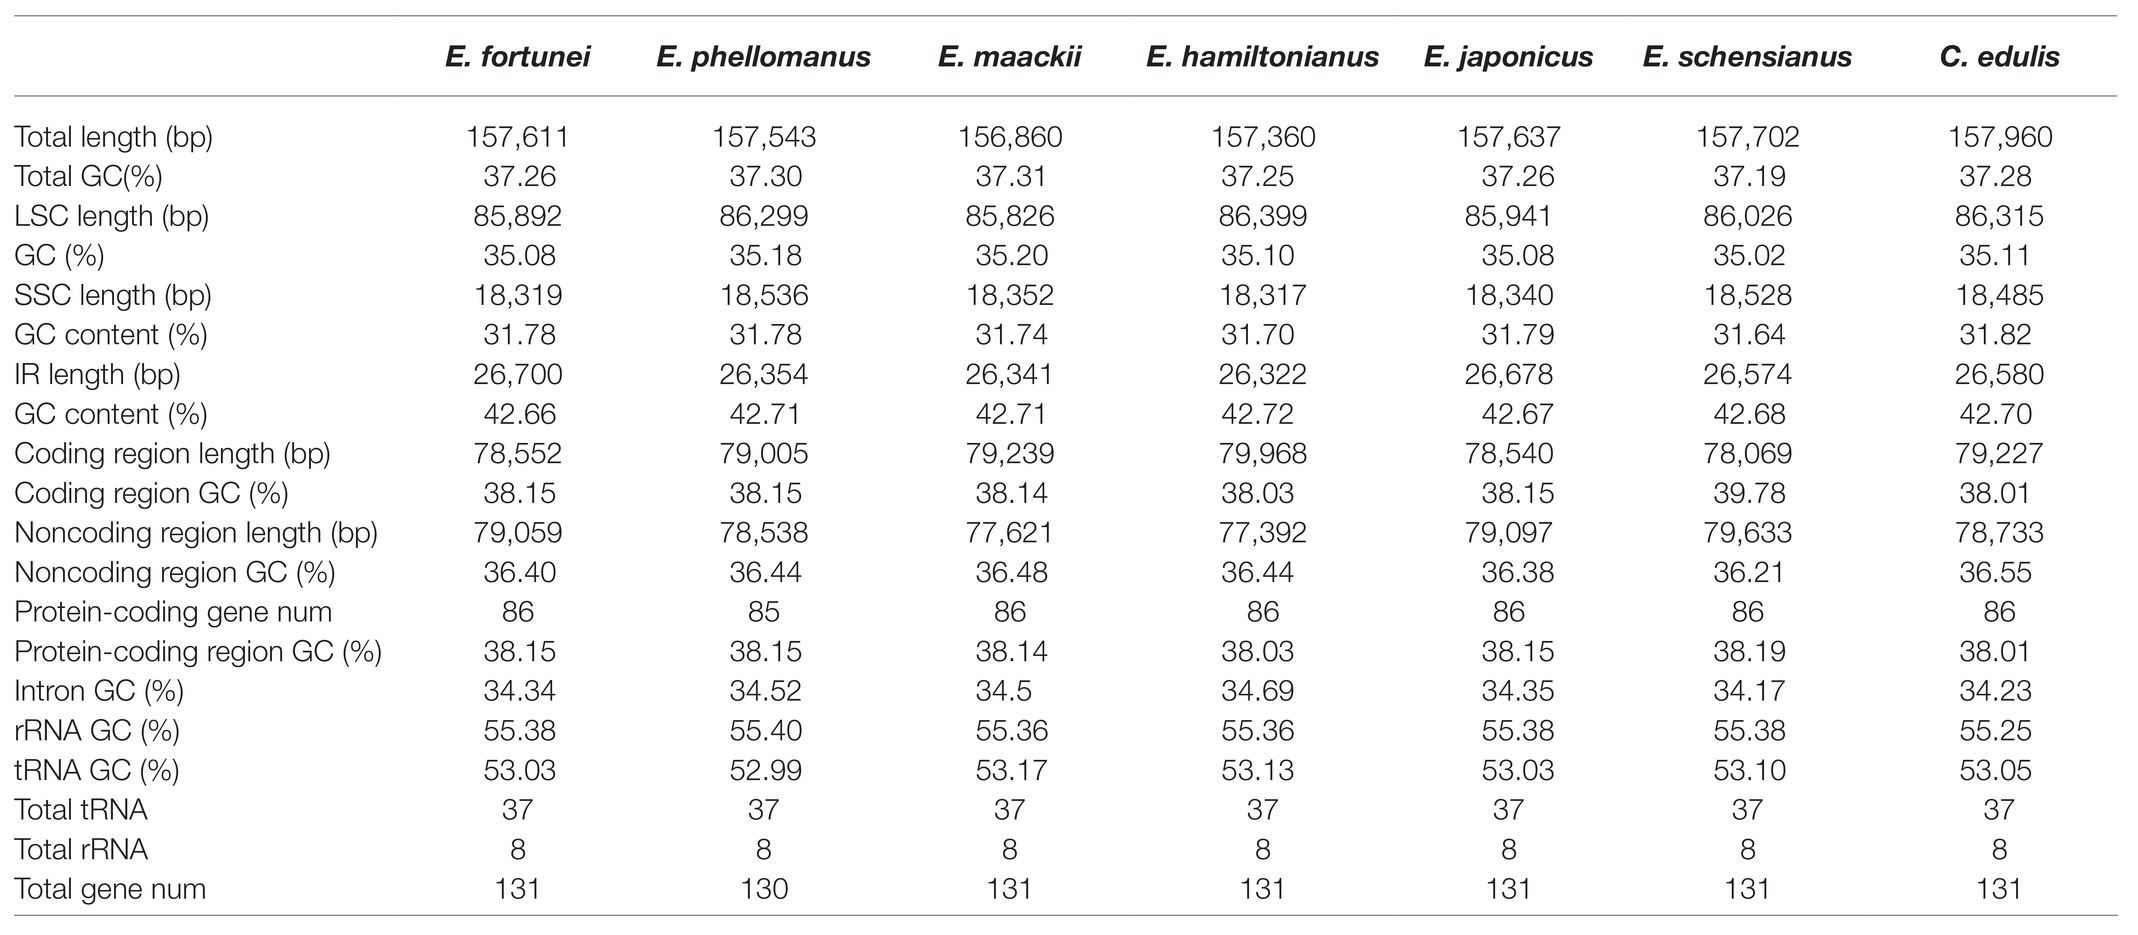
Table 2. The basic characteristics of the chloroplast genomes of six Euonymus species and C. edulis.
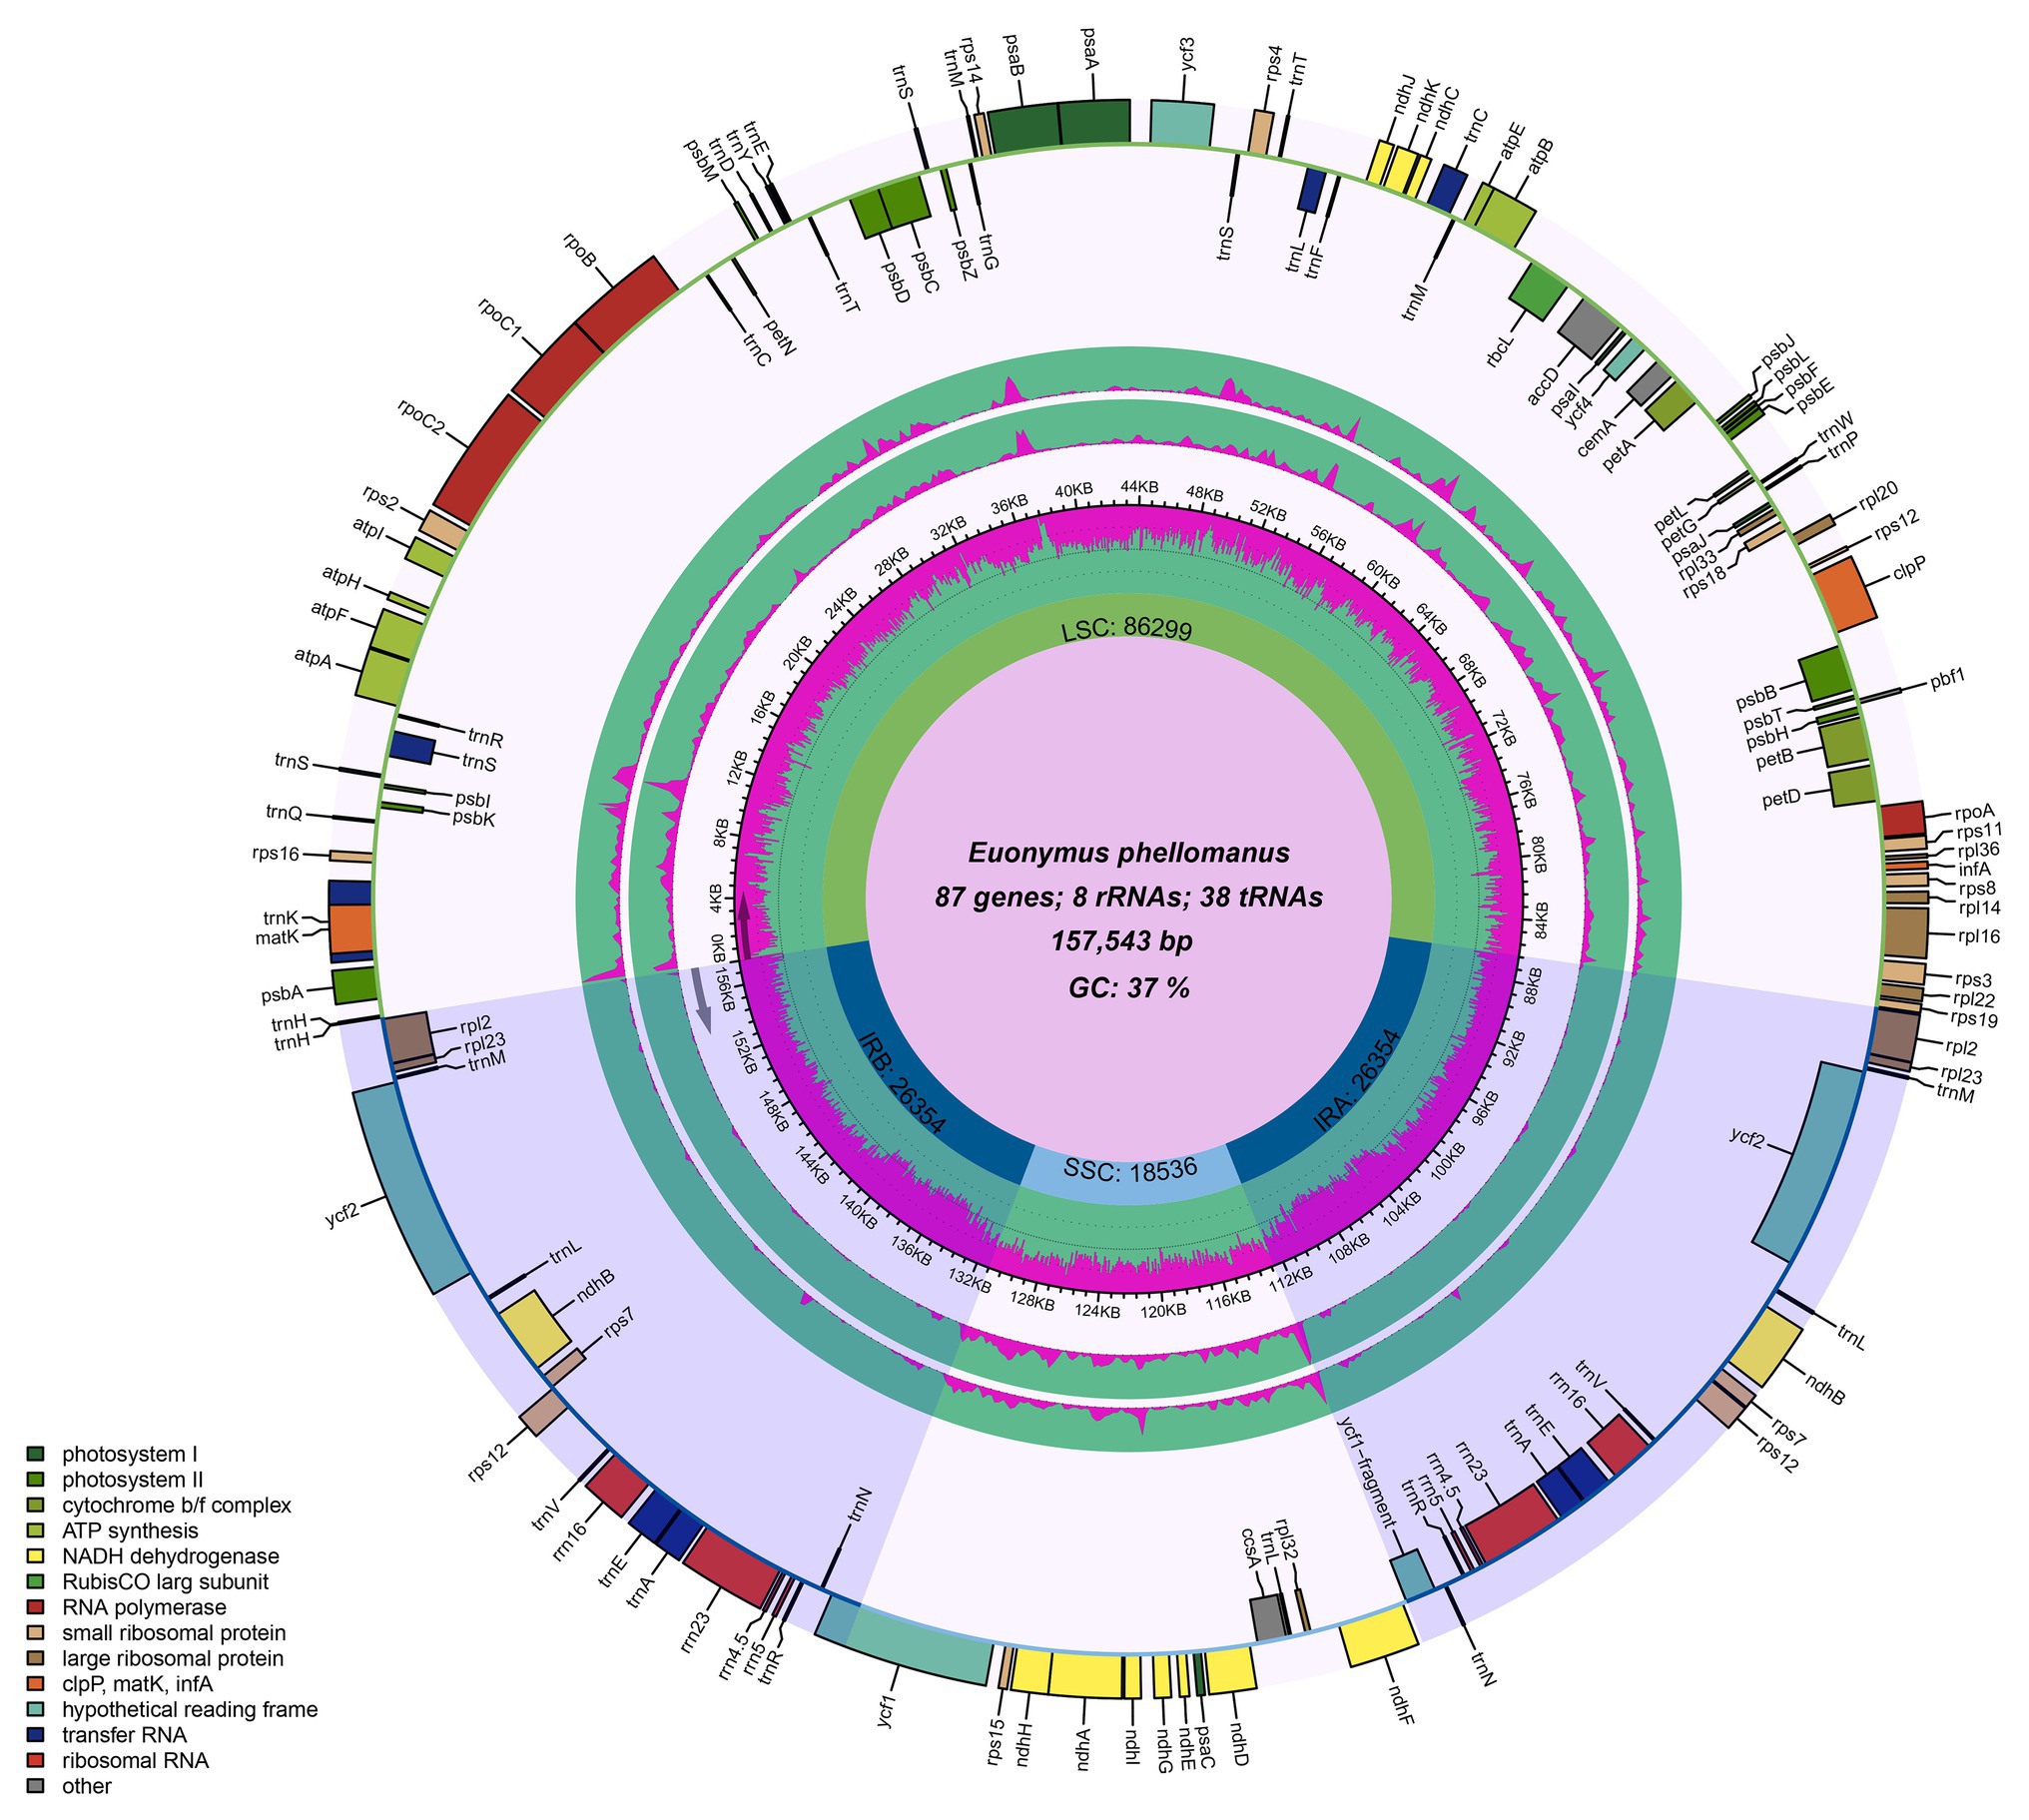
Figure 1. Chloroplast genome maps of Euonymus species. The species name and specific information regarding the genome (length, GC content, and the number of genes) are depicted in the center of the plot. Extending outward, the middle two layers are the nucleotide diversity of E.fortunei (inner) and E. maackii (Outer) compared with E. phellomanus, respectively.
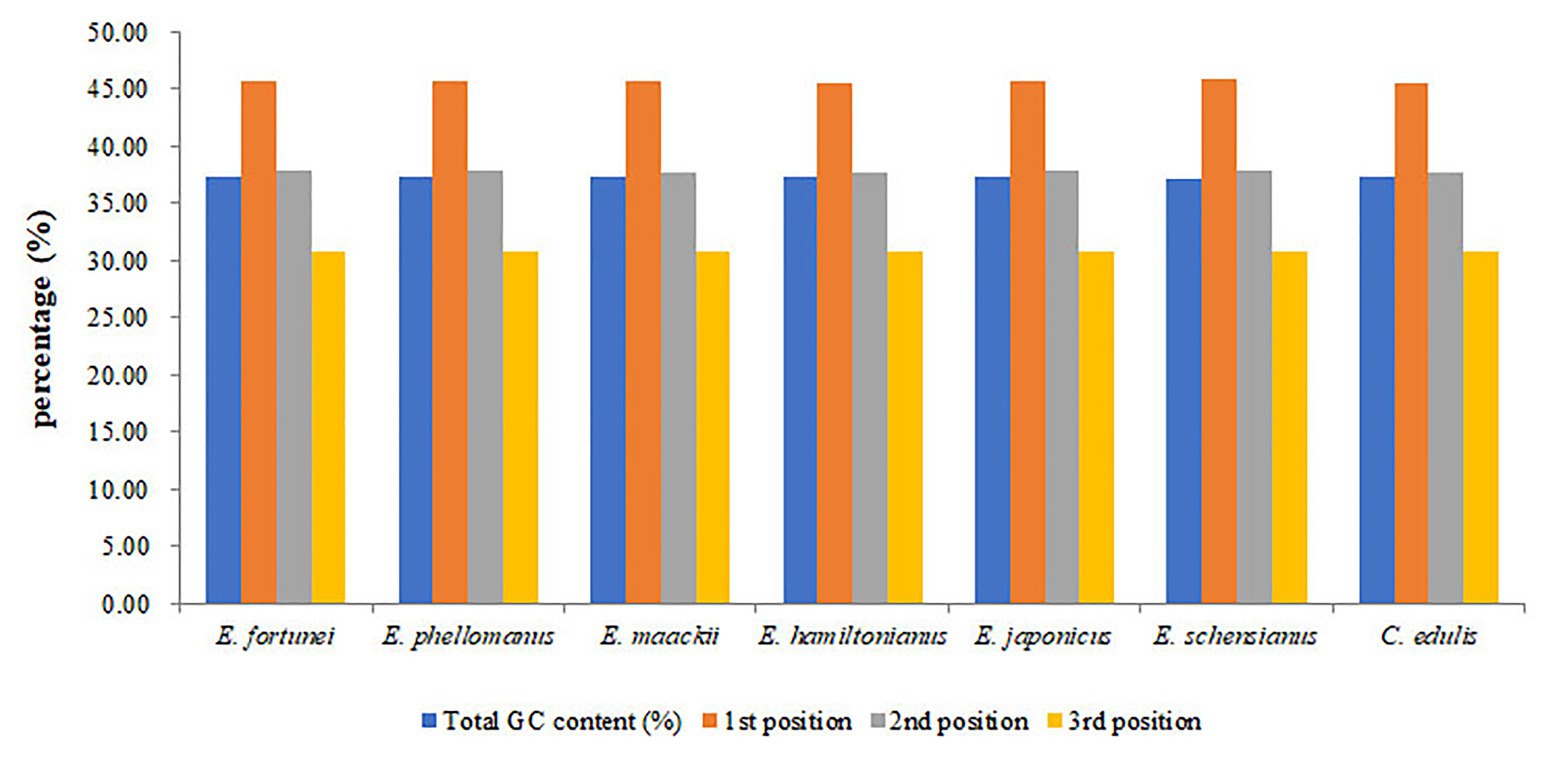
Figure 2. The GC (%) composition in different positions of coding sequence (CDS) region of species within Celastraceae.
Contraction and expansion of the IR region is common, a phenomenon known as ebb and flow (Goulding et al., 1996). We compared the JL (LSC/IR) and JS (IR/SSC) border positions of the Euonymus chloroplast genome (Figure 3). The length of the IR regions was similar, ranging from 26,322 to 26,700bp, with some expansion. Some notable differences were found at the junctions of JLB (IRb/LSC) and JLA (IRa/LSC) among the species. The JLB junction point of C. edulis, E. japonicus, E. schensianus, and E. fortunei was located between the rpl22 and rps19, and the length of the rps19 in IRb from the JLB was 7–46bp. However, the rps19 of E. hamiltonianus, E. maackii, and E. phellomanus were located in the LSC completely. What is more, the trnH-GUG and rps19 among C. edulis, E. japonicus, E. schensianus, and E. fortunei was located at JLA junction. Among them, C. edulis and E. fortunei showed integration of trnH-GUG into the IRa region 10 and 16bp, respectively. While the trnH-GUG of E. schensianus and E. japonicas was completely found in the LSC region. The JLA of E. hamiltonianus, E. maackii, and E. phellomanus was located on the right side of the rpl2 and the trnH-GUG extended into the IRa with the length of 3bp. Furthermore, the ycf1 located on the JSB (IRb/SSC) were detected as pseudogenes in all species. Detail of IR contraction and expansion has been provided in Figure 3.
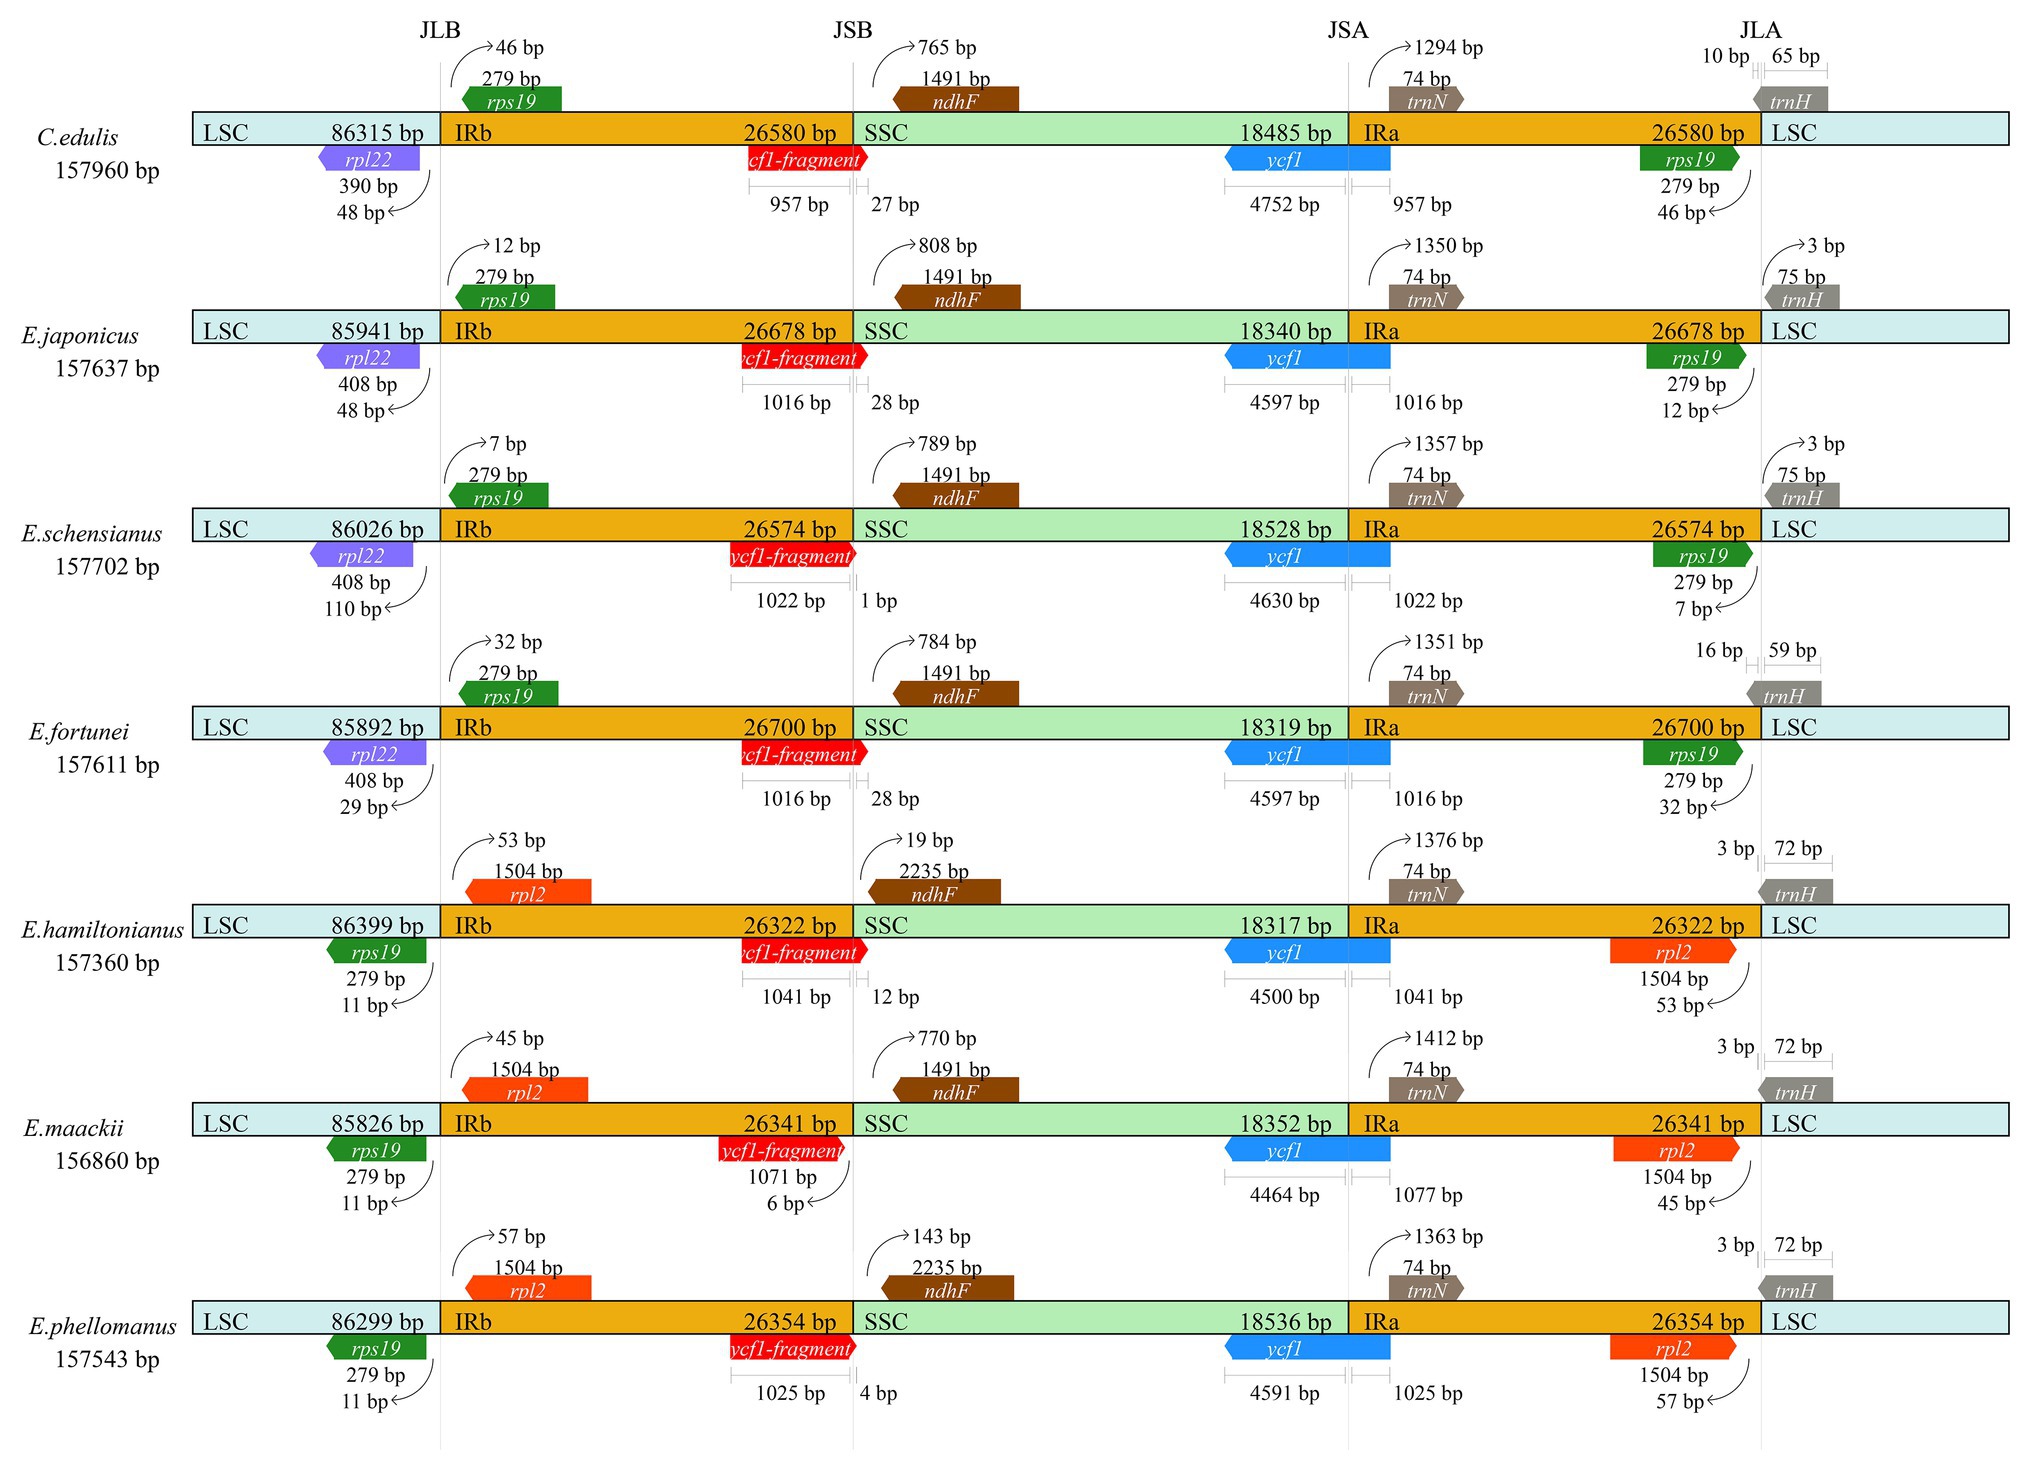
Figure 3. Comparison of the borders of large single-copy (LSC), small single-copy (SSC), and inverted repeat (IR) regions among seven Celastraceae cp genome.
Indices of Codon Usage
The results indicated that CAI, CBI, and FOP values were similar among Celastrineae species, while ENC and GC3s values were slightly higher in Celastraceae than in other families (Figure 4).
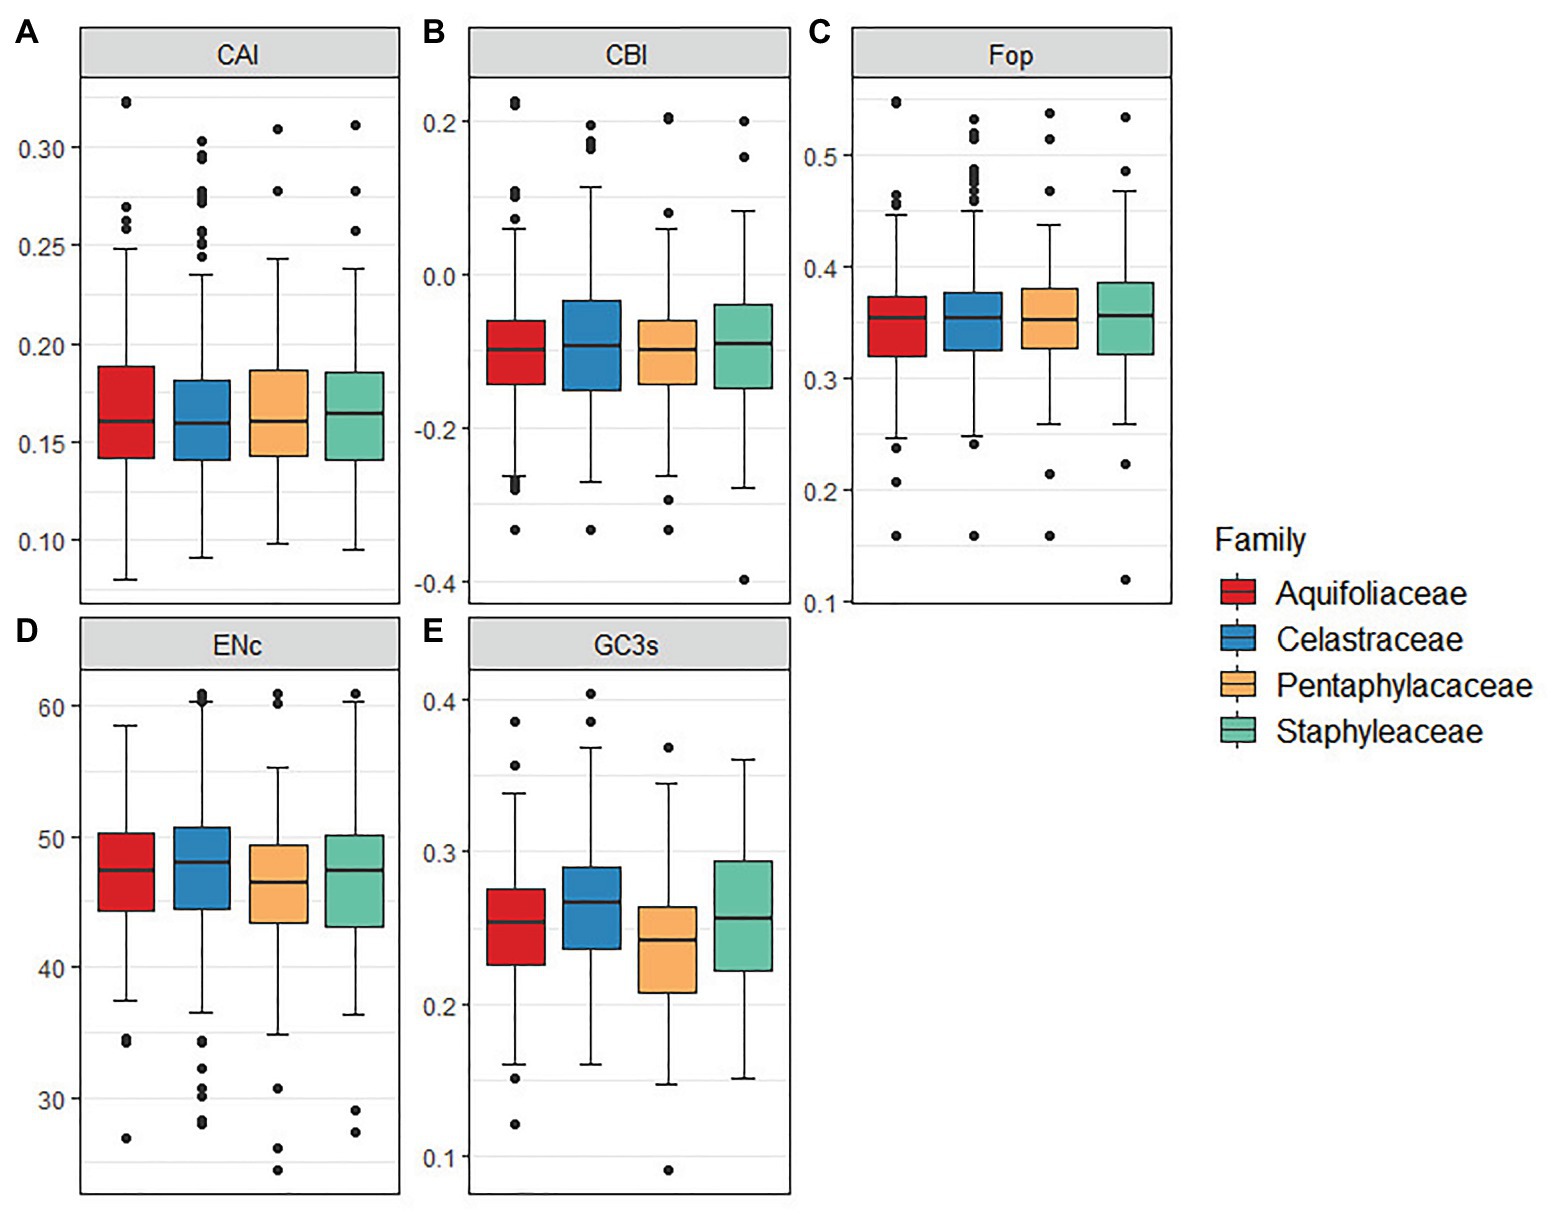
Figure 4. The comparative analysis of codon usage bias in 12 Celastrineae species. (A) Codon adaptation index (CAI), (B) Codon bias index (CBI), (C) Frequency of optimal codons index (Fop), (D) Effective number of codons (ENc). (E) GC of synonymous codons in third position (GC3s).
Repeat Sequences Analysis of Celastraceae
The high rate of polymorphism in SSRs at the species level makes them one of the most common molecular markers in phylogenetic and population genetics studies. In total, 79 (E. hamiltonianus) to 135 (E. fortunei) SSRs were detected in the chloroplast genome of the Celastraceae species, the majority of which were mononucleotide repeats (51–112), followed by dinucleotides (8–12), tetranucleotide (3–12), trinucleotides (3–7), pentucleotide (2–6), and hexnucleotide (1–2; Figure 5A). Mononucleotide nucleotide repeats may play a more important role in genetic variation than other types of SSRs. SSRs were mainly composed of the single nucleotides (A)n and (T)n, and their lengths were mostly in the 10–12bp range. Aside from the presence of a G in the SSRs of C. edulis, the remainder were composed of A or T only, indicating that the base composition of SSRs was biased toward the use of A/T bases. Moreover, SSRs of the chloroplast genome of Celastraceae species were primarily distributed in the LSC and SSC regions (Figure 5B), and these two regions were also the main distribution regions of a few genes in the chloroplast genome. In addition, the analysis of SSR locations revealed that most SSRs were distributed in the non-coding regions of the genome, namely the intergenic and intron regions (Figure 5C).
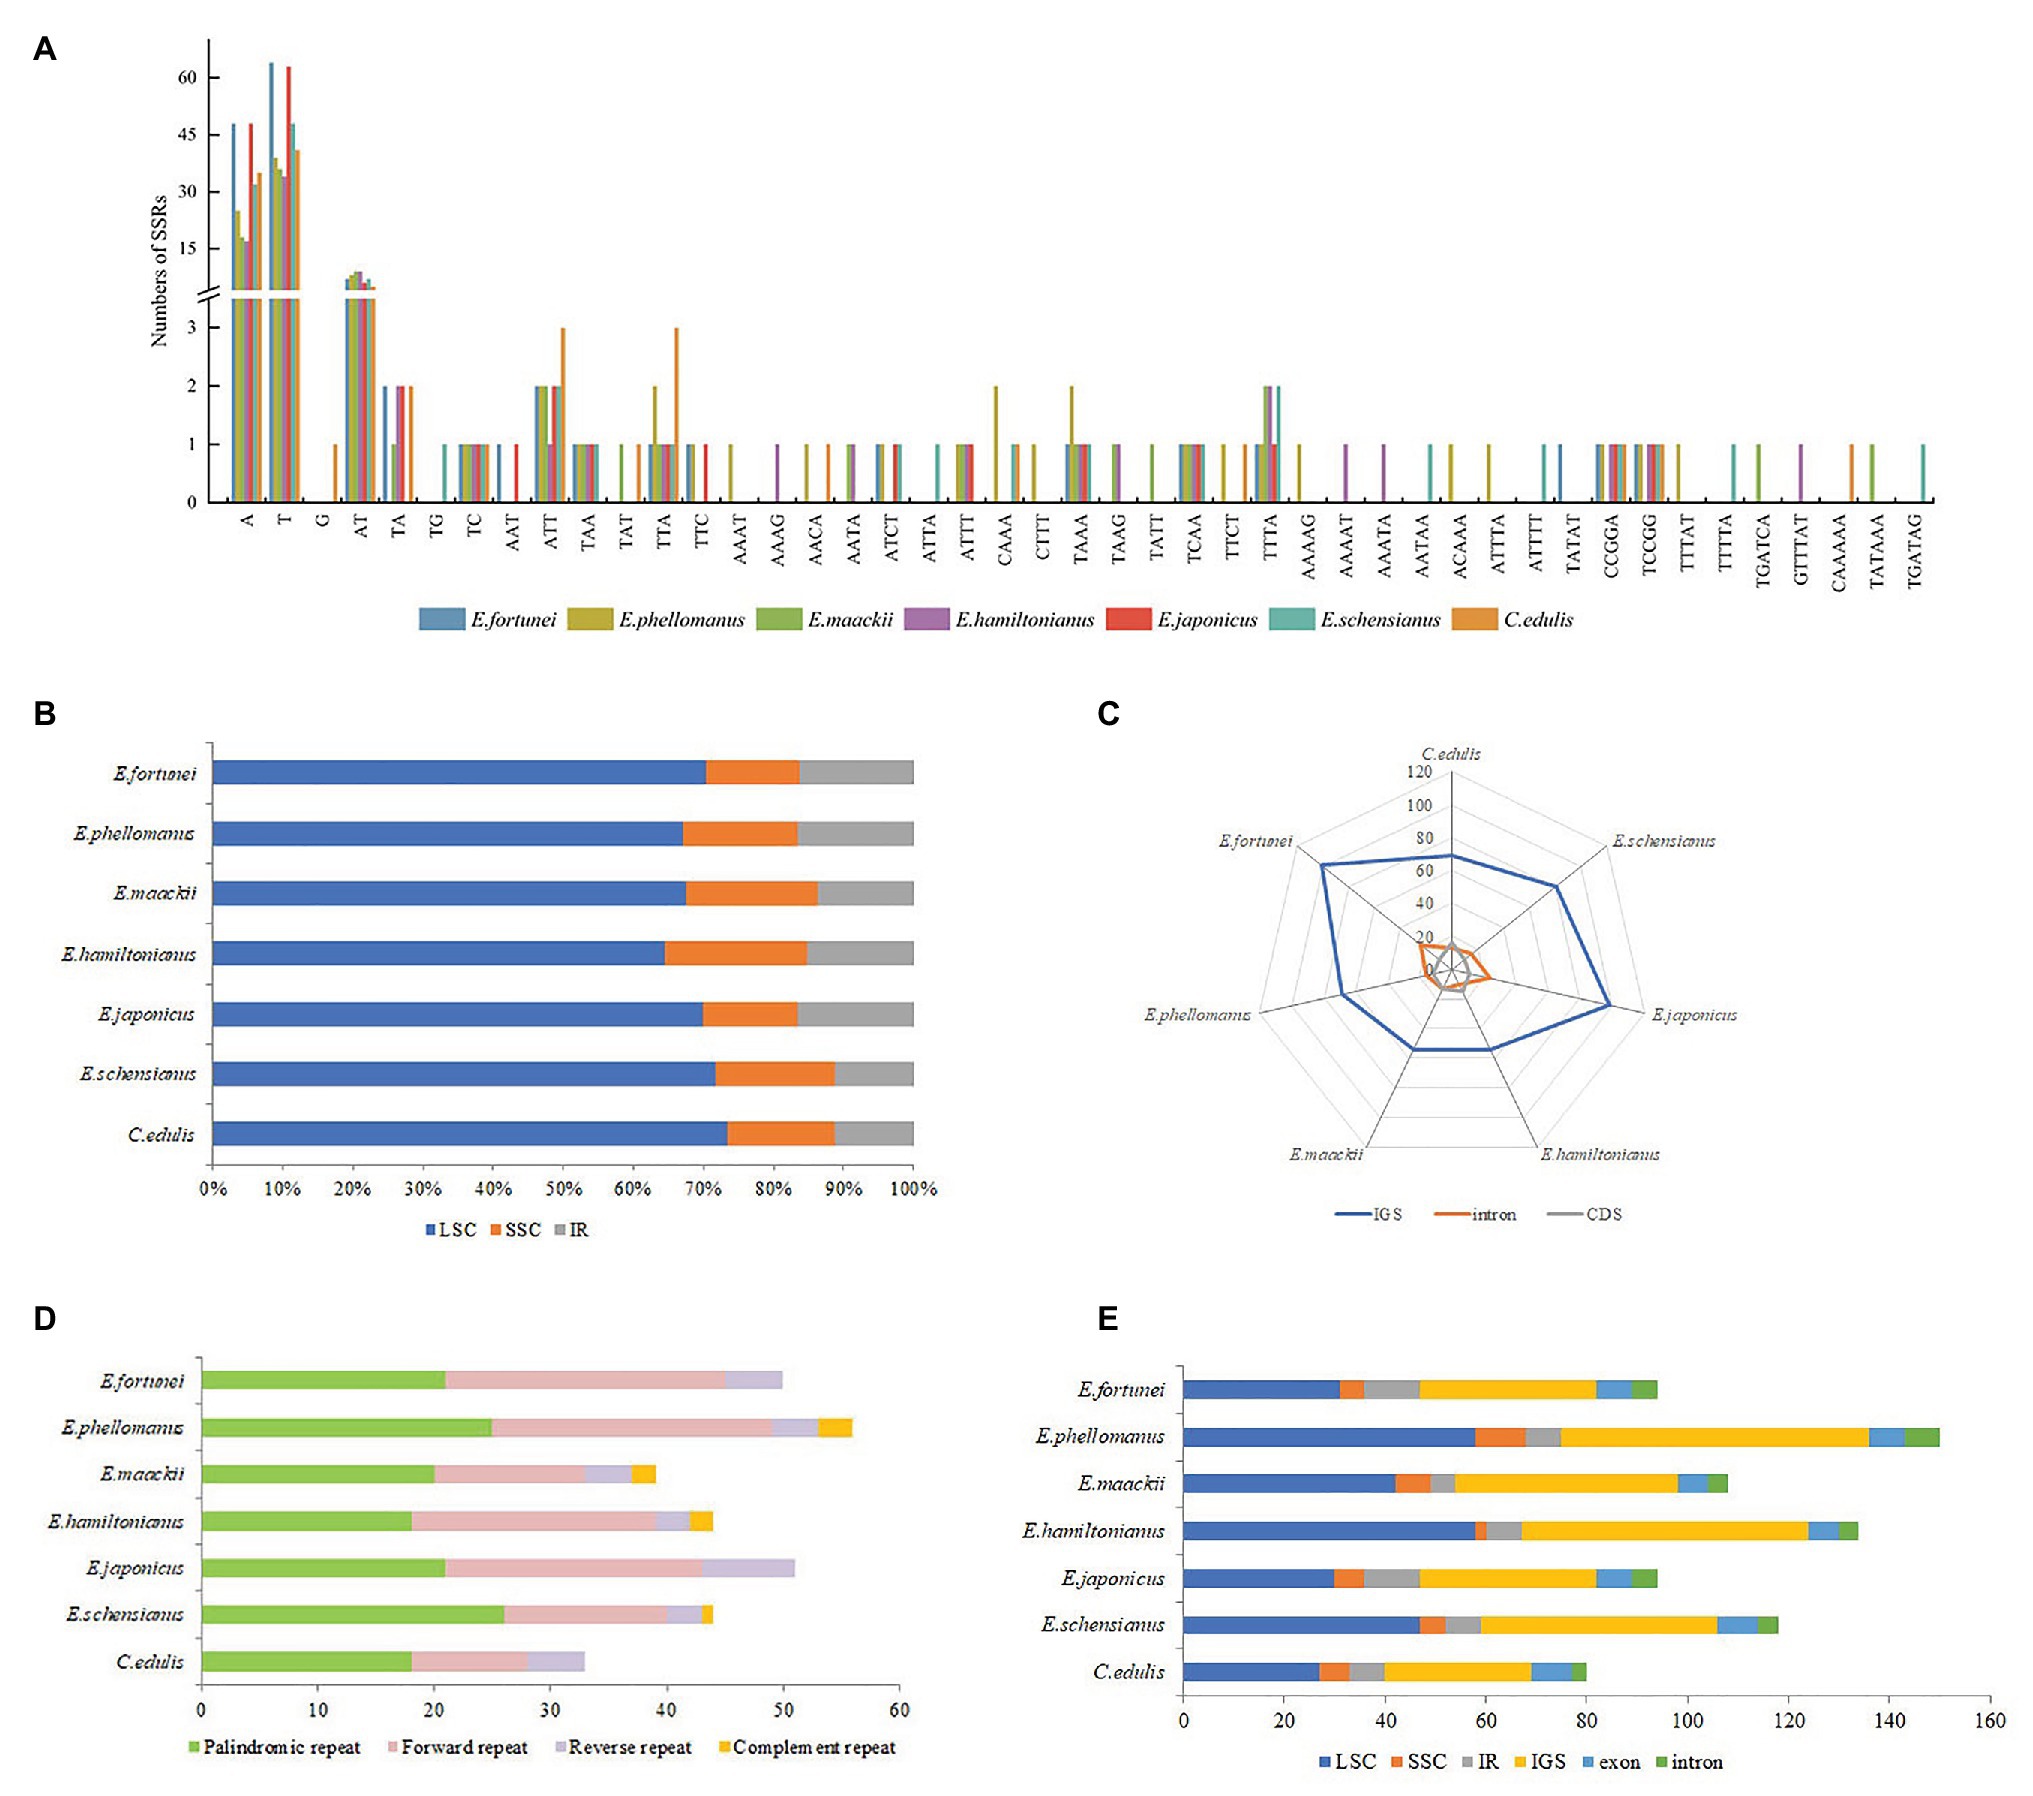
Figure 5. (A) Analysis of simple-sequence repeats (SSRs) in the chloroplast genomes of seven Celastraceae species; (B) Frequency of SSRs in the LSC, IR, SSC region; (C) Frequency of SSRs in the intergenic regions, protein-coding genes, and introns; (D) Number of Palindromic repeat, Direct repeat, Reverse repeat, Complement repeat; (E) Distribution of tandem repeats in genomic regions and exon, intergenic spacer (IGS), and intron regions.
Long repetitive sequences with a length ≥30bp may promote rearrangement of the chloroplast genome and increase the function of species genetic diversity (Qian et al., 2013). In total, 33 (C. edulis) to 56 (E. phellomanus) long repeat sequences were predicted in the chloroplast genome of the Celastraceae species, including 18–26 palindromic repeats, 10–24 direct repeats, 3–8 reverse repeats, and 1–3 complement repeats. Of these, palindromic, forward and reverse repeats were common to seven species, while complement repeats were detected only in E. phellomanus (3), E. hamiltonianus (2), E. maackii (2), and E. schensianus (1; Figure 5D). In addition, 40 (C. edulis) to 75 (E. phellomanus) tandem repeats were detected with lengths mostly in the range 25–109bp. These tandem repeats were mainly distributed in the LSC and non-coding regions (Figure 5E).
Comparative Genomic Analysis and Suitable Polymorphic Loci Identification
Pairwise determination of divergent regions was conducted by mVISTA among Euonymus using E. phellomanus sequence as a reference (Figure 6). The results indicated that the six Euonymus cp genomes were relatively conserved and similar. In general, the LSC and SSC regions exhibited greater variation than did the IR region and variation was greater in the non-coding region than in the coding region. Studies of the genetic diversity and evolution of Celastrineae species using non-coding cpDNA sequences are lacking; it is therefore important to identify suitable polymorphic genes to investigate further the systematic evolution and biogeographic relationships of this group.
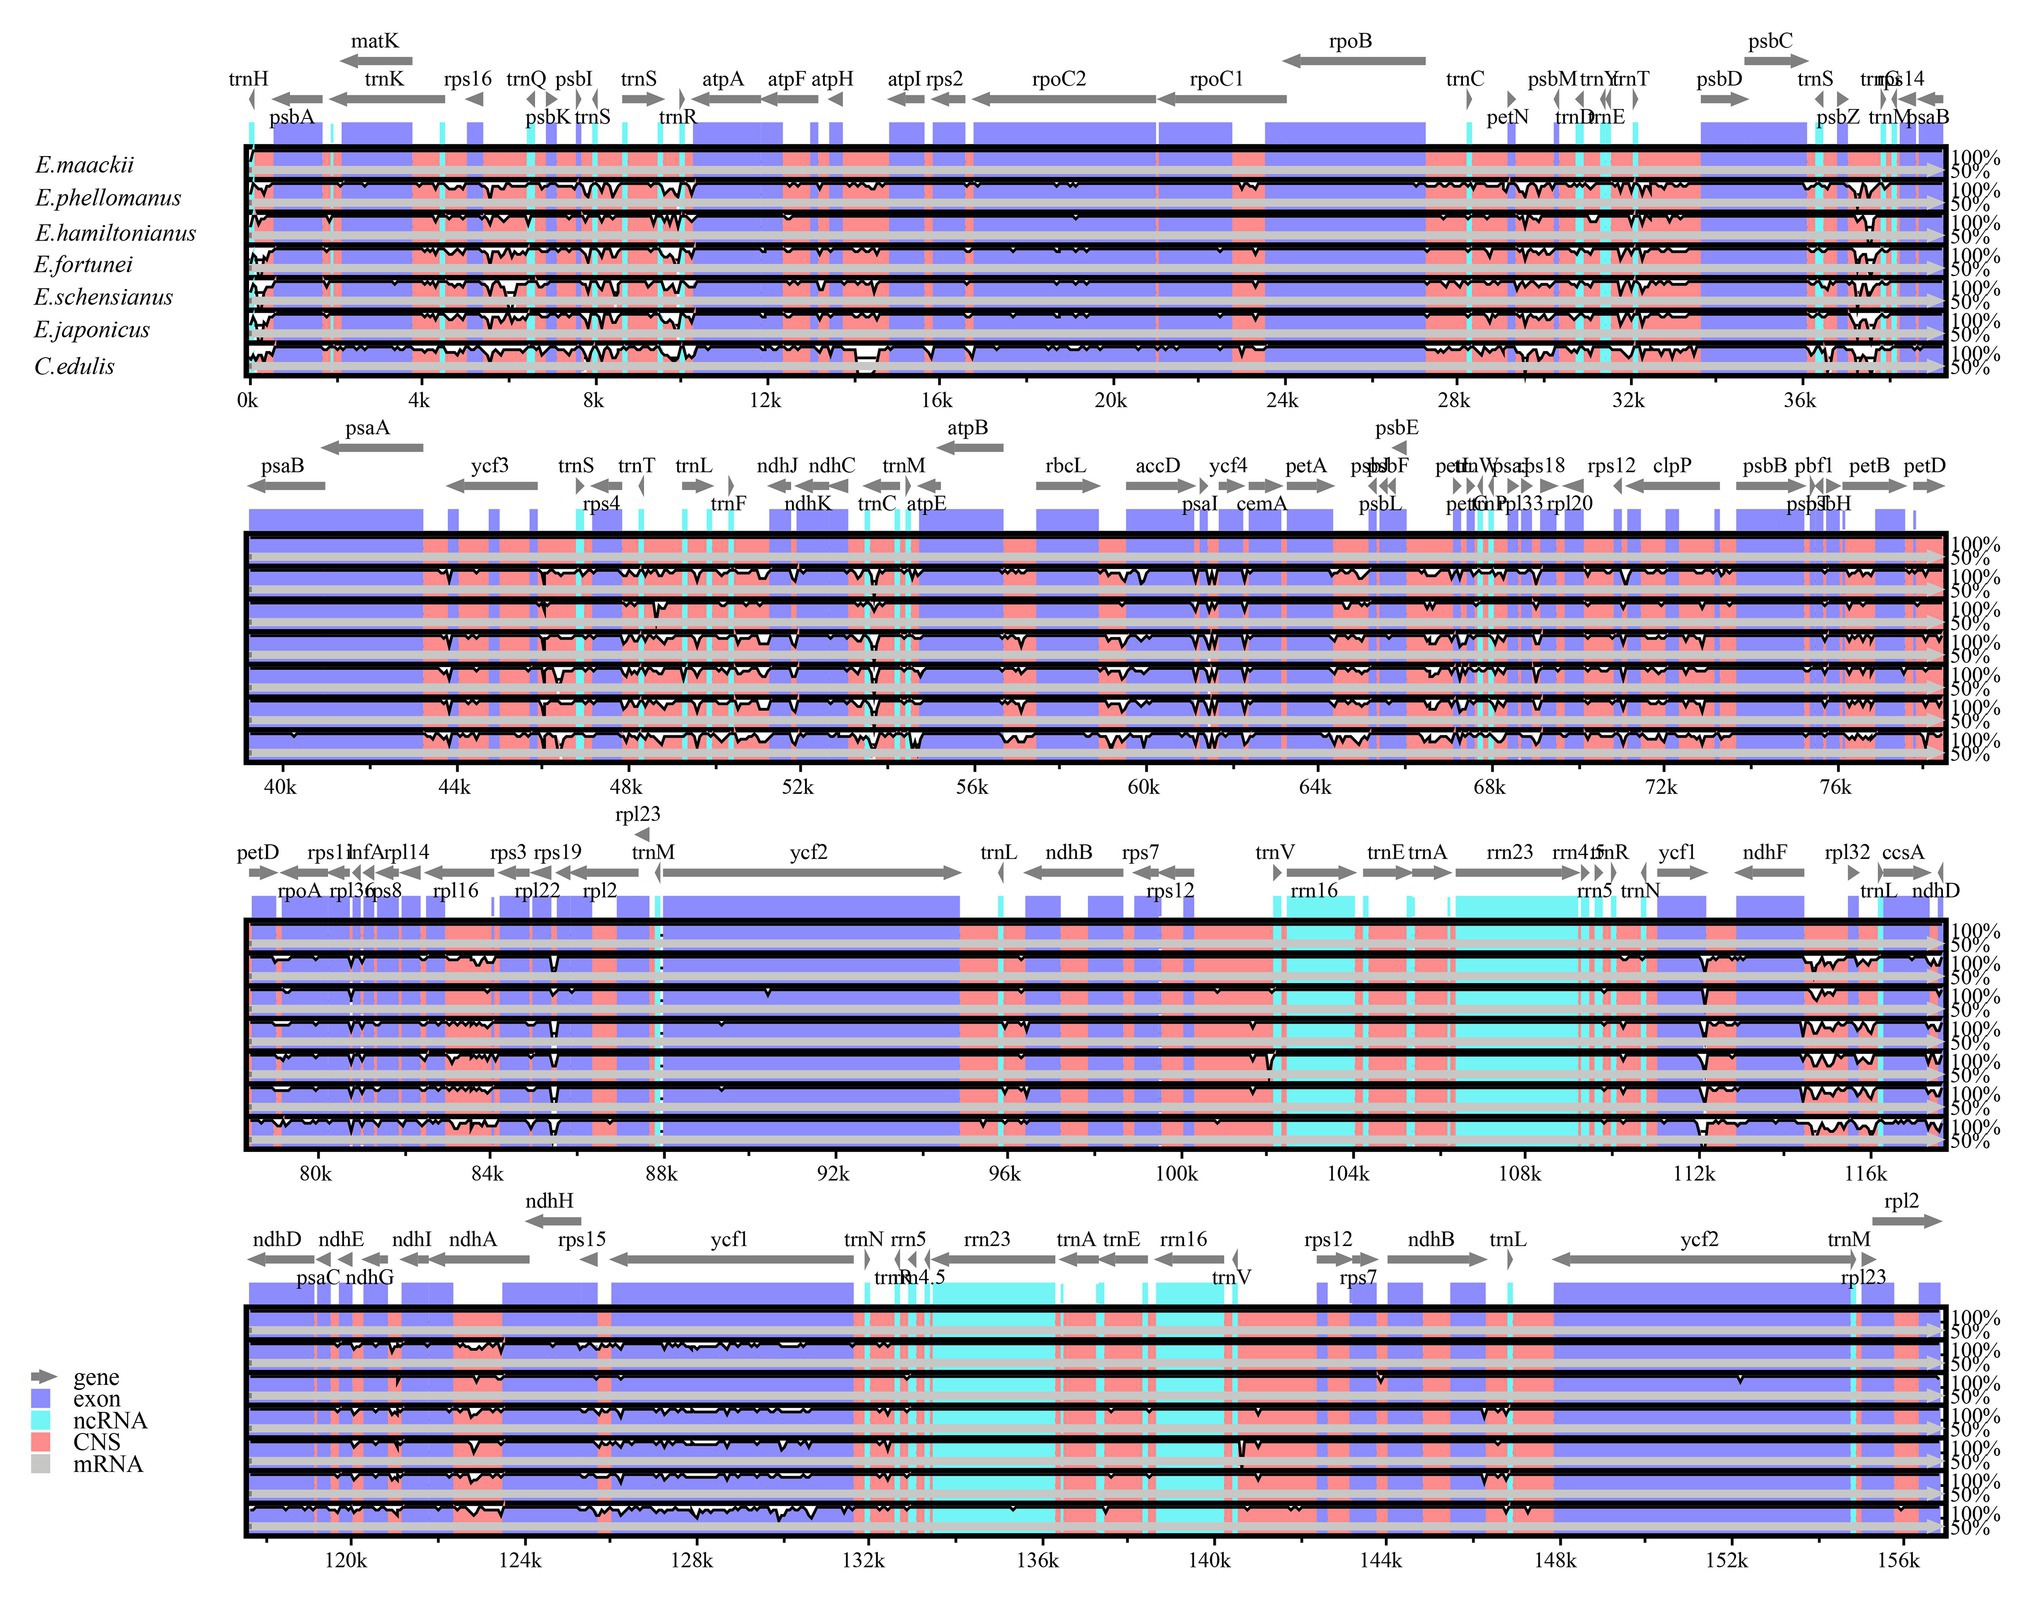
Figure 6. Comparison of six Euonymus cp genomes using mVISTA, with the E. phellomanus genome as the reference. The y-axis represents the percent identity within 50–100%. Gray arrows indicate the direction of gene transcription. Blue blocks indicate conserved genes, while red blocks indicate conserved noncoding sequences (CNS).
A sliding window analysis indicated that most of the variation in the cp genomes of the six Euonymus species occurred in the LSC and SSC regions (Figure 7). The average nucleotide differences of intergenic spacer (IGS) regions were found the highest. The most divergent non-coding regions were trnH/psbA, trnS/trnS, trnS/trnR, petN/psbM, psbZ/trnG, trnW/trnP; trnP; trnP/psaJ, ycf1*/ndhF, ndhF/rpl32, ccsA/ndhD, and rps15/ycf1 (Pi > 2.0; Table 3). The protein-coding regions of accD were also included in the suitable polymorphic loci. Although coding regions were conserved in these cp genomes, sequence variation was observed among the six cp genomes in the ycf1, ndhF, and rpoC2 gene. These polymorphic loci might be helpful for phylogenetic inference and population genetic studies of the species of genus Euonymus.
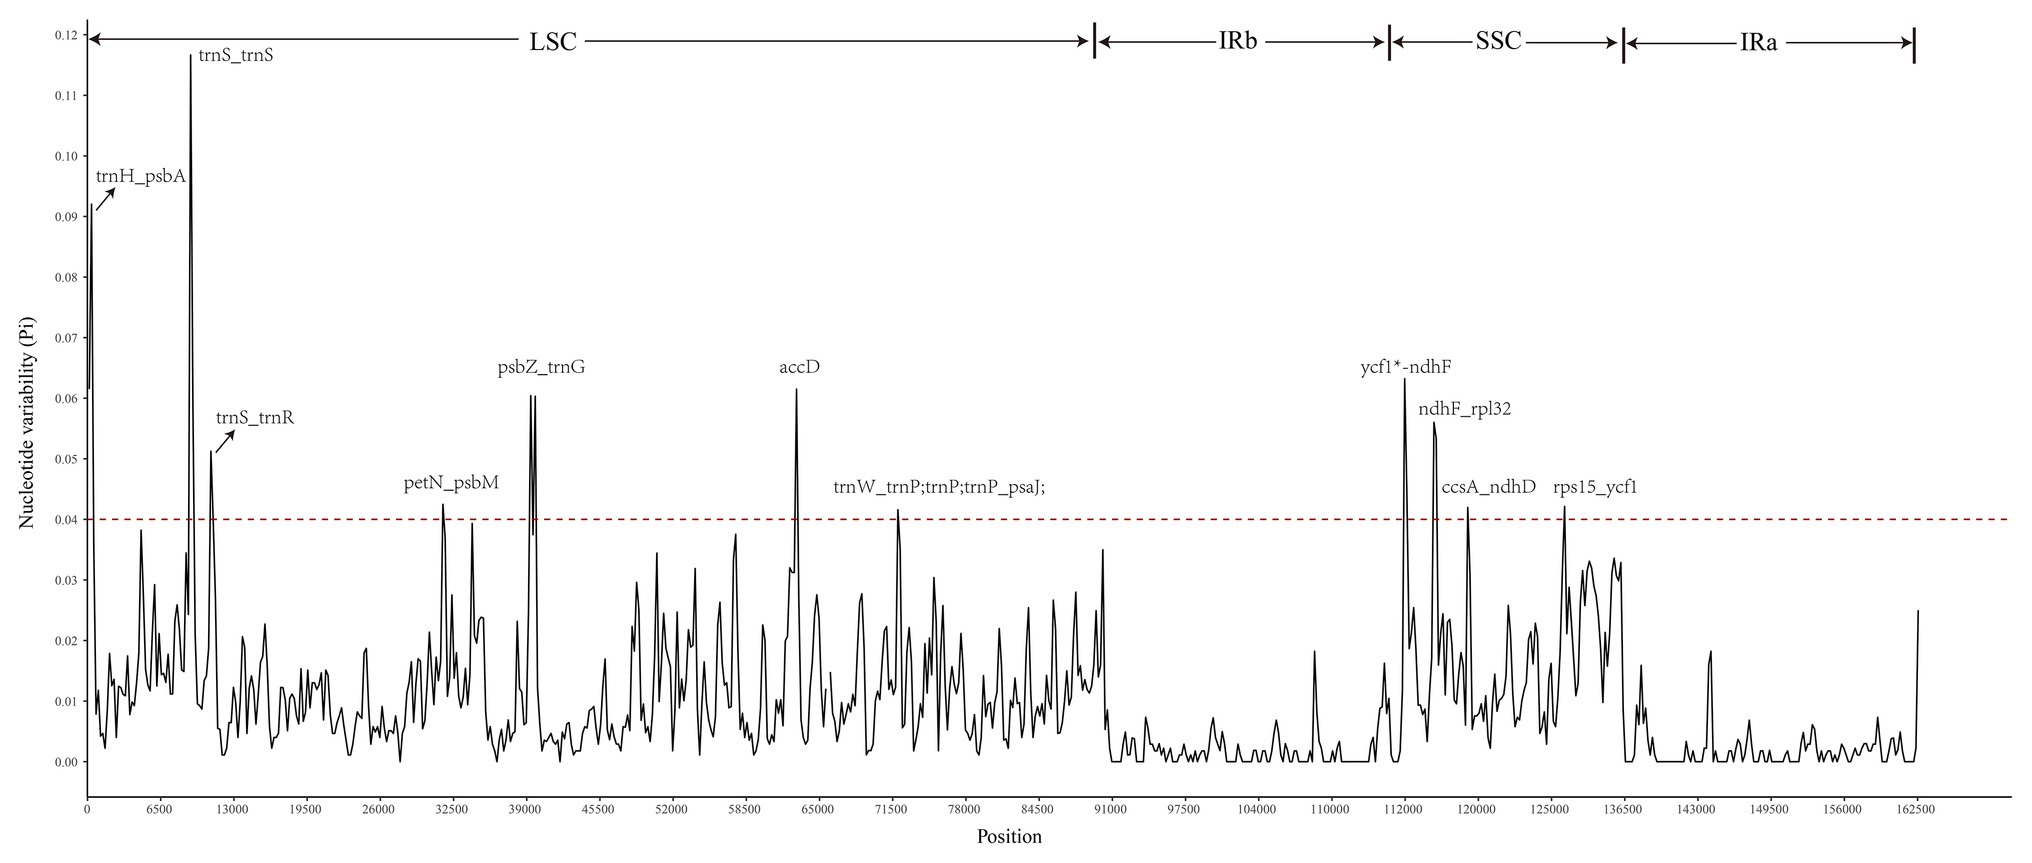
Figure 7. Comparison of nucleotide diversity (Pi) values among the six Euonymus species (window length: 300bp, step size: 200bp). X-axis, position of the midpoint of each window; Y-axis, nucleotide diversity (pi) of each window.
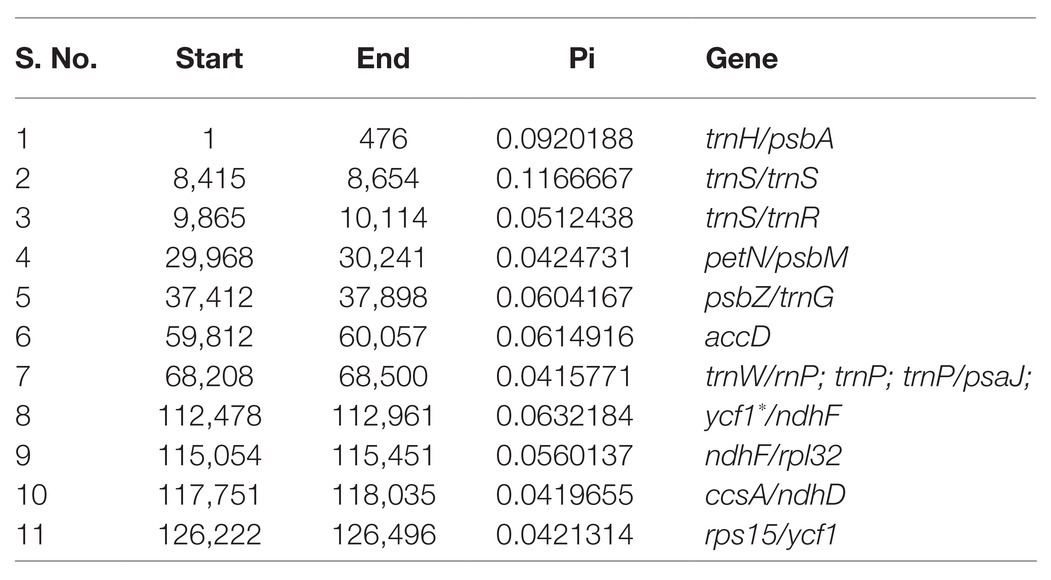
Table 3. Polymorphic loci identified by comparing six Euonymus species.
Ka/Ks Ratios of Species Pairwise and Positive Selection Analyses
Ka/Ks ratios provide information on the effects of selection pressures on individual sequences. The two Ilex species had higher Ka/Ks ratios compared to other species. The highest overall value was detected in one of the Ilex species, followed by the Celastraceae species (Figure 8).
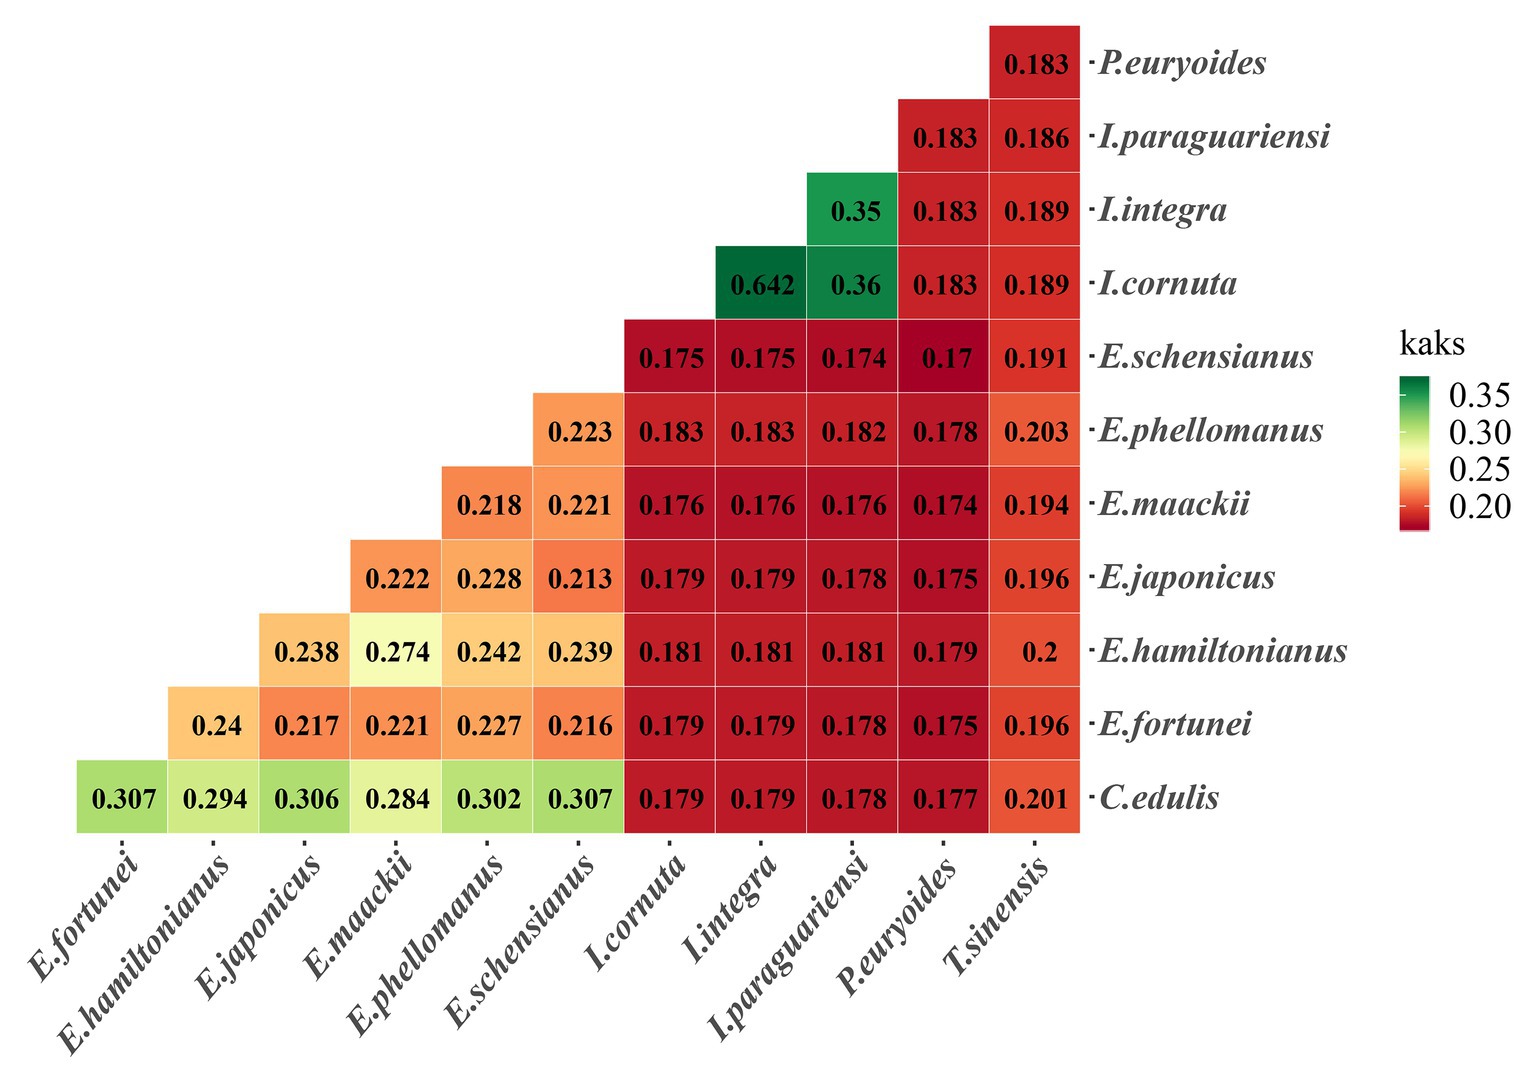
Figure 8. Pairwise Ka/Ks ratios 12 Celastrineae species. This heatmap shows pairwise Ka/Ks ratios between every sequence in the multigene nucleotide alignment.
Sixty common single-copy CDS genes from 12 Celastrineae species were subjected to positive selection analyses (Supplementary Table S2). The p-values of the protein coding genes rpoB were <0.05, indicating positive selection.
Chloroplast Phylogenetic Analysis
Phylogenetic analysis with Euonymus plastid genomes was performed with the ML method based on the complete chloroplast genomes, single copy gene, LSC, SSC, and IR region, with the outgroup A. elegans. The best fit model GTR+I+G and LG+I+G+F of the complete chloroplast genomes, LSC, SSC, IR region and single copy gene were selected, respectively. All phylogenetic trees exhibited similar clustering and a high level of support, and were consistent with traditional taxonomic classifications, except the tree based on SSC. Species within the same genus or family were grouped together (Figure 9). In particular, E. fortunei and E. japonicus were clustered more closely to one another than to other Euonymus species. Moreover, E. maackii was found as sister taxa to E. hamiltonianus.
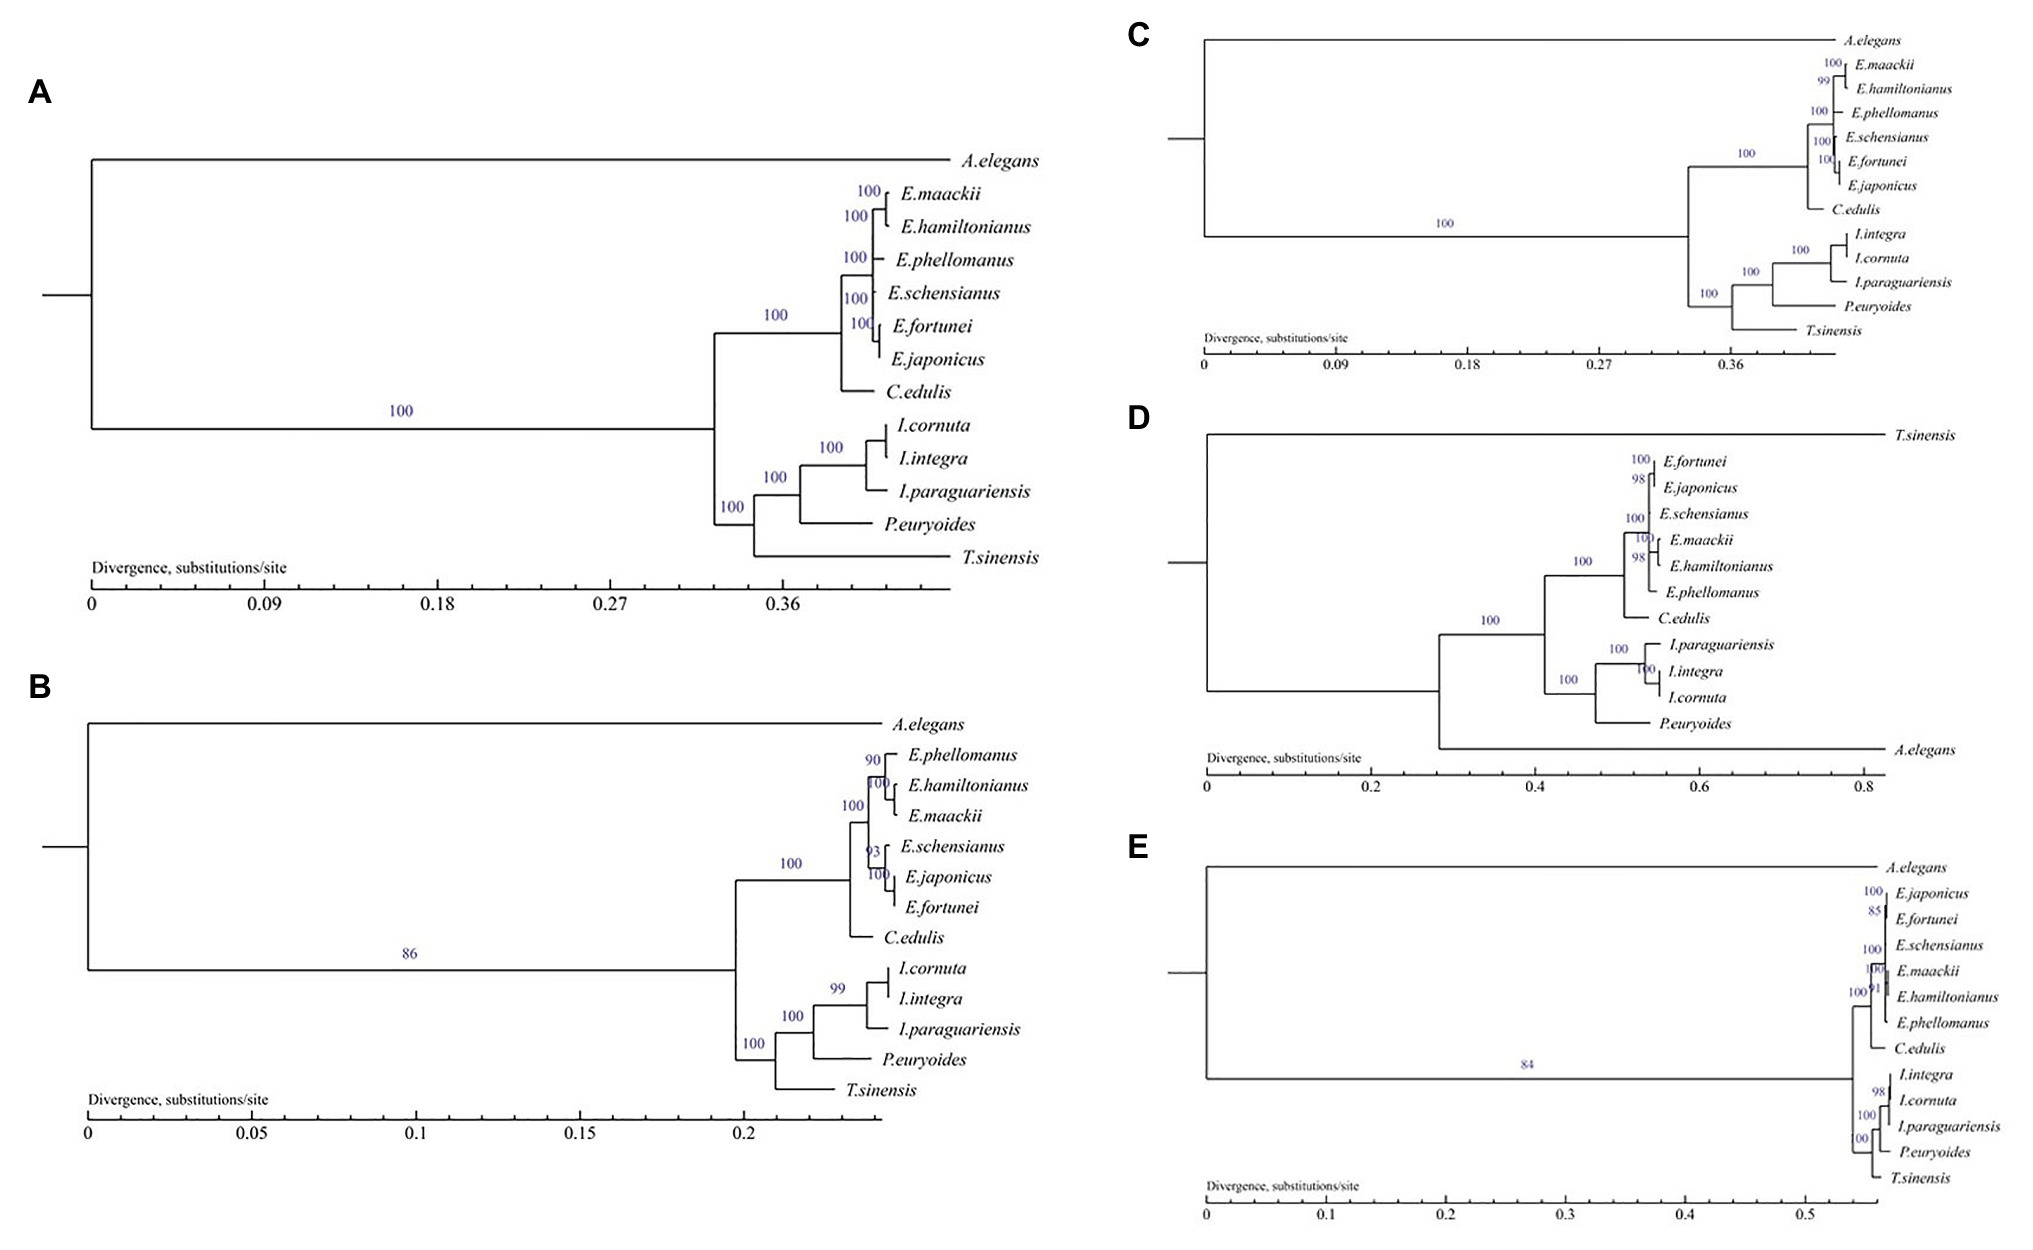
Figure 9. Phylogenetic trees of the Euonymus species based on the chloroplast genome by MP. (A) Phylogenetic tree constructed using the complete chloroplast genome data. (B) Phylogenetic tree constructed using single copy genes; (C) Phylogenetic tree constructed using LSC data; (D) Phylogenetic tree constructed using SSC data; and (E) Phylogenetic tree constructed using IR data.
Discussion
Plastome Features
The structure, gene organization and gene content of the cp genome of Euonymus species were highly conserved, which is similar to the other Celastrineae species (Choi and Park, 2015; Cascales et al., 2017; Gu et al., 2018). It exhibited a typical circular tetrad structure and no IR region was completely lost, which had occurred in Pisum sativum and Medicago truncatula (Saski et al., 2005). The cp genome had the conservative nature regardless of phylogenetic position. When comparing the families that had the different diverged up time, such as the Ginkgo (Yang et al., 2020), Magnolia (Sima et al., 2020), Abies (Su et al., 2019), Nymphaea (Kim et al., 2019), and Pyrus (Li et al., 2018), we found that they both had conserved cp genome structures in terms of gene content and gene arrangement. Moreover, the Araceae’s plastid genome was also conserved compared with Orchidaceae and Fabaceae that diverged up to 50 million years later from Araceae showing significant gene rearrangements due to various inversion events (Abdullah et al., 2020b).
The total length of the chloroplast genome of Euonymus species was 156,860–157,611bp, encoding a total of 130–131 genes, including 85–86 protein coding genes, the same number of tRNA and rRNA genes. GC content plays an important role in genome recognition, and differences in the genomes of different species are apparent through changes in base composition (Zhu et al., 2017). The total GC content of the Euonymus species was 37.26–37.31%, well within the usual range for chloroplast genomes of seed plants (34–40%). The GC content was highest in the IR region, mainly owing to the presence of four rRNA genes with high GC content in this region and lowest in the SSC region. The uneven distribution of GC content may be an important factor in the conservatism of the IR region relative to the LSC and SSC regions.
Shrinkage and expansion of the IR boundary is one of the main drivers of changes in the length of the chloroplast genome (He et al., 2017). And it can lead to the loss of one copy of genes, the duplication of genes, or the origination of pseudogenes in the chloroplast genome of angiosperms (Yu et al., 2017a; Abdullah et al., 2019b). (Abdullah et al. 2020a) found that the rate of evolution of protein-coding genes was affected by the contraction and expansion of IRs among subfamily Pothoideae. Here, we compared border regions among the Euonymus cp genomes and found that a difference of nearly 378bp of IR region between the smallest (E.hamiltonianus) and largest (E. fortunei) were detected. The plastomes of E.fortunei, E.japonicus, and E.schensianus showed expansions of the IRs and contractions on the LSC. This resulted that the rps19 located in LSC of E. hamiltonianus, E. maackii, and E. phellomanus entered into the IRb and doubled completely. The ycf1 observed at the junction of IRb and SSC in Euonymus species were also founded to be pseudogenized. This phenomenon has also been reported in other angiosperms (Yao et al., 2016; Shahzadi et al., 2019). Our study agreed with the study that the IR contraction and expansion might be helpful in the study of evolutionary patterns (Iram et al., 2019).
Identification of Repeated Sequences
Repeated sequences may have the effect of promoting chloroplast genome rearrangement and recombination (Weng et al., 2013; Zhou et al., 2019). SSRs are widely distributed in the chloroplast genome of eukaryotes, and have the advantages of simple structure, relative conservatism, polymorphism making them efficient molecular markers that are widely used in species identification, analyses of genetic differences among individuals, and population evolution studies (He et al., 2012; Pauwels et al., 2012). In total, 79–135 SSRs were found in the chloroplast genome of Celastraceae species, including mononucleotide repeats, dinucleotides, tetranucleotide, trinucleotides, pentucleotide, and hexnucleotide. Of these, Mononucleotide nucleotides, which were rich in A/T, were most abundant. Our results are consistent with previous reports that SSRs usually consist of polyA or polyT repeats and rarely contain G or C repeats (Kuang et al., 2011; Ye et al., 2018); this may be because A/T change more easily than do G/C. SSRs of the Celastraceae species were distributed mainly in the intergenic regions as compared to the gene regions and introns and were found primarily in the LSC and SSC regions. Genomic evolution studies imply that generation of new genes originates from repetitive sequences. The higher number of SSRs in SSCs may be one reason for the greater variability of the latter, as compared to IR regions (Wolfe et al., 1987). Among Euonymus species plastid genome, we also observed abundance of oligonucleotide repeats, which have been suggested as a proxy for identification of polymorphic loci (Ahmed et al., 2012). The oligonucleotide repeats are usually considered to produce substitutions, insertions-deletions (InDels), inversion and rearrangements (Keller et al., 2017). (Abdullah et al. 2020c) research in the eudicot family Malvaceae showed that at family and subfamily level comparisons, 88–96% of the repeats showed co-occurrence with SNPs, whereas at the genus level, 23–86% of the repeats co-occurred with SNPs in same bins. Moreover, Michael (McDonald et al., 2011) found that repeat sequences are closely associated with a large proportion of indels and that the abundance of repeat sequences is linked with regions of increased nucleotide diversity.
Identification of Suitable Polymorphic Loci
Currently, DNA barcode technology is widely used in species identification, resource management, phylogeny, and evolution (Gregory, 2005; Liu et al., 2019). The comparative genome analysis using mVISTA indicated that the DNA sequence of Euonymus species was high level of similarity. Compared with the LSC and SSC regions, the sequence differentiation in the IR region was slower and more conservative due to the replication correction caused by the higher gene conversion between the two IR regions (Khakhlova and Bock, 2006). We also identified some polymorphic regions by comparison of six Euonymus species using the sliding window analysis. The nucleotide diversity was higher in SCs and non-coding regions than in IRs and coding regions, which is consistent with findings from other taxa (Ren et al., 2018). The trnH/psbA, trnS/trnS, trnS/trnR, petN/psbM, psbZ/trnG, trnW/trnP; trnP; trnP/psaJ, ycf1*/ndhF, ndhF/rpl32, ccsA/ndhD, rps15/ycf1 and protein-coding gene accD were identified as hypervariable loci at the species level within Euonymus. Among the most divergent noncoding regions, some were shown in previous studies to be highly variable and of high phylogenetic utility i.e., trnH-GUG/psbA, ndhF/rpl32, and petN/psbM (Shaw et al., 2005; Doorduin et al., 2011; Fonseca and Lohmann, 2017; Thode and Lohmann, 2019). The relatively high divergence observed in the accD, ycf1, ndhF, and rpoC2 genes is similar to that observed in other angiosperms (Park et al., 2018; Thode and Lohmann, 2019). A evolutionary tree conducted by using psbA/trnH, rp136/infA/rps8, and trnC/ycf6 showed that Sect. Echinococcus group and Sect. Kalonymus group were clustered together, but the Euonymus macroptera belongs to Sect. Kalonymus was clustered into the Sect. Echinococcus (Li, 2014). In this study, these new identified suitable polymorphic loci can be used to cost effective, develop authentic and robust molecular markers and provide information about the phylogeny of Euonymus species.
Adaptation Evolution of Celastrineae Plastome
Analyzing the adaptive evolution of genes has value for the study of variation in gene functions, structural changes, and the evolutionary trajectory of species (Nei and Kumar, 2000). Synonymous and non-synonymous nucleotide substitution patterns are important markers for gene evolution research (Raman and Park, 2016). Estimates of the ratio of non-synonymous (Ka) to synonymous (Ks) substitution rates can be used as a basis to speculate about selection pressures and the evolutionary tendencies of protein-encoding genes. The Ka/Ks ratio may be equal to, less than, or greater than one, indicating that evolution is subject to either neutral, negative, or positive selection, respectively (Yang and Nielsen, 2002). In this study, we examined the selective pressure of 60 common single copy genes in different branches of Celastrineae to test adaptive genes. The result showed that most protein coding genes were associated with low sequence difference and purification selection, which is consistent with other studies reporting that positive selection is less common than neutral evolution and negative selection (Yin et al., 2018). We also found that the rpoB genes were positively selected. The rpo genes (rpoA, rpoB, rpoC1, and rpoC2) are relatively rapidly evolving regions (Krawczyk and Sawicki, 2013). Among these, the rpoB gene within the plastid genome encodes the β-subunit of RNA Polymerase which is homologous to its bacterial counterparts (Shinozaki et al., 1986). It is located in the gene cluster rpoB-rpoCl-rpoC2 related to self-replicating. A research showed that the rpoB gene of rice chloroplast RNA polymerase was found to be highly expressed in unexpanded immature leaves that contained proplastids, indicating the specific expression of rpoB at an early stage of chloroplast development (Hitoshi et al., 1996). And the rpoB gene has been used in phylogeny reconstruction, representing DNA barcodes for land plants (Krawczyk and Sawicki, 2013).
Data Availability Statement
The original contributions presented in the study are publicly available. This data can be found at: https://www.ncbi.nlm.nih.gov/search/all/?term=MW288090/MW288090, https://www.ncbi.nlm.nih.gov/search/all/?term=MW288091/MW288091, and https://www.ncbi.nlm.nih.gov/search/all/?term=MW288092/MW288092.
Author Contributions
MY conceived and designed the experiments. YoL, YiL, and XY collected the samples and analyzed the sequence data. YoL and YD drafted the manuscript. YoL, MY, and YH revised the manuscript. All authors read and approved the final manuscript.
Funding
This study was supported by The Master Candidate Innovation Capacity Training Funding Project of Hebei Education Department (CXZZBS2020092).
Conflict of Interest
The authors declare that the research was conducted in the absence of any commercial or financial relationships that could be construed as a potential conflict of interest.
Supplementary Material
The Supplementary Material for this article can be found online at: https://www.frontiersin.org/articles/10.3389/fpls.2020.593984/full#supplementary-material
Footnotes
References
Abdullah, Henriquez, C. L., Mehmood, F., Carlsen, M. M., Islam, M., Waheed, M. T., et al. (2020a). Complete chloroplast genomes of Anthurium huixtlense and Pothos scandens (Pothoideae, Araceae): unique inverted repeat expansion and contraction affect rate of evolution. J. Mol. Evol. 88, 562–574. doi: 10.1007/s00239-020-09958-w
Abdullah, Henriquez, C. L., Mehmood, F., Shahzadi, I., Ali, Z., Waheed, M. T., et al. (2020b). Comparison of chloroplast genomes among species of unisexual and bisexual clades of the monocot family Araceae. Plan. Theory 9:737. doi: 10.3390/plants9060737
Abdullah, Mehmood, F., Shahzadi, I., Ali, Z., Islam, M., Naeem, M., et al. (2020c). Correlations among oligonucleotide repeats, nucleotide substitutions, and insertion–deletion mutations in chloroplast genomes of plant family Malvaceae. J. Syst. Evol. 1–15. doi: 10.1111/jse.12585
Abdullah, Mehmood, F., Shahzadi, I., Waseem, S., Mirza, B., Ahmed, I., et al. (2019b). Chloroplast genome of Hibiscus rosa sinensis (Malvaceae): comparative analyses and identification of mutational hotspots. Genomics 112, 581–591. doi: 10.1016/j.ygeno.2019.04.010
Abdullah, Shahzadi, I., Mehmood, F., Ali, Z., Malik, M. S., Waseem, S., et al. (2019a). Comparative analyses of chloroplast genomes among three Firmiana species: identification of mutational hotspots and phylogenetic relationship with other species of Malvaceae. Plant Gene 19:100199. doi: 10.1016/j.plgene.2019.100199
Ahmed, I., Biggs, P. J., Matthews, P. J., Collins, L. J., Hendy, M. D., and Lockhart, P. J. (2012). Mutational dynamics of aroid chloroplast genomes. Genome Biol. Evol. 4, 1316–1323. doi: 10.1093/gbe/evs110
Amiryousefi, A., Hyvönen, J., and Poczai, P. (2018). IRscope: an online program to visualize the junction sites of chloroplast genomes. Bioinformatics 34, 3030–3031. doi: 10.1093/bioinformatics/bty220
Benson, G. (1999). Tandem repeats finder: a program to analyze DNA sequences. Nucleic Acids Res. 27, 573–580. doi: 10.1093/nar/27.2.573
Bolger, A. M., Lohse, M., and Usadel, B. (2014). Trimmomatic: a flexible trimmer for Illumina sequence data. Bioinformatics 30, 2114–2120. doi: 10.1093/bioinformatics/btu170
Capellagutiérrez, S., Sillamartínez, J. M., and Gabaldón, T. (2009). Trimal: a tool for automated alignment trimming in large-scale phylogenetic analyses. Bioinformatics 25, 1972–1973. doi: 10.1093/bioinformatics/btp348
Cascales, J., Bracco, M., Garberoglio, M. J., Poggio, L., and Gottlieb, A. M. (2017). Integral Phylogenomic approach over Ilex L. species from southern South America. Life 7:47. doi: 10.3390/life7040047
Castresana, J. (2000). Selection of conserved blocks from multiple alignments for their use in phylogenetic analysis. Mol. Biol. Evol. 17, 540–552. doi: 10.1093/oxfordjournals.molbev.a026334
Chen, S., Ding, Y., Zhao, T., and Zhang, L. (2015). Research progress on cutting propagation of Euonymus plant. Northern Hortic. 12, 193–197. doi: 10.11937/bfyy.201512050
Choi, K. S., and Park, S. J. (2015). The complete chloroplast genome sequence of Euonymus japonicus (Celastraceae). Mitochondrial DNA 27, 3577–3578. doi: 10.3109/19401736.2015.1075127
Daniell, H., Lin, C. S., Yu, M., and Chang, W. J. (2016). Chloroplast genomes: diversity, evolution, and applications in genetic engineering. Genome Biol. 17, 1–29. doi: 10.1186/s13059-016-1004-2
Darling, A. C. E., Mau, B., Blattner, F. R., and Perna, N. T. (2004). Mauve: multiple alignment of conserved genomic sequence with rearrangements. Genome Res. 14, 1394–1403. doi: 10.1101/gr.2289704
Darriba, D., Taboada, G. L., Doallo, R., and Posada, D. (2012). jModelTest 2: more models, new heuristics and parallel computing. Nat. Methods 9, 772–772. doi: 10.1038/nmeth.2109
Doorduin, L., Gravendeel, B., Lammers, Y., Ariyurek, Y., Chin-A-Woeng, T., and Vrieling, K. (2011). The complete chloroplast genome of 17 individuals of pest species Jacobaea vulgaris: SNPs, microsatellites and barcoding markers for population and phylogenetic studies. DNA Res. 18, 93–105. doi: 10.1093/dnares/dsr002
Duan, K., and Zhang, H. (2019). Research Progress on pharmacological activities of different extracts of medicinal plants of Euonymus genera. J. Qujing Norm. Univ. 38, 19–23.
Edgar, R. C. (2004). MUSCLE: multiple sequence alignment with high accuracy and high throughput. Nucleic Acids Res. 32, 1792–1797. doi: 10.2460/ajvr.69.1.82
Fonseca, L. H. M., and Lohmann, L. G. (2017). Plastome rearrangements in the “Adenocalymma-Neojobertia” clade (Bignonieae, Bignoniaceae) and its phylogenetic implications. Front. Plant Sci. 8:1875. doi: 10.3389/fpls.2017.01875
Gao, L. Z., Liu, Y. L., Zhang, D., Li, W., Gao, J., Liu, Y., et al. (2019). Evolution of Oryza chloroplast genomes promoted adaptation to diverse ecological habitats. Commun. Bio. 2:278. doi: 10.1038/s42003-019-0531-2
Gerard, T., and Jose, C. (2007). Improvement of phylogenies after removing divergent and ambiguously aligned blocks from protein sequence alignments. Syst. Biol. 56, 564–577. doi: 10.1080/10635150701472164
Goulding, S. E., Wolfe, K. H., Olmstead, R. G., and Morden, C. W. (1996). Ebb and flow of the chloroplast inverted repeat. Mol. Gen. Genet. 252, 195–206. doi: 10.1007/bf02173220
Gregory, T. R. (2005). DNA barcoding does not compete with taxonomy. Nature 434:1067. doi: 10.1038/4341067b
Gu, C., Tembrock, L., Zheng, S., and Wu, Z. (2018). The complete chloroplast genome of Catha edulis: a comparative analysis of genome features with related species. Int. J. Mol. Sci. 19:525. doi: 10.3390/ijms19020525
Guindon, S., Dufayard, J. F., Lefort, V., Anisimova, M., Hordijk, W., and Gascuel, O. (2010). New algorithms and methods to estimate maximum-likelihood phylogenies: assessing the performance of PhyML 3.0. Syst. Biol. 59, 307–321. doi: 10.1093/sysbio/syq010
He, L., Qian, J., Li, X., Sun, Z., Xu, X., and Chen, S. (2017). Complete chloroplast genome of medicinal plant Lonicera japonica: genome rearrangement, intron gain and loss, and implications for phylogenetic studies. Molecules 22:249. doi: 10.3390/molecules22020249
He, S., Wang, Y., Volis, S., Li, D., and Yi, T. (2012). Genetic diversity and population structure: implications for conservation of wild soybean (Glycine sojaSieb. Et Zucc) based on nuclear and chloroplast microsatellite variation. Int. J. Mol. Sci. 13, 12608–12628. doi: 10.3390/ijms131012608
Henriquez, C. L., Abdullah, Ahmed, I., Carlsen, M. M., Zuluaga, A., Croat, T. B., et al. (2020). Evolutionary dynamics of chloroplast genomes in subfamily Aroideae (Araceae). Genomics 112, 2349–2360. doi: 10.1016/j.ygeno.2020.01.006
Hitoshi, I., Kensuke, K., Mitsuo, N., and Iba, K. (1996). Specific expression of the chloroplast gene for RNA polymerase (rpoB) at an early stage of leaf development in Rice. Plant Cell Physiol. 37, 229–232. doi: 10.1093/oxfordjournals.pcp.a028936
Huang, H., Shi, C., Liu, Y., Mao, S., and Gao, L. (2014). Thirteen camellia chloroplast genome sequences determined by high-throughput sequencing: genome structure and phylogenetic relationships. BMC Evol. Biol. 14:151. doi: 10.1186/1471-2148-14-151
Iram, S., Hayat, M. Q., Tahir, M., Gul, A., Abdullah, and Ahmed, I. (2019). Chloroplast genome sequence of Artemisia scoparia: comparative analyses and screening of mutational hotspots. Plan. Theory 8:476. doi: 10.3390/plants8110476
Jin, S., and Daniell, H. (2015). The engineered chloroplast genome just got smarter. Trends Plant Sci. 20, 622–640. doi: 10.1016/j.tplants.2015.07.004
Katoh, K., Kuma, K., Toh, H., and Miyata, T. (2005). MAFFT version 5: improvement in accuracy of multiple sequence alignment. Nucleic Acids Res. 33, 511–518. doi: 10.1093/nar/gki198
Katoh, K., and Standley, D. M. (2013). MAFFT multiple sequence alignment software version 7: improvements in performance and usability. Mol. Biol. Evol. 30, 772–780. doi: 10.1093/molbev/mst010
Kearse, M., Moir, R., Wilson, A., Stones-Havas, S., Cheung, M., Sturrock, S., et al. (2012). Geneious basic: An integrated and extendable desktop software platform for the organization and analysis of sequence data. Bioinformatics 28, 1647–1649. doi: 10.1093/bioinformatics/bts199
Keller, J., Rousseau-Gueutin, M., Martin, G. E., Morice, J., Boutte, J., Coissac, E., et al. (2017). The evolutionary fate of the chloroplast and nuclear rps16 genes as revealed through the sequencing and comparative analyses of four novel legume chloroplast genomes from Lupinus. DNA Res. 24, 343–358. doi: 10.1093/dnares/dsx0006
Khakhlova, O., and Bock, R. (2006). Elimination of deleterious mutations in plastid genomes by gene conversion. Plant J. 46, 85–94. doi: 10.1111/j.1365-313x.2006.02673.x
Kim, Y., Kwon, W., Song, M. J., Nam, S., and Park, J. (2019). The complete chloroplast genome sequence of the Nymphaea lotus L. (Nymphaeaceae). Mitochondrial DNA B Resour. 4, 389–390. doi: 10.1080/23802359.2018.1547154
Krawczyk, K., and Sawicki, J. (2013). The uneven rate of the molecular evolution of gene sequences of DNA-dependent RNA polymerase I of the genus Lamium L. Int. J. Mol. Sci. 14, 11376–11391. doi: 10.3390/ijms140611376
Kuang, D. Y., Wu, H., Wang, Y. L., Gao, L. M., Zhang, S. Z., and Lu, L. (2011). Complete chloroplast genome sequence of Magnolia kwangsiensis (Magnoliaceae): implication for DNA barcoding and population genetics. Genome 54, 663–673. doi: 10.1139/g11-026
Kurtz, S., Choudhuri, J. V., Ohlebusch, E., Schleiermacher, C., Stoye, J., and Giegerich, R. (2001). REPuter: the manifold applications of repeat analysis on a genomic scale. Nucleic Acids Res. 29, 4633–4642. doi: 10.1093/nar/29.22.4633
Kurtz, S., Phillippy, A., Delcher, A. L., Smoot, M., Shumway, M., Antonescu, C., et al. (2004). Versatile and open software for comparing large genomes. Genome Biol. 5:9. doi: 10.1186/gb-2004-5-2-r12
Laslett, D., and Canback, B. (2004). ARAGORN, a program to detect tRNA genes and tmRNA genes in nucleotide sequences. Nucleic Acids Res. 32, 11–16. doi: 10.1093/nar/gkh152
Lee, J., Kang, S. J., Shim, H., Lee, S. C., Kim, N. H., Jang, W., et al. (2019). Characterization of chloroplast genomes, nuclear ribosomal DNAs, and polymorphic SSR markers using whole genome sequences of two Euonymus hamiltonianus phenotypes. Plant Breed. Biot. 7, 50–61. doi: 10.9787/PBB.2019.7.1.50
Letunic, I., and Bork, P. (2016). Interactive tree of life (iTOL) v3: an online tool for the display and annotation of phylogenetic and other trees. Nucleic Acids Res. 44, W242–W245. doi: 10.1093/nar/gkw290
Li, Y. N. (2014). A study on phylogeny and evolution of Euonymus L. (Celastraceae) in China. Beijing Forestry University. Available at: https://kns.cnki.net/KCMS/detail/detail.aspx?dbname=CDFDLAST2015&filename=1015515130.nh (Accessed January 10, 2021).
Li, L., Christian, J. S. Jr., and David, S. R. (2003). OrthoMCL: identification of ortholog groups for eukaryotic genomes. Genome Res. 13, 2178–2189. doi: 10.1101/gr.1224503
Li, Y., Zhang, J., Li, L., Gao, L., Xu, J., and Yang, M. (2018). Structural and comparative analysis of the complete chloroplast genome of Pyrus hopeiensis—“wild plants with a tiny population”—and three other Pyrus species. Int. J. Mol. Sci. 19:3262. doi: 10.3390/ijms19103262
Librado, P., and Rozas, J. (2009). DnaSP v5: a software for comprehensive analysis of DNA polymorphism data. Bioinformatics 25, 1451–1452. doi: 10.1093/bioinformatics/btp187
Lin, S., Liu, Y., Zhang, X., and Jia, S. (2009). Development and utilization of germplasm resources of Euonymus. Jilin Fores. Sci. Techno. 38, 17–19. doi: 10.16115/j.cnki.issn.1005-7129.2009.02.014
Liu, X., Chang, E. M., Liu, J. F., Huang, Y. N., Wang, Y., Yao, N., et al. (2019). Complete chloroplast genome sequence and phylogenetic analysis of Quercus bawanglingensis Huang, Li et Xing, a vulnerable oak tree in China. Forests 10:587. doi: 10.3390/f10070587
Liu, H., He, J., Ding, C., Lyu, R., Pei, L., Cheng, J., et al. (2018). Comparative analysis of complete chloroplast genomes of Anemoclema, Anemone, Pulsatilla and Hepatica revealing structural variations among genera in tribe Anemoneae (Ranunculaceae). Front. Plant Sci. 9:1097. doi: 10.3389/fpls.2018.01097
McDonald, M. J., Wang, W. C., Huang, H. D., and Leu, J. Y. (2011). Clusters of nucleotide substitutions and insertion/deletion mutations are associated with repeat sequences. PLoS Biol. 9:e1000622. doi: 10.1371/journal.pbio.1000622
Mehmood, F., Abdullah, Ubaid, Z., Bao, Y., Poczai, P., and Mirza, B. (2020). Comparative Plastomics of Ashwagandha (Withania, Solanaceae) and identification of mutational hotspots for barcoding medicinal plants. Plan. Theory 9:752. doi: 10.3390/plants9060752
Neuhaus, H. E., and Emes, M. J. (2000). Nonphotosynthetic metabolism in plastids. Annu. Rev. Plant Physiol. Plant Mol. Biol. 51, 111–140. doi: 10.1146/annurev.arplant.51.1.111
Oldenburg, D. J., and Bendich, A. J. (2015). The linear plastid chromosomes of maize: terminal sequences, structures, and implications for DNA replication. Curr. Genet. 62, 1–12. doi: 10.1007/s00294-015-0548-0
Park, S., An, B., and Park, S. (2018). Reconfiguration of the plastid genome in Lamprocapnos spectabilis: IR boundary shifting, inversion & intraspecific variation. Sci. Rep. 8:13568. doi: 10.1038/s41598-018-31938-w
Park, J., Kim, Y., Kwon, W., Nam, S., and Xi, H. (2019b). The complete chloroplast genome of Nepal Holly, Ilex integra Thunb. (Aquifoliaceae). Mitochondrial DNA B Resour. 4, 1257–1258. doi: 10.1080/23802359.2019.1591235
Park, J., Kim, Y., Nam, S., Kwon, W., and Xi, H. (2019a). The complete chloroplast genome of horned holly, Ilex cornuta Lindl. & Paxton (Aquifoliaceae). Mitochondrial DNA B Resour. 4, 1275–1276. doi: 10.1080/23802359.2019.1591212
Pauwels, M., Vekemans, X., Godé, C., Frérot, H., Castric, V., and Saumitoulaprade, P. (2012). Nuclear and chloroplast DNA phylogeography reveals vicariance among European populations of the model species for the study of metal tolerance, Arabidopsis halleri (Brassicaceae). New Phytol. 193, 916–928. doi: 10.1111/j.1469-8137.2011.04003.x
Qian, J., Song, J., Gao, H., Zhu, Y., Xu, J., Pang, X., et al. (2013). The complete chloroplast genome sequence of the medicinal plant Salvia miltiorrhiza. PLoS One 8:e57607. doi: 10.1371/journal.pone.0057607
Raman, G., and Park, S. (2016). The complete chloroplast genome sequence of Ampelopsis: gene organization, comparative analysis, and phylogenetic relationships to other angiosperms. Front. Plant Sci. 7:341. doi: 10.3389/fpls.2016.00341
Ren, X. L., Xin, G., Jia, G., Zhang, X., Liu, H., Yang, C., et al. (2017). Characterization of the complete chloroplast genome sequence of Tapiscia sinensis (Tapisciaceae). Conserv. Genet. Resour. 10, 765–768. doi: 10.1007/s12686-017-0925-8
Ren, T., Yang, Y., Zhou, T., and Liu, Z. L. (2018). Comparative plastid genomes of primula species: sequence divergence and phylogenetic relationships. Int. J. Mol. Sci. 19:1050. doi: 10.3390/ijms19041050
Ruhfel, B. R., Gitzendanner, M. A., Soltis, P. S., Soltis, D. E., and Burleigh, J. (2014). From algae to angiosperms-inferring the phylogeny of green plants (viridiplantae) from 360 plastid genomes. BMC Evol. Biol. 14:23. doi: 10.1186/1471-2148-14-23
Saski, C., Lee, S. B., Daniell, H., Wood, T. C., Tomkins, J., Kim, H. G., et al. (2005). Complete chloroplast genome sequence of Glycine max and comparative analysis with other legume genomes. Plant Mol. Biol. 59, 309–322. doi: 10.1007/s11103-005-8882-0
Shahzadi, I., Abdullah, Mehmood, F., Ali, Z., Ahmed, I., and Mirza, B. (2019). Chloroplast genome sequences of Artemisia maritima and Artemisia absinthium: comparative analyses, mutational hotspots in genus Artemisia and phylogeny in family Asteraceae. Genomics 112, 1454–1463. doi: 10.1016/j.ygeno.2019.08.016
Shaw, J., Lickey, E. B., Beck, J. T., Farmer, S. B., Liu, W., Miller, J., et al. (2005). The tortoise and the hare II: relative utility of 21 noncoding chloroplast DNA sequences for phylogenetic analysis. Am. J. Bot. 92, 142–166. doi: 10.3732/ajb.92.1.142
Shinozaki, K., Ohme, M., Tanaka, M., Wakasugi, T., Hayashida, N., Matsubayashi, T., et al. (1986). The complete nucleotide sequence of the tobacco chloroplast genome: its gene organization and expression. EMBO J. 5, 2043–2049. doi: 10.1002/j.1460-2075.1986.tb04464.x
Sima, Y., Li, Y., and Wang, Y. (2020). The complete chloroplast genome sequence of Magnolia maudiae. Mitochondrial DNA B Resour. 5, 832–833. doi: 10.1080/23802359.2020.1715894
Song, P., Ding, Y., Zhu, G., Li, H., and Wang, Y. (2019a). Evaluation of leaf anatomical structure and drought resistance evaluation of six species of Euonymus. J. Henan Agric. Univ. 53, 574–580. doi: 10.16445/j.cnki.1000-2340.20190704.001
Song, P., Ding, Y., Zhuo, Q., Li, H., Wang, Y., Xu, Z., et al. (2019b). Physiological and biochemical characteristics of leaves during the color chang period of three species of Euonymus in autumn and winte. Acta Bot. Boreal. Occident. Sin. 39, 0669–0676. doi: 10.7606/j.issn.1000-4025.2019.04.0069
Su, L., Zhao, P. -F., Lu, X. -F., and Shao, Y. -Z. (2019). The complete chloroplast genome sequence of Abies chensiensis (Pinaceae). Mitochondrial DNA B Resour. 4, 3262–3263. doi: 10.1080/23802359.2018.1542992
Sun, M., Li, J., Li, D., and Shi, L. (2017). Complete chloroplast genome sequence of the medical fern Drynaria roosii and its phylogenetic analysis. Mitochondrial DNA B Resour. 2, 7–8. doi: 10.1080/23802359.2016.1275835
Suyama, M., Torrents, D., and Bork, P. (2006). PAL2NAL: robust conversion of protein sequence alignments into the corresponding codon alignments. Nucleic Acids Res. 34, W609–W612. doi: 10.1093/nar/gkl315
Thiel, T., Michalek, W., Varshney, R. K., and Graner, A. (2003). Exploiting EST databases for the development and characterization of gene-derived SSR markers in barley (Hordeum vulgare L.). Theor. Appl. Genet. 106, 411–422. doi: 10.1007/s00122-002-1031-0
Thode, V. A., and Lohmann, L. G. (2019). Comparative chloroplast genomics at low taxonomic levels: A case study using Amphilophium (Bignonieae, Bignoniaceae). Front. Plant Sci. 10:796. doi: 10.3389/fpls.2019.00796
Tillich, M., Lehwark, P., Pellizzer, T., Ulbricht-Jones, E. S., Fischer, A., Bock, R., et al. (2017). GeSeq-versatile and accurate annotation of organelle genomes. Nucleic Acids Res. 7, W6–W11. doi: 10.1093/nar/gkx391
Wang, W. C., Chen, S. Y., and Zhang, X. Z. (2017). Characterization of the complete chloroplast genome of the golden crane butterfly, Euonymus schensianus (Celastraceae). Conserv. Genet. Resour. 9, 1–3. doi: 10.1007/s12686-017-0719-z
Wang, D., Zhang, Y., Zhang, Z., Jiang, Z., and Yu, J. (2010). KaKs_Calculator 2.0: a toolkit incorporating gamma-series methods and sliding window strategies. Genom. Proteom. Bioinform. 8, 77–80. doi: 10.1016/s1672-0229(10)60008-3
Wei, R., Yan, Y. H., Harris, A., Kang, J. S., Shen, H., Xiang, Q. P., et al. (2017). Plastid Phylogenomics resolve deep relationships among Eupolypod II ferns with rapid radiation and rate heterogeneity. Genome Biol. Evol. 9, 1646–1657. doi: 10.1093/gbe/evx107
Weng, M. L., Blazier, J. C., Govindu, M., and Jansen, R. K. (2013). Reconstruction of the ancestral plastid genome in Geraniaceae reveals a correlation between genome rearrangements, repeats and nucleotide substitution rates. Mol. Biol. Evol. 31, 645–659. doi: 10.1093/molbev/mst257
Wheeler, T. J., and Eddy, S. R. (2013). Nhmmer: DNA homology search with profile HMMs. Bioinformatics 29, 2487–2489. doi: 10.1093/bioinformatics/btt403Wolfe
Wolfe, K. H., Li, W. H., and Sharp, P. M. (1987). Rates of nucleotide substitution vary greatly among plant mitochondrial, chloroplast, and nuclear DNAs. Proc. Natl. Acad. Sci. U.S.A. 84, 9054–9058. doi: 10.1073/pnas.84.24.9054
Yang, Z. (2007). PAML 4: phylogenetic analysis by maximum likelihood. Mol. Biol. Evol. 24, 1586–1591. doi: 10.1093/molbev/msm088
Yang, Z., and Dos, R. M. (2010). Statistical properties of the branch-site test of positive selection. Mol. Biol. Evol. 28, 1217–1228. doi: 10.1093/molbev/msq303
Yang, Z., and Nielsen, R. (2002). Codon-substitution models for detecting molecular adaptation at individual sites along specific lineages. Mol. Biol. Evol. 19, 908–917. doi: 10.1093/oxfordjournals.molbev.a004148
Yang, Z., Wong, W. S. W., and Nielsen, R. (2005). Bayes empirical bayes inference of amino acid sites under positive selection. Mol. Biol. Evol. 22, 1107–1118. doi: 10.1093/molbev/msi097
Yang, X., Zhou, T., Su, X., Wang, G., Zhang, X., Guo, Q., et al. (2020). Structural characterization and comparative analysis of the chloroplast genome of Ginkgo biloba and other gymnosperms. J. Forest. Res. doi: 10.1007/s11676-019-01088-4
Yao, X., Tan, Y. H., Liu, Y. -Y., Song, Y., Yang, J. B., and Corlett, R. T. (2016). Chloroplast genome structure in Ilex (Aquifoliaceae). Sci. Rep. 6:28559. doi: 10.1038/srep28559
Ye, W. Q., Yap, Z. Y., Li, P., Comes, H. P., and Qiu, Y. X. (2018). Plastome organization, genome-based phylogeny and evolution of plastid genes in Podophylloideae (Berberidaceae). Mol. Phylogenet. Evol. 127, 978–987. doi: 10.1016/j.ympev.2018.07.001
Yin, K., Zhang, Y., Li, Y., and Du, F. (2018). Different natural selection pressures on the atpF gene in evergreen sclerophyllous and deciduous oak species: evidence from comparative analysis of the complete chloroplast genome of Quercus aquifolioides with other oak species. Int. J. Mol. Sci. 19:1042. doi: 10.3390/ijms19041042
Yu, X. Q., Drew, B. T., Yang, J. B., Gao, L. M., and Li, D. Z. (2017a). Comparative chloroplast genomes of eleven Schima (Theaceae) species: insights into DNA barcoding and phylogeny. PLoS One 12:e178026. doi: 10.1371/journal.pone.0178026
Yu, X. Q., Gao, L. M., Soltis, D. E., Soltis, P. S., Yang, J. -B., Fang, L., et al. (2017b). Insights into the historical assembly of east Asian subtropical evergreen broadleaved forests revealed by the temporal history of the tea family. New Phytol. 215, 1235–1248. doi: 10.1111/nph.14683
Zhang, X., Zhou, T., Kanwal, N., Zhao, Y. M., Bai, G. Q., and Zhao, G. F. (2017). Completion of eight Gynostemma B.L. (Cucurbitaceae) chloroplast genomes: characterization, comparative analysis, and phylogenetic relationships. Front. Plant Sci. 8:1583. doi: 10.3389/fpls.2017.01583
Zhao, Z., Gao, A., and Huang, J. (2019). Sequencing and analysis of chloroplast genome of Clausena lansium (lour.) Skeels. Anhui. Agric. Sci. 47, 115–118. doi: 10.3969/j.issn.0517-6611.2019.11.032
Zheng, S., Poczai, P., Hyvönen, J., Tang, J., and Amiryousefi, A. (2020). Chloroplot: An online program for the versatile plotting of organelle genomes. Front. Genet. 11:576124. doi: 10.3389/fgene.576124
Zhou, T., Ruhsam, M., Wang, J., Zhu, H., Li, W., Zhang, X., et al. (2019). The complete chloroplast genome of Euphrasia regelii, Pseudogenization of ndh genes and the phylogenetic relationships within Orobanchaceae. Front. Genet. 10:444. doi: 10.3389/fgene.2019.00444
Keywords: Euonymus, chloroplast genome, adaptive evolution, molecular marker, phylograms
Citation: Li Y, Dong Y, Liu Y, Yu X, Yang M and Huang Y (2021) Comparative Analyses of Euonymus Chloroplast Genomes: Genetic Structure, Screening for Loci With Suitable Polymorphism, Positive Selection Genes, and Phylogenetic Relationships Within Celastrineae. Front. Plant Sci. 11:593984. doi: 10.3389/fpls.2020.593984
Edited by:
Peter Poczai, University of Helsinki, FinlandReviewed by:
Ibrar Ahmed, Alpha Genomics Private Limited, PakistanAbdullah, Quaid-i-Azam University, Pakistan
Copyright © 2021 Li, Dong, Liu, Yu, Yang and Huang. This is an open-access article distributed under the terms of the Creative Commons Attribution License (CC BY). The use, distribution or reproduction in other forums is permitted, provided the original author(s) and the copyright owner(s) are credited and that the original publication in this journal is cited, in accordance with accepted academic practice. No use, distribution or reproduction is permitted which does not comply with these terms.
*Correspondence: Minsheng Yang, eWFuZ21zMTAwQDEyNi5jb20=; Yinran Huang, MTM5MzMwMDE4MzhAMTYzLmNvbQ==
†These authors have contributed equally to this work and share co-first authorship