 Sophia V. Yudina1,2,3
 Mikhail I. Schelkunov2,4
 Lars Nauheimer5
 Darren Crayn5
 Sahut Chantanaorrapint6
 Michal Hroneš7
 Michal Sochor8
 Martin Dančák7
 Shek-Shing Mar9Hong Truong Luu10
 Maxim S. Nuraliev1,3
 Maria D. Logacheva2,4*
- 1Faculty of Biology, Lomonosov Moscow State University, Moscow, Russia
- 2Institute for Information Transmission Problems, Moscow, Russia
- 3Joint Russian-Vietnamese Tropical Scientific and Technological Center, Hanoi, Vietnam
- 4Skolkovo Institute of Science and Technology, Moscow, Russia
- 5Australian Tropical Herbarium, James Cook University, Cairns, QLD, Australia
- 6Division of Biological Science, Faculty of Science, Prince of Songkla University, Hat Yai, Thailand
- 7Faculty of Science, Palacký University Olomouc, Olomouc, Czechia
- 8Centre of the Region Haná for Biotechnological and Agricultural Research, Crop Research Institute, Olomouc, Czechia
- 9Ying Wa College, Hong Kong, China
- 10Southern Institute of Ecology, Graduate University of Science and Technology, Vietnam Academy of Science and Technology, Ho Chi Minh City, Vietnam
Heterotrophic plants provide intriguing examples of reductive evolution. This is especially evident in the reduction of their plastid genomes, which can potentially proceed toward complete genome loss. Several milestones at the beginning of this path of degradation have been described; however, little is known about the latest stages of plastome reduction. Here we analyze a diversity of plastid genomes in a set of closely related non-photosynthetic plants. We demonstrate how a gradual loss of genes shapes the miniaturized plastomes of these plants. The subject of our study, the genus Thismia, represents the mycoheterotrophic monocot family Thismiaceae, a group that may have experienced a very ancient (60–80 mya) transition to heterotrophy. In all 18 species examined, the plastome is reduced to 14–18 kb and is highly AT-biased. The most complete observed gene set includes accD, seven ribosomal protein genes, three rRNA, and two tRNA genes. Different clades of Thismia have undergone further gene loss (complete absence or pseudogenization) compared to this set: in particular, we report two independent losses of rps2 and rps18.
Introduction
Heterotrophic plants are an intriguing ecological group of organisms. Most plants, which obtain carbon compounds through fixation of atmospheric carbon dioxide, use the energy of light (photosynthesis), but heterotrophs obtain fixed carbon from other plants or fungi (Leake, 1994; Těšitel, 2016). The heterotrophic way of life is associated with highly modified morphology, physiology, and genome organization (Merckx, 2013; Yuan et al., 2018). Plastomes of heterotrophic plants show considerable gene loss, size reduction (the plastome size decreases up to 11 vs. 110–200 kb in autotrophic plants) and usually elevated substitution rates [reviewed in Graham et al. (2017)]. However, in most non-photosynthetic plants, plastomes are retained because they perform vital functions unrelated to photosynthesis (Barbrook et al., 2006). The initial stages of modification of the plastid genome in heterotrophic plants have been broadly studied in different lineages (Barrett et al., 2014, 2018, 2019; Samigullin et al., 2016); they consist of rapid and coordinated loss or pseudogenization of photosynthesis-related genes. The variation of the overall plastome structure in heterotrophs of recent origin is typically minor. The middle stages of plastome reduction have been also extensively studied in both parasitic and mycoheterotrophic plants (Wicke et al., 2016; Lallemand et al., 2019; Chen et al., 2020). These studies have shown that the patterns of gene loss in general follow the model of Barrett and Davis (Barrett and Davis, 2012). This model postulates that the first to be lost are the genes related to photosynthesis and the last – genes related to the translation (ribosomal and transfer RNAs, ribosomal proteins) and other “housekeeping” functions. In contrast to initial and middle stages of plastome reduction, species with a high level of reduction have never been characterized in a phylogenetic context with a dense taxonomic sampling. Although there are many reports of single or several highly reduced plastomes (e.g., Schelkunov et al., 2015; Bellot and Renner, 2016), these studies have been focused mostly on the reduction itself, and on the similarity (or difference) of reduction patterns in unrelated groups. The model thus lacks resolution for the group of “the last ones to be lost” genes – it is clear that they can be also lost but the tendencies of the loss are not completely clear. To better understand the steps that led to the highly reduced plastome structure, we focused on patterns of variation of the genomes and gene sets in a group of closely related species, in the genus Thismia (Thismiaceae, Dioscoreales). This is an exclusively heterotrophic genus (the family is also fully heterotrophic) comprising about 90 species that are widely distributed in tropical and subtropical regions of Asia, Australasia, and America, but extending to some temperate areas. Representatives of Thismia are tiny herbs, remarkable for their unusual appearance, curious flower morphology and highly specialized pollination biology (Merckx, 2013; Guo et al., 2019; Dančák et al., 2020a; Shepeleva et al., 2020; Nuraliev et al., 2021). Thismiaceae may represent one of the most ancient mycoheterotrophic groups of plants: according to Merckx et al. (2010), they appear to have originated in the late Cretaceous, although Givnish et al. (2018) infer a much more recent origin. We assembled complete and nearly complete plastomes for 17 species of Thismia and compared them with the previously characterized plastome of Thismia tentaculata K.Larsen & Aver (Lim et al., 2016). Using this expanded dataset of Thismia plastomes we identified changes in structure and gene content of the plastid genome, and performed phylogenetic reconstruction based on the plastid gene sets.
Materials and Methods
Sequencing and Assembly
We included data for 18 species of Thismia, 17 of which were generated de novo here, with each species represented by a single specimen (see Supplementary Table 1 for material information). Sequences for Thismia tentaculata (KX171421), Dioscorea elephantipes Engl. & Drude (NC_009601), Burmannia disticha L. (NC_036661), Burmannia coelestis D. Don (NC_036660), Tacca chantrieri André (KX171420), and Tacca leontopetaloides (L.) Kuntze (NC_036658), used in the phylogenetic and comparative analyses, were obtained from GenBank (accession numbers in parentheses). Total genomic DNAs were extracted from fresh, herbarium, and silica gel-dried material using the protocol of Doyle and Doyle (1987). DNAs were fragmented using a Covaris S220 sonicator (Covaris, United States) with the following settings: time 40 s, peak power 175 W, duty cycle 10%. Genome libraries were prepared using a method based on ligation of partially double-stranded adapters to adenylated DNA (Bentley et al., 2008) with a NEBNext Ultra II DNA kit (New England Biolabs, United States). Libraries were sequenced using several Illumina platforms: HiSeq, MiSeq, and NextSeq (Illumina, United States). For the data generated in this study (except for Thismia mucronata Nuraliev, Thismia hawkesii W.E.Cooper, and Thismia lanternata W.E.Cooper, see below), reads were trimmed and assembled using CLC Genomics Workbench v. 7.0.3 with the following parameters: word size and bubble size = default, minimal contig length = 1000, mismatch cost = 2, insertion cost = 3, deletion cost = 3, length fraction = 0.98, and similarity fraction = 0.99. Plastid contigs were selected from the total set of contigs based on their coverage and similarity to the T. tentaculata plastome. All candidate contigs were checked using nucleotide-based BLAST searches (Camacho et al., 2009) to exclude mitochondrial and high-copy nuclear genome fragments. The resulting contigs for each species were searched for overlaps between ends and then joined. The borders of the inverted repeat (IR) and single copy regions were identified by manual searching and alignment of reads spanning possible junction points.
The plastomes of T. hawkesii and T. lanternata were assembled using Geneious Prime1, then reads were mapped onto the plastome of T. tentaculata as reference and the retrieved contig sequences were extended by remapping the reads onto them until only three contigs remained (presumed to correspond to the single copy and inverted repeat regions of the plastome). These contigs were concatenated to obtain the full plastome sequence. A final remapping of reads was performed to ensure the plastome sequences were recovered fully and without overall assembly errors.
For the plastome of T. mucronata, which was the first plastome to be assembled and the only one sequenced using longer reads (255+255) on MiSeq, we used an alternative approach. Its reads were trimmed using Trimmomatic 0.32 (Bolger et al., 2014), removing both adapters and read regions with low quality. We then joined overlapping reads using fastq-join from the ea-utils 1.1.2 set of tools (Aronesty, 2013), requiring reads to merge if they overlapped by at least 30 bp with at least 80% sequence similarity. To filter for nuclear sequences, we used Kmernator 1.2.02 to remove all 31 bp k-mers that had sequencing coverage less than 30X. We assembled resulting single reads using Newbler 2.6, an assembler initially developed for 454 (Roche, Switzerland) data but which we found to be suitable for assembling relatively long Illumina reads. Contigs of plastid origin were then selected using BLAST and extended using Mapsembler 1.3.21 (Peterlongo and Chikhi, 2012) using a k-mer size of 75 bp. For T. mucronata, we checked IR borders using polymerase chain reaction and further visualization of PCR products on the agarose gel for length estimation (primer pairs Thism-C2-F/Thism-C1-R for LSC/IRa, Thism-C1-F/Thism-C7+C6-R for IRa/SSC, Thism-C7+C6-F/Thism-C1-F for SSC/IRb, and Thism-C1-R/Thism-C2-R for IRb/LSC, for primer sequences and locations see Supplementary Table 2).
For all species partial and complete plastid genome sequences were annotated using DOGMA (Wyman et al., 2004) and Chlorobox (Tillich et al., 2017) using relaxed parameters for protein and RNA identity. Identification and annotation of tRNA and rRNA genes was also performed using online tRNAscan-SE (Chan and Lowe, 2019) and RNAmmer 1.2 (Lagesen et al., 2007). The annotation was then checked and corrected manually based on the alignment with orthologous genes from T. tentaculata and other relative species. For the visualization of plastid genome maps we used OGDraw (Lohse et al., 2007).
For transcriptome sequencing, we extracted RNA from above-ground parts of the living plant of Thismia puberula Nuraliev using RNeasy Mini kit (Qiagen, Netherlands). RNAs from different above-ground parts of the plant were pooled in equal amounts and used for further sample preparation. For the removal of ribosomal RNA we used Ribo-Zero Plant kit (Illumina, United States). The library was prepared using NEBNext Ultra II RNA sample preparation kit (New England Biolabs, United States) according to the manufacturer’s instructions, except for the duration of fragmentation time (1 min). For sequencing, we used NextSeq instrument (Illumina, United States) in 150 bp paired-end mode. Assembly was performed using CLC Genomics Workbench with the settings described above for plastid genomes. In order to estimate expression levels and to detect RNA editing we mapped the reads against the plastome of T. puberula. The parameters for mapping were as follows: mismatch cost 2, insertion cost 3, deletion cost 3, length fraction 1.0, similarity fraction 0.99.
Phylogenetic Inference
We aligned genes from all Thismia plastid genomes and an outgroup in the same order (D. elephantipes, Dioscoreaceae), for protein-coding genes using TranslatorX 1.1 with MAFFT 7.402 (Abascal et al., 2010; Katoh and Standley, 2013), and for rRNA- and tRNA-coding genes using MAFFT 7.402. We pruned alignments using Gblocks 0.91b (Castresana, 2000), with default parameters except that columns were removed based on the proportion of sequences with gaps only if there were gaps in at least 50% of sequences. By default, a gap in a single sequence is enough for Gblocks to remove a column. After pruning, separate alignments for each gene were concatenated together. We inferred phylogenetic trees using three methods (1, 2 are maximum likelihood methods, 3 is a Bayesian inference method):
To infer the alignment partitioning and the nucleotide substitution models that are optimal for phylogenetic tree building, we used IQ-TREE 2.0.6 (Minh et al., 2020) with the extended model selection option (“-m MFP”). Based on the Bayesian information criterion, IQ-TREE suggested to split the alignment into the following three partitions:
1. The genes rrn16 and rrn23 with the substitution model GTR+F+R3. “GTR” is the general time reversible model. “F” means base frequencies were calculated directly from the multiple alignment. “R3” means the FreeRate model of substitution rates with 3 site categories.
2. The genes accD, rpl2, rps12, rps18, rps2, trnE-UUC, trnfM-CAU, and rrn5 with the substitution model TVM+F+G4. “TVM” is a model similar to GTR but with the A→G substitution rate equal to the C→T substitution rate. “G4” is the Gamma model of substitution rates with 4 site categories.
3. The genes rps3, rps4, and rps8 with the substitution model TPM2+F+G4. TPM2 is a model with the A→C substitution rate equal to the A→T substitution rate, the A→G substitution rate equal to the C→T substitution rate, and the C→G substitution rate equal to the G→T substitution rate.
We inferred phylogenetic trees using three methods (1, 2 are maximum likelihood methods, 3 is a Bayesian inference method):
1. IQ-TREE 2.0.6. Bootstrap support values for the maximum likelihood tree were calculated using 1000 iterations of the UFBoot algorithm (Hoang et al., 2018).
2. RAxML 8.2.12 (Stamatakis, 2014) with 20 starting maximum parsimony trees. Bootstrap support values for the maximum likelihood tree were calculated using the Rapid Bootstrap algorithm with the number of bootstrap pseudoreplicates determined by RAxML automatically (the “autoMRE” option). RAxML has a scarcer choice of nucleotide substitution models than IQ-TREE, particularly it has no analogs of IQ-TREE’s TVM, TPM2, and R3. For this reason, we used GTR+F+G4 models, which are similar to the models advised by IQ-TREE, for each of the three partitions.
3. MrBayes 3.2.7 (Ronquist et al., 2012) with four Markov chains, each of 2,500,000 generations, and sampling frequency of 500 generations. Majority-rule consensus trees were calculated after excluding the first 25% of samples. The model choice in MrBayes is scarcer than in IQ-TREE. Particularly, similar to RAxML, it isn’t capable of using TVM, TPM2, and R3. For this reason, we used GTR+F+G4 models for each of the three partitions.
We reconstructed the history of gene losses by Mesquite 3.51 (Maddison and Maddison, 2018) using the maximum parsimony method.
Selection Analysis
To perform selection analyses that consider the ratio of non-synonymous to synonymous substitutions (dN/dS), we aligned protein-coding genes as described in the “Phylogenetic Inference” section, but instead of using D. elephantipes as the outgroup, we used B. disticha, B. coelestis, T. chantrieri, and T. leontopetaloides. All three methods of tree construction (see above) resulted in trees with the same topology, which was assumed for the selection analysis. The dN/dS analysis was performed using PAML 4.9 (Yang, 2007). An unrooted topology provided to PAML, thus the placement of Thismia, Burmannia, and Tacca clades with respect to each other is not relevant. For each gene, we ran PAML two times:
1. In the first calculation, one dN/dS value was allowed for Thismia branches, a second dN/dS value for branches of photosynthetic species, and a third for the branch where photosynthesis is assumed to have been lost (i.e., the stem lineage of Thismia; in unrooted terms, the branch connecting the clade of Thismia to the Burmannia and Tacca clades). The third dN/dS value was on the branches of Burmannia and Tacca.
2. In the second calculation, one dN/dS value was allowed for the branch where photosynthesis was lost and the other dN/dS value for all other branches.
A separate value for the branch where photosynthesis was lost is desirable because that branch can be attributed neither to non-photosynthetic nor to photosynthetic plants.
P-values for the hypothesis of dN/dS difference between non-photosynthetic and photosynthetic species were calculated for each gene separately using the likelihood ratio test. We performed the multiple hypothesis testing correction using the method of Benjamini and Hochberg (1995) to account for the fact that each gene required a separate test.
We used PAML with the following parameters: runmode = 0, seqtype = 1, CodonFreq = 2, icode = 0, model = 2, NSsites = 0, fix_kappa = 0, kappa = 2.0, fix_omega = 0, omega = 0.5, fix_blength = 0, cleandata = 0.
The removal of alignment columns with gaps may influence the dN/dS calculations, because indels likely occur in regions with neutral or positive selection and less likely to occur in regions with negative selection. To evaluate the influence of gap removal, we performed two additional dN/dS calculations. In the first, Gblocks was set to remove columns if they had one or more gaps. In the second, we calculated dN/dS based on the alignment not pruned by Gblocks.
Analysis of AT Content, Codon Usage, and Amino Acid Frequencies
Codon usage and amino acid frequencies were calculated using CodonW 1.4.2 (Peden, 1999) based on the subset of protein-coding genes present in all completely assembled plastomes of Thismia, B. disticha, B. coelestis, T. chantrieri, and T. leontopetaloides. To compare amino acid frequencies between Thismia and photosynthetic species, we used the function OUWie from the package of the same name (Beaulieu et al., 2012). By fitting Ornstein-Uhlenbeck processes to the phylogeny, the function OUWie allows estimation of whether several clades have significantly different values of some parameter. For each amino acid, we tested the model by assuming a single Ornstein-Uhlenbeck process for the whole tree, or a model with two Ornstein-Uhlenbeck processes, where the “center parameter” of the model changes on the branch where photosynthesis is assumed to have been lost. P-values were calculated by the likelihood ratio test and then the Benjamini-Hochberg correction was performed for multiple tests. This allowed us to compare differences in usages of particular amino acids. In addition, we analyzed the tendency to use amino acids with more AT-rich codons. This “tendency” was calculated for each species as the Spearman’s correlation coefficient between the frequencies of amino acids in plastid-encoded proteins and the average AT contents of codons of these amino acids. The tendencies were compared between Thismia and photosynthetic species using OUWie, using the same method we used for frequencies of separate amino acids, except that the Benjamini-Hochberg correction was not needed as there was only a single test performed. To forecast the future evolution of AT content, we used the “equilibrium AT content,” the AT content that would established if the frequencies of nucleotide substitutions stay the same as at present. The equilibrium AT content can be considered an asymptote toward which the AT content of some sequence is currently heading.
If we denote guanine or cytosine as [GC] and adenine or thymine as [AT], then nucleotide substitutions can be represented as
where k1 is the frequency of substitution of [GC] by [AT] and k2 is the frequency of substitution of [AT] by [GC]. If we denote by NGC the number of [GC] in a genomic sequence and by NAT the number of [AT] in the genomic sequence, then the rate of change of NGC is:
By NAT–eq and NGC–eq we can derive the numbers of [AT] and [GC] when an equilibrium is reached.
The equilibrium AT content is then:
When the equilibrium is reached, NGC stops changing, and so:
From equations (2) and (3), it follows that:
The calculation of the equilibrium AT content was performed for the concatenated sequences of common protein-coding, rRNA-coding and tRNA-coding genes of Thismia and D. elephantipes after pruning by Gblocks. To calculate k1 and k2, which are the rates of [GC] → [AT] and [AT] → [GC] substitutions, we performed an ancestral sequence reconstruction by FastML 3.11 (Moshe and Pupko, 2019), separately for protein-coding genes, and for rRNA- and tRNA-coding genes.
GTR+Gamma models were used in both cases. Ancestral indels were reconstructed by the maximum likelihood method. Then the results of the reconstructions for these two gene sets were concatenated and the calculations described further were performed for the concatenated sequences. k1 for each branch was calculated as the number of [GC] → [AT] substitutions divided by NGC, in turn divided by the time that the branch existed. Similarly, k2 was calculated as the number of [AT] → [GC] substitutions divided by NAT and then divided by the time that the branch existed. Because the time cancels out in equation (5), we did not need to calculate it. Confidence intervals for the equilibrium AT content were calculated by performing these analyses for 1000 bootstrap pseudoreplicates of the alignment, taking the 2.5th and the 97.5th percentiles of the equilibrium AT content.
Other Analyses
To calculate mutation frequencies in different nucleotide contexts (i.e., the nucleotides that surround a given nucleotide) we used the ancestral reconstruction made by FastML for protein-coding genes. For each branch, we counted the number of synonymous substitutions that happened in a specific nucleotide context and the total number of synonymous substitutions that could happen in that context, including those that did not happen. For each context we summarized those values over all branches in the clade of Thismia and divided the first value by the second, thus obtaining the frequencies of substitutions in specific contexts. Assuming that synonymous substitutions are approximately neutral, this value can be used as a proxy for mutational frequencies in contexts.
Results and Discussion
Plastome Assembly, Structure, and Gene Content
The number of reads obtained for each species varied from 1,312,880 to 40 million (Supplementary Table 1). For all species studied, at least one plastid contig was recovered. We assembled complete sequences for seven species, and partial sequences comprising from 8 to 14 genes for ten others (Figure 1 and Supplementary Figure 1). The inability to obtain complete sequences was not related to the low coverage. This may be related to factors that adversely affect the efficiency of the assembly, such as repeats or low-complexity regions, the presence of contaminants and/or mitochondrial DNA of plastid origin.
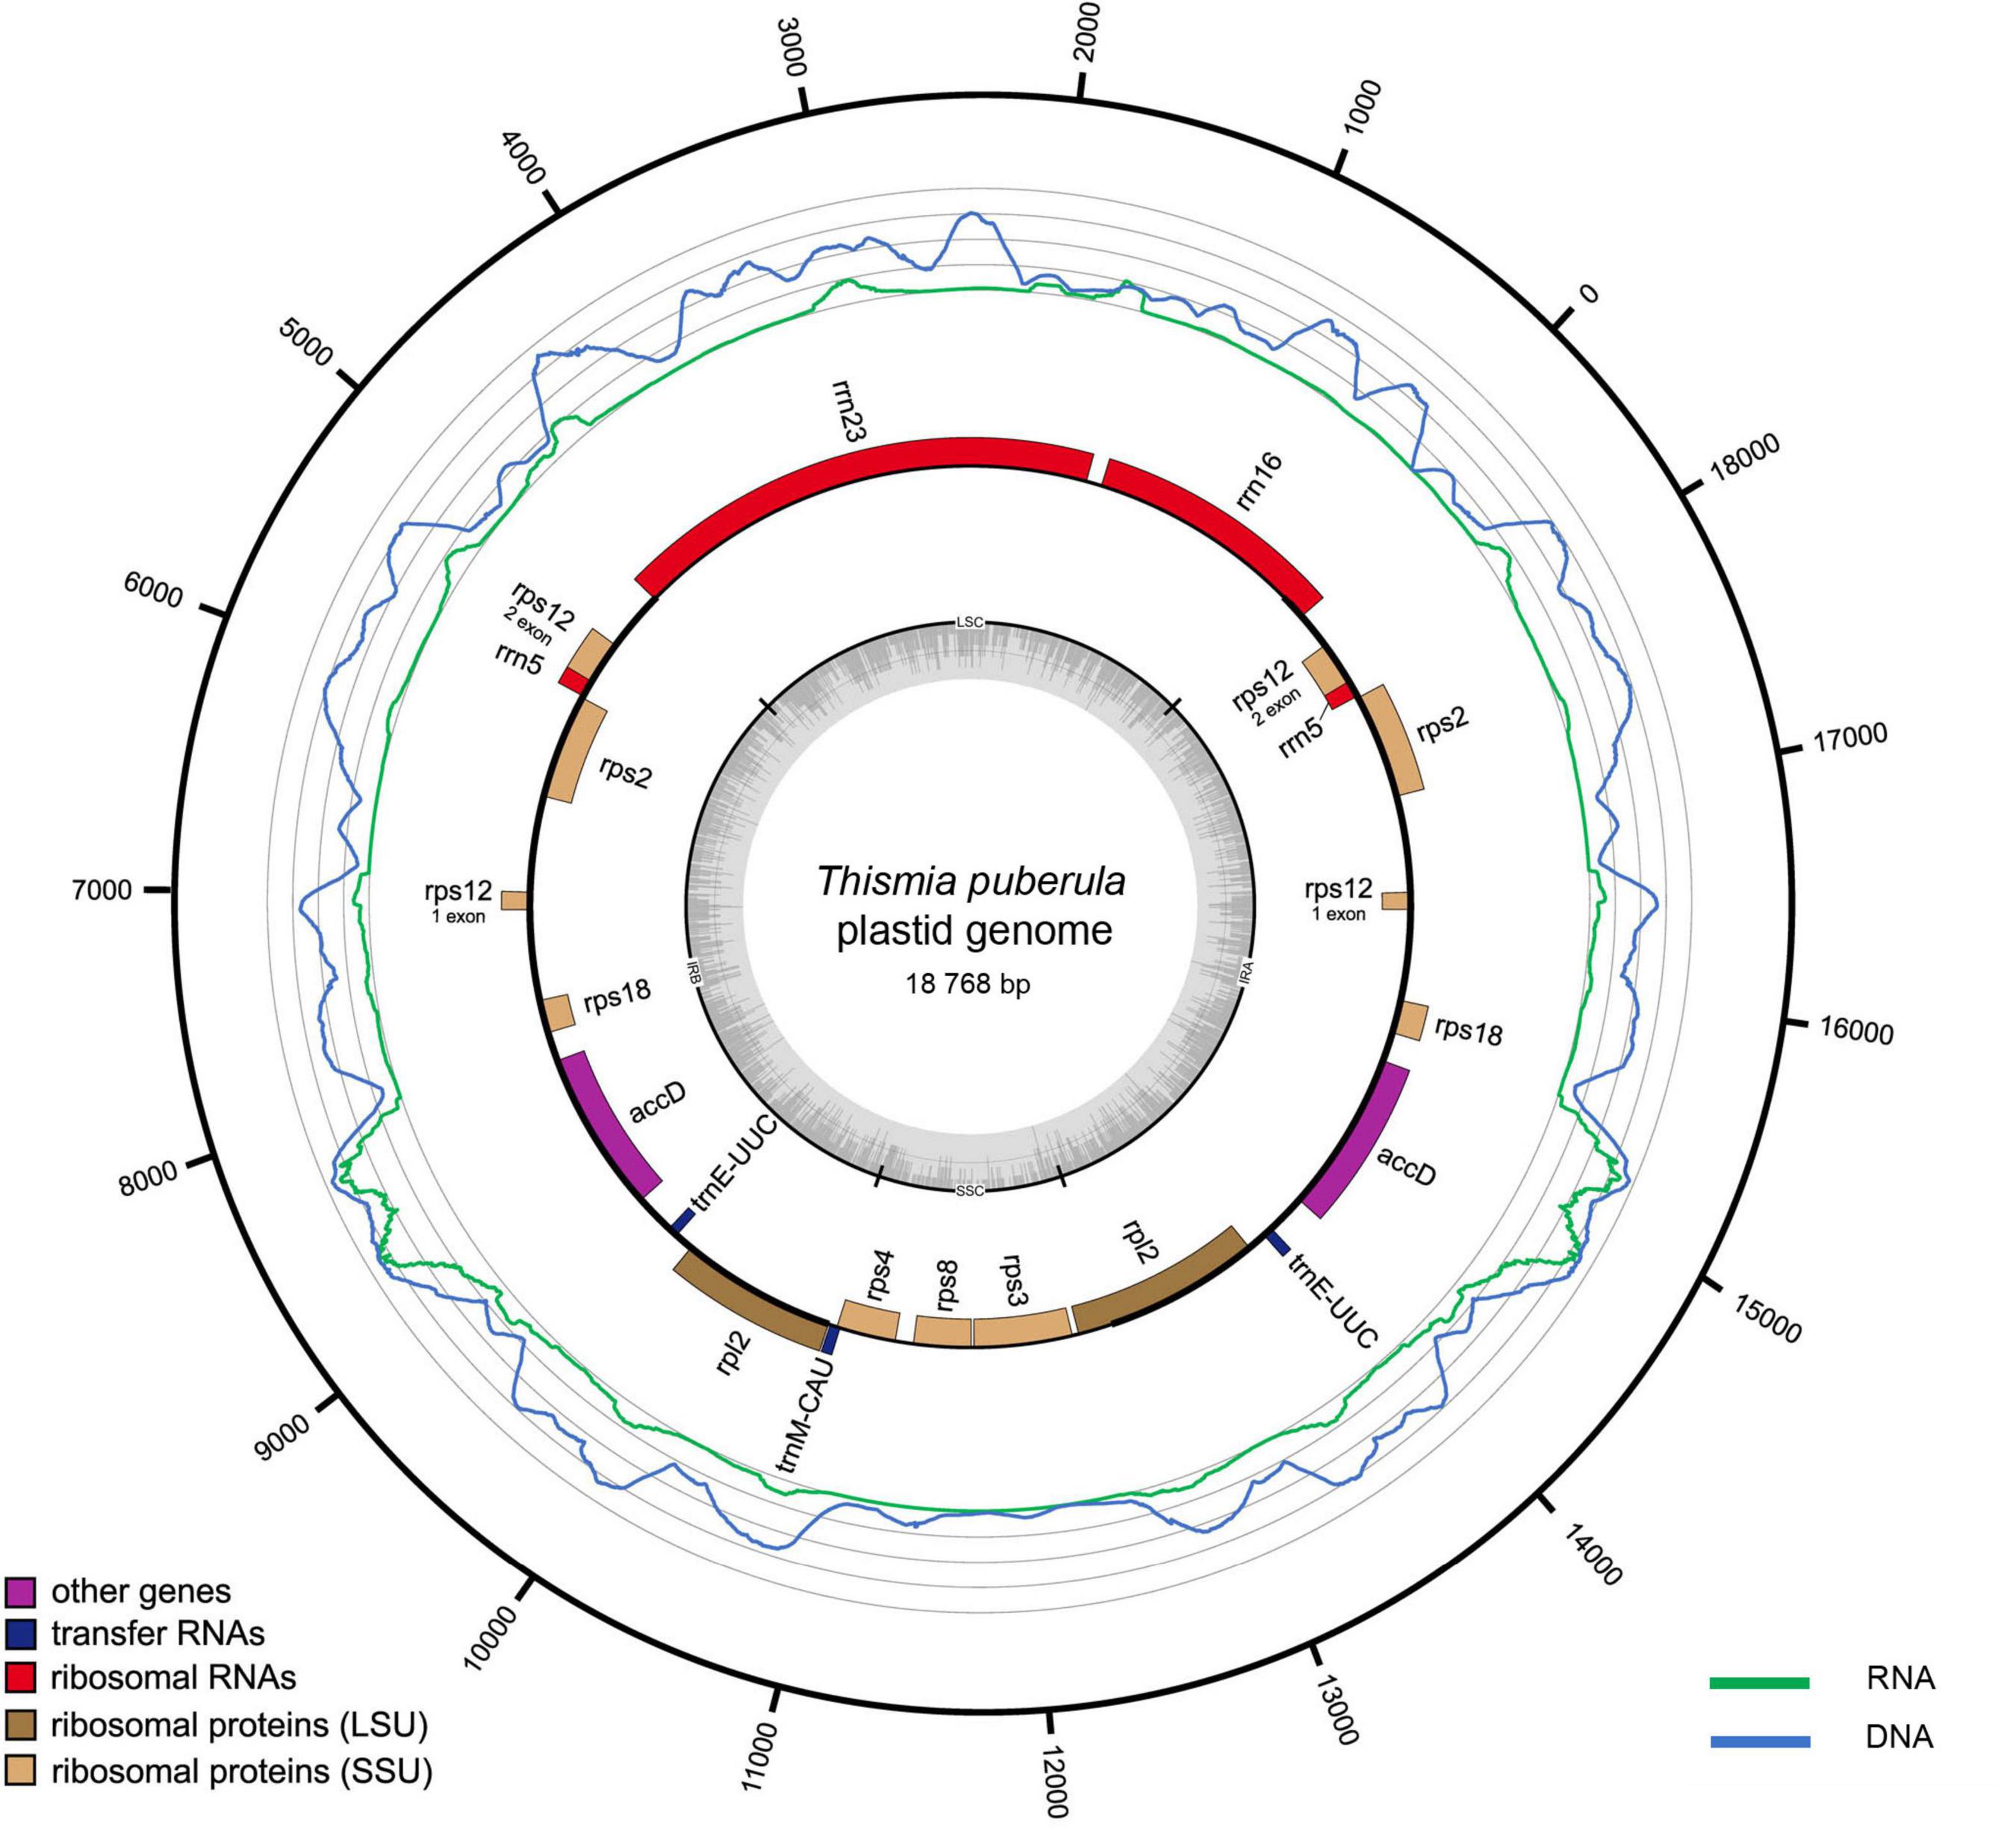
Figure 1. Plastid genome of Thismia puberula, its GC-content, gene expression and coverage by genomic DNA sequencing reads. This species has the largest gene set and was available as a living plant allowing to analyze the transcriptome. Dark gray dashes denote GC content; thick black lines denote IR and thinner lines denote single copy regions. Genes shown outside of the circle are transcribed counterclockwise and those inside are transcribed clockwise. Green and blue lines show coverage by transcriptome reads and genomic DNA reads. Gray circles correspond to a 1000x coverage for transcriptome and 2000x for DNA.
The length of complete plastomes ranged from 14,060 bp in Thismia thaithongiana Chantanaorr. & Suddee to 18,768 bp in T. puberula (Table 1). They all have a typical quadripartite structure including large single copy (LSC) and small single copy (SSC) regions divided by an inverted repeat (IR) region. As expected, the gene set in these full mycoheterotrophs was drastically lower compared with that in photosynthetic plants. For the majority of studied species, we found a large IR that includes accD, rps2, rps12, rps18, rpl2, rrn5, trnE-UUC, and trnfM-CAU. The LSC typically consists of rrn16 and rrn23, and the SSC of rps3, rps4, and rps8. The IR of T. tentaculata was much shorter than others and included only trnM, rpl2, trnE, and accD (Lim et al., 2016). On a smaller scale, there were minor variations in the position of IR-SC borders. At the IR-SSC border, the IR included trnfM-CAU and/or the second exon of rpl2 in Thismia filiformis Chantanaorr., Thismia gardneriana Hook.f. ex Thwaites, T. tentaculata, T. thaithongiana and lacked these genes in the other species. At the IR-LSC border, a small contraction of IR was observed in T. thaithongiana where it ends in rps12 instead of the more usual rrn16.
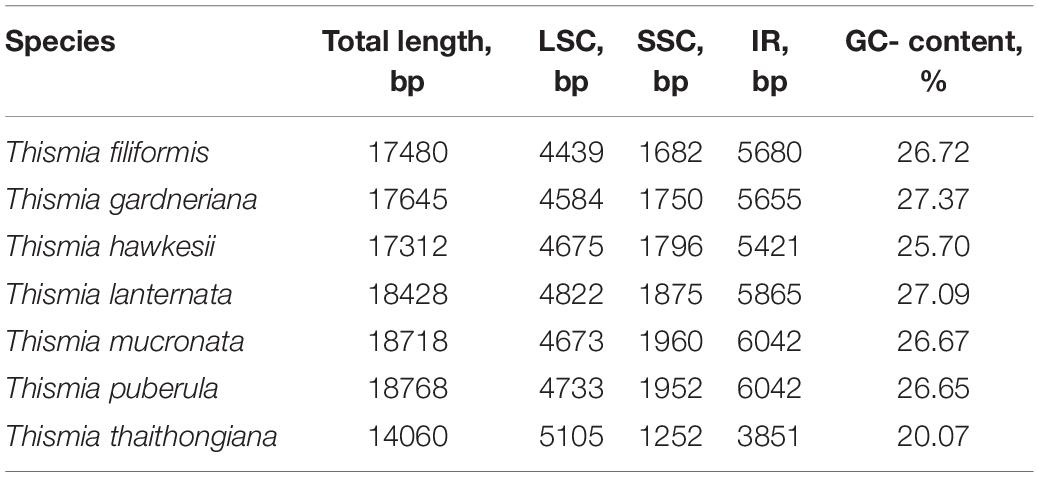
Table 1. Characteristics of complete plastomes of Thismia.
Five genes – accD, rpl2, rrn16, rrn23, trnE – were present as complete genes in all complete plastome sequences; for the first two genes, an open reading frame (ORF) with a typical start and stop and a domain characteristic for a given protein was found. We also found all five genes, at least as a fragment, in the uncompleted genomes; thus, these genes likely constitute a core set of plastid genes in Thismia (Supplementary Table 3).
The plastomes of most species also had rps2, rps12, rps4, rps8, rps18, rrn5, trnM, and rps3. In most cases, these genes have a high similarity to orthologs from photosynthetic species and a typical structure (ATG start codon and ORF length in the protein-coding genes), with some deviations. In T. thaithongiana, all genes from SSC (all protein-coding) lack an ATG start codon. Also, rps4 and rps8 were ∼100 bp shorter in this species than in the other studied species; however, both genes retained at least a part of the domain typical for these proteins (Supplementary Table 4). Although the emergence of a start codon not homologous with the ancestral one is known to occur in plastid genes (Barthet et al., 2015), rps3, rps4, and rps8 in T. thaithongiana lack any in-frame ATG (or ACG which could be converted to AUG by RNA editing) that could serve as an alternative start of translation near the 5′-end of the ORF. This suggests that they are pseudogenes in this species. In T. gardneriana, rps3 and rps8 also lack a typical start codon; the only in-frame ATG in their ORF is located near the end and is unlikely to act as an alternative start for translation. Both rps3 and rps8 proteins in this species are highly similar to the orthologs from the other species studied here and retain the corresponding domains. The same is true for rps4 in T. filiformis and T. lanternata. In T. tentaculata, rps3 also lacks an ATG start codon, and a C-terminal S3 domain is not present. We found an ORF with similarity to rps3 in all complete plastomes; in three species (T. lanternata, T. mucronata, and T. puberula) we did not detect its S3 domain in the corresponding proteins despite the ORFs having a typical start.
The rps2 gene is missing in two species: T. hawkesii and T. thaithongiana. In Thismia hongkongensis Mar & R.M.K.Saunders species rps2 is likely pseudogenized: we found a region with high (92%) similarity to rps2 of the sister species, T. tentaculata, but it carries two stop codons in the middle of the gene.
The rps18 gene is completely missing in T. filiformis. This is the only complete plastome where we did not detect rps18; however, the examination of partial sequences in the region typically containing rps18 (i.e., between rps12 and accD) showed that in Thismia alba Holttum ex Jonker and Thismia hexagona Dančák, Hroneš, Kobrlová & Sochor this region also lacks rps18, and in Thismia neptunis Becc. it has a probable rps18 pseudogene. Given that all the studied Thismia plastomes are collinear (except for the variation of the IR borders), it is reasonable to predict that rps18 has indeed been lost in T. alba, T. hexagona, and T. neptunis and not translocated to another region which possibly was not assembled. Following the same argumentation, we predict rps8 to be missing in Thismia kelabitiana, Dančák, Hroneš & Sochor, because the partial assembly of its plastome contains rps3 and rps4, but lacks rps8 which is arranged between the two former genes in the other Thismia species studied here.
The plastid genes exhibit extensive length variation in Thismia. For instance, in T. thaithongiana several genes (rps4, rps18, rrn23) are shorter than in other species, and in T. hongkongensis we observed an increase of accD length compared to another Thismia species from approximately 1100 to 1422 bp. rpl2 has an unusual start codon – ACG – in all species examined. For T. puberula, we experimentally confirmed that RNA editing converts the ACG start codon to AUG (see below).
Evolution of Plastid Genes
The plastid genes in Thismia have a high level of sequence divergence compared to related photosynthetic taxa. The most conserved regions are tRNA and rRNA genes and the most variable ones are rps3 and rps4 (Supplementary Table 5). The dN/dS value varied from 0.25 to 0.45 (Table 2); notably, the lower limit is close to the dN/dS values found in other non-photosynthetic plants with a highly reduced plastome (Lam et al., 2015; Schelkunov et al., 2015), whereas the higher values may indicate relaxed purifying selection. We found a significant difference in dN/dS of plastid genes of Thismia and their orthologs in photosynthetic plants for most genes, except for rps8 and rpl2 (Table 2). These results should be treated with caution, however, as dN/dS analysis is highly sensitive to the alignment quality and in Thismia, due to their rapid evolution, biased nucleotide content and high frequency of indels, small misalignments are more probable. The same is true for other plants with highly reduced plastomes; for this reason Peterson and co-workers decided not to perform selection pressure analysis for Sciaphila (Petersen et al., 2018). Taking into account the uncertain status of rps3, rps4, and rps8 in several species where we were not able to find the start codons in these genes (see above), we performed dN/dS analysis for these genes in two variants: including and excluding the sequences with an atypical predicted start codon. The exclusion of these sequences did not result in lower dN/dS values (Table 2). We consider this to be a result of greater variability of genes lacking typical start codon; their inclusion in the alignment leads to the removal of a higher number of low-conserved regions by Gblocks. dN/dS calculations for multiple alignments not pruned by Gblocks (Supplementary Table 6) or pruned by Gblocks with aggressive gap-removal behavior (Supplementary Table 7) indicate that the gap-removal parameters of Gblocks has a minor effect on the dN/dS estimates.
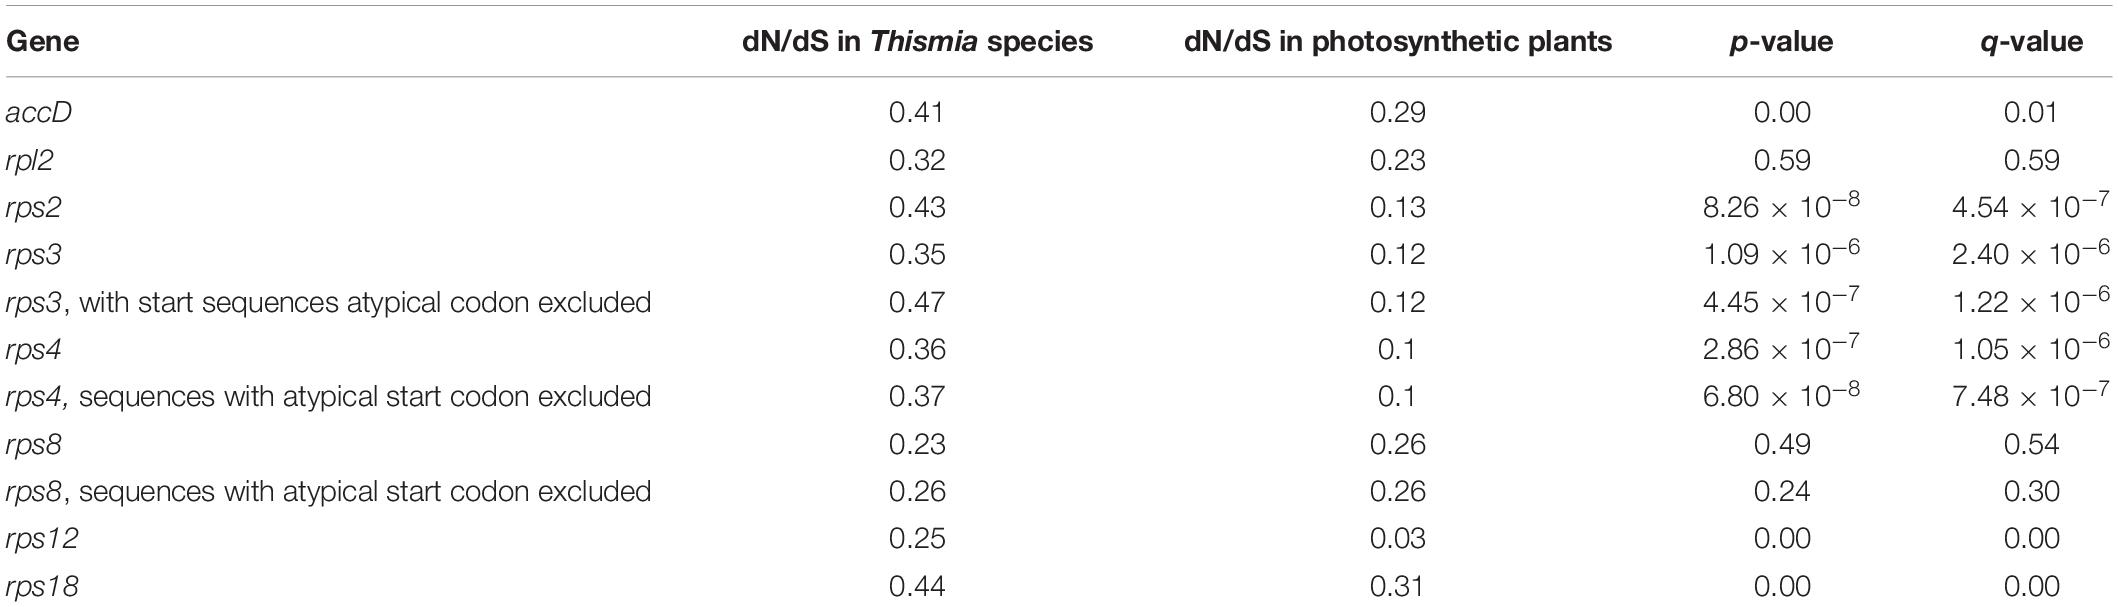
Table 2. dN/dS values for species of Thismia and their photosynthetic relatives and p-value and q-value for the hypothesis of the difference of dN/dS values between photosynthetic and non-photosynthetic species.
A prominent feature of Thismia plastomes is their high AT-content compared to photosynthetic plants. Generally, increased AT-content (in relation to that of autotrophic plants) is typical for plastomes of non-photosynthetic plants, and the level of AT-richness correlates with the degree of plastome reduction. In species with a recent transition to full heterotrophy, AT-bias is exhibited only at the level of synonymous codon usage; in highly reduced plastomes it affects amino acid content through a high amount of amino acids coded by the AT-rich codons (Lys, Phe) (see, e.g., Schelkunov et al., 2015). The latter tendency is also observed in Thismia (Figure 2), although when counted at the level of individual amino acids it is statistically significant only for lysine. The correlation between the frequency of an amino acid and the (average) AT-richness of a codon that encodes this amino acid is significantly higher in Thismia than in the autotrophic species of Tacca and Burmannia (belonging to the same order Dioscoreales) (Supplementary Table 8). Also, our analysis shows that the correlation values differ greatly between some photosynthetic plants, even between closely related taxa such as Burmannia coelestis and Burmannia disticha. This indicates that the bias toward AT-richness could predate the transition to heterotrophy, at least in some cases. In order to gain some insight into the evolutionary trends of nucleotide content in plastid genes of Thismia, reveal its ancestral state, and to make a prognosis for the future state we performed an analysis of the equilibrium AT content. In brief, this is the AT-content that a genomic sequence will reach if the [GC]- > [AT] substitutions and [AT]- > [GC] substitutions retain their current frequencies. In other words, the equilibrium AT content is the asymptote to which the AT content of a sequence is currently heading. The analysis of the concatenated gene sequence of each of the completely assembled Thismia plastomes (Supplementary Figure 2) indicated that in at least five out of nine species the AT content has not reached its peak yet, but still continues to increase. A notable case is the plastome of Thismia thaithongiana, for which the equilibrium AT-content is approximately 92%. AT-content of plastid genes more than 90% is known for Balanophoraceae (Schelkunov et al., 2019; Su et al., 2019; Chen et al., 2020), therefore it may be possible to actually achieve such a high AT-content. However, mutation spectra and selection in Thismia may change in the future thus making the current equilibrium AT-contents different from stable AT-contents that Thismia will finally reach.
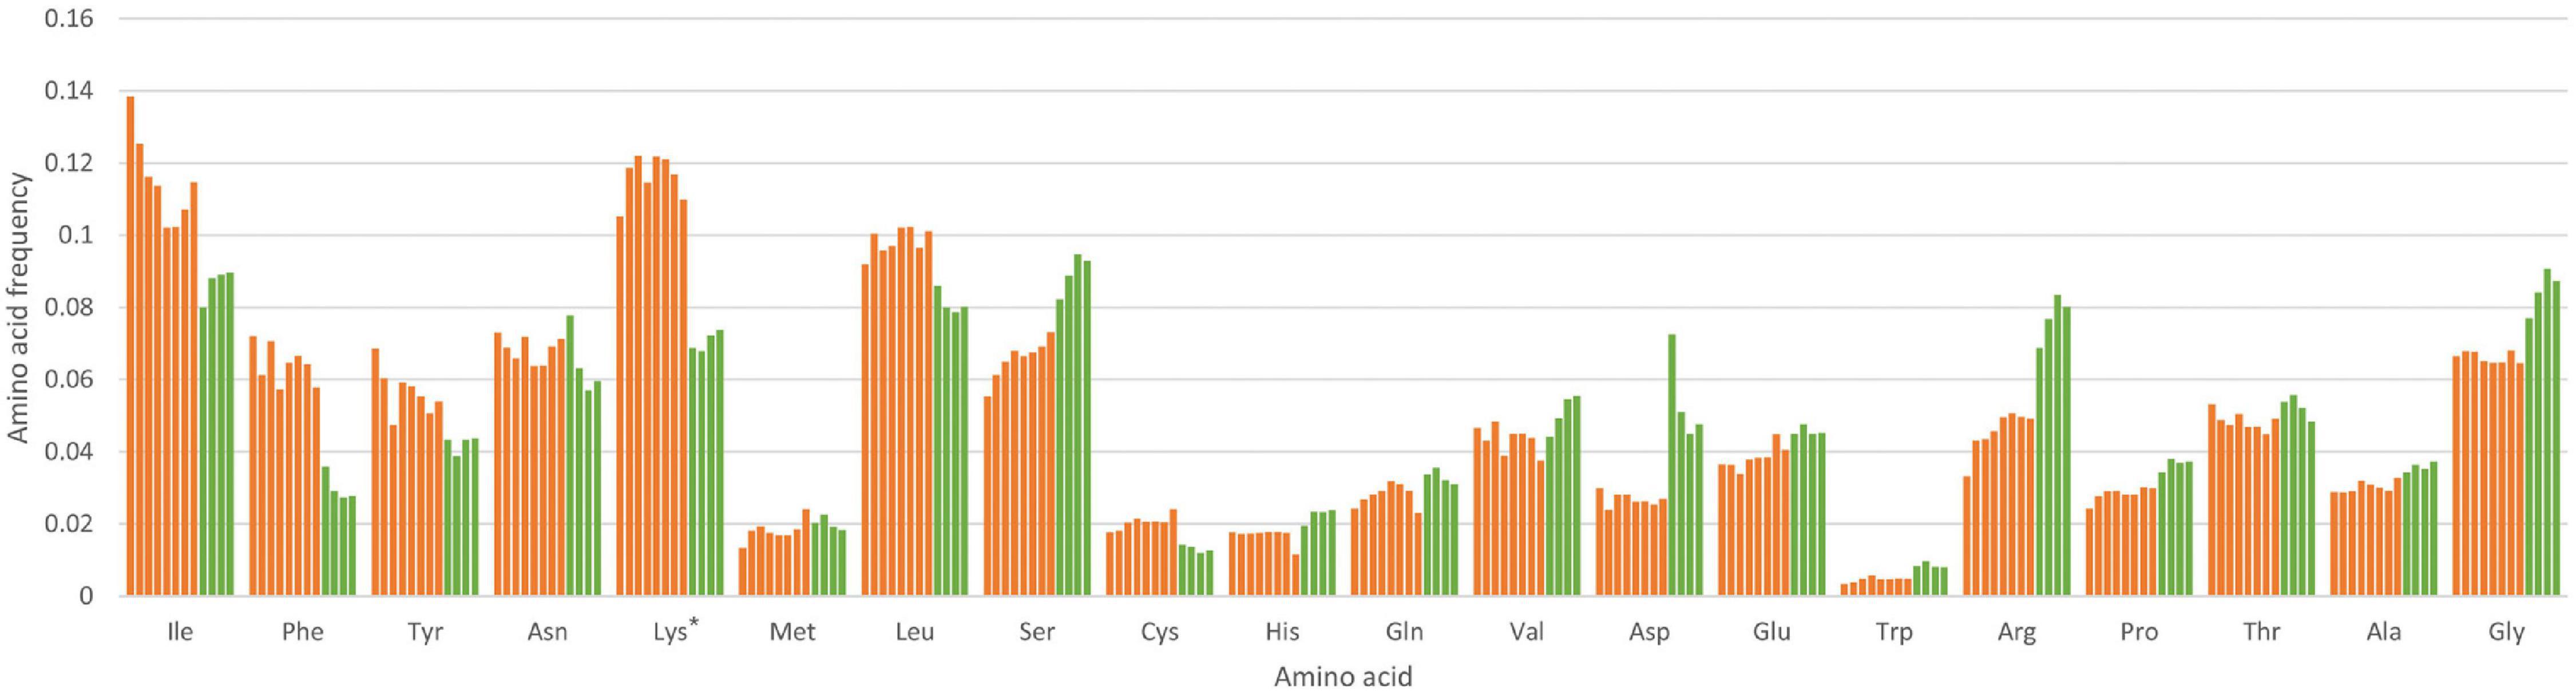
Figure 2. Amino acid content of plastid genes in Thismia and photosynthetic Dioscoreales. Values for Thismia are depicted by orange bars, values for photosynthetic species by green bars. The species, from left to right: Thismia thaithongiana, Thismia hawkesii, Thismia lanternata, Thismia filiformis, Thismia mucronata, Thismia puberula, Thismia gardneriana, Thismia tentaculata, Burmannia coelestis, Burmannia disticha, Tacca chantrieri, Tacca leontopetaloides. Asterisk indicates statistically significant difference between Thismia species and photosynthetic species (q-value < 0.05).
The analysis of substitution spectra and their contexts can give insights into the possible causes that underlie changes in the genomic sequence – for example, environmental factors such as UV light, or intrinsic genome properties such as methylation (Ossowski et al., 2010; Kusmartsev et al., 2020). We analyzed the frequencies of synonymous substitutions in different contexts in the plastid genes of Thismia species. The result (Supplementary Figure 3) shows that the main type of substitution in the genus Thismia is the C- > T transition (equivalent to the G- > A transition on the complementary strand) without a distinct context.
Transcriptome Data
The survey of expression of plastid genes in T. puberula showed variation in gene expression (Supplementary Table 9, column C). It should be noted that for genes coding for ribosomal RNA, the expression levels are presumably artificially lowered because we used a ribosomal RNA depletion kit for library preparation, which includes probes for plastid rRNAs. The expression level is the highest in accD, the only gene that is not related to the translation apparatus (all other retained genes are for this apparatus). We did not detect the expression of genes from the SSC (rps3, rps4, and rps8); however, this may be because these genes have the highest AT-content (92% in rps3, 84% in rps4, and 86% in rps8) and highly AT-rich regions are known to be problematic for Illumina sequencing (Oyola et al., 2012).
The rpl2 gene has an atypical start codon that is hypothesized to be converted into a typical one by RNA editing. Indeed, we detected the editing, but at a low level: only ∼20% of reads contained the edited cytosine (Supplementary Figure 4).
The genes rps12 and rpl2 are annotated as intron-containing. For rpl2, we could not unambiguously detect evidence of splicing, but the coverage of RNA-seq reads in the intron region is lower than in exons (Figure 1). rps12 has an unusual genomic location in Thismia: its second exon precedes the first one. In photosynthetic plants, rps12 is known to be transcribed as two separate transcripts, one containing the first exon and the other containing the second and the third exons; the three exons are then trans-spliced (Hildebrand et al., 1988, p.12). We assume that the exons of rps12 are also transcribed separately in Thismia. Generally, many plastid genes are known to be transcribed as polycistronic transcripts in plants. Thus we performed de novo assembly of the transcriptome data in order to find co-expressed genes. Overall, 11 contigs were found (Supplementary Table 7). The longest one is ∼2.8 Kb and contains complete sequences of rps18, accD, and trnE indicating that these genes are co-transcribed.
Phylogenetic Analysis
All three analyses recovered the same tree topologies, with generally strong branch support from bootstrap analyses or posterior probabilities for individual branches (Figure 3 and Supplementary Figure 5). This topology is similar to one inferred in an earlier report based on the analysis of nuclear (18S, ITS) and mitochondrial (atp1) sequences in a larger set of species (Shepeleva et al., 2020), which revealed five major clades that are also consistent with morphological and geographical evidence. Our dataset includes the representatives of four of these clades, and all four clades are recovered with high support in our reconstructions. The only differences are the position of T. hongkongensis, which was inferred to be the sister group of T. gardneriana in the nuclear/mitochondrial tree (Shepeleva et al., 2020) and to T. tentaculata in the plastid tree (Figure 3), and the relative positions of T. alba, T. hexagona, and T. filiformis. However, these relationships have low support in the nuclear/mitochondrial tree, likely indicating a lack of variable positions or conflicting phylogenetic signal in these datasets. The reconstruction of evolutionary events leading to the observed pattern of gene losses supports three independent losses of rps2 and two losses of rps18 (Figure 3B).
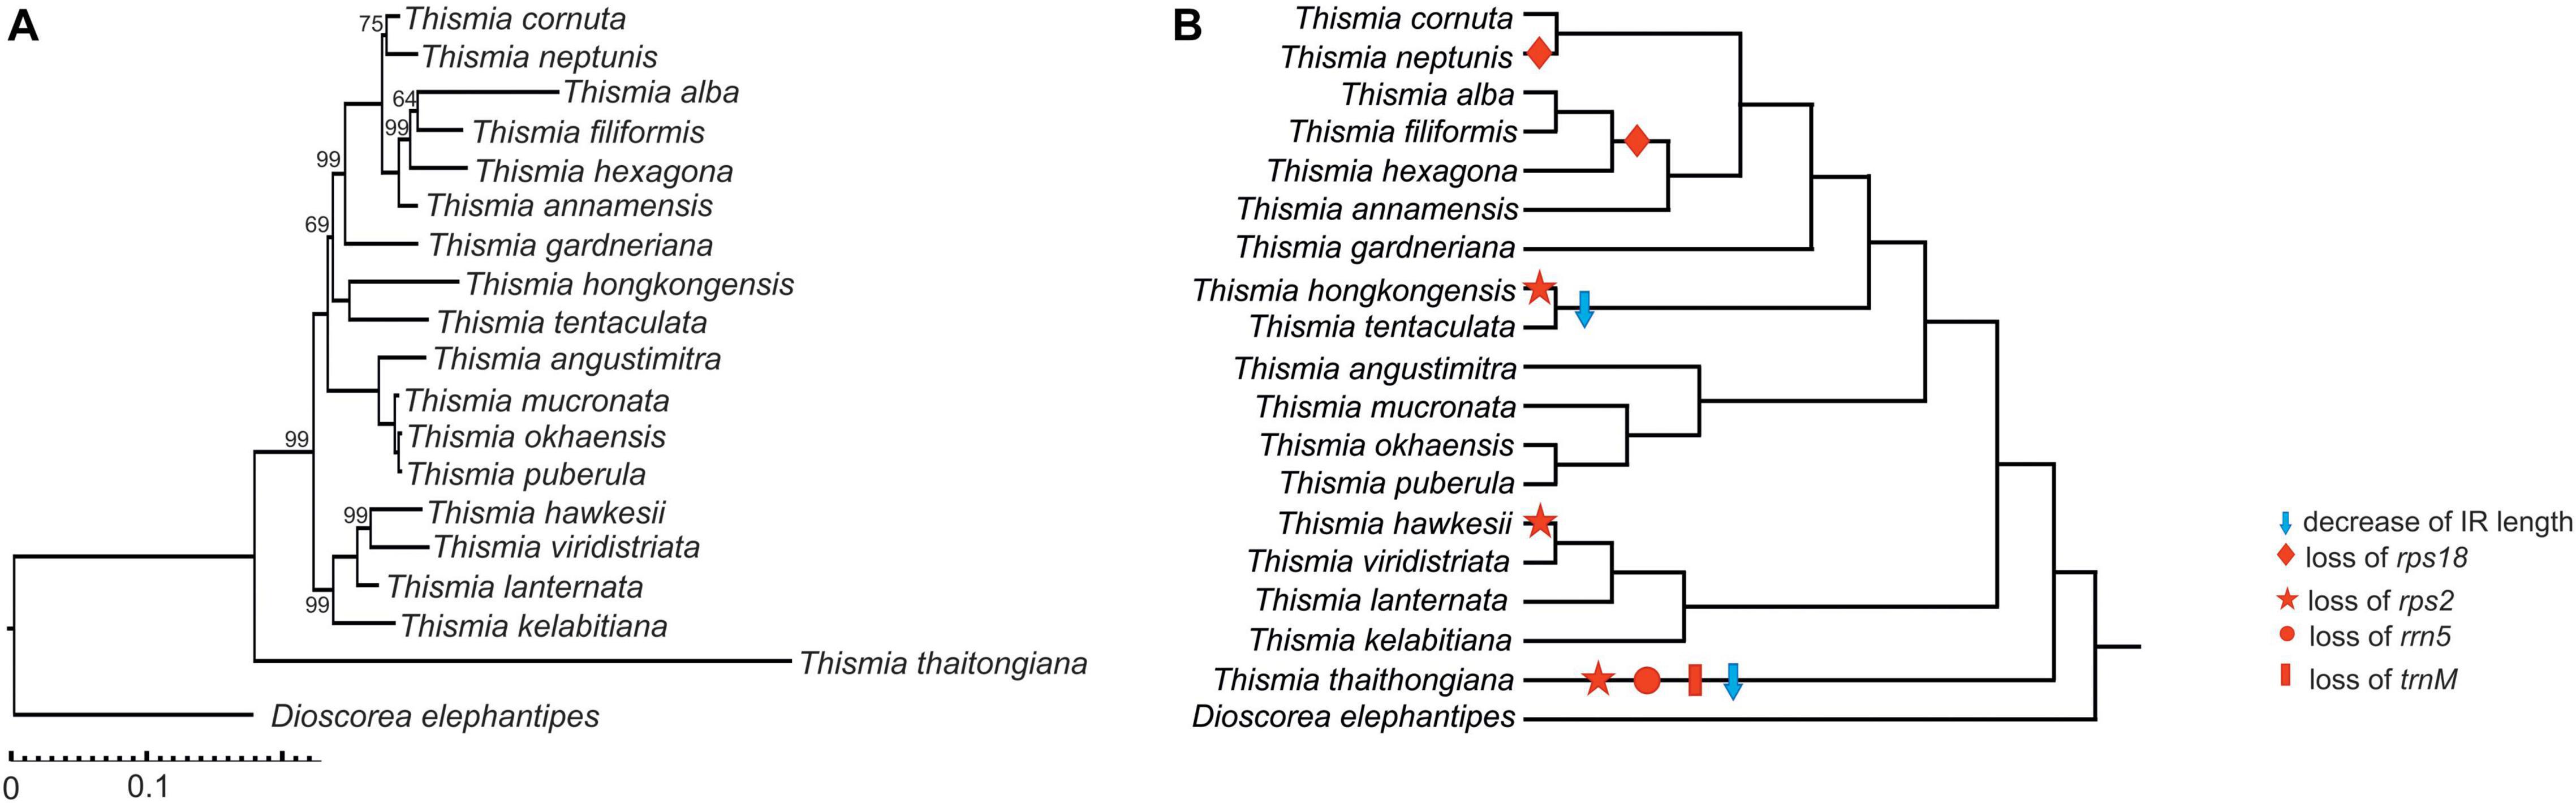
Figure 3. Phylogenetic tree based on Thismia plastid genes. (A) Phylogenetic tree inferred from ML analysis of 13 plastid genes by IQ-Tree with branch lengths and bootstrap values (only values < 100 are shown). (B) The same tree showing gene losses and IR borders changes.
Plastome Size and Structure in Thismia Compared to Other Heterotrophic Plants
Our study shows that the plastomes of Thismia are at the latest stages of genome reduction. They follow the general patterns found in the plastomes of other non-photosynthetic plants: the loss of genes, nucleotide bias toward AT, and protein sequence bias toward amino acids coded by AT-rich codons (Schelkunov et al., 2015, 2019). Notably, the plastomes of Thismia have almost the same length as those of Balanophoraceae (Schelkunov et al., 2019; Su et al., 2019) and Epipogium roseum Lindl. (Orchidaceae) (Schelkunov et al., 2015) and are larger than the plastome of Sciaphila thaidanica K.Larsen (Triuridaceae) (Petersen et al., 2018), whereas the gene content in plastomes of Thismia is more reduced. In contrast to Thismia, Balanophoraceae retain ycf1 and ycf2 (two large genes encoding proteins required for protein import into plastids), clpP, and several ribosomal protein genes. Epipogium roseum lacks ycf1 and ycf2 but retains clpP and a larger set of ribosomal protein genes. The 12-kb plastome of S. thaidanica lacks ycf and clpP but retains five additional ribosomal protein genes compared to Thismia. The large size of Thismia plastomes (in relation to the gene set) is mostly a result of the large inverted repeat (IR). In their investigation of T. tentaculata, Lim et al. (2016) suggested that the IR in Thismia plastomes could have been acquired secondarily after a complete loss in a common ancestor of the genus. Such re-emergence of an IR was recently shown in Fabaceae, in a clade where the absence of IR is the ancestral state (Choi et al., 2019). Our study, based on an expanded species sampling in the genus revealed that the IR position in most species of Thismia differs from that of T. tentaculata: it generally includes rps18, rps12 (both exons), rps2, and rrn5 (in the species where this gene is present). We found this IR structure in most Thismia species including the sister group of other members of the genus, T. thaithongiana. This implies that it represents the ancestral state for the Old World clade of Thismia. rps12 (3′-end) and rrn5 are a part of typical IR in flowering plants. We thus suggest that the unusual IR of Thismia arose not completely de novo but rather as a combination of a small part of typical IR (3′-end of rps12 and rrn5) and a part of LSC adjacent to IRb (accD, rps18, 5′-end of rps12). We hypothesize that the SSC of Thismia (consisting of rps4, rps8, and rps3) arose from the ancestral LSC, and the LSC from a part of the typical IR. A survey of plastome structure in the genera of Thismiaceae phylogenetically close to Thismia (Tiputinia, Oxygyne, and Haplothismia) and the New World clade of Thismia would help to outline this path in more detail.
Plastome Diversity and Evolution in Thismia
The loss of plastid genes caused by the transition to heterotrophy is presumably irreversible (e.g., Barrett and Davis, 2012; Graham et al., 2017). While it is possible that genes integrated in the nuclear or mitochondrial genomes (indeed, transfers from the plastid to the nuclear and mitochondrial genome are frequent in plants, see, e.g., Martin and Herrmann, 1998; Wang et al., 2007) before being lost from the plastome can hypothetically be transferred back, no such cases have been observed up to date. Our recent study of the mitochondrial genome of another mycoheterotropic plant with a highly reduced plastome, Hypopitys monotropa Crantz, showed that while it carries the fragments of plastid genes that are absent in the present-day plastome, none of them retains potentially functional ORFs (Shtratnikova et al., 2020). Also, an investigation of the transcriptomes of three mycoheterotrophic species did not reveal that any genes lost from the plastome were expressed elsewhere (Schelkunov et al., 2018). Indeed, experiments show that the genes transferred from the plastome to the nuclear genome are rapidly lost (Sheppard and Timmis, 2009). Therefore, we consider gene loss in heterotrophic plants to be an irreversible process. As shown earlier (Lim et al., 2016), in Thismia tentaculata the genes responsible for photosynthesis-related processes as well as many ribosomal protein and tRNA genes are lost. The examination of a diversity of gene sets in the plastomes of other Thismia species reveals a tendency to further reduction. At least five genes (trnM, rrn5, rps2, rps18, and rps3) found in the genus are lost (either completely or pseudogenized) in one or more species. The mapping of gene losses on the phylogenetic reconstruction shows that rps2 and rps18 were lost independently in different clades (Figure 3B). In particular, rps18 was lost in a common ancestor of T. alba, T. hexagona and T. filiformis and in T. neptunis. rps2 was lost in T. thaithongiana, T. hawkesii and T. hongkongensis. Of these, T. thaithongiana presumably possesses the most ancient loss because this species lacks any sequences with significant similarity to rps2, whereas the two other species carry putative pseudogenes of rps2. Although T. thaithongiana is the only species from the clade 1 (recognized by Shepeleva et al., 2020) sampled in our dataset, the situation observed in clade 5, where the loss of rps18 is a hallmark of closely related species, allows us to speculate that the loss of rps2 is not unique for T. thaithongiana but shared by a group species from clade 1.
The modifications occurring in Thismia plastomes are not limited to gene losses. The length of some genes also varies greatly within the genus. Thus, in T. thaithongiana, several genes (rps8, rrn23, rps4) are 20–40% shorter than the average for the genus. In T. hongkongensis we observed an unusual structure of the accD gene: its 5′-end codes for a ND–rich sequence, which lacks significant similarity either to accD or to any other known protein. Reconfigurations of accD and, in particular, large insertions are known in a number of photosynthetic (Park et al., 2018; Sudianto and Chaw, 2019) and non-photosynthetic (Logacheva et al., 2016) species. However, in the previously known cases they do not affect the carboxylase domain, the only known functional domain of accD that lies in the C-terminus. The same is true for T. hongkongensis: the 3′-end of accD shows high similarity with other species while its 5′-end is modified.
The retention of accD in all studied species of Thismia is congruent with its function (synthesis of fatty acids) which is not related to photosynthesis. The presence of this gene is typical for non-photosynthetic plants, even for those with plastomes more reduced than those of Thismia (Bellot and Renner, 2016; Graham et al., 2017; Arias-Agudelo et al., 2019). On the other hand, the plastid-encoded accD is missing in several autotrophic plants, being replaced by its nuclear plastid-targeted counterpart (Rousseau-Gueutin et al., 2013). This example emphasizes that despite some general patterns of gene loss present in heterotrophic plants, the necessity of a certain gene can be lineage-specific, as we noted earlier (Schelkunov et al., 2015). In line with this idea, plastomes of Thismia bear an intact trnE gene, seeming to support the essential tRNA hypothesis (Barbrook et al., 2006), in line with nearly all heterotrophic plants (e.g., Graham et al., 2017), whereas it appears to be absent in Pilostyles (Apodanthaceae) (Bellot and Renner, 2016). The survey of the transcriptome of Thismia puberula supports the importance of accD, revealing its expression level to be the highest among plastid genes. Also, the transcriptome data indicate that the set of functional genes encoded in the Thismia plastomes is possibly even smaller than annotated: all genes from the SSC (rps3, rps4, and rps8) are not expressed (it should be noted, however, that the AT content of these genes is the highest among all protein-coding genes of T. puberula and this can lead to artificial underestimation of expression levels). Together with the fact that these genes lack typical start codons in some species, this suggests that we possibly observed the first step toward pseudogenization of these genes in Thismia.
Employment of Plastid Markers in Phylogenetic Reconstructions
An important implication of our study is the finding that the plastomes of Thismia species, despite their unusual structure and reduced gene content, are valuable phylogenetic markers in Thismia. Plastid genes, and especially rbcL and matK, are extensively used for inferring plant phylogeny. Massive gene loss and biased nucleotide content in plastomes hamper their employment for the integration of heterotrophic plants in the plant tree-of-life. Surprisingly, the phylogenetic trees of Thismia inferred here from the plastid genes are similar to those inferred from nuclear and mitochondrial regions and provide higher resolution and support than any of the non-plastid trees. Our results are in agreement with the conclusions of Lam and co-workers who pointed out (Lam et al., 2016) that several plastid genes can be used for phylogenetic analysis in mycoheterotrophic plants. In particular, these authors suggested using accD, clpP, and matK, and reported that they could not find clpP and matK in Thismiaceae. Based on our data, we propose an addition of rpl2 and rps12 to this prospective gene set for phylogenetic inference.
The increasing availability of complete plastomes of Dioscoreales and especially Burmanniaceae (Ma et al., 2018; Li et al., 2019) also gives an opportunity to use larger datasets comprising the entire plastomes to reconstruct the relationships within this order and, in particular, to elucidate the phylogenetic vicinity of Thismiaceae (though this requires caution about long branch attraction – see Lam et al., 2018; Schelkunov et al., 2019). Thismia is a highly underexplored genus; more than 30 species of this genus were described after 2015 (e.g., Hroneš et al., 2018; Da Silva et al., 2020; Dančák et al., 2020b; Xu et al., 2020) and species complexes with uncertain boundaries between taxa become evident with discovery of new populations (Dančák et al., 2020b; Nuraliev et al., 2020). The majority of species of Thismia were described based exclusively on morphology, and the position of many of them in Thismia phylogeny remains unclear (Shepeleva et al., 2020). For some species already included in phylogenetic analyses, the nuclear 18S and mitochondrial atp1 markers suggest ambiguous and controversial placement because of insufficient resolution. We expect that the plastid genes will help to resolve such cases due to their extremely high variability. This will be especially important for testing the identity and monophyly of species that are closely related and morphologically similar.
Conclusion
We characterized plastid genomes in the genus Thismia, a group with an ancient transition to heterotrophy, based on a sampling of 18 species. As expected, plastomes of Thismia are at the late stages of the reduction; their gene set is smaller than in the plastomes of similar length in other groups of heterotrophic plants. The dense taxonomic coverage that includes species from four out of five major lineages of the Old World Thismia clade allowed us to outline the evolutionary patterns of plastome reduction and to predict further trends, which include further increase of the AT-content, the pseudogenization and loss of several ribosomal protein genes (such as all genes from the SSC). Our remarkable finding is that the phylogenetic trees inferred from the plastid genes of Thismia are similar to the trees inferred from nuclear and mitochondrial sequences. This supports the idea that the plastome sequences are valuable markers for further phylogenetic analysis of this large and diverse genus.
Data Availability Statement
Nucleotide sequences generated in this study can be found in the online public database GenBank (https://www.ncbi.nlm.nih.gov/genbank/) under accession numbers MT943132, MT943130, MT943129, MT943131, MT936983, MT943140, MT936984, MT943134, MT943133, MT936982, MT936985, MT943141, MT943135, MT943136, MT943137, MT943139, MT747830, MT943142, and MT943138.
Author Contributions
SY performed assembly and annotation and collected plant material. MIS performed the evolutionary and phylogenetic analysis and revised the manuscript. LN and DC sequenced and assembled plastomes of T. hawkesii and T. lanternata. SC, MH, MSo, MD, S-SM, and HTL collected the material. MN collected the material and revised the manuscript. ML conceived and coordinated the study, performed library preparation and sequencing, and drafted the manuscript. All authors contributed to the article and approved the submitted version.
Funding
The work of SY, MIS, MN, and ML on analysis of genome structure was supported by the Russian Foundation for Basic Research (project 18-04-00619). The work of MN on material management, species identification, preparation of photo plate, and a phylogenetic reconstruction was supported by the Russian Science Foundation (project 19-14-00055). MH was supported by internal fund of Palacký University Olomouc IGA PrF-2021-001. MS was supported by grant no. RO0418 from Ministry of Agriculture, Czechia. Interpretation of data was carried out in accordance with government order for Institute for Information Transmission Problems (project no. 0053-2019-0005).
Conflict of Interest
The authors declare that the research was conducted in the absence of any commercial or financial relationships that could be construed as a potential conflict of interest.
Acknowledgments
We thank Leonid V. Averyanov for access to a specimen at LE Herbarium, and Aleksey A. Penin for assistance with RNA extraction. Specimens from Sarawak were studied in accordance with the permits no. NCCD.907.4.4(JLD.13)-337 and (298)JHS/NCCD/600-7/2/107 issued by Sarawak Forestry Department. We are thankful to Paul Forster for the permission to reproduce the photos published in Austrobaileya journal. P. Tripetch is gratefully acknowledged for providing his photo of Thismia angustimitra at its type locality. We also thank the Brunei Forestry Department and the Biodiversity Research and Innovation Centre, Ministry of Industry and Primary Resources for permission to work at the Ulu Temburong National Park and permit to export specimens, respectively. Specimens of T. hawkesii and T. lanternata at were collected by Dr. Wendy Cooper under permit PTU18-001474.
Supplementary Material
The Supplementary Material for this article can be found online at: https://www.frontiersin.org/articles/10.3389/fpls.2021.602598/full#supplementary-material
The Supplementary Tables 1–9 can be found in the Table 1 file.
Supplementary Figure 1 | Maps of complete and partial plastomes of Thismia reported in this study and the morphology of the species for which sequences were obtained in this study. (A) T. alba (Thailand). (B) T. angustimitra (Thailand). (C) T. annamensis (Nuraliev 999). (D) T. cornuta (Sochor et al. BOR24/17). (E) T. filiformis (Chantanaorrapint & Promma 3928). (F) T. gardneriana (Chantanaorrapint 2309). (G) T. hawkesii (Cooper 2407). (H) T. hexagona (Dančák et al. 2013/17). (I) T. hongkongensis (Hong Kong). (J) T. kelabitiana (Sochor et al. BOR1/17). (K) T. lanternata (Cooper 2403). (L) T. mucronata (Nuraliev 813). (M) T. neptunis (Sochor et al. BOR51/17). (N) T. okhaensis (Tich et al. KH 638B). (O) T. puberula (Yudina & Nuraliev 15). (P) T. thaithongiana (Chantanaorrapint 2755). (Q) T. viridistriata (Sochor et al. BOR06/19). Photographs: S. Chantanaorrapint (A,E,F,P); M. Hroneš (H); H.T. Luu (N); S.S. Mar (I); M.S. Nuraliev (C,L,O); M. Sochor (D,J,M,Q); P. Tripetch (B); reproduced with permission from Austrobaileya 10: 133, 135 (2017) (G,K).
Supplementary Figure 2 | Evolution of AT content in plastid genes of Thismia. Blue numbers denote AT contents in current and ancestral sequences. Red numbers denote equilibrium AT contents with their 95% confidence intervals (CIs). Asterisks indicate the species for which the lower bound of the confidence interval for the equilibrium AT content exceeds the current AT content.
Supplementary Figure 3 | Synonymous substitution profile in plastid genes of Thismia. Horizontal axis – synonymous substitutions with their sequence contexts (i.e., adjacent bases). Vertical axis – substitution frequencies. Four synonymous substitutions that are prohibited by the genetic code are marked by gray crosses. For complementary pairs of substitutions, like ACG- > AGG and CGT- > CCT, the one with C or T in the middle is shown.
Supplementary Figure 4 | Mapping of RNA-seq on T. puberula plastome, the region of rpl2. Note the polymorphism at the second nucleotide of rpl2 CDS due to RNA editing.
Supplementary Figure 5 | Phylogenetic trees based on plastid genes of Thismia, (A) Bayesian (MrBayes) and (B) maximum likelihood (RAxML) analyses. Only posterior probabilities less than 1 and bootstrap support values less than 100 are shown.
Supplementary Table 1 | Material used in this study, sequencing settings and accession numbers of plastome sequences.
Supplementary Table 2 | Primers used for the check of IR-SC junctions in T. mucronata.
Supplementary Table 3 | Genes found in plastomes of Thismia. “Gene absent” denotes cases where gene is either not found in the complete sequence or in a segment of partial sequence where it could have been located assuming the co-linearity of Thismia plastomes. “Gene not found” denotes cases where the whole segment is not found in the assembly. “Fragmented” denotes cases where a partial sequence of a gene is present in the assembly on a contig border.
Supplementary Table 4 | Results of Pfam-a search for plastid genes of Thismia.
Supplementary Table 5 | Sequence similarity of plastid genes of Thismia.
Supplementary Table 6 | Estimates of selective pressure in plastid genes of Thismia and their photosynthetic relatives calculated using a multiple alignment not pruned by Gblocks. P-values and q-values indicate statistical significance of the hypothesis of the difference of dN/dS values between photosynthetic and non-photosynthetic species.
Supplementary Table 7 | Estimates of selective pressure in Thismia and their photosynthetic relatives calculated using a multiple alignment pruned by Gblocks with default parameters. P-values and q-values indicate statistical significance of the hypothesis of the difference of dN/dS values between photosynthetic and non-photosynthetic species.
Supplementary Table 8 | Spearman correlation between AT-richness of a codon (average in case of amino acids coded by multiple codons) and a frequency of amino acid.
Supplementary Table 9 | Transcriptome contigs of Thismia puberula corresponding to plastid genome.
Footnotes
References
Abascal, F., Zardoya, R., and Telford, M. J. (2010). TranslatorX: multiple alignment of nucleotide sequences guided by amino acid translations. Nucleic Acids Res. 38, W7–W13. doi: 10.1093/nar/gkq291
Arias-Agudelo, L. M., González, F., Isaza, J. P., Alzate, J. F., and Pabón-Mora, N. (2019). Plastome reduction and gene content in new world Pilostyles (Apodanthaceae) unveils high similarities to African and Australian congeners. Mol. Phylogenet. Evol. 135, 193–202. doi: 10.1016/j.ympev.2019.03.014
Aronesty, E. (2013). Comparison of sequencing utility programs. Open Bioinform. J. 7, 1–8. doi: 10.2174/1875036201307010001
Barbrook, A. C., Howe, C. J., and Purton, S. (2006). Why are plastid genomes retained in non-photosynthetic organisms? Trends Plant Sci. 11, 101–108. doi: 10.1016/j.tplants.2005.12.004
Barrett, C. F., and Davis, J. I. (2012). The plastid genome of the mycoheterotrophic Corallorhiza striata (Orchidaceae) is in the relatively early stages of degradation. Am. J. Bot. 99, 1513–1523. doi: 10.3732/ajb.1200256
Barrett, C. F., Freudenstein, J. V., Li, J., Mayfield-Jones, D. R., Perez, L., Pires, J. C., et al. (2014). Investigating the path of plastid genome degradation in an early-transitional clade of heterotrophic orchids, and implications for heterotrophic angiosperms. Mol. Biol. Evol. 31, 3095–3112. doi: 10.1093/molbev/msu252
Barrett, C. F., Sinn, B. T., and Kennedy, A. H. (2019). Unprecedented parallel photosynthetic losses in a heterotrophic orchid genus. Mol. Biol. Evol. 36, 1884–1901. doi: 10.1093/molbev/msz111
Barrett, C. F., Wicke, S., and Sass, C. (2018). Dense infraspecific sampling reveals rapid and independent trajectories of plastome degradation in a heterotrophic orchid complex. New Phytol. 218, 1192–1204. doi: 10.1111/nph.15072
Barthet, M. M., Moukarzel, K., Smith, K. N., Patel, J., and Hilu, K. W. (2015). Alternative translation initiation codons for the plastid maturase MatK: unraveling the pseudogene misconception in the Orchidaceae. BMC Evol. Biol. 15:210. doi: 10.1186/s12862-015-0491-1
Beaulieu, J. M., Jhwueng, D.-C., Boettiger, C., and O’Meara, B. C. (2012). Modeling stabilizing selection: expanding the ornstein-uhlenbeck model of adaptive evolution. Evolution 66, 2369–2383. doi: 10.1111/j.1558-5646.2012.01619.x
Bellot, S., and Renner, S. S. (2016). The plastomes of two species in the endoparasite genus Pilostyles (Apodanthaceae) each retain just five or six possibly functional genes. Genome Biol. Evol. 8, 189–201. doi: 10.1093/gbe/evv251
Benjamini, Y., and Hochberg, Y. (1995). Controlling the false discovery rate - a practical and powerful approach to multiple testing. J. R. Stat. Soc. Ser. B Methodol. 57, 289–300. doi: 10.1111/j.2517-6161.1995.tb02031.x
Bentley, D. R., Balasubramanian, S., Swerdlow, H. P., Smith, G. P., Milton, J., Brown, C. G., et al. (2008). Accurate whole human genome sequencing using reversible terminator chemistry. Nature 456, 53–59. doi: 10.1038/nature07517
Bolger, A. M., Lohse, M., and Usadel, B. (2014). Trimmomatic: a flexible trimmer for Illumina sequence data. Bioinformatics 30, 2114–2120. doi: 10.1093/bioinformatics/btu170
Camacho, C., Coulouris, G., Avagyan, V., Ma, N., Papadopoulos, J., Bealer, K., et al. (2009). BLAST+: architecture and applications. BMC Bioinform. 10:421. doi: 10.1186/1471-2105-10-421
Castresana, J. (2000). Selection of conserved blocks from multiple alignments for their use in phylogenetic analysis. Mol. Biol. Evol. 17, 540–552. doi: 10.1093/oxfordjournals.molbev.a026334
Chan, P. P., and Lowe, T. M. (2019). “tRNAscan-SE: searching for trna genes in genomic sequences,” in Gene Prediction. Methods in Molecular Biology, ed. M., Kollmar, (New York, NY: Springer New York), 1–14. Available online at: http://link.springer.com/10.1007/978-1-4939-9173-0_1 (Accessed February 19, 2021).
Chen, J., Yu, R., Dai, J., Liu, Y., and Zhou, R. (2020). The loss of photosynthesis pathway and genomic locations of the lost plastid genes in a holoparasitic plant Aeginetia indica. BMC Plant Biol. 20:199. doi: 10.1186/s12870-020-02415-2
Choi, I.-S., Schwarz, E. N., Ruhlman, T. A., Khiyami, M. A., Sabir, J. S. M., Hajarah, N. H., et al. (2019). Fluctuations in Fabaceae mitochondrial genome size and content are both ancient and recent. BMC Plant Biol. 19:448. doi: 10.1186/s12870-019-2064-8
Da Silva, D. F., Engels, M. E., and Soares-Lopes, C. R. A. (2020). Novelties in Thismia (Thismiaceae) from South Brazilian Amazon with the description of a new species. Phytotaxa 429, 261–273. doi: 10.11646/phytotaxa.429.4.2
Dančák, M., Hroneš, M., and Sochor, M. (2020a). Thismia minutissima (Thismiaceae), a remarkable new mycoheterotrophic species from Sarawak, Borneo. Kew Bull. 75:29. doi: 10.1007/s12225-020-09886-4
Dančák, M., Hroneš, M., and Sochor, M. (2020b). Thismia ornata and T. coronata (Thismiaceae), two new species from Sarawak, Borneo. Willdenowia 50, 65–76. doi: 10.3372/wi.50.50106
Doyle, J., and Doyle, J. (1987). A rapid DNA isolation procedure for small quantities of fresh leaf tissue. Phytochem. Bull. 19:11–15.
Givnish, T. J., Zuluaga, A., Spalink, D., Soto Gomez, M., Lam, V. K. Y., and Saarela, J. M. (2018). Monocot plastid phylogenomics, timeline, net rates of species diversification, the power of multi-gene analyses, and a functional model for the origin of monocots. Am. J. Bot. 105, 1888–1910. doi: 10.1002/ajb2.1178
Graham, S. W., Lam, V. K. Y., and Merckx, V. S. F. T. (2017). Plastomes on the edge: the evolutionary breakdown of mycoheterotroph plastid genomes. New Phytol. 214, 48–55. doi: 10.1111/nph.14398
Guo, X., Zhao, Z., Mar, S. S., Zhang, D., and Saunders, R. M. K. (2019). A symbiotic balancing act: arbuscular mycorrhizal specificity and specialist fungus gnat pollination in the mycoheterotrophic genus Thismia (Thismiaceae). Ann. Bot. 124, 331–342. doi: 10.1093/aob/mcz087
Hildebrand, M., Hallick, R. B., Passavant, C. W., and Bourque, D. P. (1988). Trans-splicing in chloroplasts: the rps 12 loci of Nicotiana tabacum. Proc. Natl. Acad. Sci. U.S.A. 85, 372–376. doi: 10.1073/pnas.85.2.372
Hoang, D. T., Chernomor, O., Haeseler, A., von, Minh, B. Q., and Vinh, L. S. (2018). UFBoot2: improving the ultrafast bootstrap approximation. Mol. Biol. Evol. 35, 518–522. doi: 10.1093/molbev/msx281
Hroneš, M., Rejžek, M., Sochor, M., Svátek, M., Kvasnica, J., Egertová, Z., et al. (2018). Two new species of Thismia subsect. Odoardoa (Thismiaceae) from Borneo. Plant Ecol. Evol. 151, 110–118. doi: 10.5091/plecevo.2018.1387
Katoh, K., and Standley, D. M. (2013). MAFFT multiple sequence alignment software version 7: improvements in performance and usability. Mol. Biol. Evol. 30, 772–780. doi: 10.1093/molbev/mst010
Kusmartsev, V., Drożdż, M., Schuster-Böckler, B., and Warnecke, T. (2020). Cytosine methylation affects the mutability of neighboring nucleotides in germline and soma. Genetics 214, 809–823. doi: 10.1534/genetics.120.303028
Lagesen, K., Hallin, P., Rødland, E. A., Staerfeldt, H.-H., Rognes, T., and Ussery, D. W. (2007). RNAmmer: consistent and rapid annotation of ribosomal RNA genes. Nucleic Acids Res. 35, 3100–3108. doi: 10.1093/nar/gkm160
Lallemand, F., Logacheva, M., Le Clainche, I., Bérard, A., Zheleznaia, E., May, M., et al. (2019). Thirteen new plastid genomes from mixotrophic and autotrophic species provide insights into heterotrophy evolution in Neottieae orchids. Genome Biol. Evol. 11, 2457–2467. doi: 10.1093/gbe/evz170
Lam, V. K. Y., Darby, H., Merckx, V. S. F. T., et al. (2018). Phylogenomic inference in extremis: a case study with mycoheterotroph plastomes. Am. J. Bot. 105, 480–494. doi: 10.1002/ajb2.1070
Lam, V. K. Y., Merckx, V. S. F. T., and Graham, S. W. (2016). A few-gene plastid phylogenetic framework for mycoheterotrophic monocots. Am. J. Bot. 103, 692–708. doi: 10.3732/ajb.1500412
Lam, V. K. Y., Soto Gomez, M., and Graham, S. W. (2015). The highly reduced plastome of mycoheterotrophic Sciaphila (Triuridaceae) is colinear with its green relatives and is under strong purifying selection. Genome Biol. Evol. 7, 2220–2236. doi: 10.1093/gbe/evv134
Leake, J. R. (1994). The biology of myco-heterotrophic (‘saprophytic’) plants. New Phytol. 127, 171–216. doi: 10.1111/j.1469-8137.1994.tb04272.x
Li, X., Qian, X., Yao, G., Zhao, Z., and Zhang, D. (2019). Plastome of mycoheterotrophic Burmannia itoana Mak. (Burmanniaceae) exhibits extensive degradation and distinct rearrangements. PeerJ 7:e7787. doi: 10.7717/peerj.7787
Lim, G. S., Barrett, C. F., Pang, C.-C., and Davis, J. I. (2016). Drastic reduction of plastome size in the mycoheterotrophic Thismia tentaculata relative to that of its autotrophic relative Tacca chantrieri. Am. J. Bot. 103, 1129–1137. doi: 10.3732/ajb.1600042
Logacheva, M. D., Schelkunov, M. I., Shtratnikova, V. Y., Matveeva, M. V., and Penin, A. A. (2016). Comparative analysis of plastid genomes of non-photosynthetic Ericaceae and their photosynthetic relatives. Sci. Rep. 6:30042. doi: 10.1038/srep30042
Lohse, M., Drechsel, O., and Bock, R. (2007). OrganellarGenomeDRAW (OGDRAW): a tool for the easy generation of high-quality custom graphical maps of plastid and mitochondrial genomes. Curr. Genet. 52, 267–274. doi: 10.1007/s00294-007-0161-y
Ma, L., Ma, P., and Li, D. (2018). The first complete plastid genome of Burmannia disticha L. from the mycoheterotrophic monocot family Burmanniaceae. Plant Divers. 40, 232–237. doi: 10.1016/j.pld.2018.07.004
Maddison, V. P., and Maddison, D. R. (2018). Mesquite 3.61. Available online at: http://www.mesquiteproject.org.
Martin, W., and Herrmann, R. G. (1998). Gene transfer from organelles to the nucleus: how much, what happens, and why? Plant Physiol. 118, 9–17. doi: 10.1104/pp.118.1.9
Merckx, V., Huysmans, S., and Smets, E. (2010). “Cretaceous origins of myco-heterotrophic lineages in Dioscoreales,” in Diversity, phylogeny, and evolution in the monocotyledons, eds O. Seberg, G. Petersen, A. S. Barfod, and J. Davis (Århus: Aarhus University Press), 39–53.
Minh, B. Q., Schmidt, H. A., Chernomor, O., Schrempf, D., Woodhams, M. D., Haeseler, A., et al. (2020). IQ-TREE 2: new models and efficient methods for phylogenetic inference in the genomic Era. Mol. Biol. Evol. 37, 1530–1534. doi: 10.1093/molbev/msaa015
Moshe, A., and Pupko, T. (2019). Ancestral sequence reconstruction: accounting for structural information by averaging over replacement matrices. Bioinformatics 35, 2562–2568. doi: 10.1093/bioinformatics/bty1031
Nuraliev, M. S., Yudina, S. V., Shepeleva, E. A., Truong, B. V., Do, T. X., Beer, A. S., et al. (2021). Floral structure in Thismia (Thismiaceae: Dioscoreales): new insights from anatomy, vasculature and development. Bot. J. Linn. Soc. 195, 501–531. doi: 10.1093/botlinnean/boaa066
Nuraliev, M. S., Yudina, S. V., Truong, B. V., Do, T. X., Luu, H. T., Kuznetsov, A. N., et al. (2020). A revision of the family Thismiaceae (Dioscoreales) in Cambodia, Laos and Vietnam. Phytotaxa 441, 229–250. doi: 10.11646/phytotaxa.441.3.1
Ossowski, S., Schneeberger, K., Lucas-Lledo, J. I., Warthmann, N., Clark, R. M., Shaw, R. G., et al. (2010). The rate and molecular spectrum of spontaneous mutations in Arabidopsis thaliana. Science 327, 92–94. doi: 10.1126/science.1180677
Oyola, S. O., Otto, T. D., Gu, Y., Maslen, G., Manske, M., Campino, S., et al. (2012). Optimizing illumina next-generation sequencing library preparation for extremely at-biased genomes. BMC Genomics 13:1. doi: 10.1186/1471-2164-13-1
Park, S., An, B., and Park, S. (2018). Reconfiguration of the plastid genome in Lamprocapnos spectabilis: IR boundary shifting, inversion, and intraspecific variation. Sci. Rep. 8:13568. doi: 10.1038/s41598-018-31938-w
Peterlongo, P., and Chikhi, R. (2012). Mapsembler, targeted and micro assembly of large NGS datasets on a desktop computer. BMC Bioinform. 13:48. doi: 10.1186/1471-2105-13-48
Petersen, G., Zervas, A., Pedersen, H., and Seberg, O. (2018). Contracted genes and dwarfed plastome in mycoheterotrophic Sciaphila thaidanica (Triuridaceae, Pandanales). Genome Biol. Evol. 10, 976–981. doi: 10.1093/gbe/evy064
Ronquist, F., Teslenko, M., van der Mark, P., Ayres, D. L., Darling, A., Höhna, S., et al. (2012). MrBayes 3.2: efficient Bayesian phylogenetic inference and model choice across a large model space. Syst. Biol. 61, 539–542. doi: 10.1093/sysbio/sys029
Rousseau-Gueutin, M., Huang, X., Higginson, E., Ayliffe, M., Day, A., and Timmis, J. N. (2013). Potential functional replacement of the plastidic acetyl-CoA carboxylase subunit (accD) gene by recent transfers to the nucleus in some angiosperm lineages. Plant Physiol. 161, 1918–1929. doi: 10.1104/pp.113.214528
Samigullin, T. H., Logacheva, M. D., Penin, A. A., and Vallejo-Roman, C. M. (2016). Complete plastid genome of the recent holoparasite Lathraea squamaria reveals earliest stages of plastome reduction in Orobanchaceae. PloS One 11:e0150718. doi: 10.1371/journal.pone.0150718
Schelkunov, M. I., Nuraliev, M. S., and Logacheva, M. D. (2019). Rhopalocnemis phalloides has one of the most reduced and mutated plastid genomes known. PeerJ 7:e7500. doi: 10.7717/peerj.7500
Schelkunov, M. I., Penin, A. A., and Logacheva, M. D. (2018). RNA-seq highlights parallel and contrasting patterns in the evolution of the nuclear genome of fully mycoheterotrophic plants. BMC Genomics 19:602. doi: 10.1186/s12864-018-4968-3
Schelkunov, M. I., Shtratnikova, V. Y., Nuraliev, M. S., Selosse, M.-A., Penin, A. A., and Logacheva, M. D. (2015). Exploring the limits for reduction of plastid genomes: a case study of the mycoheterotrophic orchids Epipogium aphyllum and Epipogium roseum. Genome Biol. Evol. 7, 1179–1191. doi: 10.1093/gbe/evv019
Shepeleva, E. A., Schelkunov, M. I., Hroneš, M., Sochor, M., Dančák, M., Merckx, V. S., et al. (2020). Phylogenetics of the mycoheterotrophic genus Thismia (Thismiaceae: Dioscoreales) with a focus on the Old World taxa: delineation of novel natural groups and insights into the evolution of morphological traits. Bot. J. Linn. Soc. 193, 287–315. doi: 10.1093/botlinnean/boaa017
Sheppard, A. E., and Timmis, J. N. (2009). Instability of plastid DNA in the nuclear genome. PLoS Genet. 5:e1000323. doi: 10.1371/journal.pgen.1000323
Shtratnikova, V. Y., Schelkunov, M. I., Penin, A. A., and Logacheva, M. D. (2020). Mitochondrial genome of the nonphotosynthetic mycoheterotrophic plant Hypopitys monotropa, its structure, gene expression and RNA editing. PeerJ 8:e9309. doi: 10.7717/peerj.9309
Stamatakis, A. (2014). RAxML version 8: a tool for phylogenetic analysis and post-analysis of large phylogenies. Bioinformatics 30, 1312–1313. doi: 10.1093/bioinformatics/btu033
Su, H.-J., Barkman, T. J., Hao, W., Jones, S. S., Naumann, J., Skippington, E., et al. (2019). Novel genetic code and record-setting AT-richness in the highly reduced plastid genome of the holoparasitic plant Balanophora. Proc. Natl. Acad. Sci. U. S. A. 116, 934–943. doi: 10.1073/pnas.1816822116
Sudianto, E., and Chaw, S.-M. (2019). Two independent plastid accD transfers to the nuclear genome of gnetum and other insights on Acetyl-CoA carboxylase evolution in gymnosperms. Genome Biol. Evol. 11, 1691–1705. doi: 10.1093/gbe/evz059
Tillich, M., Lehwark, P., Pellizzer, T., Ulbricht-Jones, E. S., Fischer, A., Bock, R., et al. (2017). GeSeq – versatile and accurate annotation of organelle genomes. Nucleic Acids Res. 45, W6–W11. doi: 10.1093/nar/gkx391
Wang, D., Wu, Y.-W., Shih, A. C.-C., Wu, C.-S., Wang, Y.-N., and Chaw, S.-M. (2007). Transfer of chloroplast genomic DNA to mitochondrial genome occurred at least 300 MYA. Mol. Biol. Evol. 24, 2040–2048. doi: 10.1093/molbev/msm133
Wicke, S., Müller, K. F., dePamphilis, C. W., Quandt, D., Bellot, S., and Schneeweiss, G. M. (2016). Mechanistic model of evolutionary rate variation en route to a nonphotosynthetic lifestyle in plants. Proc. Natl. Acad. Sci. 113, 9045–9050. doi: 10.1073/pnas.1607576113
Wyman, S. K., Jansen, R. K., and Boore, J. L. (2004). Automatic annotation of organellar genomes with DOGMA. Bioinformatics 20, 3252–3255. doi: 10.1093/bioinformatics/bth352
Xu, H., Yang, H., Lin, M., Corrales, A., Hogan, J. A., Li, Y., et al. (2020). Thismia jianfenglingensis (Thismiaceae), a new species of fairy lantern from Hainan Island, China. Phytotaxa 429, 179–185. doi: 10.11646/phytotaxa.429.2.9
Yang, Z. (2007). PAML 4: phylogenetic analysis by maximum likelihood. Mol. Biol. Evol. 24, 1586–1591. doi: 10.1093/molbev/msm088
Keywords: Thismia, plastid genome, non-photosynthetic plants, genome reductive evolution, mycoheterotrophy
Citation: Yudina SV, Schelkunov MI, Nauheimer L, Crayn D, Chantanaorrapint S, Hroneš M, Sochor M, Dančák M, Mar S-S, Luu HT, Nuraliev MS and Logacheva MD (2021) Comparative Analysis of Plastid Genomes in the Non-photosynthetic Genus Thismia Reveals Ongoing Gene Set Reduction. Front. Plant Sci. 12:602598. doi: 10.3389/fpls.2021.602598
Received: 03 September 2020; Accepted: 22 January 2021;
Published: 16 March 2021.
Edited by:
Kathleen Pryer, Duke University, United StatesReviewed by:
Sean Warren Graham, University of British Columbia, CanadaJerrold Davis, Cornell University, United States
Copyright © 2021 Yudina, Schelkunov, Nauheimer, Crayn, Chantanaorrapint, Hroneš, Sochor, Dančák, Mar, Luu, Nuraliev and Logacheva. This is an open-access article distributed under the terms of the Creative Commons Attribution License (CC BY). The use, distribution or reproduction in other forums is permitted, provided the original author(s) and the copyright owner(s) are credited and that the original publication in this journal is cited, in accordance with accepted academic practice. No use, distribution or reproduction is permitted which does not comply with these terms.
*Correspondence: Maria D. Logacheva, bWFyaWEubG9nQGdtYWlsLmNvbQ==