 Zhi-Feng Chen1,2†Jing-Na Ru2†
 Guo-Zhong Sun2†Yan Du2
 Jun Chen2Yong-Bin Zhou2
 Ming Chen2
 You-Zhi Ma2
 Zhao-Shi Xu2*Xiao-Hong Zhang1*
- 1College of Life Sciences, Northwest A&F University/State Key Laboratory of Crop Stress Biology for Arid Areas, Yangling, China
- 2Institute of Crop Science, Chinese Academy of Agricultural Sciences (CAAS)/National Key Facility for Crop Gene Resources and Genetic Improvement, Key Laboratory of Biology and Genetic Improvement of Triticeae Crops, Ministry of Agriculture, Beijing, China
Phospholipase C (PLC) performs significant functions in a variety of biological processes, including plant growth and development. The PLC family of enzymes principally catalyze the hydrolysis of phospholipids in organisms. This exhaustive exploration of soybean GmPLC members using genome databases resulted in the identification of 15 phosphatidylinositol-specific PLC (GmPI-PLC) and 9 phosphatidylcholine-hydrolyzing PLC (GmNPC) genes. Chromosomal location analysis indicated that GmPLC genes mapped to 10 of the 20 soybean chromosomes. Phylogenetic relationship analysis revealed that GmPLC genes distributed into two groups in soybean, the PI-PLC and NPC groups. The expression patterns and tissue expression analysis showed that GmPLCs were differentially expressed in response to abiotic stresses. GmPI-PLC7 was selected to further explore the role of PLC in soybean response to drought and salt stresses by a series of experiments. Compared with the transgenic empty vector (EV) control lines, over-expression of GmPI-PLC7 (OE) conferred higher drought and salt tolerance in soybean, while the GmPI-PLC7-RNAi (RNAi) lines exhibited the opposite phenotypes. Plant tissue staining and physiological parameters observed from drought- and salt-stressed plants showed that stress increased the contents of chlorophyll, oxygen free radical (O2–), hydrogen peroxide (H2O2) and NADH oxidase (NOX) to amounts higher than those observed in non-stressed plants. This study provides new insights in the functional analysis of GmPLC genes in response to abiotic stresses.
Introduction
Plants inhabit widely varying environments and are affected by abiotic and biotic factors such as water, temperature, herbivore attacks and disease threats. Drought and salt are important factors that affect the production of crops because these two environmental stresses significantly impact plant reproduction. Drought- and salt-stressed soybean, for example, produce fewer pods and seeds per plant, and consequently reduce its yield and economically diminish the industrial production of soybeans (Wang et al., 2015a). In recent years, crop scientists have become very interested in the study of signal transduction pathways related to plant stress response. A particular focus has been on phospholipase C (PLC) because it is a very important enzyme in signal transduction pathways; many experts and scholars have directed their research on PLCs in association with plant tolerance to stress.
In response to various stresses, diverse signaling pathways are activated in plants, including Calcium ion (Ca2+), protein phosphatase, protein kinase and lipid signaling cascades. At present, plant lipid signal transmission is a relatively important area of research, including phosphatidic acid (PA) signaling (Berridge, 1993; Meijer and Munnik, 2003). Different PA generators are activated in stress response and PLCs contribute to PA response to stress (Meijer and Munnik, 2003). Phospholipases can be roughly divided into four categories, phospholipase A1 (PLA1), phospholipase A2 (PLA2), PLC and phospholipase D (PLD) (Hong et al., 2016), based on the different cleavage sites of phospholipids that are hydrolyzed by a phospholipase. As a key enzyme in signal transduction pathways, PLC mainly catalyzes the hydrolysis of phospholipids in organisms.
The PLC-mediated signaling pathway is one of the classic pathways of cell signaling pathways (Kadamur and Ross, 2013). In plants and animals, the PLC family is a multi-gene family whose genes have various functions (Nakamura et al., 2005; Peters et al., 2010). Based on their affinities to different substrates, PLCs are divided into two major groups in plants, phosphatidylinositol-specific PLC (PI-PLC) (Vossen et al., 2010) and phosphatidylcholine-PLC (PC-PLC), the latter of which basically hydrolyze phosphatidylcholine (PC) and other lipids and is also called non-specific phospholipase C (NPC) (Nakamura et al., 2005; Peters et al., 2010). Although the structures of certain PI-PLCs have been described in plants, knowledge about the structure of NPCs is lacking.
Phosphatidylinositol-specific PLC specifically recognizes phospholipids and consists of a catalytic PI-PLC-X (PF00388) domain, PI-PLC-Y (PF00387) domain, Ca2+/phospholipid-binding C2 domain (PF00168) and EF hand-like domain (PF09279). These structures of PI-PLC are present in all organisms and exhibit minimal differences in performing different functions (Rupwate and Rajasekharan, 2012). The EF chiral domain is located at the N-terminus of the PI-PLC sequence and contains four helix-loop-helixes which specifically recognize and bind to its substrate phosphatidylinositol 4,5-bisphosphate (PIP2) (Nomikos et al., 2015). When plants are subjected to external stresses, the EF chiral domain regulates the function of the reduced coenzyme II oxidase respiratory burst oxidase homolog protein D (RBOHD), an oxidase of nicotinamide adenine dinucleotide phosphate (Yasuhiro et al., 2015). The C2 domain is located at the C-terminus of PI-PLC and mainly functions to combine with Ca2+ to trigger the hydrophobicity of PLC, and thus it improves the hydrolysis efficiency of phospholipids (Hunt et al., 2004). The X and Y catalytic domains are located between the N-terminus and C-terminus of the PLC sequence. They are the two most conserved domains of PLC and are the crucial domains of PLC’s catalytic function. These domains can also mediate PLC-targeted membrane localization by electrostatic interactions (Nomikos, 2015).
The first functional PI-PLC cloned from plants was from Arabidopsis (Hirayama et al., 1995). According to genomic analyses, there are nine PI-PLCs and six NPCs in Arabidopsis (Pical, 2002; Jessica et al., 2004; Tasma et al., 2008). Additionally, six PI-PLC members have been identified in tobacco (Nakamura et al., 2005), and many more PLCs have been found in other plants (Mcmurray and Irvine, 1988; Einspahr et al., 1989; Hirayama et al., 1995; Shi et al., 1995; Song and Goodman, 2002; Venkataraman et al., 2003; Yun et al., 2004; Das et al., 2005; Zhai et al., 2005; Dowd et al., 2006).
Phospholipase C is involved in biotic and abiotic stress response in plants (Luo et al., 2005; Kalachova et al., 2016). For example, the expression of AtPLC1 in Arabidopsis can be induced by abiotic stresses, such as low temperature, drought and salt (Hirayama et al., 1995). There is a differential requirement of PLC for the tomato immune response and that SiPLC4 is specifically required for Cf-4 function, while SiPLC6 may be a more general constituent of the hypersensitive response (HR) protein signaling (Vossen et al., 2010). PLC pathway participates stress-induced Ca2+ signals and confers salt tolerance to rice (Li et al., 2017). In addition, the basal level of expression of most Arabidopsis dehydration resistance element binding protein 2 (DREB2) genes were negatively regulated by PI-PLC. The DREB2 genes play important roles in plant response to environmental stresses, including dehydration (Liu et al., 1998; Ruelland et al., 2013). One of the most important mechanisms by which a plant responds to signals of abiotic stress is to induce the expression of stress-related genes (Kalachova et al., 2016). Under drought stress, the transcription levels of StPLC1 and StPLC2 in potato leaves are elevated, while the level of StPLC3 are unchanged (Kopka, 1998). Under drought stress, the expression levels of TaPLC1 in wheat rapidly increased compared to that of TaPLC1 under the non-drought treatment (Zhang et al., 2014). These different expression levels indicated that different cis-elements and trans-acting factors might regulate the expression levels of phospholipase C homologs and that various PLCs have specific functions. In recent years, some studies have shown that PLC is also involved in the regulation of hormone signaling pathways in various plants (Meijer and Munnik, 2003; Kalachova et al., 2016). In Arabidopsis, PLC promoted ABA-induced stomatal closure; the PLC specific inhibitor U73122 can inhibit ABA-induced stomatal closure and changes in Ca2+ content (Drøbak, 1992). In addition, NPC, a non-specific plant phospholipid enzyme, is homologous to bacterial PI-PLC and can response to lipid signals (Pokotylo et al., 2013). Especially in recent years, NPC family research has made significant progress, which involves various aspects of plant growth and development (Nakamura and Ngo, 2020).
Soybean (Glycine max) is an important oil and protein crop whose growth and productivity are adversely affected by soil drought and salt (Wang et al., 2015b). In addition, soybean seed is the most important protein source used to feed farm animals. It represents two-thirds of the total world output of protein feedstuffs (Whitham et al., 2016). Previous studies highlighted the role of PLC genes in plant growth and development and that several PLC genes were involved in abiotic stresses. Although the PLC gene family has been analyzed in several plant species, no systematic investigation has been conducted using soybean, and little information is available about the function of GmPLCs in abiotic stress responses. Given the significance of this gene family, a genomic-wide identification of GmPLCs was performed in the current study, including investigations into phylogenetic relationships, chromosomal locations, gene duplications and expression profiles of these genes. In addition, we determined the function of GmPI-PLC7 in soybean. The results indicated that over-expression (OE) of GmPI-PLC7 increased soybean tolerance to drought stress. Our study provides insights into understanding the genetic basis of GmPLC in abiotic stress response.
Materials and Methods
Identification of Soybean GmPLC Members
Identification of the soybean PLC gene family was performed according to the method described previously (Amarjeet et al., 2013; Su et al., 2020), with some revisions. The putative GmPLC gene family members were identified in the soybean gene family databases Phytozome v12 and SoyBase (Goodstein et al., 2012), using keywords such as “phospholipase C,” “phosphatidylinositol phospholipase C,” and “phosphoesterase.” We verified identifications using the phospholipase C domain in the SMART database (Letunic et al., 2012). Hidden Markov Model profiles using default parameters (E-value < e−20) were acquired for different PLC classes from the Simple Modular Architecture Research Tool (SMART) database and used to scan the protein database Soy Base (Finn et al., 2011). Arabidopsis PLCs were obtained from TAIR (The Arabidopsis Information Resource) and were used to BLASTP soybean homologous sequences in Phytozome v12. The putative GmPLC sequences having higher homology with Arabidopsis PLC were obtained for further analysis. After the integration of results from all these databases, unique sequences (with unique locus IDs) were selected to remove redundancies. All the sequences were verified to have the conserved domains and motifs from relevant sequences in the Inter Pro and Pfam databases (Axelrod et al., 2010).
Chromosomal Location and Phylogenetic Analysis
The position information of GmPLCs on the soybean chromosome were obtained from the Phytozome database and were visualized with the online tool Map Gen 2 Chromosome v2. For the phylogenetic analysis, the protein sequences of the verified PLC candidates from rice, Arabidopsis and soybean were used for multiple sequence alignment by employing Clustal X (version 2.0). An un-rooted phylogenetic tree was constructed to analyze the evolutionary relationships of the PLC genes. The phylogenic tree was constructed by MEGA 7.0 software with the neighbor-joining (NJ) method. We estimated the confidence levels with bootstrap analyses of 1000 replicates, and the default values were set for all the parameters. We didn’t use outlier to construct the tree and didn’t find the setting of outlier in MEGA7.0 software.
Multiple Sequence Alignment and Conserved Motifs Analysis
Position and sequence information of GmPLC genes were used to align sequences using the DNAman software and Multiple Em for Motif Elicitation (MEME). The coding sequences and the genomic DNA sequences of GmPLCs were obtained from SoyBase. The exon/intron gene boundaries were examined using the Gene Structure Display Server 2.0 (GSDS) tool (Hu et al., 2015).
Tissue-Specific Expression Patterns of GmPLC Genes in Soybean
Transcription data were obtained from Phytozome v12 to analyze the tissue expression patterns of GmPLCs. HemI software was used to visualize the hierarchical clustering of all the GmPLCs.
Promoter Sequence Analysis
The 2.0-kb 5′ sequences upstream of GmPLC genes were extracted from the Phytozome database as regulatory promoter regions. Putative cis-acting elements were analyzed using the Plant CARE database (Rombauts et al., 1999). The cis-acting element boundaries were examined using the GSDS tool (Hu et al., 2015).
Plant Materials and Treatments
Soybean (Williams 82) was used to analyze the expression pattern of GmPLC genes. Seedlings were grown in pots in a greenhouse with a 16 h-light/8 h-dark photoperiod, 28/20°C day/night temperatures, and 70% relative humidity. The 14-day-old seedlings were subjected to drought, mannitol (to simulate osmotic stress) and melatonin treatments. For the drought treatment, soybean plants were removed from soil and put on filter paper; for the mannitol treatment, the roots of soybean were soaked in 150 μM mannitol solution; and for the melatonin treatment, the leaves were subjected to 150 μM melatonin solution. The leaves of seedlings were collected at 0, 0.5, 1, 2, 4, 8, 12, 24, and 48 h after initiation of treatments. All samples were frozen expeditiously in liquid nitrogen and then stored at −80°C for RNA extraction (Xu et al., 2008).
RNA Extraction and Quantitative Real-Time PCR
Total RNA was extracted from soybean leaves of seedlings subjected to one of the three treatments described above using the manufacturer’s protocol (TIANGEN, China), and the RNA was treated with DNase I (TaKaRa, Japan) to exclude genomic DNA contamination, according to the manufacturer’s instructions. Approximately 3 μg of purified total RNA from each sample was used in reverse transcription using TransScript One-Step gDNA Removal and cDNA Synthesis Super Mix (TransGen Biotech, Beijing, China) and then samples were kept at −20°C. The Quantitative Real-Time PCR (qRT-PCR) was performed with Super Mix (TransGen Biotech, Beijing, China) on an ABI Prism 7500 system (Applied Biosystems, Foster City, CA, United States), and each qRT-PCR reaction was repeated three times. Data analysis was conducted by the 2–ΔΔCT method. The primers used for qRT-PCR are listed in Supplementary Tables 1 and 5.
Agrobacterium rhizogenes-Mediated Transformation of Soybean Hairy Roots
We generated GmPI-PLC7-over-expressing (GmPI-PLC7-OE) soybean hairy roots. The sequences of GmPI-PLC7 were assembled with the plant transformation vector pCAMBIA3301 and the CaMV 35S promoter. For the construction of the RNAi vector, a 463-bp fragment including the first intron sequence and its reverse complement sequence were synthesized (Biomed, Beijing, China) and cloned into pCAMBIA3301 to generate the pCAMBIA3301-GmPI-PLC7-RNAi vector. All recombinant vectors were transformed into soybean hairy roots by the A. rhizogenes-mediated method as described previously (Wang et al., 2009; Du et al., 2018). The injected plants were transferred to a greenhouse with high humidity until the hairy roots were produced at the infection site. The original main roots were cut off from 0.5 cm below the infection site. Seedlings were transplanted into fertilized soil and cultured in the greenhouse for a week at 25°C and a 16 h light/8 h dark photoperiod (Kereszt et al., 2007). After verification, positive soybean hair roots were used for abiotic stress assays, and we have changed references with more detailed methods descriptions of transformed Soybean Hairy Roots. There were five lines in a pot and six biological replicates of each stress treatment.
Drought and NaCl Tolerant Assays
For the drought treatment, 2-week-old soybean plants with transgenic hairy roots were subjected to dehydration for 16 days. For the salt treatment, 2-week-old soybean plants with transgenic hairy roots were treated with 250 mM NaCl solution for 7 days (Wang et al., 2017).
Measurement of Proline, Malondialdehyde (MDA), Oxygen Free Radical (O2–) and Hydrogen Peroxide (H2O2) Contents
The contents of proline, MDA, and H2O2 and O2– were assessed in transgenic, GmPI-PLC7-OE (OE), empty vector (EV), and GmPI-PLC7-RNAi (RNAi) lines of plants with the corresponding assay kit (Cominbio, Suzhou, China) based on the manufacturer’s protocols (Du et al., 2018).
Leaf-Staining by 3,3-Diaminobenzidine (DAB), Nitro Blue Tetrazolium (NBT) or Trypan Blue
After drought treatment for 7 days or salt treatment for 3 days, leaves from transgenic soybean plants were used for staining. For the DAB staining, the samples were immersed in DAB solution (Solarbio, China) for 18 h and then transferred to a boiled solution of a ratio of alcohol to glycerin of 3:1 until leaves became white in color. For the NBT staining, the samples were immersed in NBT staining solution (Solarbio, China) for 14 h and then transferred to a boiled solution of three-parts alcohol to one-part glycerin to decolor the leaves to a white color (Du et al., 2018). For the trypan blue staining, plants were subjected to drought for 7 days, and then the samples were immersed in 0.4% trypan blue (Solarbio, China) solution for 12 h followed by decoloring in acetic acid until the leaves became white.
Statistical Analysis
All treatments in each of the phenotypic measurements and qPCR expression analysis described above had at least three independent replicates. Values are means ± standard deviations (SD) and variance analysis was performed based on the Student’s test at p = 0.05.
Results
Identification of GmPLCs in Soybean
Twenty-four GmPLCs, were identified based on the unique conserved domains (X and Y domains). The sizes and physical and chemical properties varied among different GmPLC proteins. The statistical results illustrated that the protein size of 15 GmPI-PLC proteins ranged from 376 to 629 amino acids, the isoelectric points (pI) varied from 5.70 to 9.45, and the molecular weights (MW) ranged from 42.7 to 70.9 kDa, whereas the protein lengths of nine NPCs ranged from 311 to 801 amino acids, the pI varied from 5.23 to 7.78 and the MW ranged from 33.4 to 59.7 kDa. The 15 GmPI-PLCs and 9 GmNPCs were named as GmPI-PLC1 to GmPI-PLC15 and GmNPC1 to GmNPC9, respectively, according to their chromosomal locations (Supplementary Table 2).
Chromosomal Location and Phylogenetic Analysis
The PLC genes were distributed on 10 of the 20 total chromosomes in soybean. Soybean chromosome 14 contained the most GmPI-PLCs, whereas chromosomes 2, 11 and 18 contained the comparable number of GmPI-PLC genes. GmNPC genes were evenly distributed across nine of the chromosomes (Figure 1).
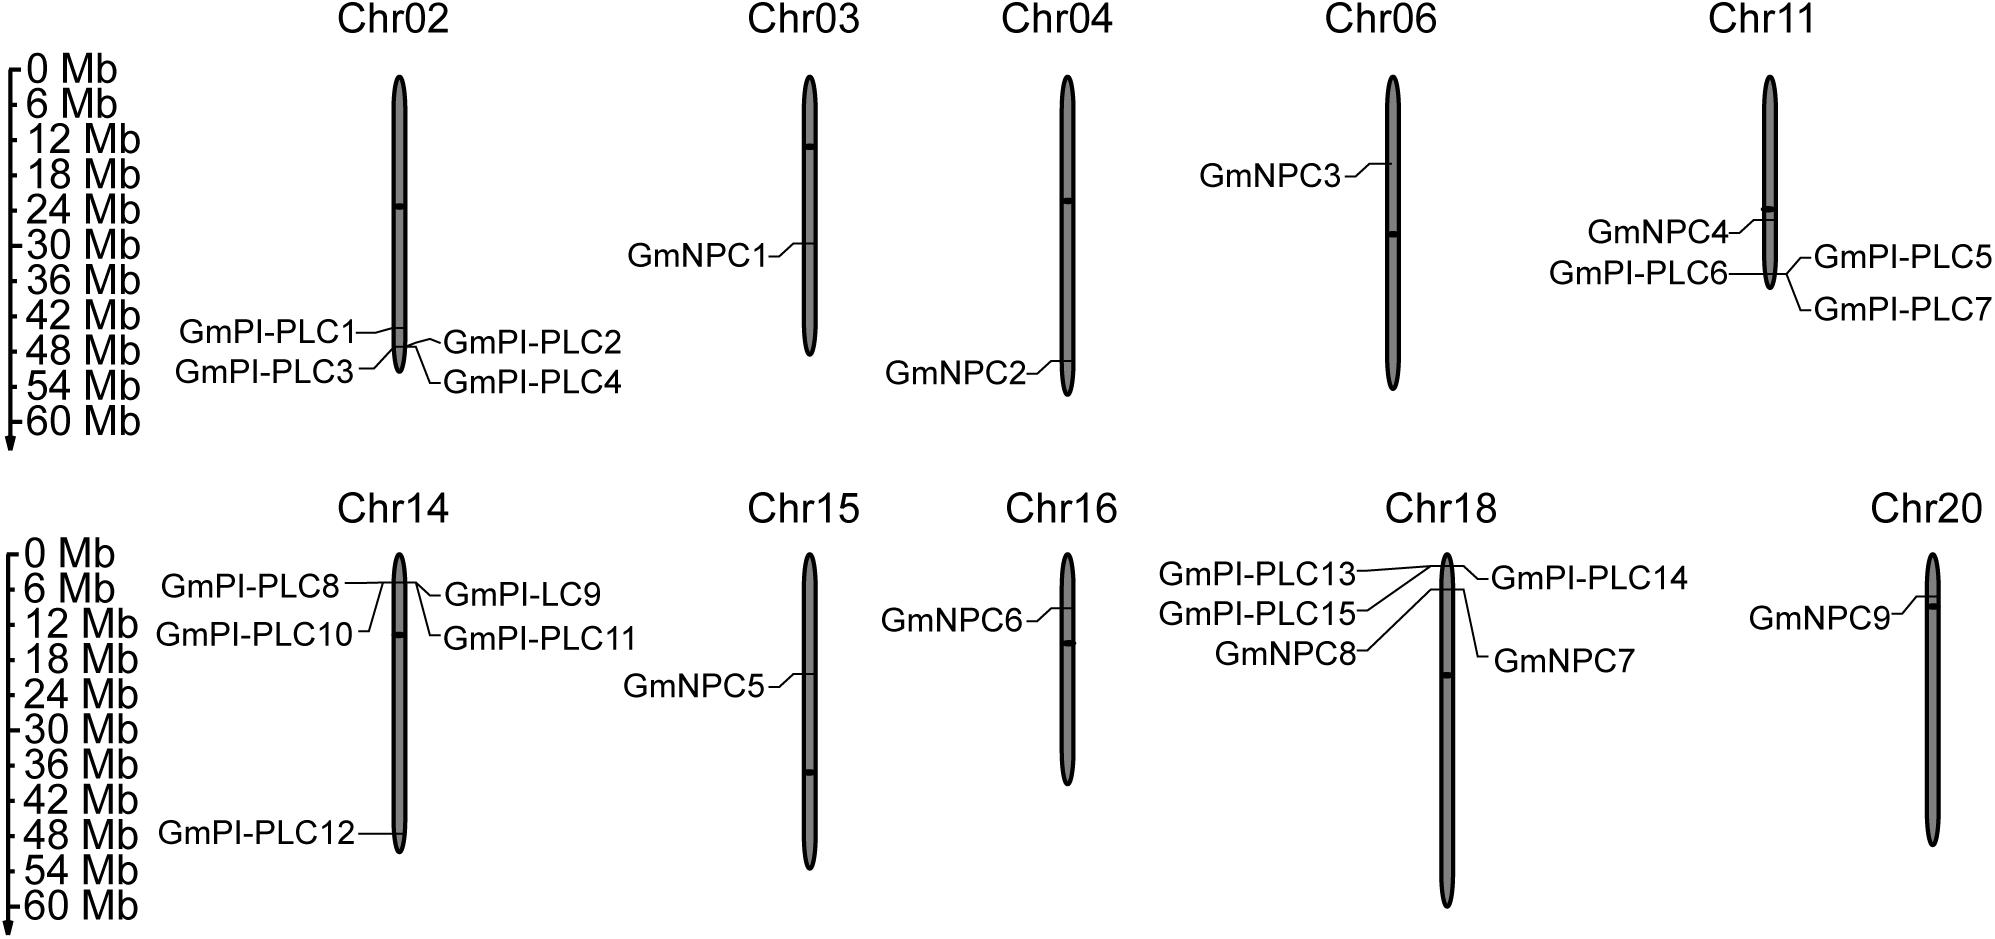
Figure 1. Chromosomal distribution of the identified 15 GmPI-PLC genes and 9 GmNPC genes in soybean. The members of GmPLC genes were distributed on different chromosomes (Chr). The gray bars represent the Chrs, and the Chr numbers are shown above the bars. Bars are not drawn to scale. The numbers on the left side of the bars show the distances in megabases (Mb) between neighboring genes.
To analyze the evolutionary relationships of PLC proteins, the PLC proteins from soybean and other organisms were aligned and used for a phylogenetic analysis. All of 24, 14, and 9 PLCs from soybean, Arabidopsis and rice, respectively, were used for the construction of the phylogenetic tree through the MEGA 7.0 software (Figure 2). The PLC proteins in soybean could be grouped as two distinct clusters GmPI-PLC and GmNPC, and 15 GmPI-PLC proteins were divided into three major clades, which corresponds to phylogenetic results in previous reports (Supplementary Figure 1 and Table 3).
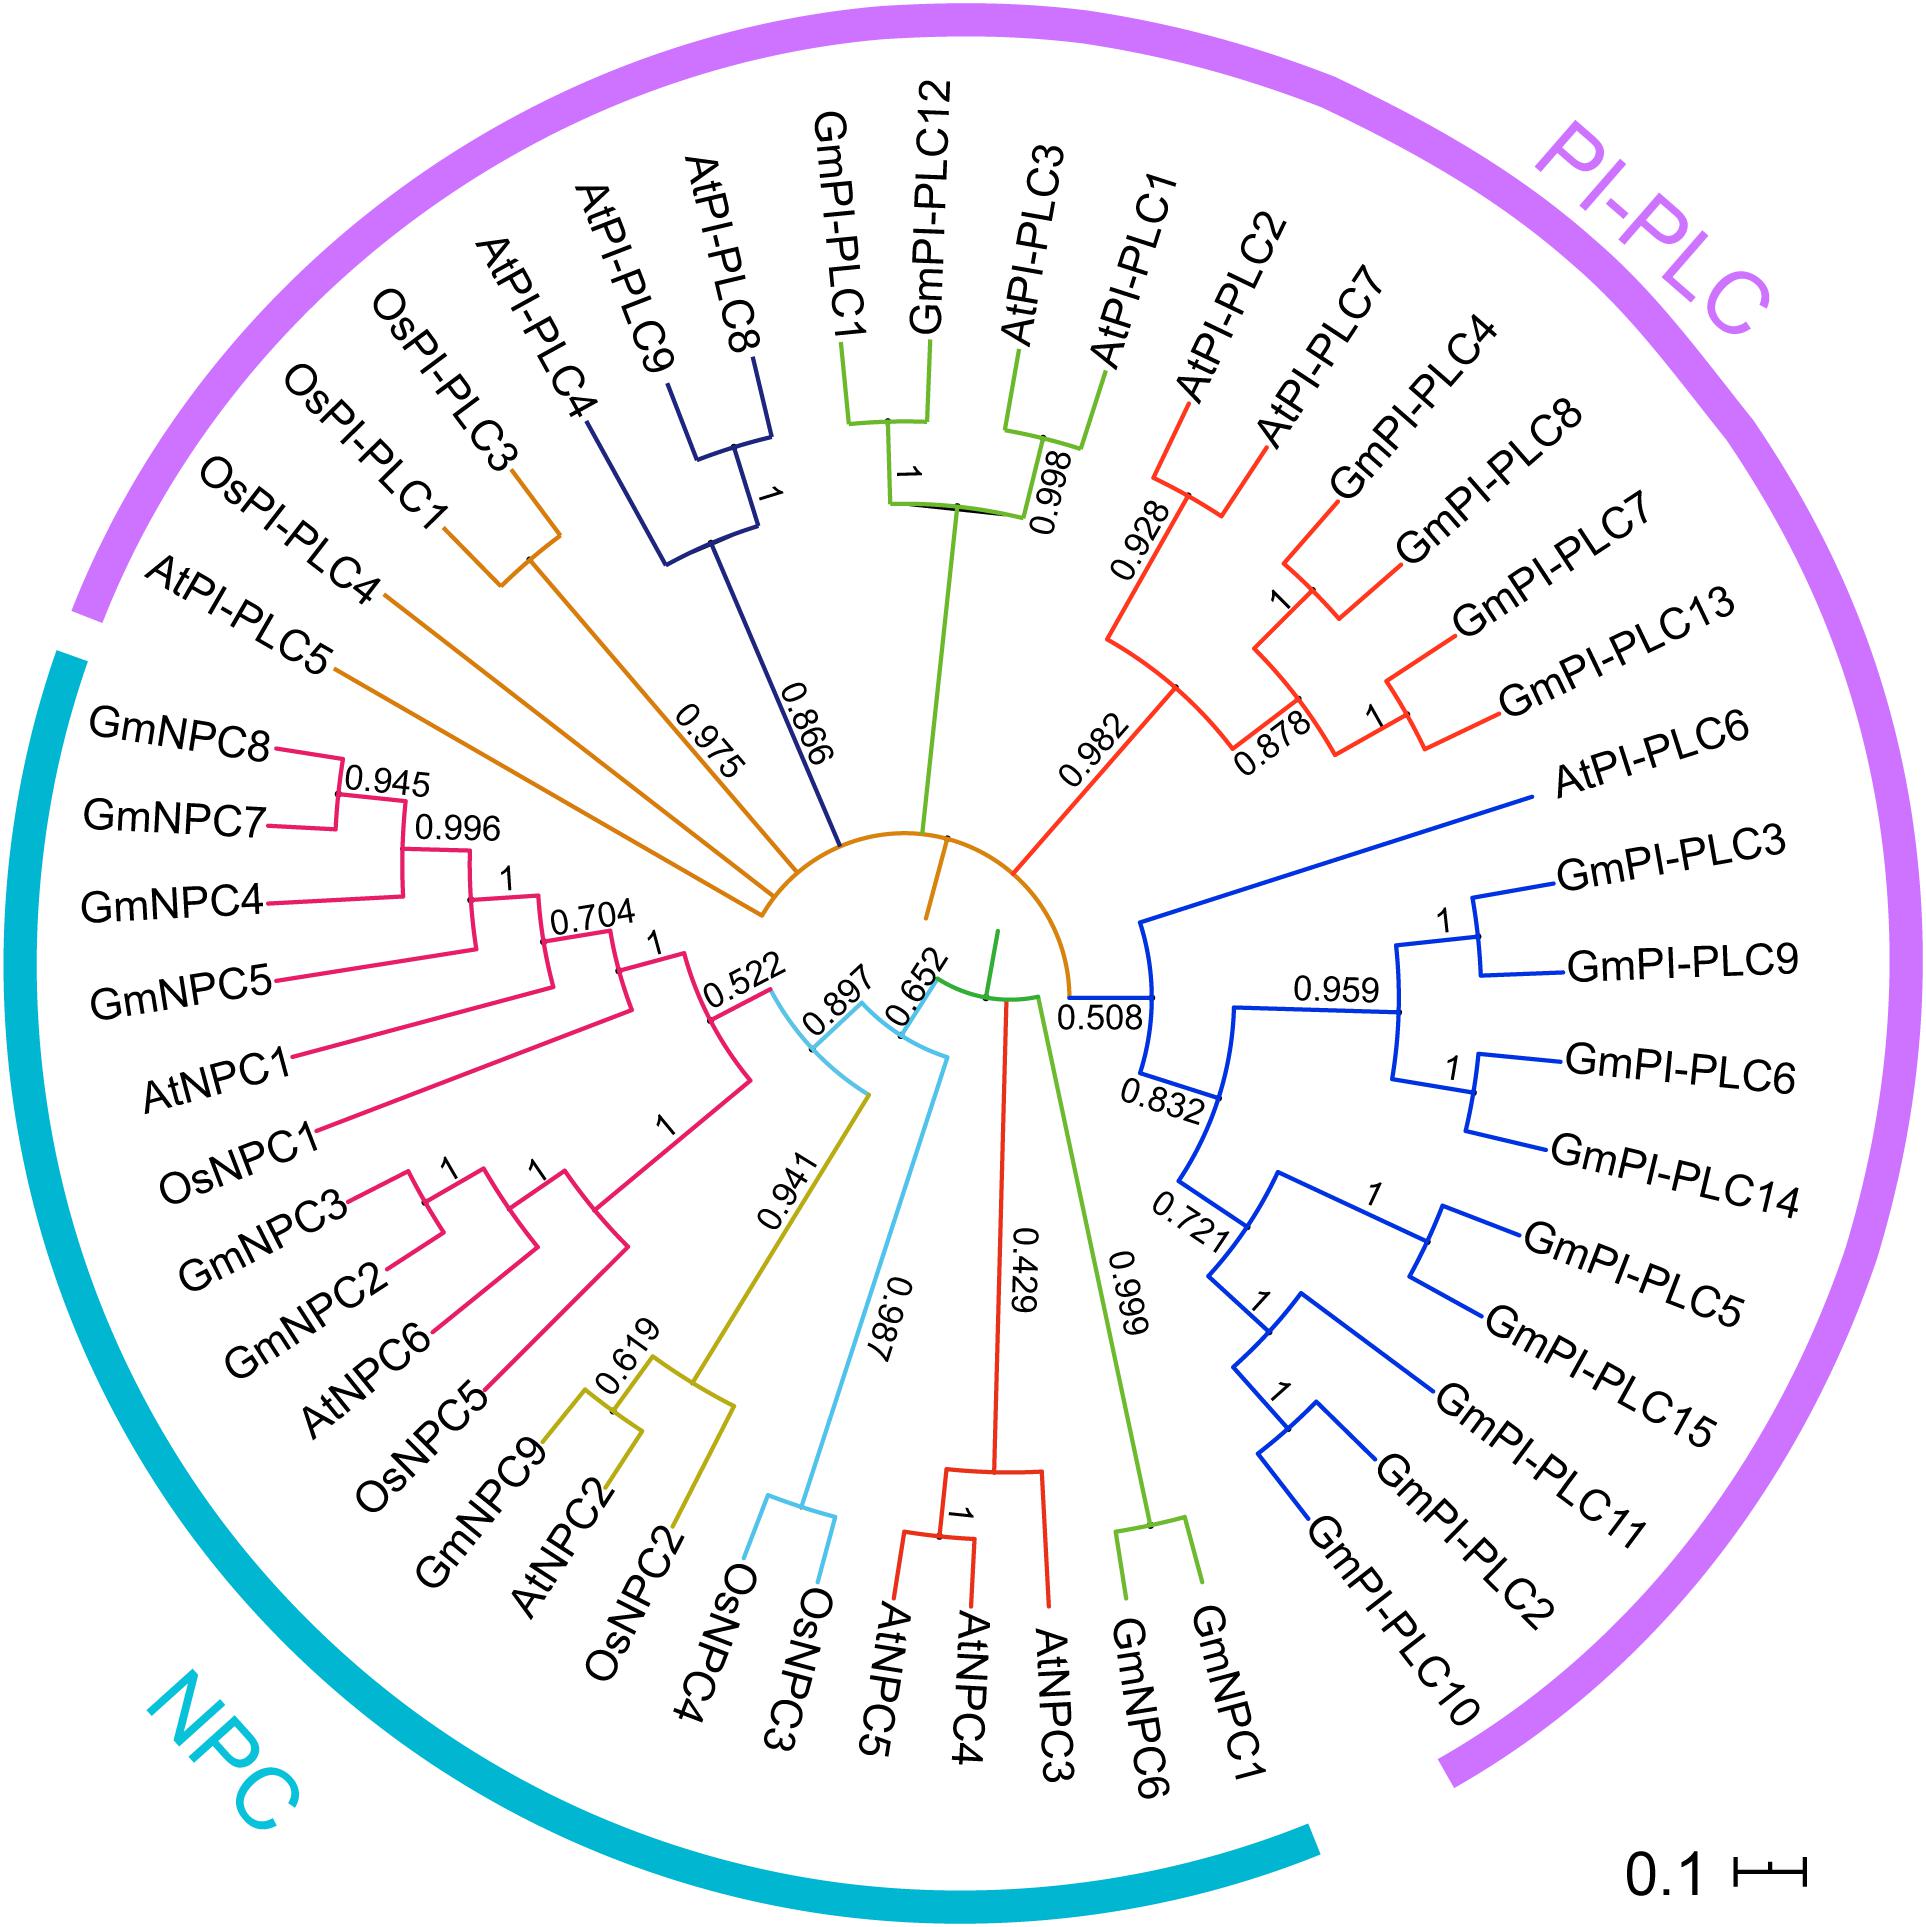
Figure 2. Phylogenetic relationships of the PI-PLC and NPC gene families in soybean, rice and Arabidopsis. The complete amino acid sequences of the PLC proteins were aligned by Clustal W and maximum-likelihood estimation with MEGA7. Two discrete groups are highlighted in different colors.
Multiple Sequence Alignment
The three conserved regions of the GmPI-PLC proteins were distributed on the front, middle, and rear segments of the protein sequence, and the conserved regions of GmNPCs were distributed in the middle of the amino acid sequences (Figures 3, 4).
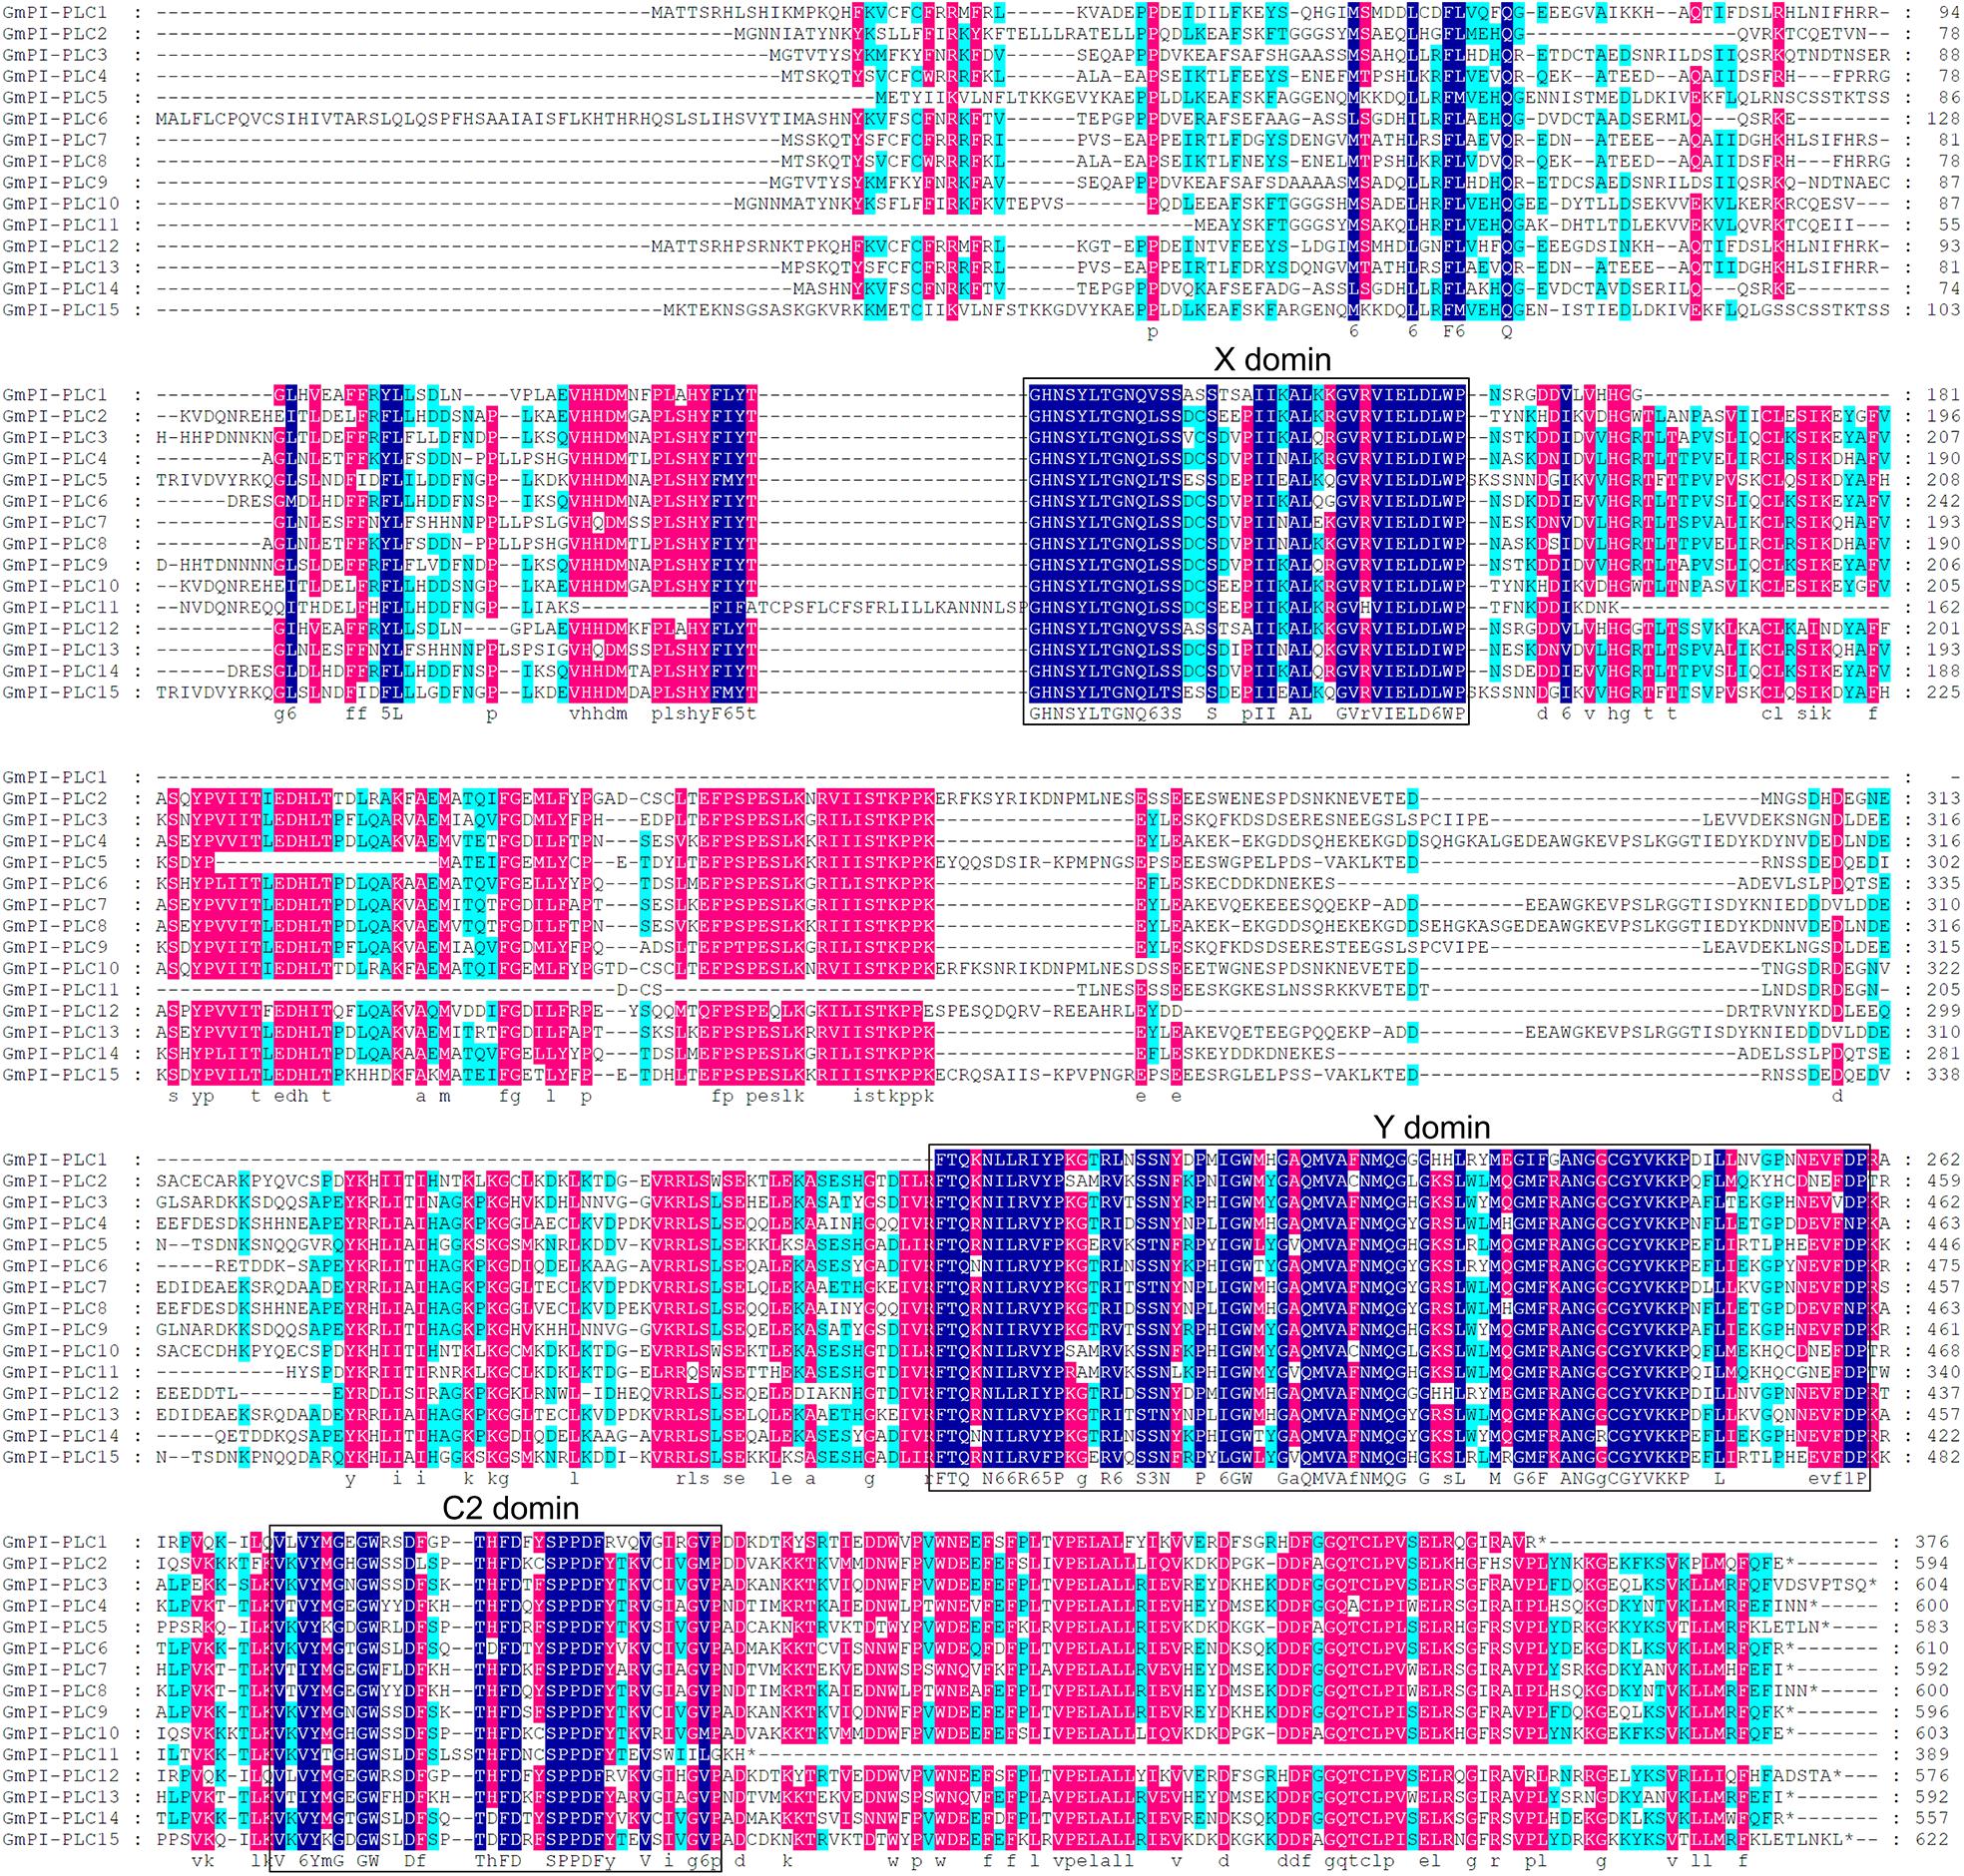
Figure 3. Multiple sequence alignment of 15 GmPI-PLC proteins from soybean using DNAMAN. Navy blue, red and light blue shading, respectively, represent amino acids with 100, >75, and 50% similarity of amino acids.
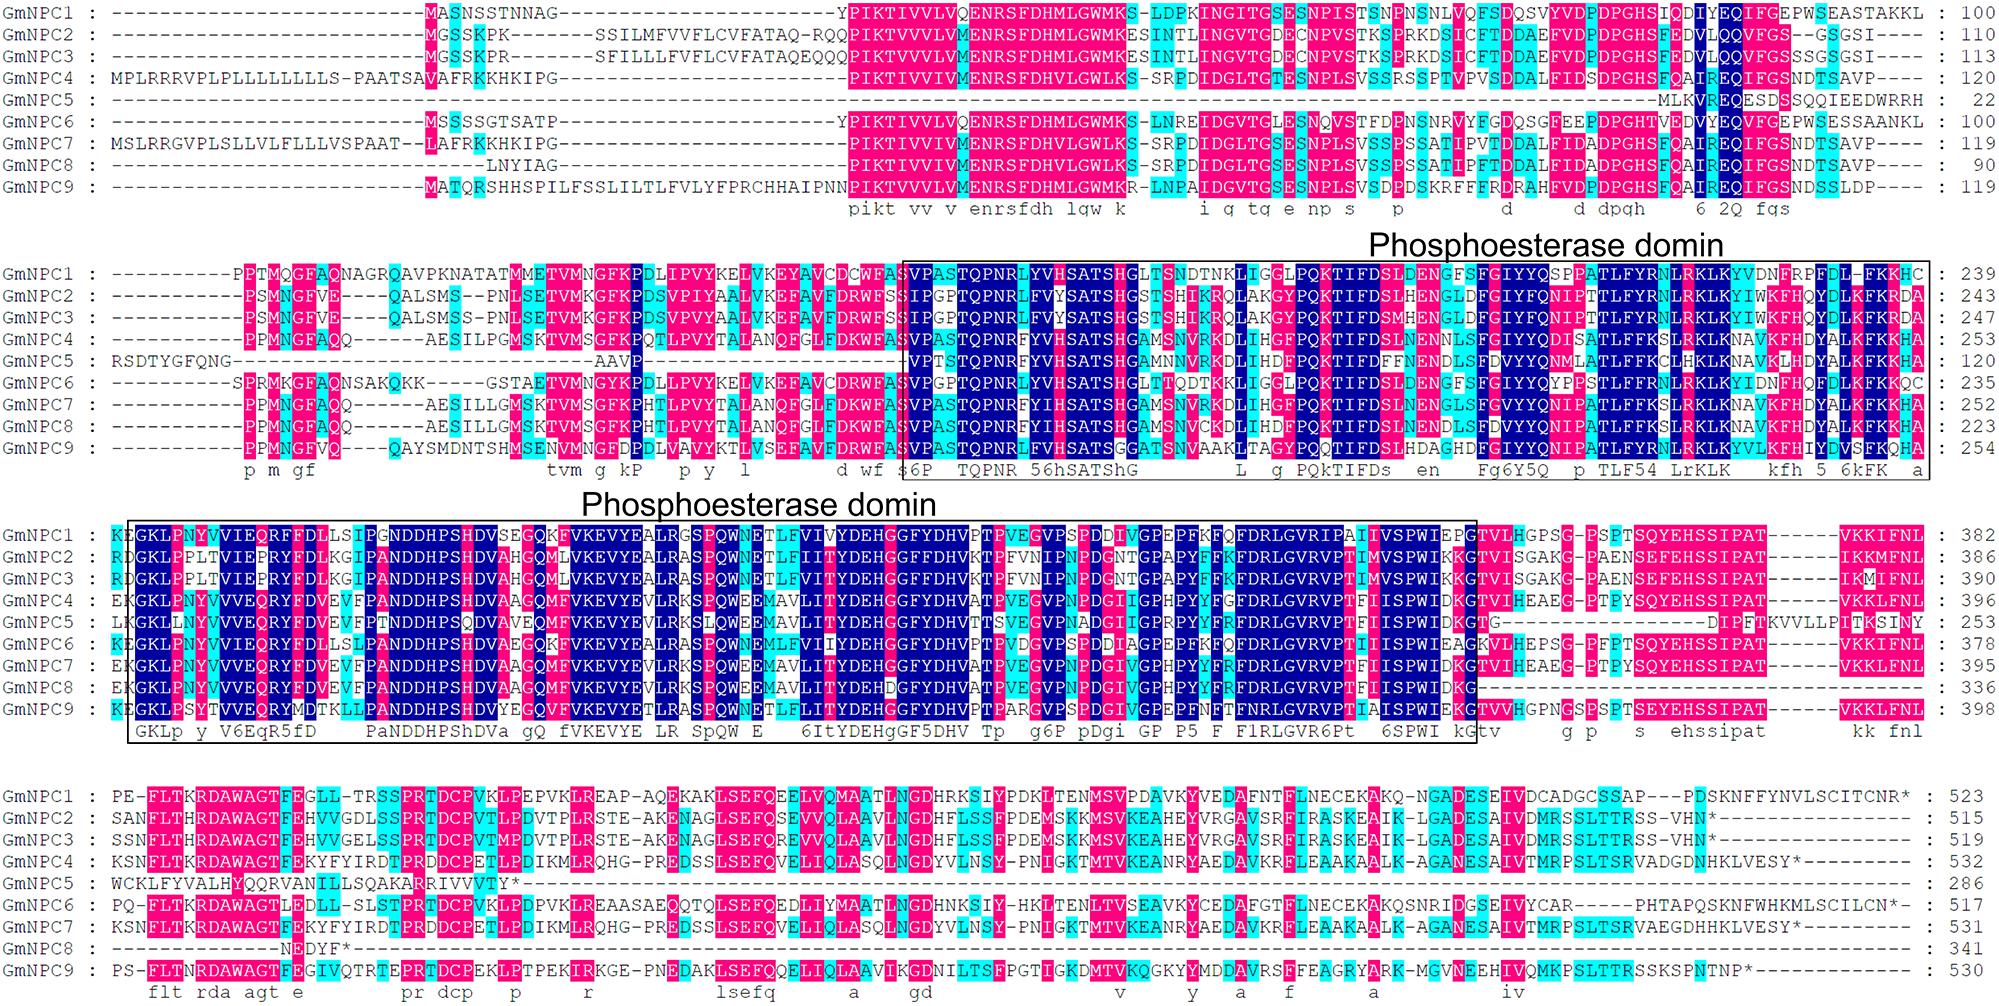
Figure 4. Multiple sequence alignment of nine GmNPC proteins from soybean by DNAMAN. Navy blue, red and light-blue shading, respectively, represent amino acids with 100, >75, and 50% similarity of amino acids.
Gene Structure Analysis of GmPLCs in Soybean
Research suggests that the evolution of multi-gene families leads to diversity in genetic structure. The exon/intron structures of GmPLC genes are shown in Figure 6. The exon-intron organization of the 24 GmPLC genes was examined to obtain information on the structure, diversity, and evolution of the PLC families in soybean. The PLC family members of soybean all contained nine exons except for GmPLC1, and the number of introns in NPC family members were from 2–4 (Figure 5 and Supplementary Table 2).
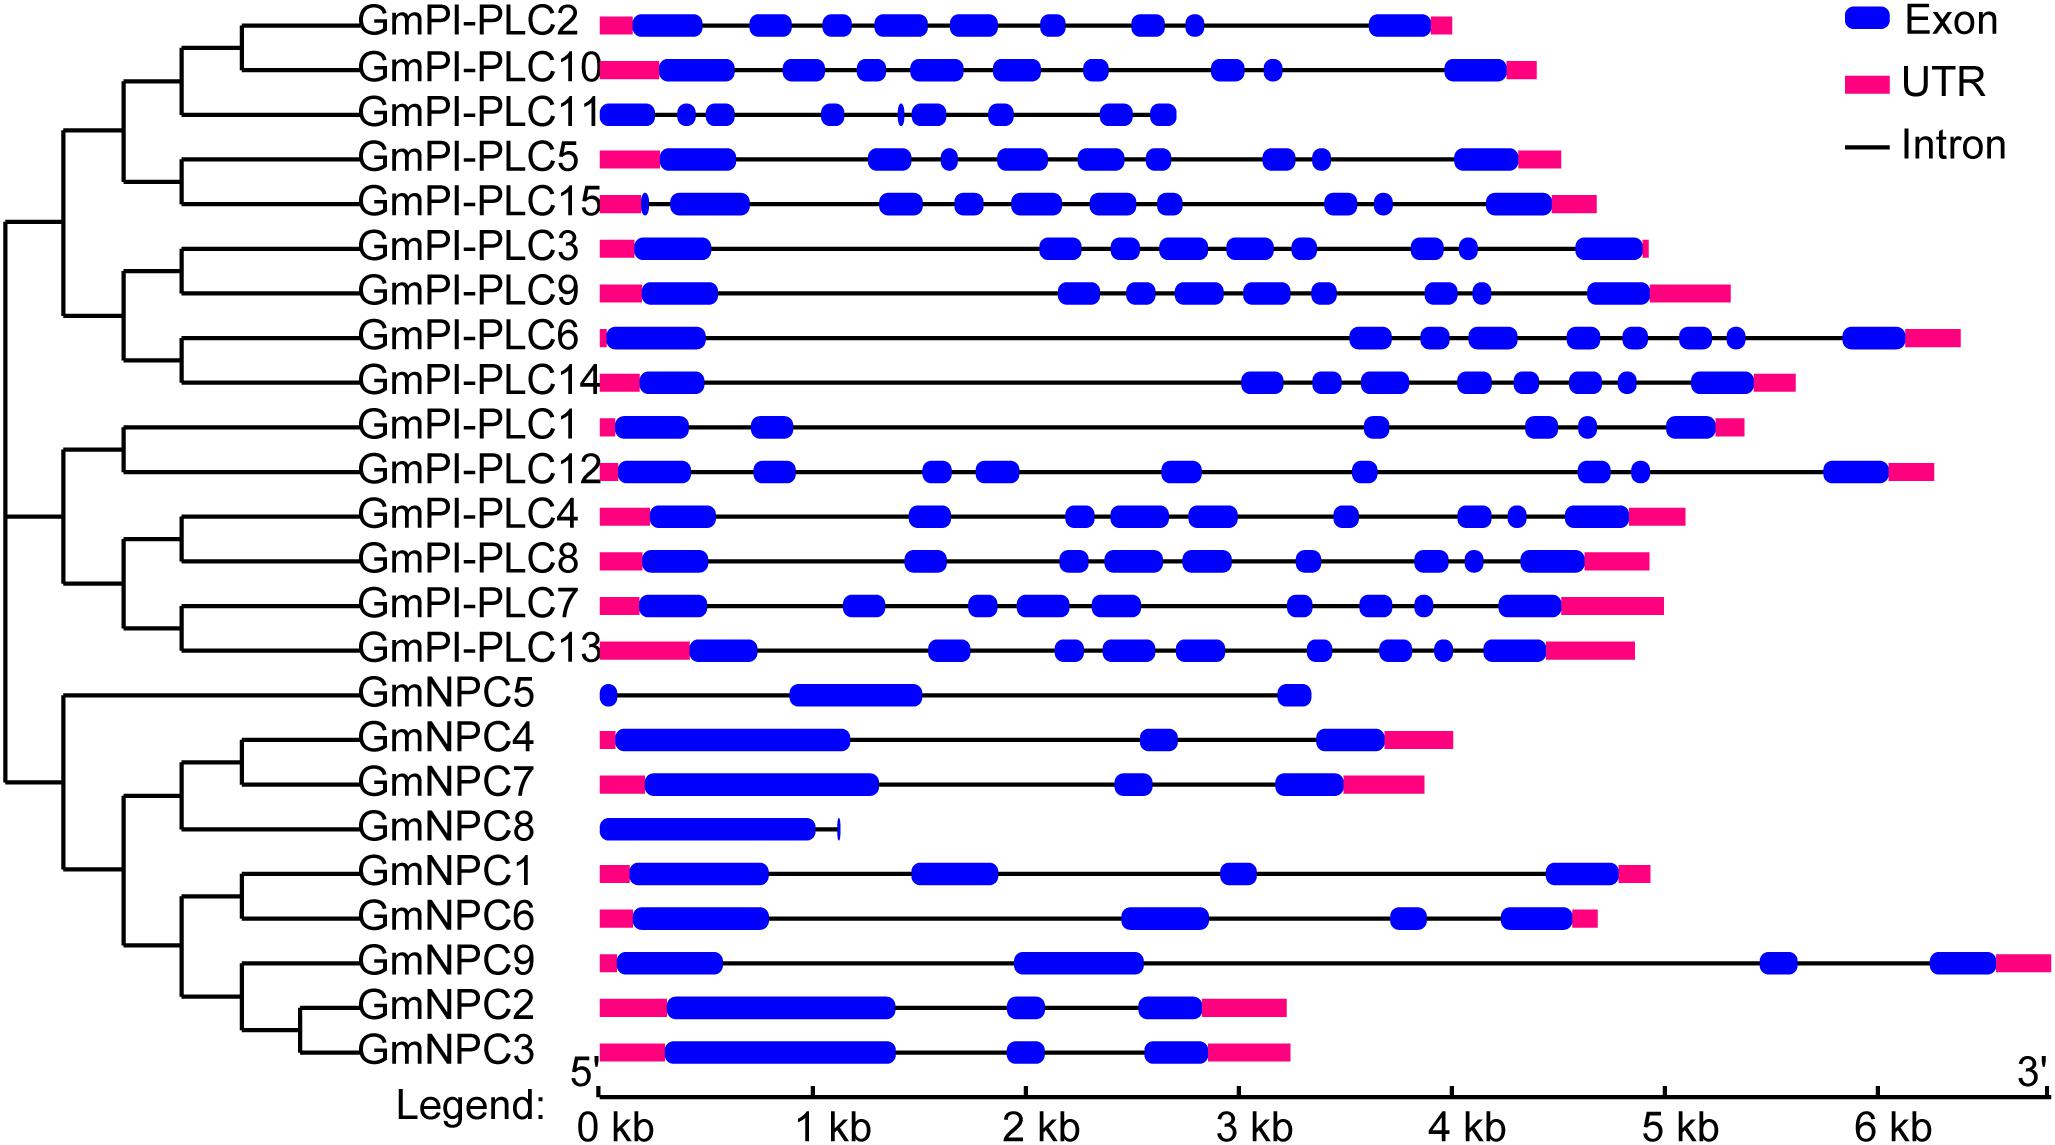
Figure 5. Structural analysis of GmPLC genes. The phylogenetic tree was constructed via MEGA7.0 software; the different classes of GmPLC genes make up separate clades. Introns and exons are indicated by black lines and blue boxes, respectively. The lengths of introns and exons of each gene are displayed proportionally.
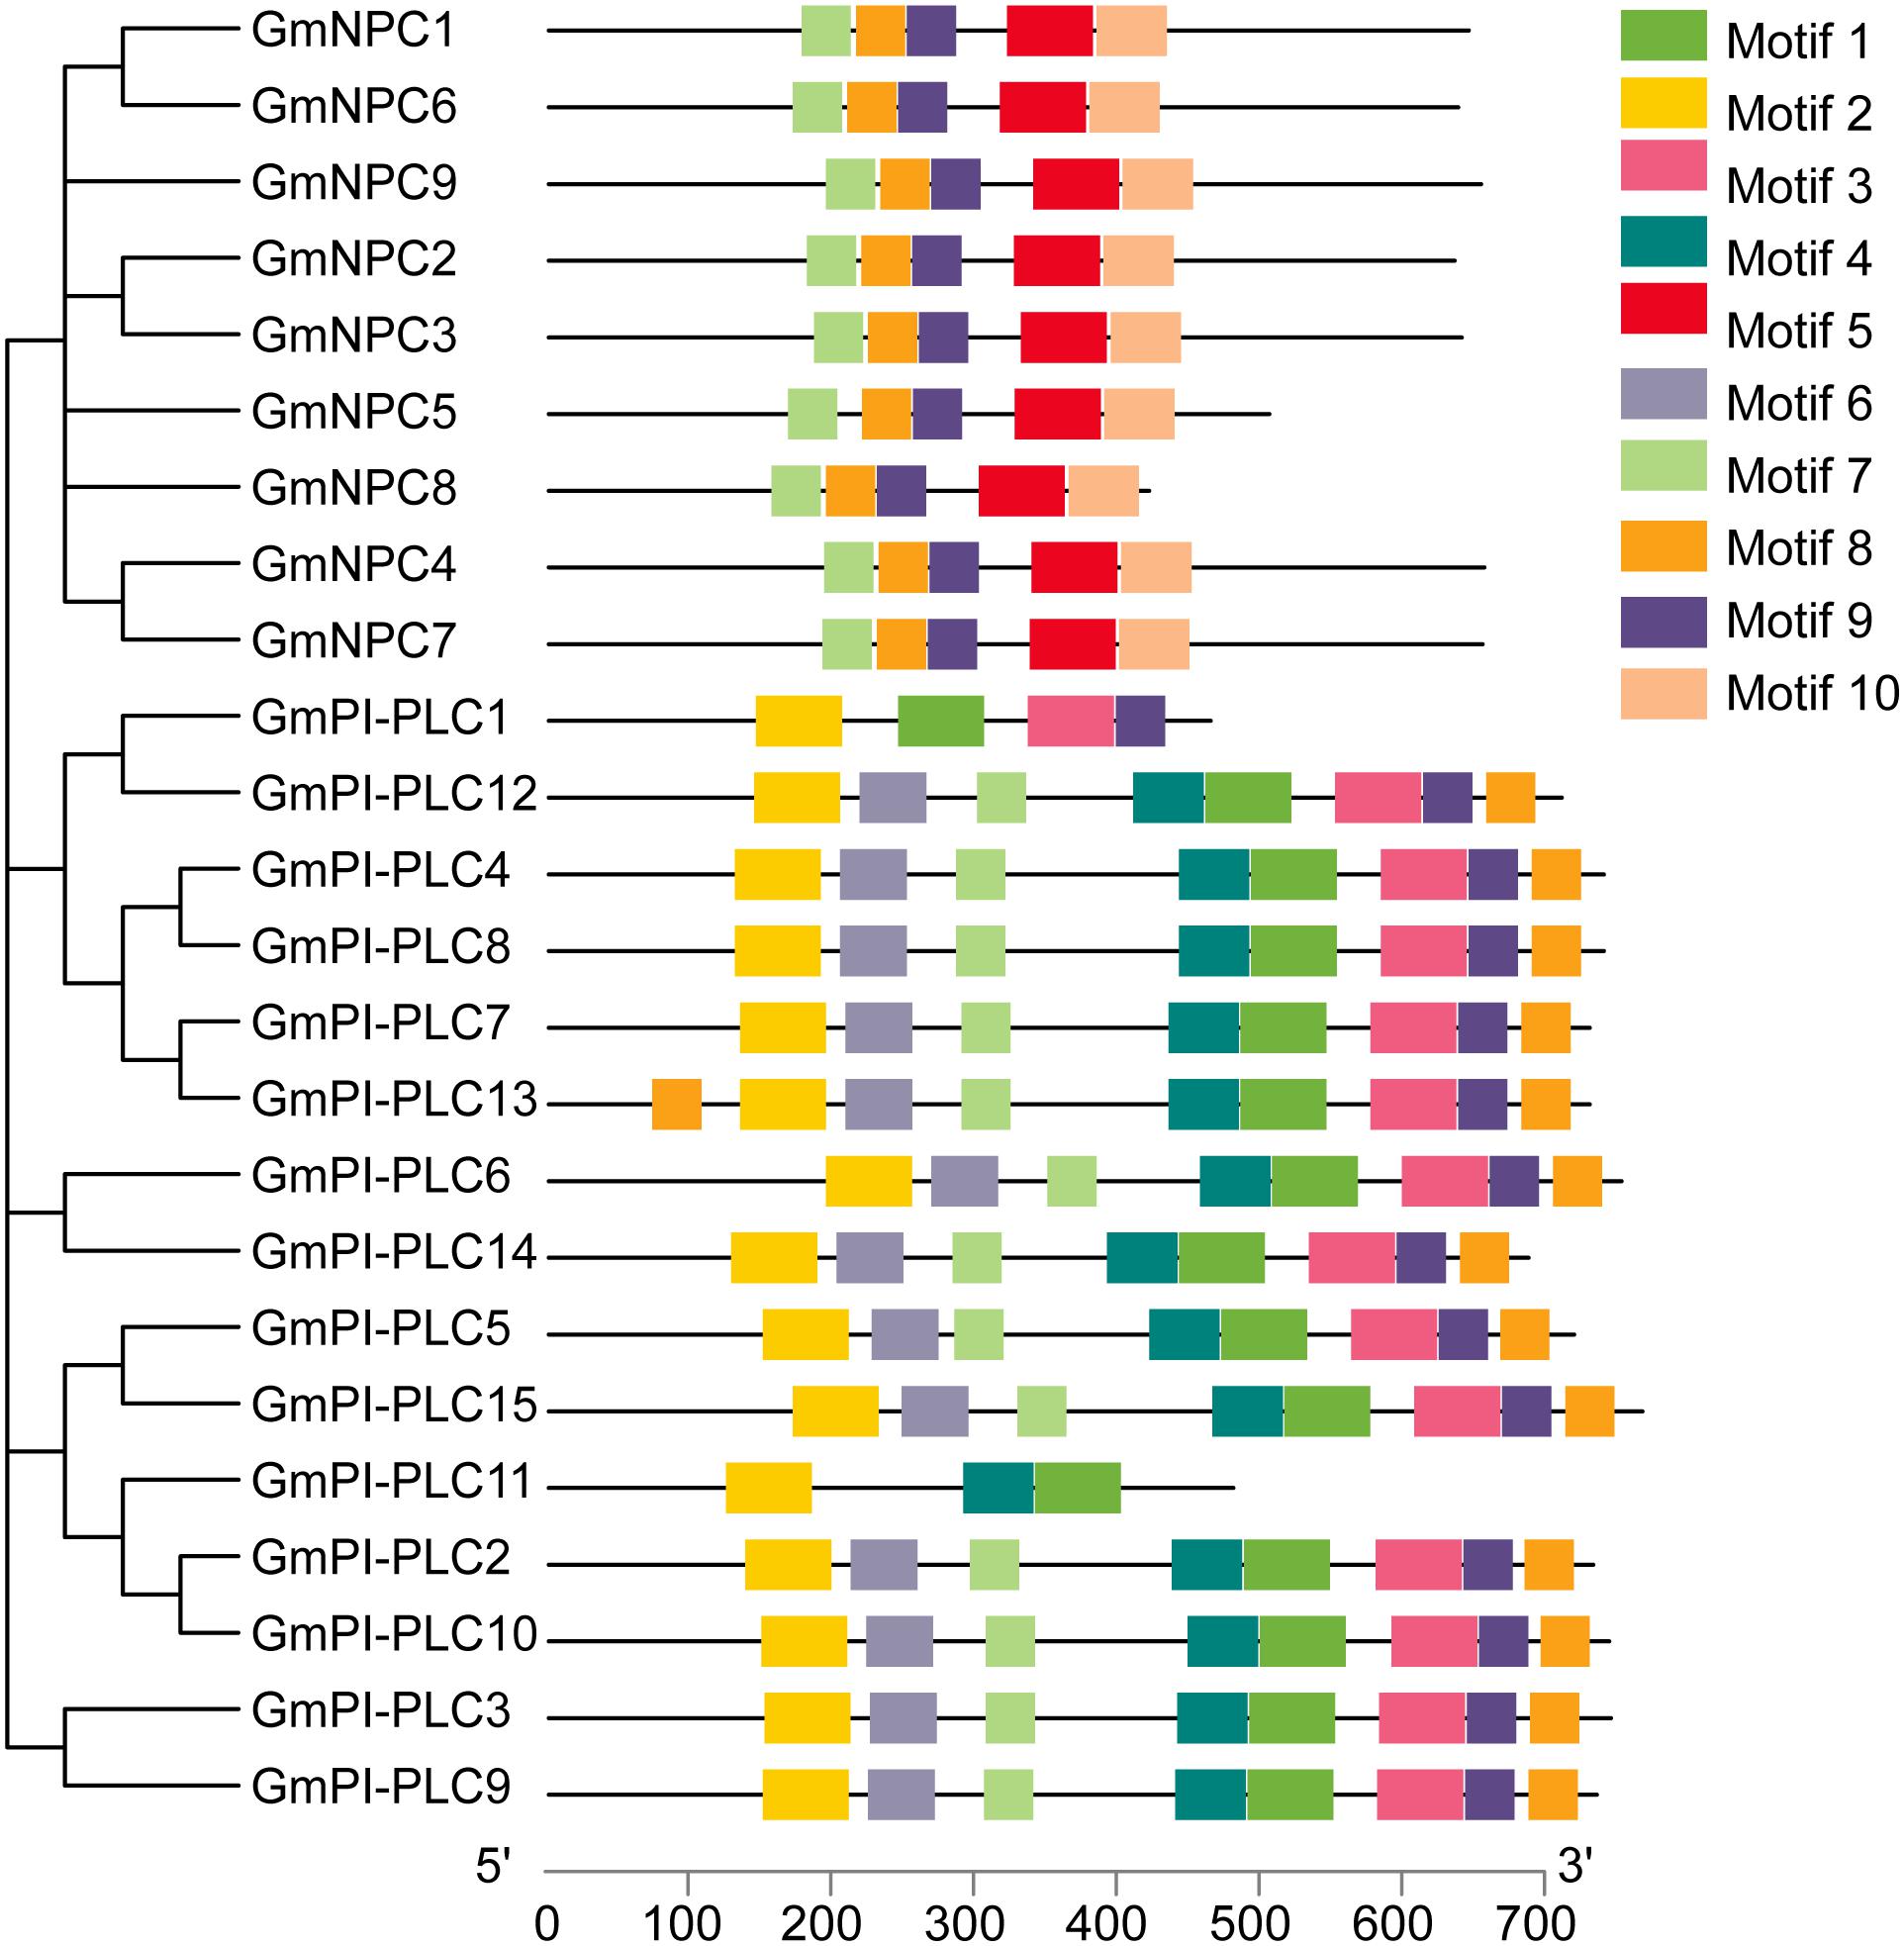
Figure 6. Schematic representation of the 10 conserved motifs in GmPLC proteins. Putative motifs of each GmPLC gene were determined by the MEME program and TBtools software. Each motif is indicated by a different colored box. The lengths of proteins can be estimated using the scale at the bottom.
Analysis of GmPLC Motif Sequences in Soybean
In addition to the exon/intron pattern, conserved motifs could also be important for the various functions of GmPLC genes. We determined 10 different conserved motifs (Figure 6), and the results demonstrated that genes members of the same subfamily shared an analogous motif structure. The amounts of each conserved motif are shown in Supplementary Table 2. Notably, the GmPI-PLC genes had more motifs than the GmNPC genes had, and the same regions often were composed of proteins with higher homology, which corresponds to the phylogenetic analysis.
Tissue-Specific Expression Patterns of GmPLC Genes in Soybean
To gain insight into the gene expression patterns in soybean growth and development, we used the relative transcript abundance of the GmPLC genes in 10 types of tissues (flower, leaf, pod, root, seed, stem, bud, meristem, root hair, and nodule) from publicly available transcriptome data in the Phytozome database. GmPLCs transcripts were detected in the various tissues (Figure 7 and Supplementary Table 4). A total of 24 GmPLC genes were expressed in tissues, whereas GmPI-PLC7 were expressed in all selected tissues. Additionally, the expression patterns among the GmPLCs differed in the same tissues. For example, GmPI-PLC4, GmPI-PLC7, GmPI-PLC14, GmNPC4, and GmNPC7 were highly expressed in most tissues. The expression of GmPI-PLC13, GmNPC2 and GmNPC9 were high in flowers, GmNPC2 was expressed strongly in roots, and GmPI-PLC9 and GmNPC9 transcription were enriched in pods. The expression of GmPI-PLC1, GmPI-PLC11, GmNPC5, and GmNPC8 were low in all tissues. These transcriptional patterns demonstrated that the expression of these genes might be governed by diverse and potentially tissue-dependent regulatory mechanisms.
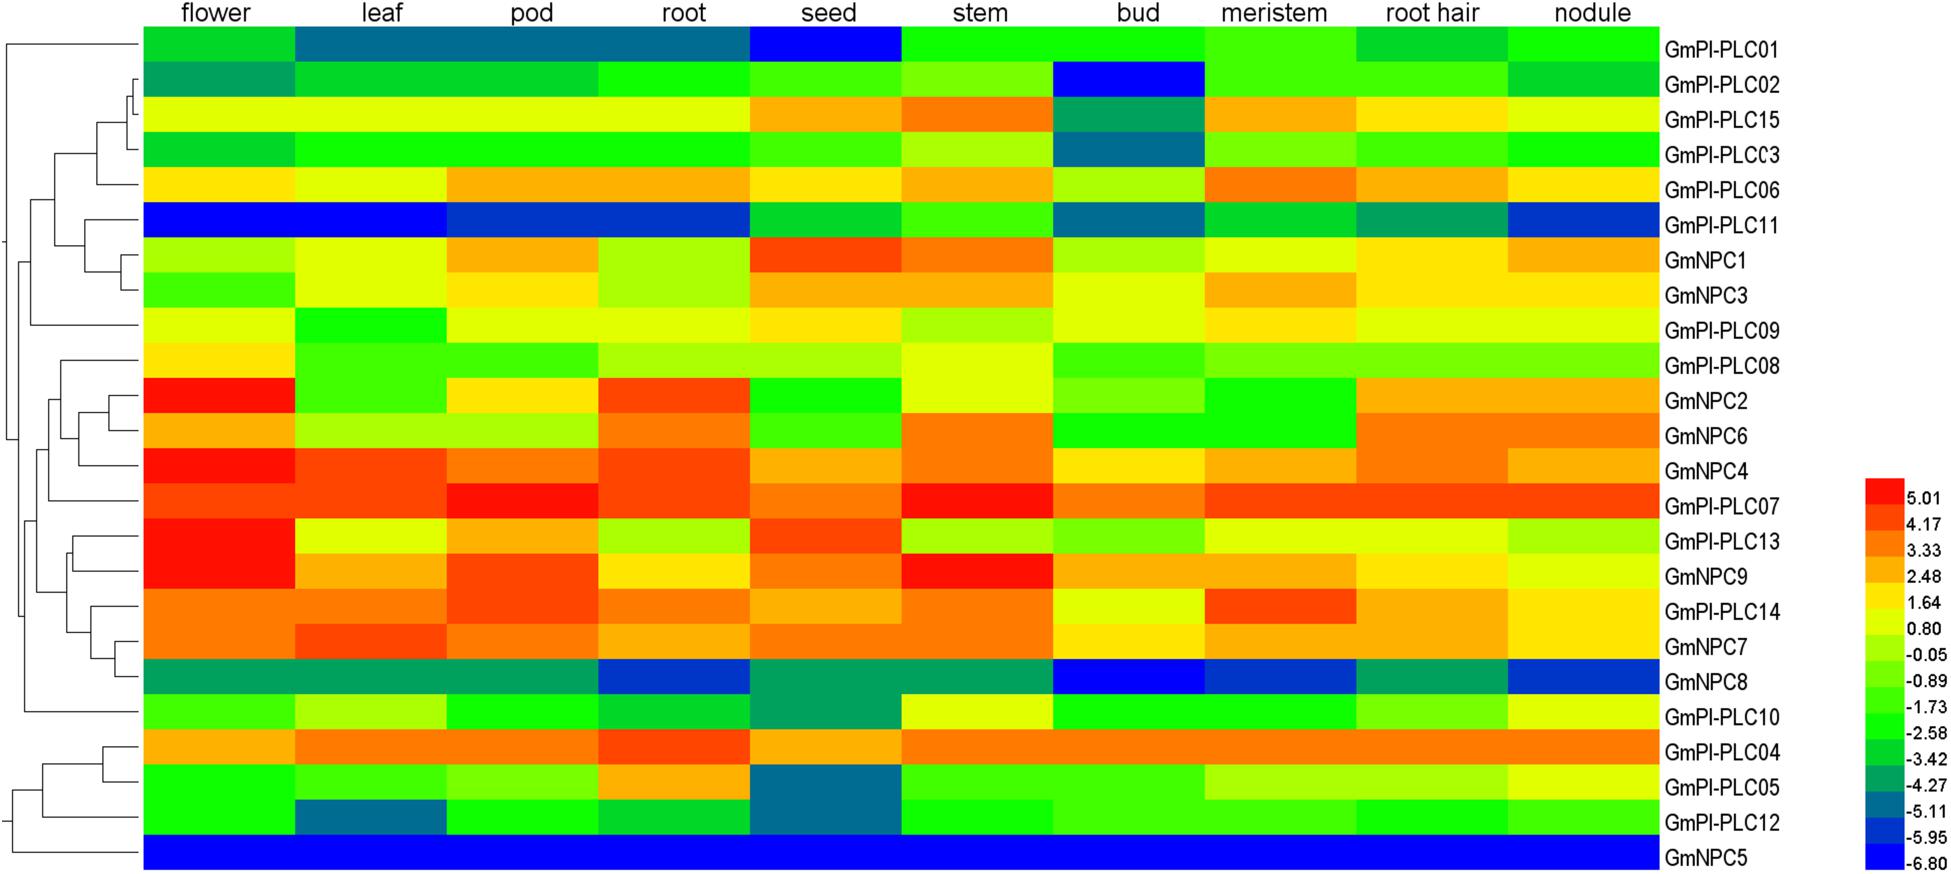
Figure 7. Tissue-specific expression patterns of GmPLC genes in different soybean tissues: flower, leaves, pod, root, seed, stem, bud, meristem, root hairs, and nodules. Color bar at the top represents log2 (FPKM) expression values where low to high expression values are, respectively, represented by blue to red colors.
Expression Pattern Analysis of GmPLC Genes and Abiotic Stress
The analysis of qRT-PCR results show that the expression patterns of GmPLC genes varied in response to an abiotic stress of drought, mannitol or melatonin treatment. Among the varied responses of genes in the GmPLC gene families, GmPI-PLC6, GmPI-PLC7, GmNPC1, GmNPC2, GmNPC4, GmNPC6, and GmNPC7 expression increased at the early stage and then declined at the later stage of treatment (Treatment response was divided into stages, “early” was 1–2 h, “mid” was 4–8 h, and “late” was 9–12 h after initiation treatment.). Under drought stress, the transcription of GmPI-PLC6, GmPI-PLC7, GmNPC1, GmNPC2, GmNPC5, and GmNPC7 were up-regulated by 3–5-fold (Figure 8). Mannitol treatment significantly induced the transcription of four GmPLC genes at 4 h after treatment; the expression of GmPI-PLC6, GmPI-PLC7, GmPI-PLC9 and GmPI-PLC14 were upregulated by 3–5-fold (Figure 9). With regard to the melatonin treatment, three GmPLCs (GmPI-PLC13, GmNPC4, and GmNPC7), two GmPLCs (GmPI-PLC7 and GmNPC6) and five GmPLCs (GmPI-PLC10, GmNPC5, GmNPC6, GmNPC8, and GmNPC9) were most strongly upregulated (>three-fold change) at 2, 4, and 8 h, respectively (Figure 10). The expression level of GmPI-PLC7 increased under the drought, mannitol and melatonin treatments (3. 77-, 4. 21-, and 4.52-fold, respectively).
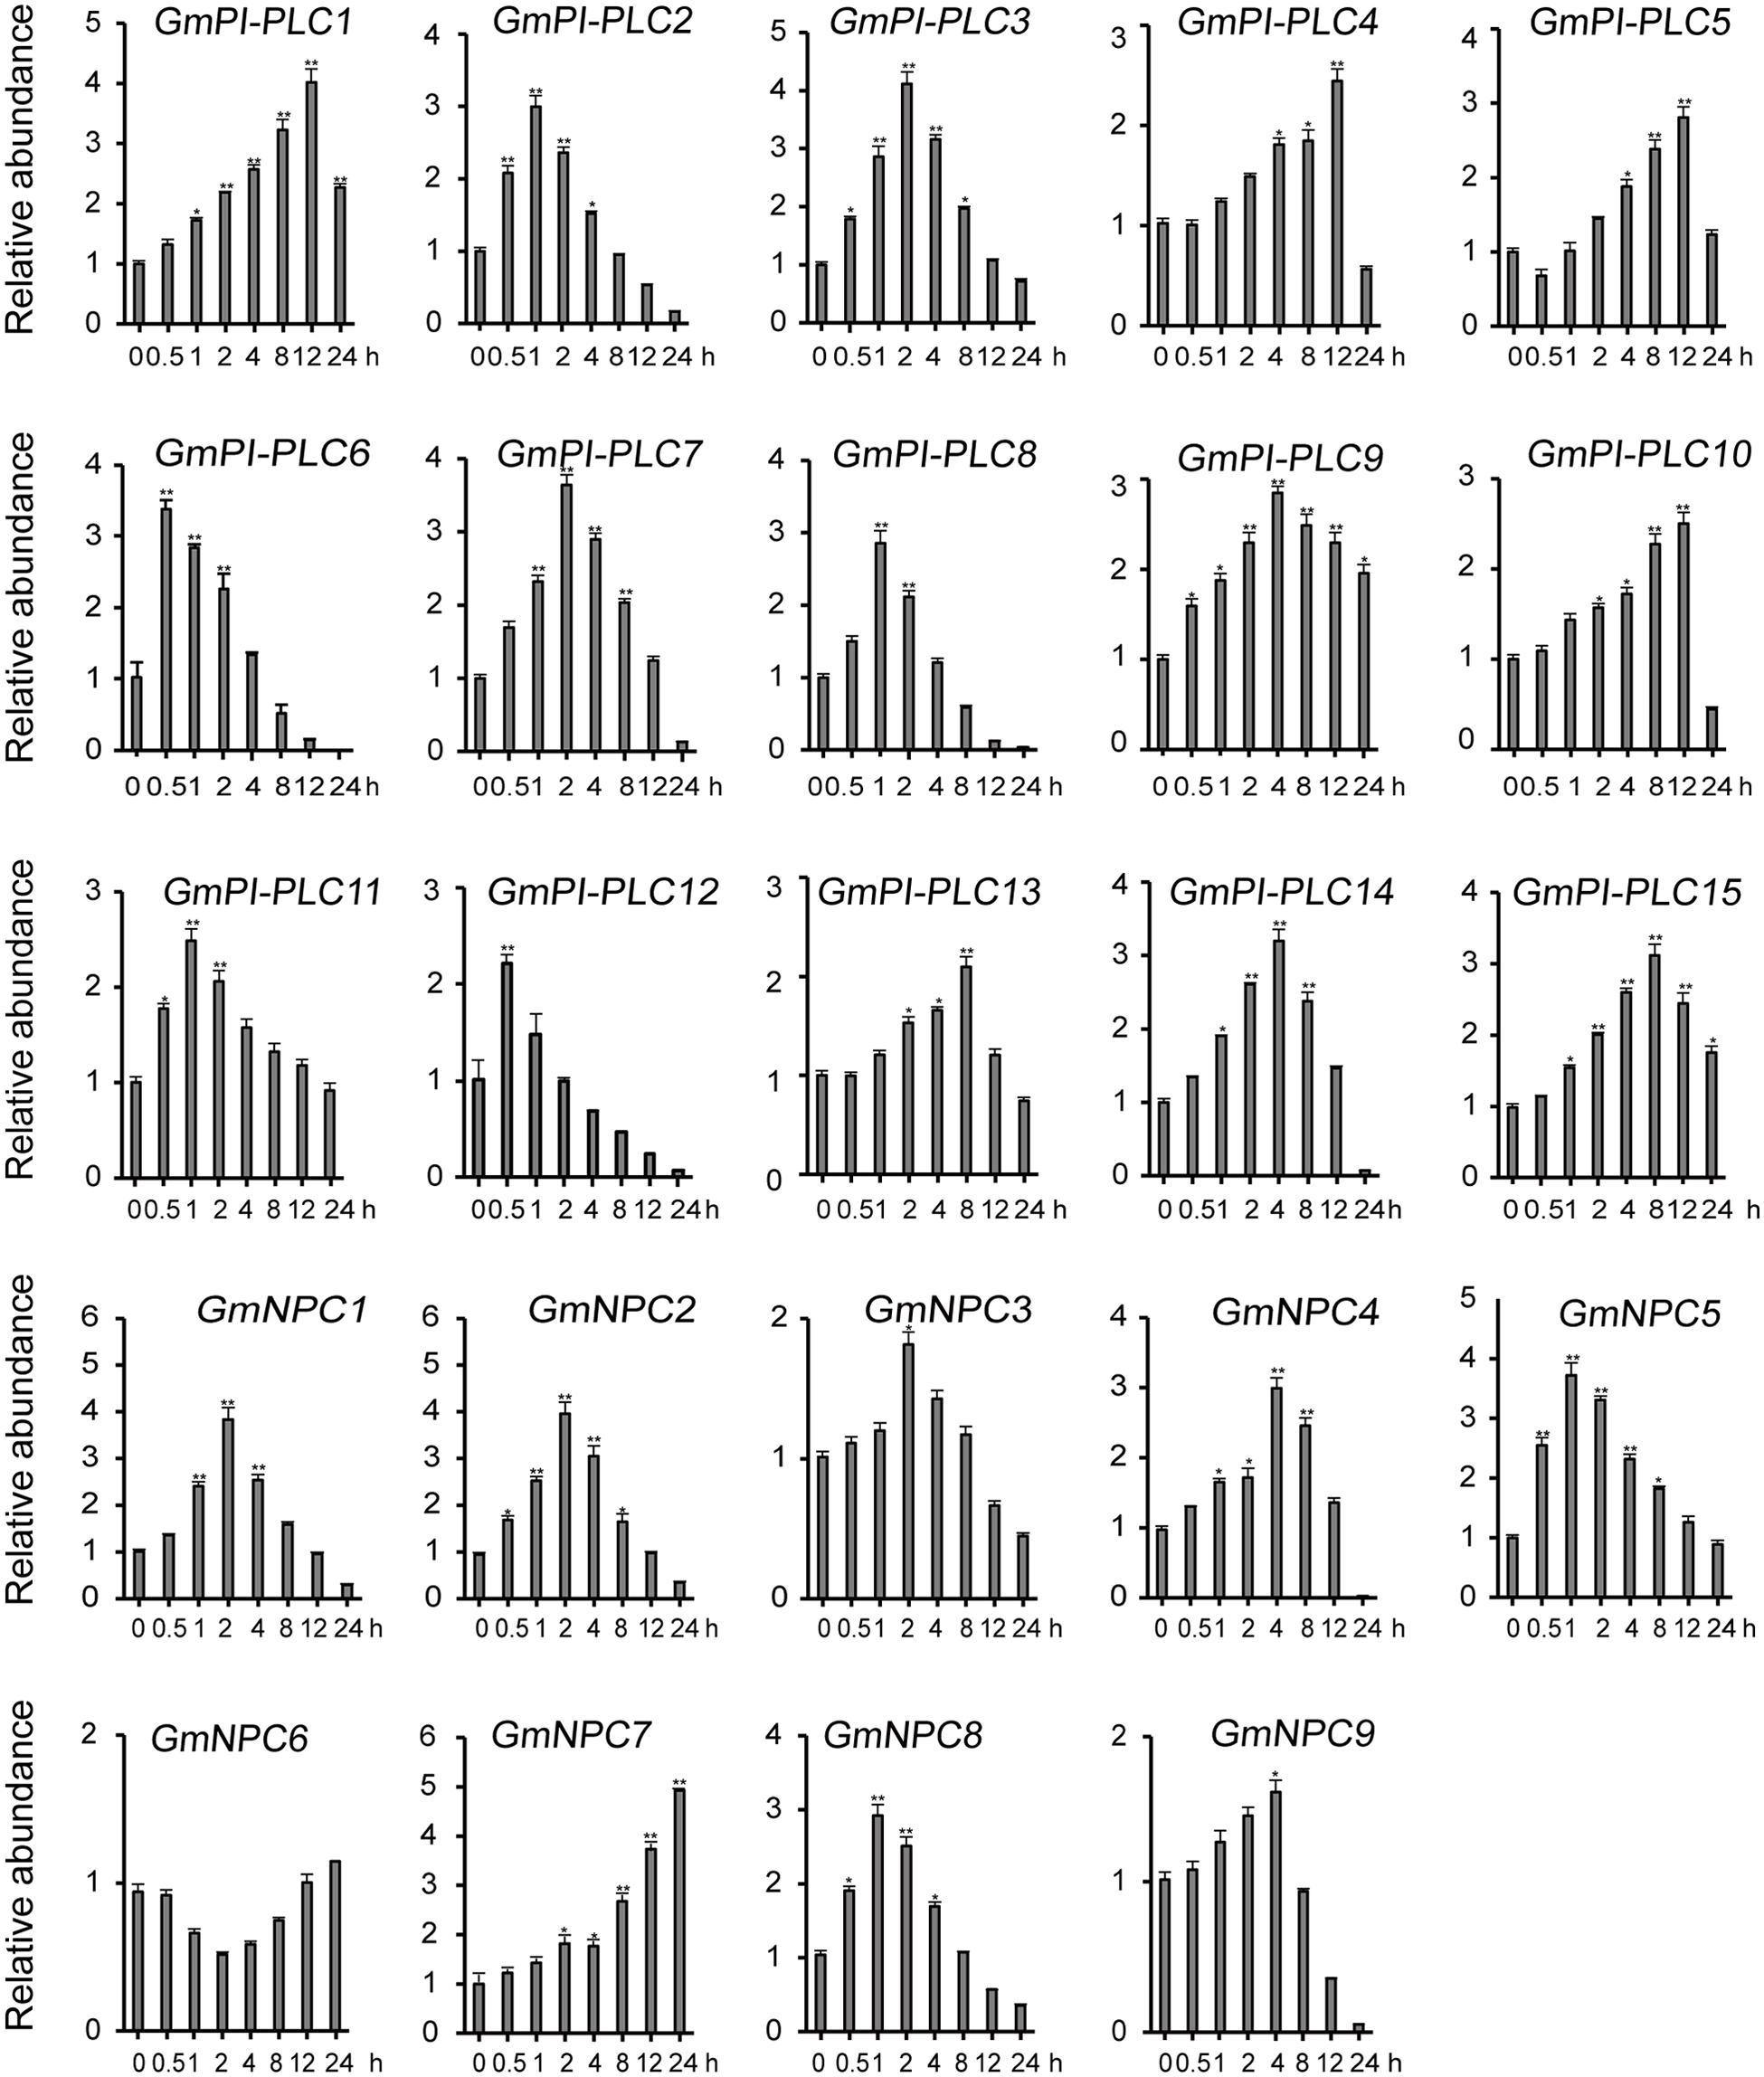
Figure 8. Expression patterns of all GmPLC genes in response to drought treatment obtained by qRT-PCR. The actin gene was used as an internal control. The data shown are means ± SD obtained from three biological replicates. ANOVA was used to determine significant differences (*P < 0.05, **P < 0.01).
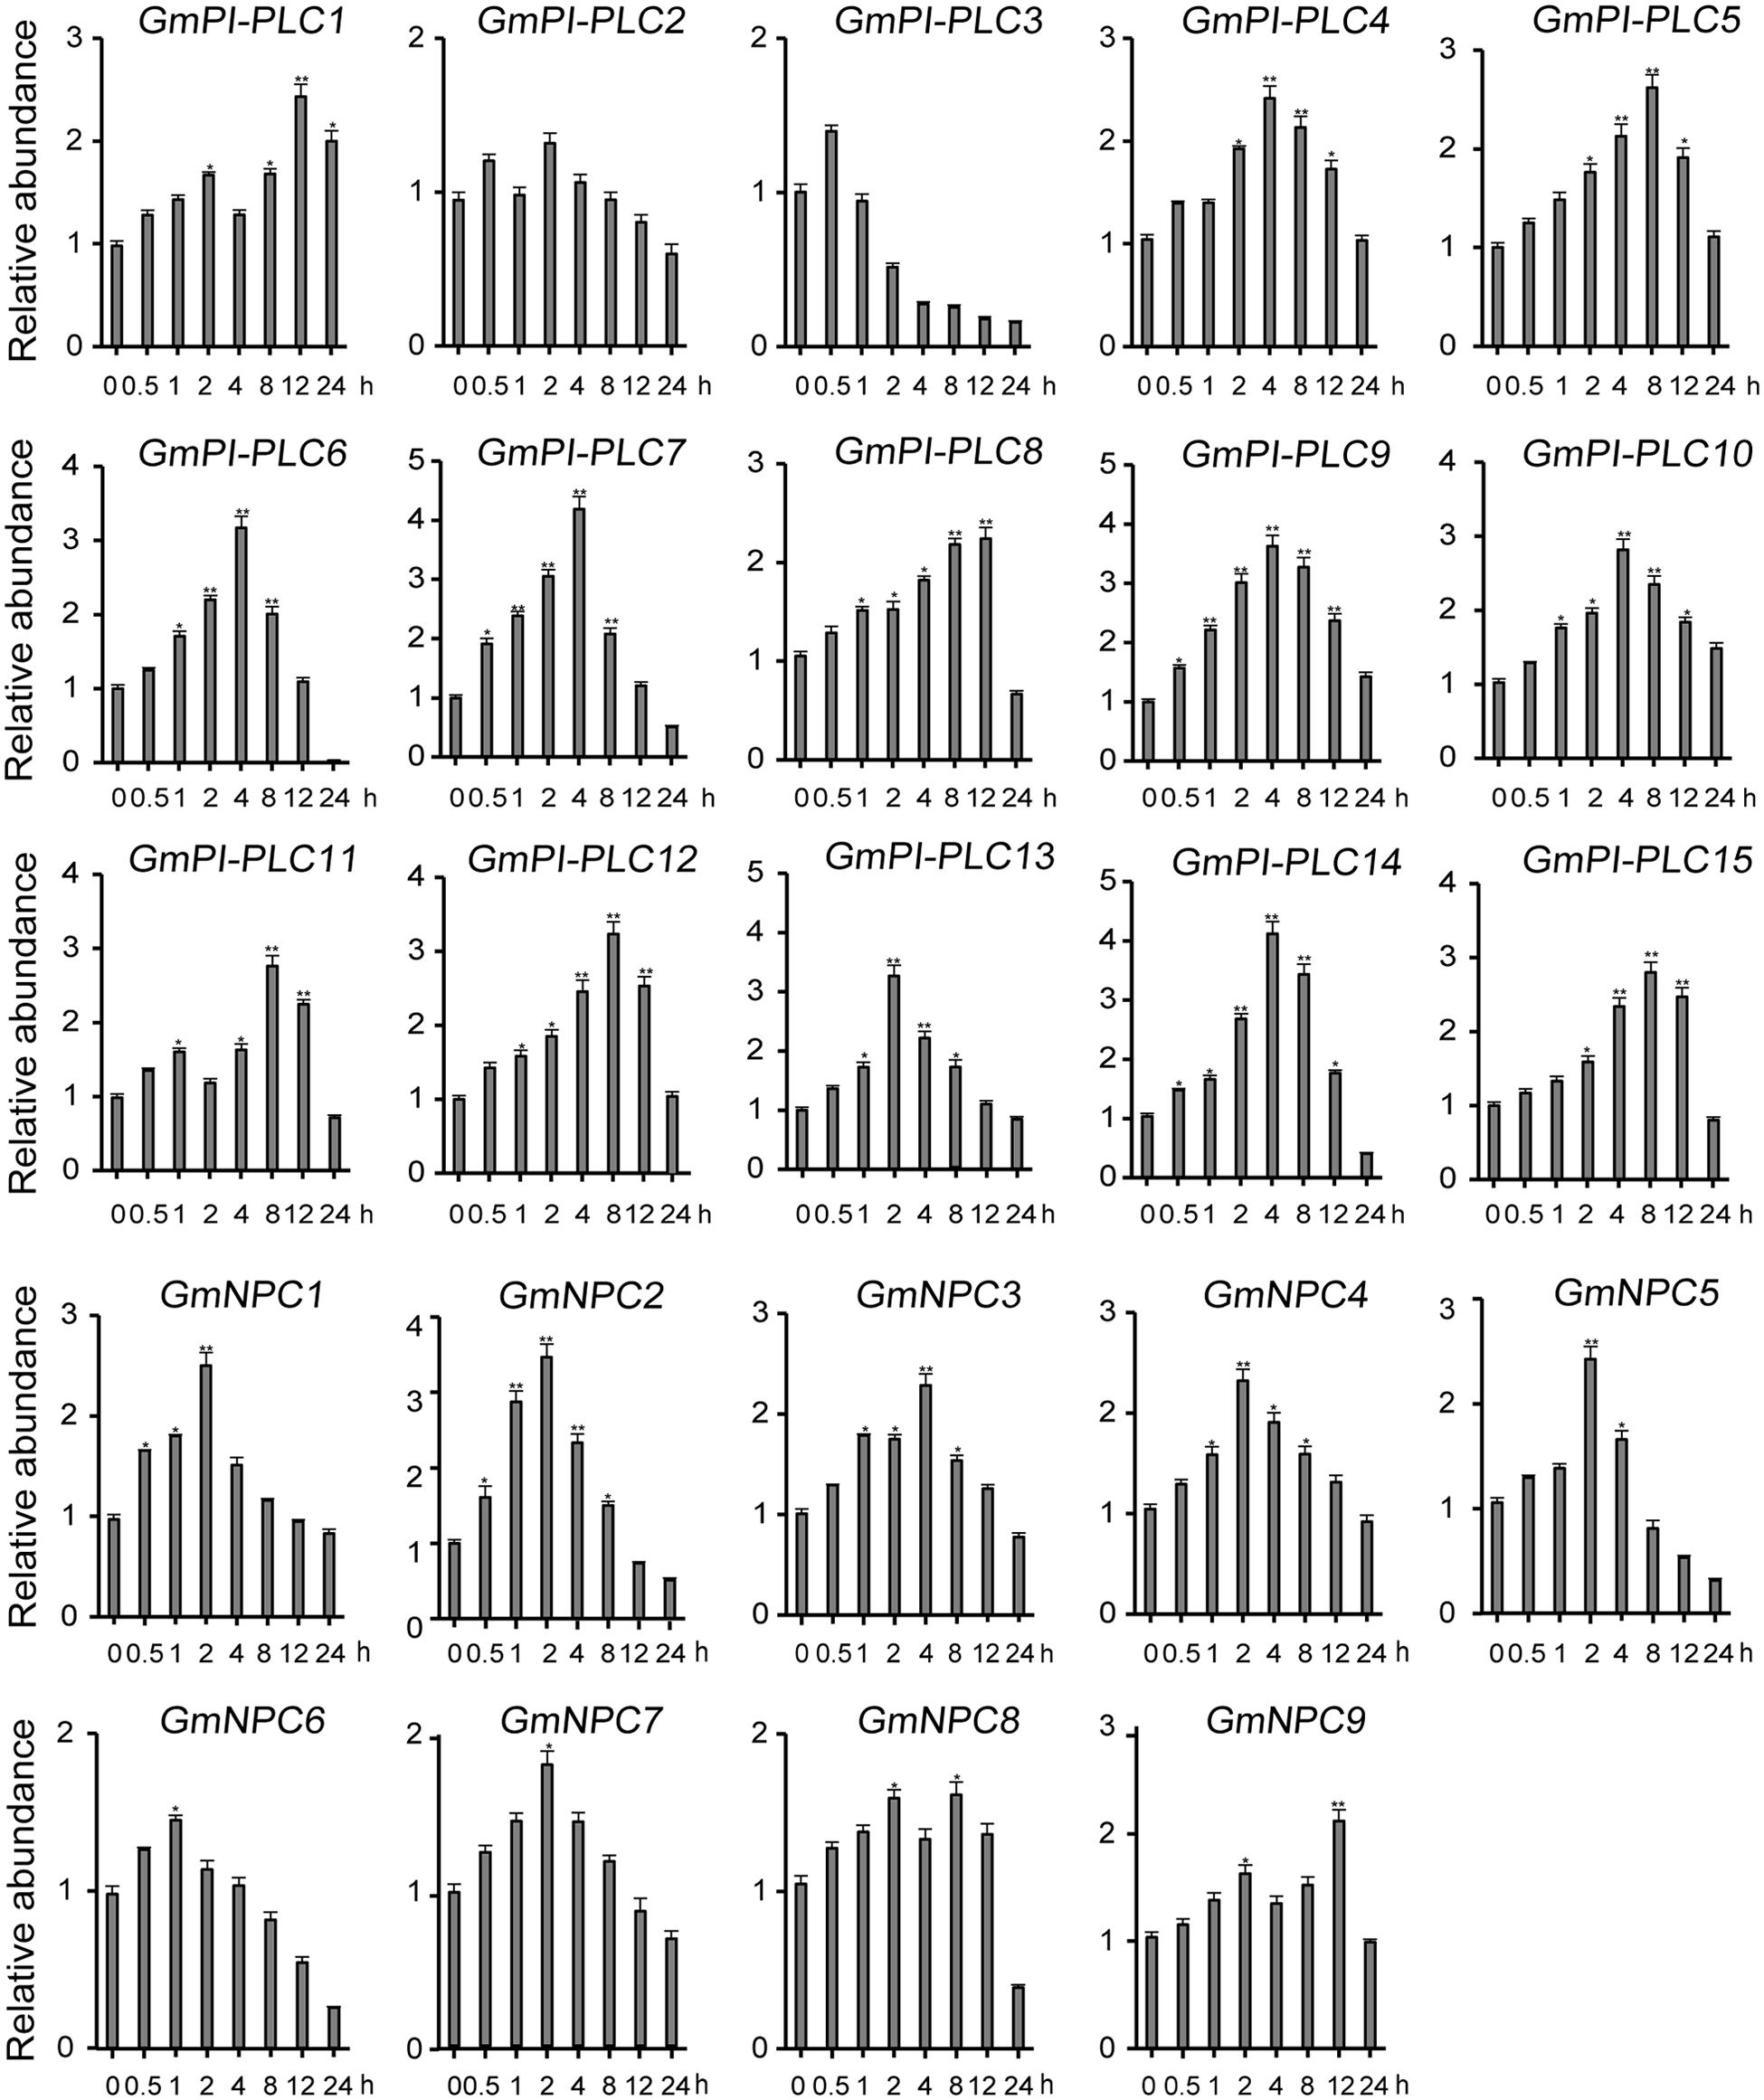
Figure 9. Expression patterns of all GmPLC genes in response to mannitol treatment obtained by qRT-PCR. The actin gene was used as an internal control. The data are means ± SD obtained from three biological replicates. ANOVA was used to determine significant differences (*P < 0.05, **P < 0.01).
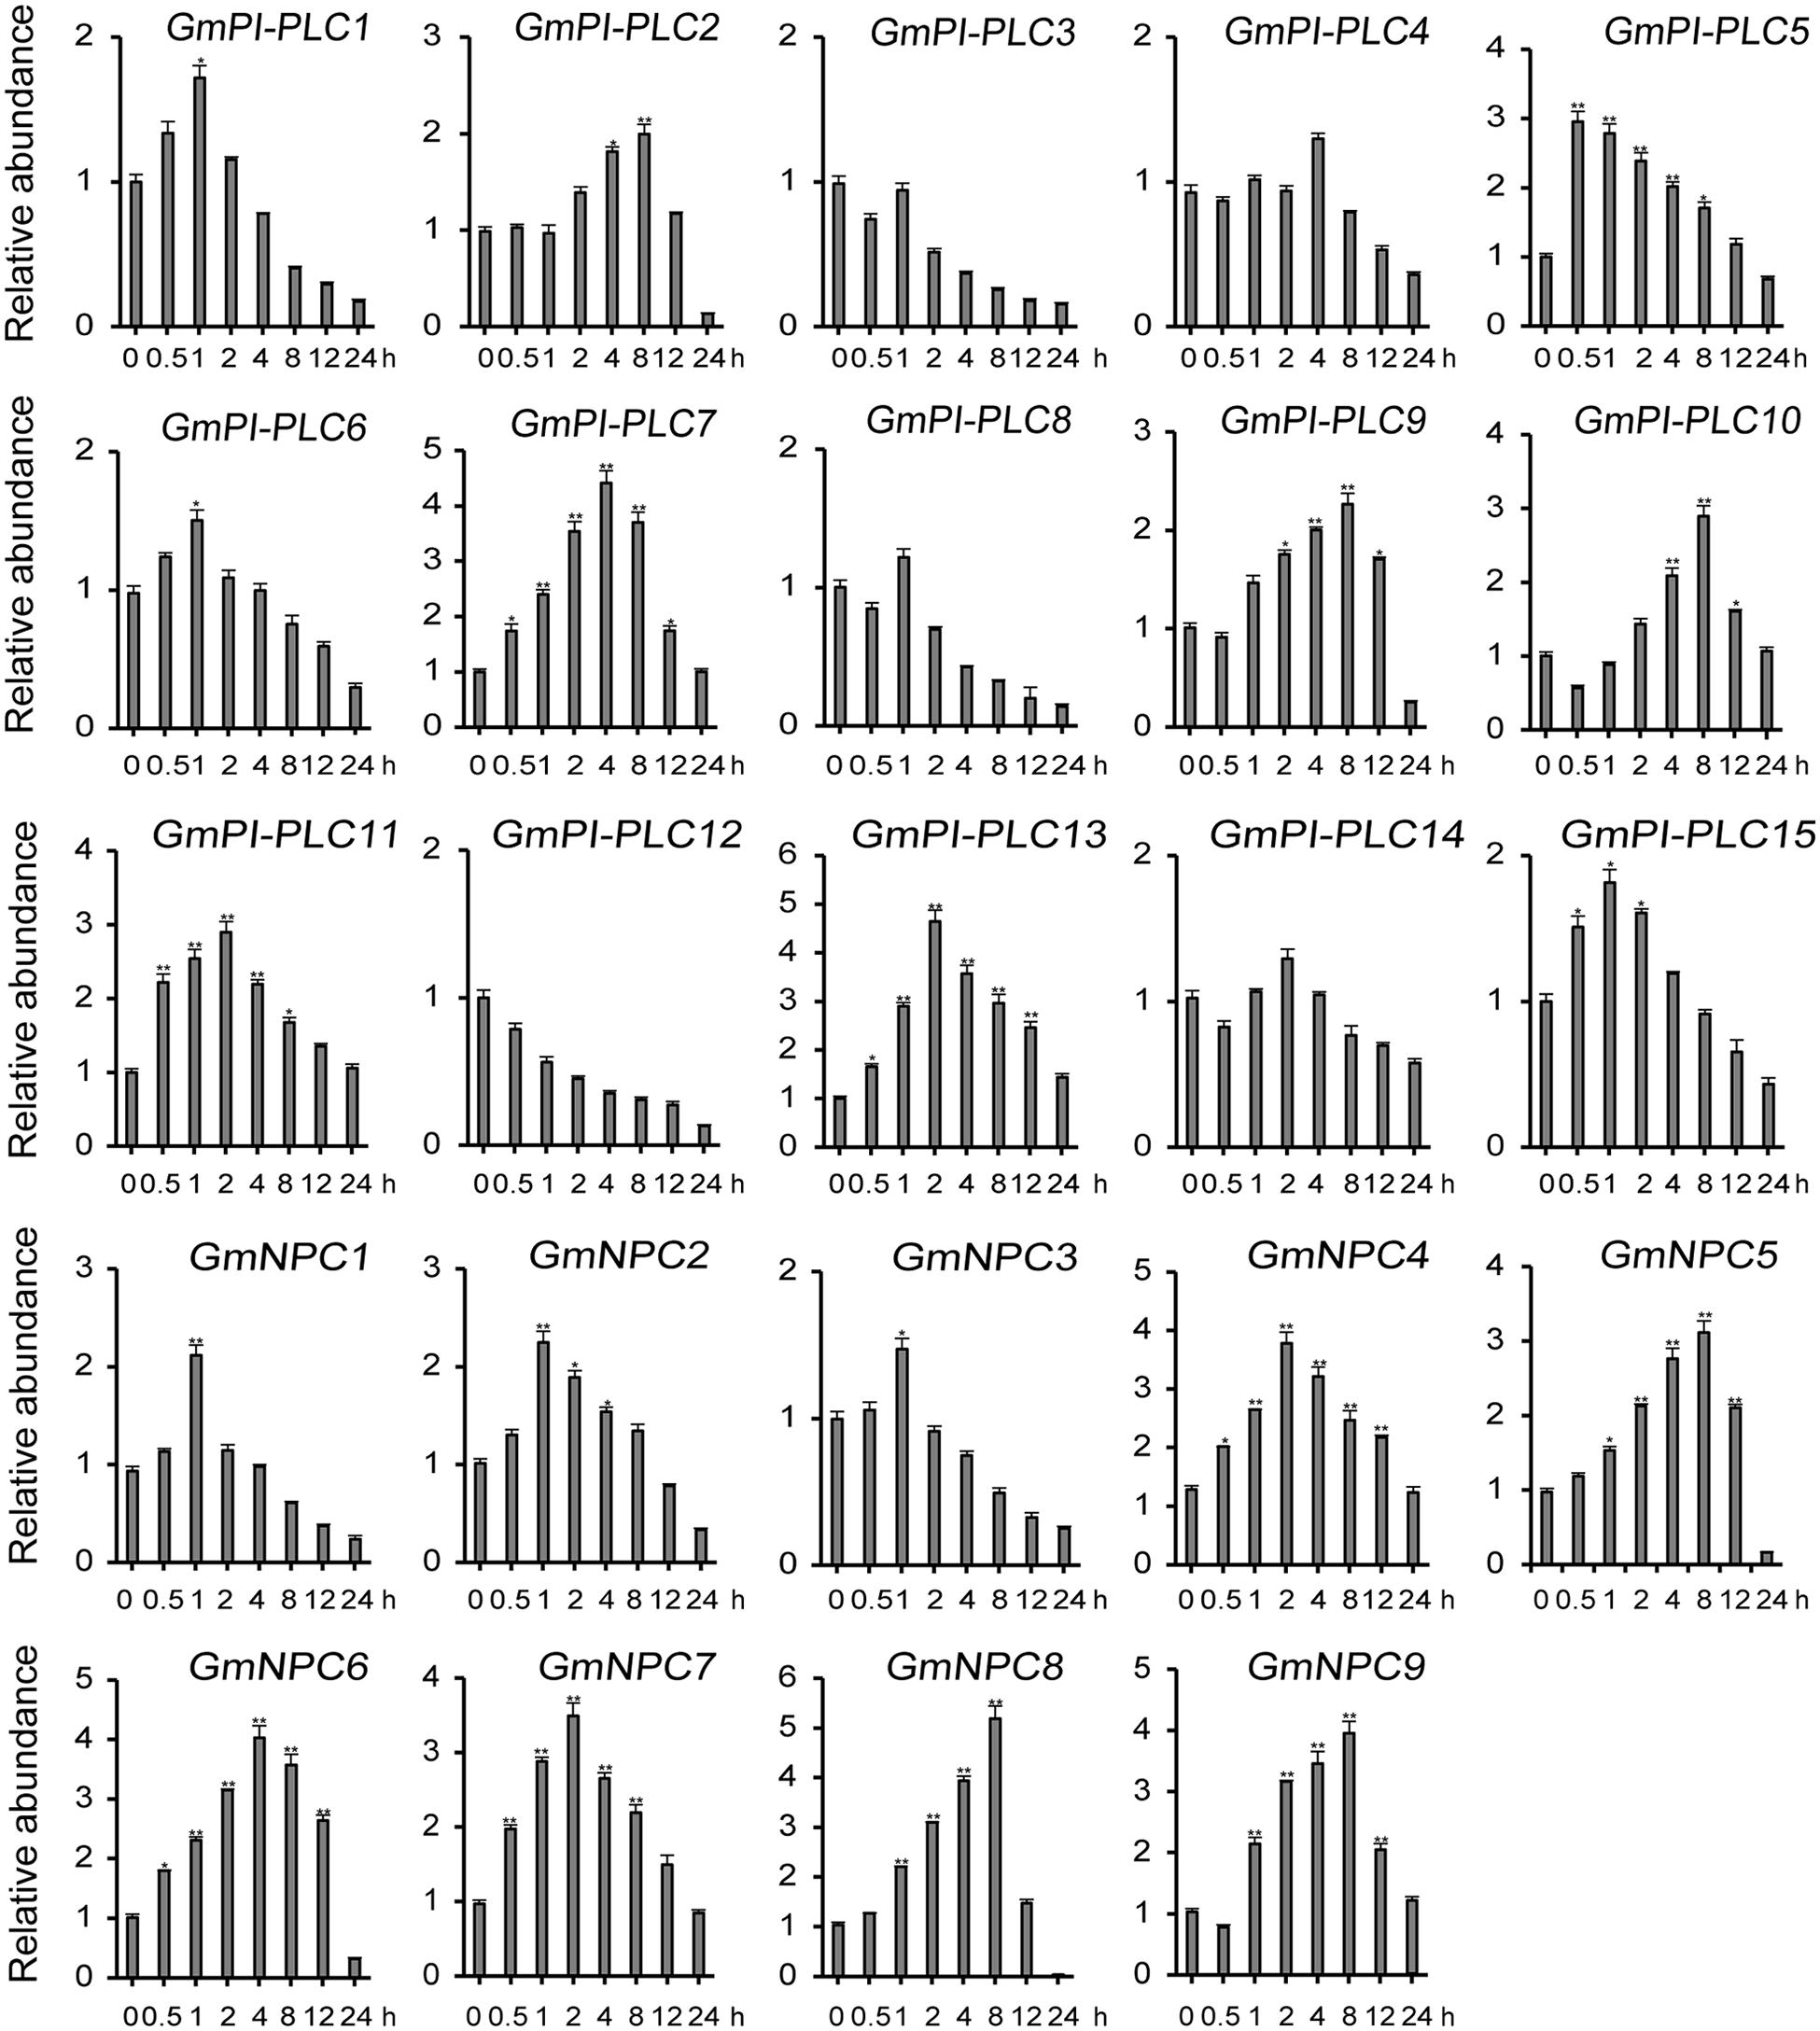
Figure 10. Expression patterns of all GmPLC genes in response to melatonin treatment obtained by qRT-PCR. The actin gene was used as an internal control. The data are means ± SD obtained from three biological replicates. ANOVA was used to determine significant differences (*P < 0.05, **P < 0.01).
GmPI-PLC7 Improved Drought Tolerance in Soybean Transformants
To understand how the GmPI-PLC7 gene affects the physiological changes of soybean under drought stress, the OE, EV and RNAi lines of soybean transformed by A. rhizogenes were examined. No significant differences were observed between OE, EV and RNAi lines under normal growth conditions. After drought treatment for 7 days, leaves of the RNAi lines were wilting; after 16 days of drought treatment, leaves of the EV and RNAi lines were severely dehydrated-looking (Figure 11A). The survival rates of the OE, EV and RNAi lines were 100.00, 77.33, and 33.30%, respectively (Supplementary Figure 2A). After 16 days of drought exposure, the stressed phenotypes (seedlings with wrinkled leaves) from each line were selected for DAB, NBT, and trypan blue staining, and the results showed that large amounts of reactive oxygen species (ROS) accumulated in EV and RNAi lines during drought stress compared with that of OE lines (Figures 11B–D). Additionally, H2O2, O2– and MDA contents were significantly higher in EV and RNAi lines under drought treatment than the respective contents in OE lines (Figures 11E,F,I). Higher levels of NOX activity and relative water contents were observed in RNAi lines (Figures 11G,K) than those in OE lines. Furthermore, under drought treatment, Pro, and chlorophyll contents were lower in EV and RNAi lines than those in OE lines (Figures 11H,J). These results indicated that GmPI-PLC7 decreased the damage caused by drought treatment and improved drought tolerance in transformed soybean seedlings.
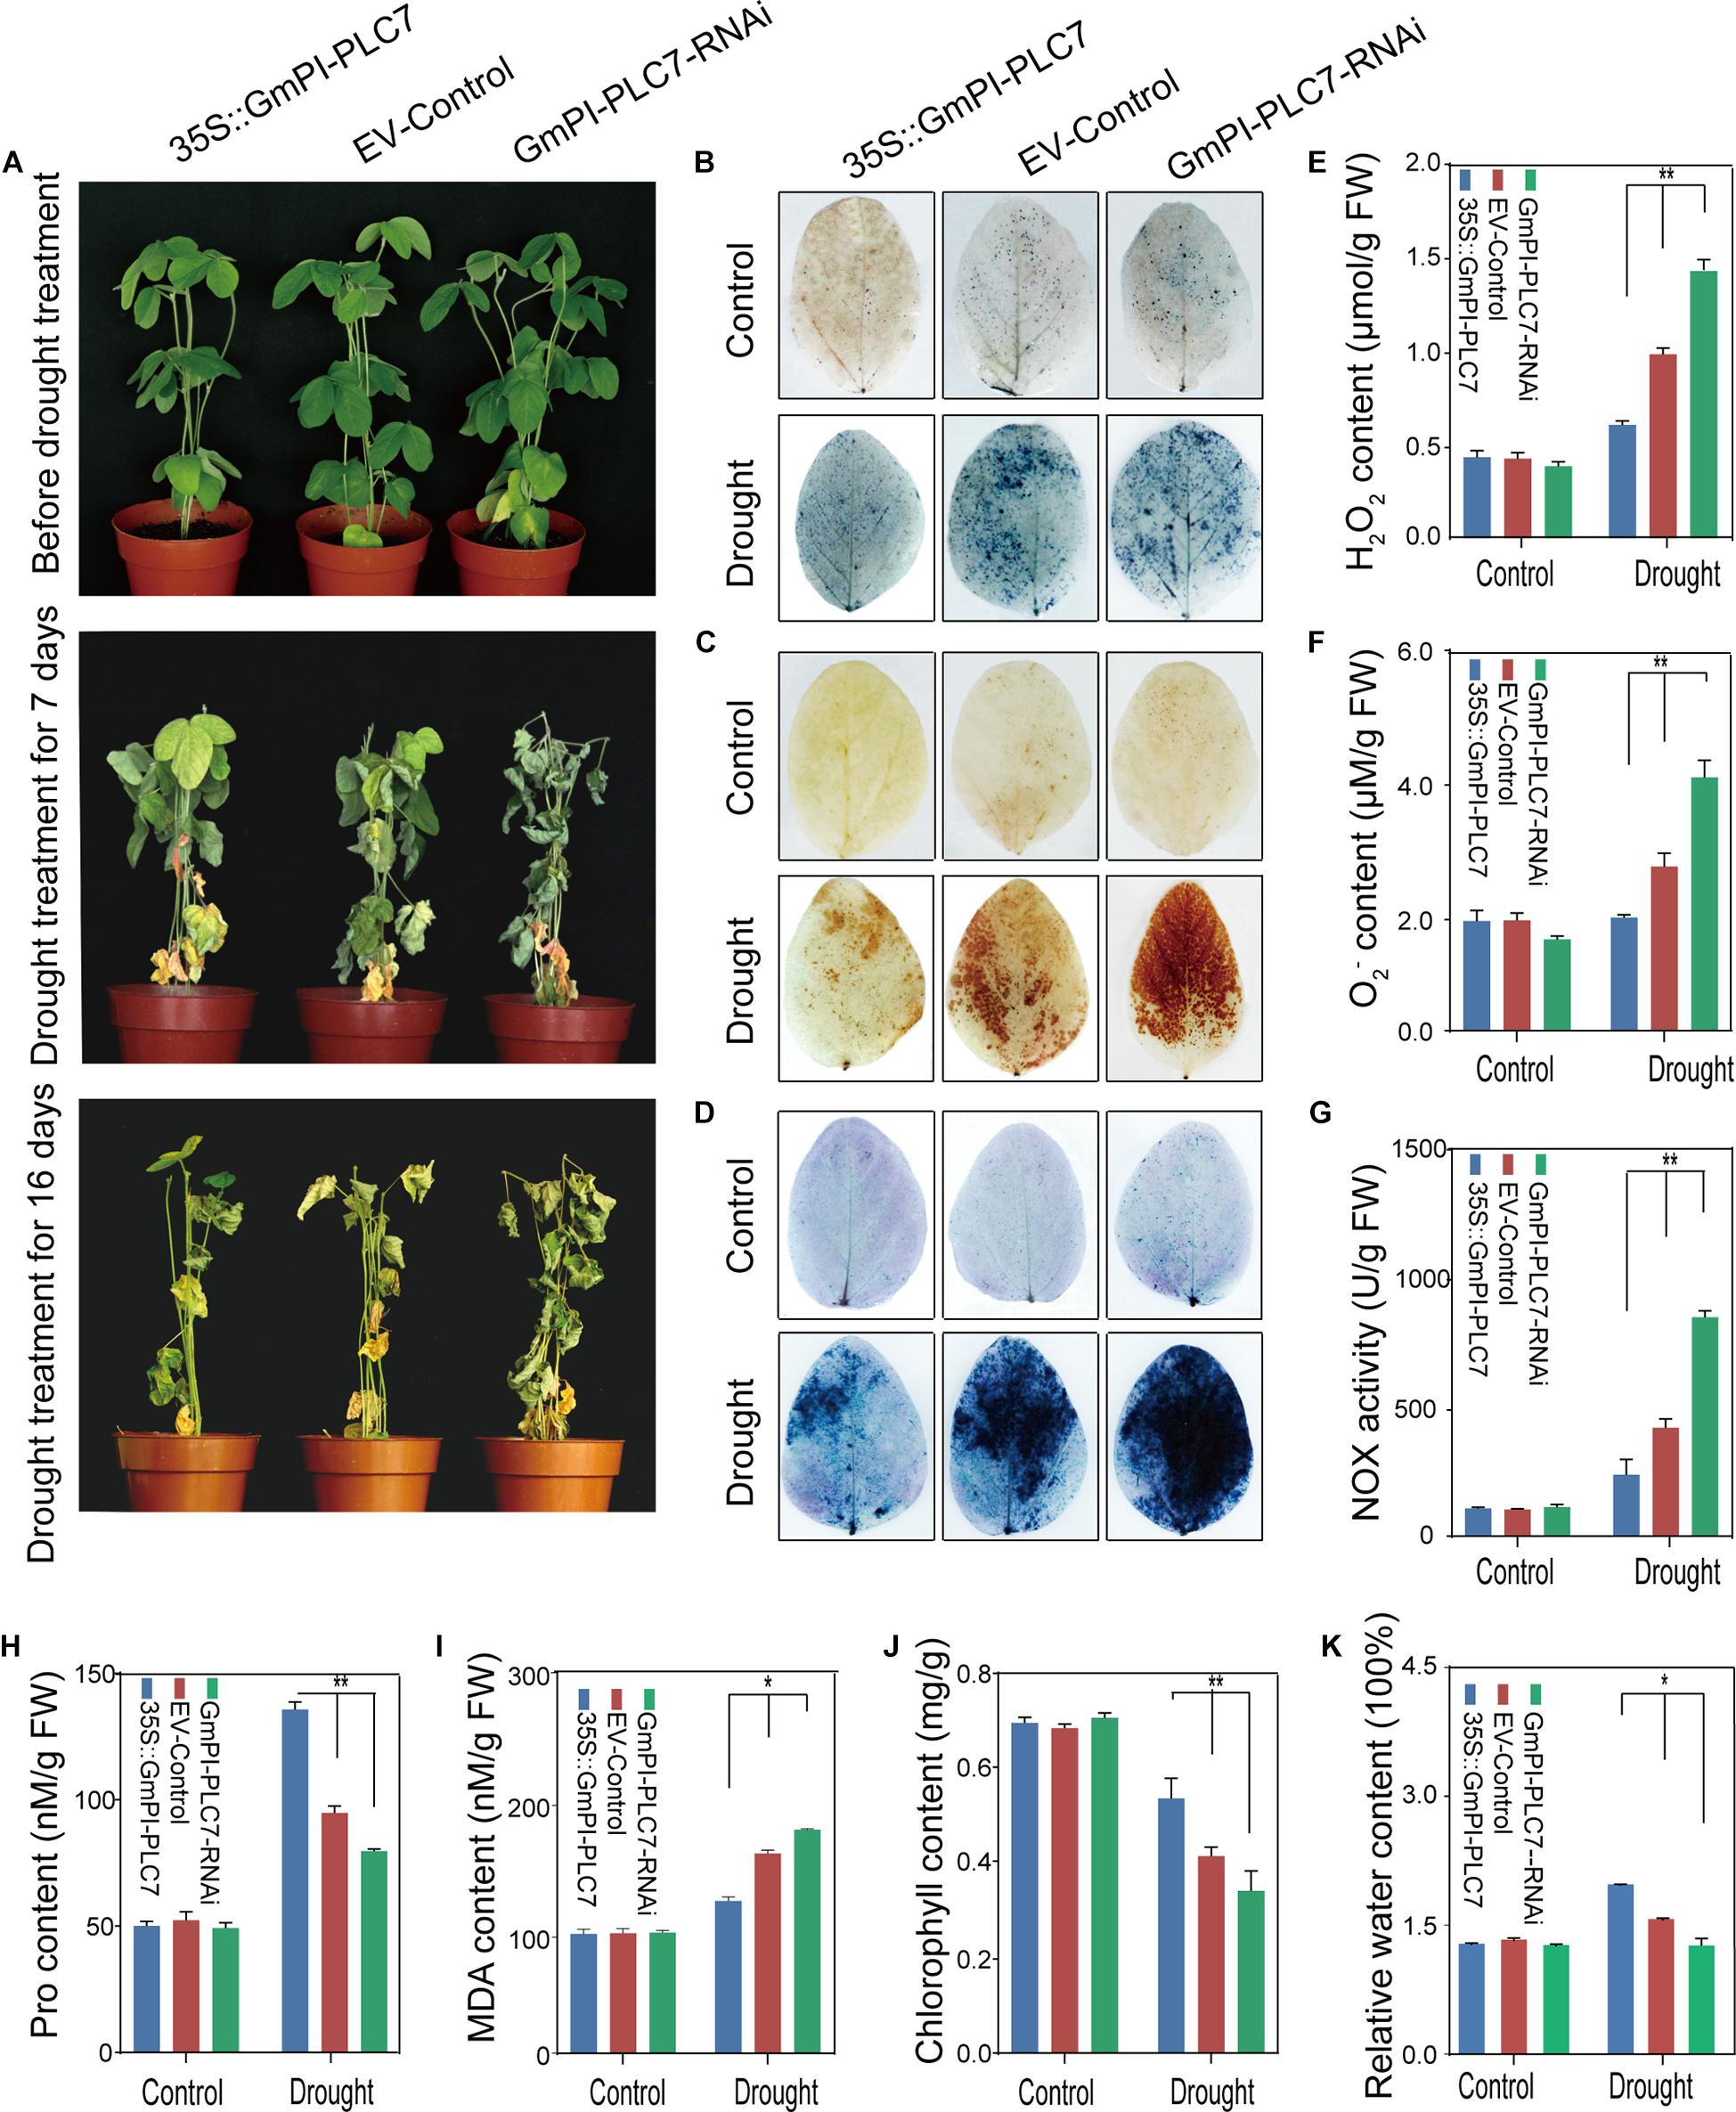
Figure 11. GmPI-PLC7 improves drought tolerance in transgenic soybean hairy roots. Images of salinity-resistant phenotypes of OE, EV and RNAi lines sampled over time while subjected to drought (A). NBT (B) and DAB (C) staining of the leaves of OE, EV and RNAi lines after drought or no-drought treatment for 7 days. The depth of color shows the concentrations of H2O2 and O2– in the leaves (B,C). The contents of H2O2 (E) and O2– (F) in the leaves of OE, EV and RNAi lines after drought or no-drought treatment for 16 days. Trypan blue staining of soybean plant leaves deprived of irrigation for a week (D); dead cells can be stained, while living cells cannot. The NOX (G), proline (H), MDA (I), chlorophyll (J), and relative water contents (K) detected in leaves of OE, EV, and RNAi lines subjected to a 250-mM NaCl treatment or the control condition for 7 days. The data are means ± SDs of three replicates. ANOVA was used to determine significant differences (*P < 0.05, **P < 0.01).
GmPI-PLC7 Improved Salt Tolerance in Soybean Transformants
The OE, EV, and RNAi lines were used to further determine the role of GmPI-PLC7 in stress response to salt treatment. No significant differences were observed between OE, EV and RNAi lines under normal growth conditions. Under the 250-mM NaCl treatment, the RNAi lines showed stressed phenotypes of wrinkled leaves after 7 days of salt treatment, and severely dehydrated leaves were observed in both EV and RNAi lines after 7 days of salt treatment (Figure 12A). The survival rates of the OE, EV, and RNAi lines were 100.00, 67.33, and 40%, respectively (Supplementary Figure 2C). After 7 days of stress treatment, each line was DAB-, NBT-, and trypan blue-stained to evaluate the accumulation of ROS. The results showed that greater amounts of ROS accumulated in EV and RNAi lines than compared with amounts accumulated in OE lines during the salt stress (Figures 12B–D). Additionally, the H2O2, O2– and MDA contents were significantly higher in EV and RNAi lines than in OE lines under salt stress (Figures 12E,F,I). Meanwhile, levels of NOX activity were higher in EV and RNAi lines (Figure 12G) than in OE lines. Moreover, the Pro, chlorophyll, and relative electrical conductivity levels were significantly lower in EV and RNAi lines than in OE lines (Figures 12H,J,K). Collectively, these results indicated that OE of GmPI-PLC7 lead to greater salt tolerance, whereas RNAi lines resulted in salt sensitivity, suggesting that GmPI-PLC7 plays a positive regulatory role in salt-stress response in soybean seedlings (Supplementary Figure 2B,D).
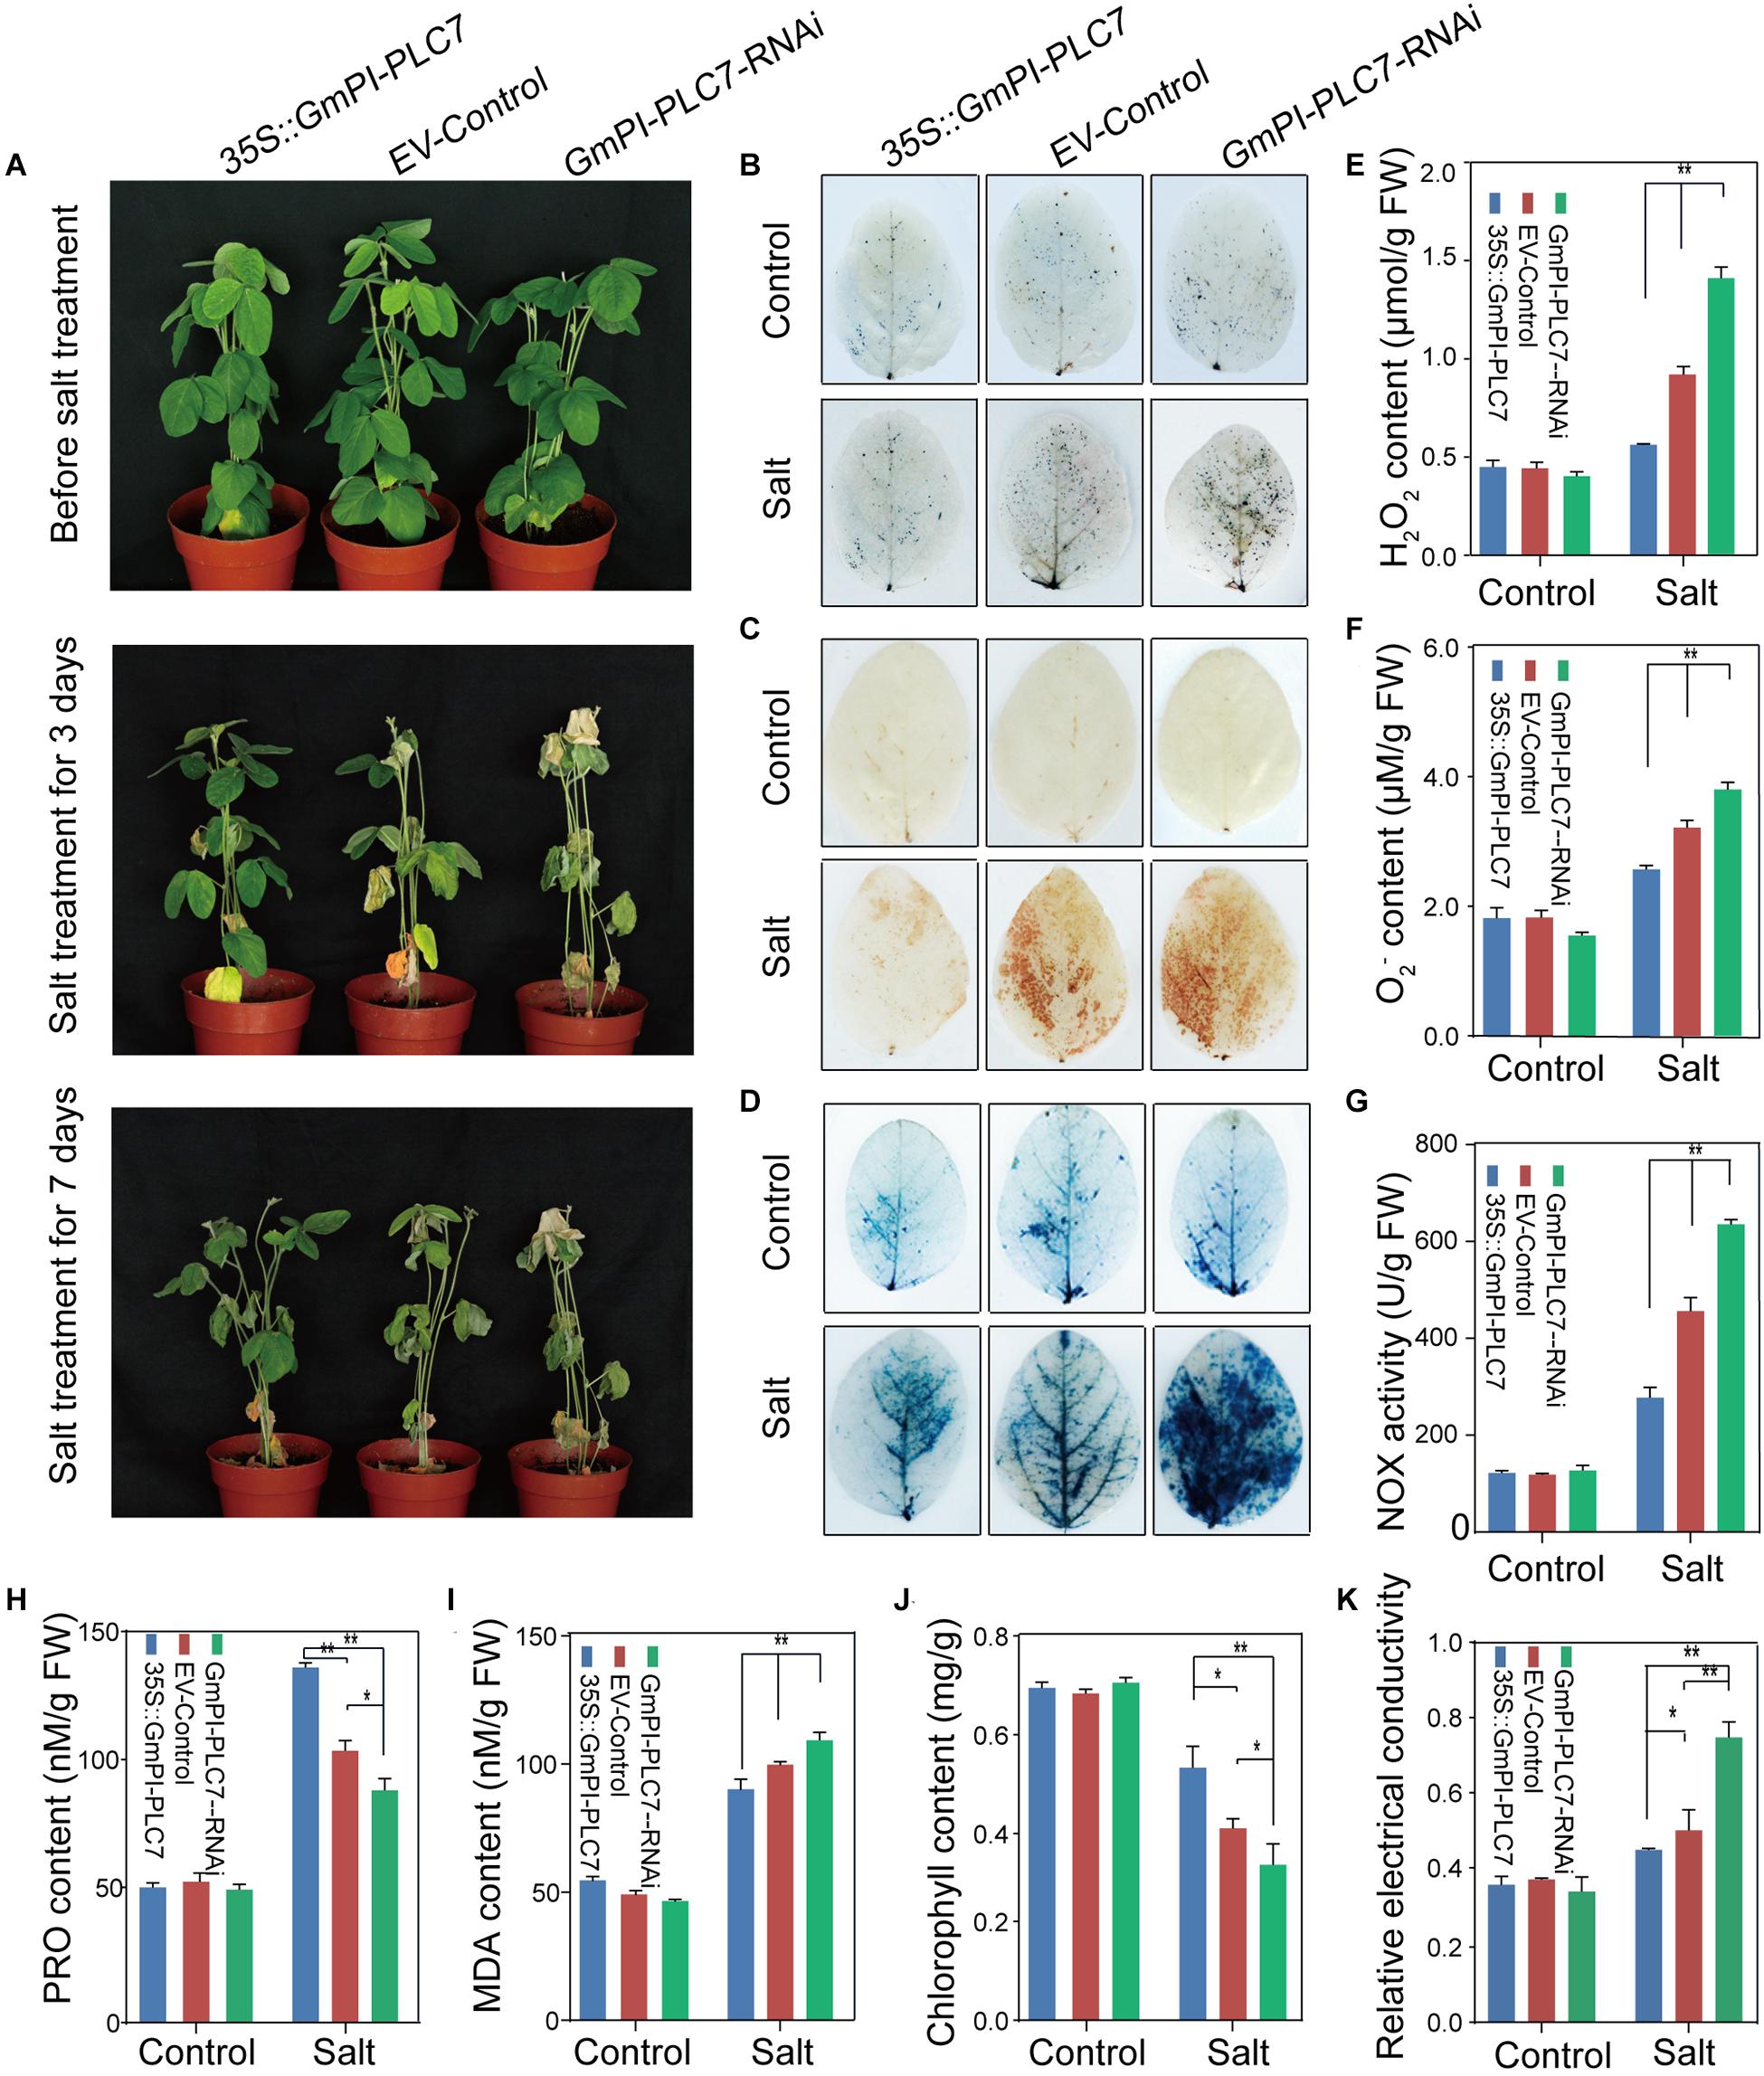
Figure 12. GmPI-PLC7 improves salt-stress tolerance in transgenic soybean hairy roots. Images of salinity-resistant phenotypes of OE, EV and RNAi lines exposed to a salt treatment over time (A). DAB (B) and NBT (C) staining of leaves of OE, EV and RNAi lines after the 250-mM NaCl or control treatment for 3 days. The depth of color shows the concentrations of H2O2 and O2– in the leaves (B,C). The contents of H2O2 (E) and O2– (F) in the leaves of OE, EV and RNAi lines after the 250-mM NaCl or control treatment for 3 days. Trypan blue staining of soybean plant leaves deprived of irrigation for a week (D); dead cells can be stained, while living cells cannot. The NOX (G), proline (H) and MDA (I), chlorophyll (J), and relative electrical conductivity (K) detected in leaves of OE, EV and RNAi lines exposed to the 250-mM NaCl or control treatment 3 days. The data are means ± SDs of three replicates. ANOVA was used to determine significant differences (*P < 0.05, **P < 0.01).
GmPI-PLC7 Activated Stress-Responsive Genes in Soybean
To elucidate the possible molecular mechanisms of GmPI-PLC7 in stress responses, the expression of drought- and salt-responsive marker genes GmMAPK15, GmZIP2, GmRLK15, GmCAT5, GmNHX1, GmNAC18, GmCAT2, GmRD29A, GmSOS1, GmMYB118, GmDREB2, and GmCRK28 were investigated in GmPI-PLC7-OE, EV-control and GmPI-PLC7-RNAi lines. Analysis of qRT-PCR data revealed that there were no significant differences in expression levels of all stress-responsive genes between the OE, EV and RNAi lines under normal growth conditions (Figures 13A–P). Under drought conditions, the expression levels of GmRLK15, GmCAT5, GmCAT2, GmMYB118, GmDREB2, and GmWRKY27 in OE lines were significantly higher than those in EV and RNAi lines (Figures 13A–G). And the transcriptional expression level of GmNAC18 was significantly greater in EV and RNAi lines than in OE lines. In addition, over-expressed GmPI-PLC7 can increase the expression levels of GmSOS1, GmRLK15, GmCAT5, GmDREB2, GmCRK28, and WRKY27 in seedlings exposed to salt stress, but the expression of GmNAC18 was significantly suppressed in the OE lines and markedly increased in the RNAi lines compared to that of the EV lines (Figures 1I–O). These results indicated that overexpression of GmPI-PLC7 may activate the expression of drought- or salt-responsive genes to meditate stress responses; however, the underlying molecular mechanism needs to be further explored (Supplementary Figure 3).
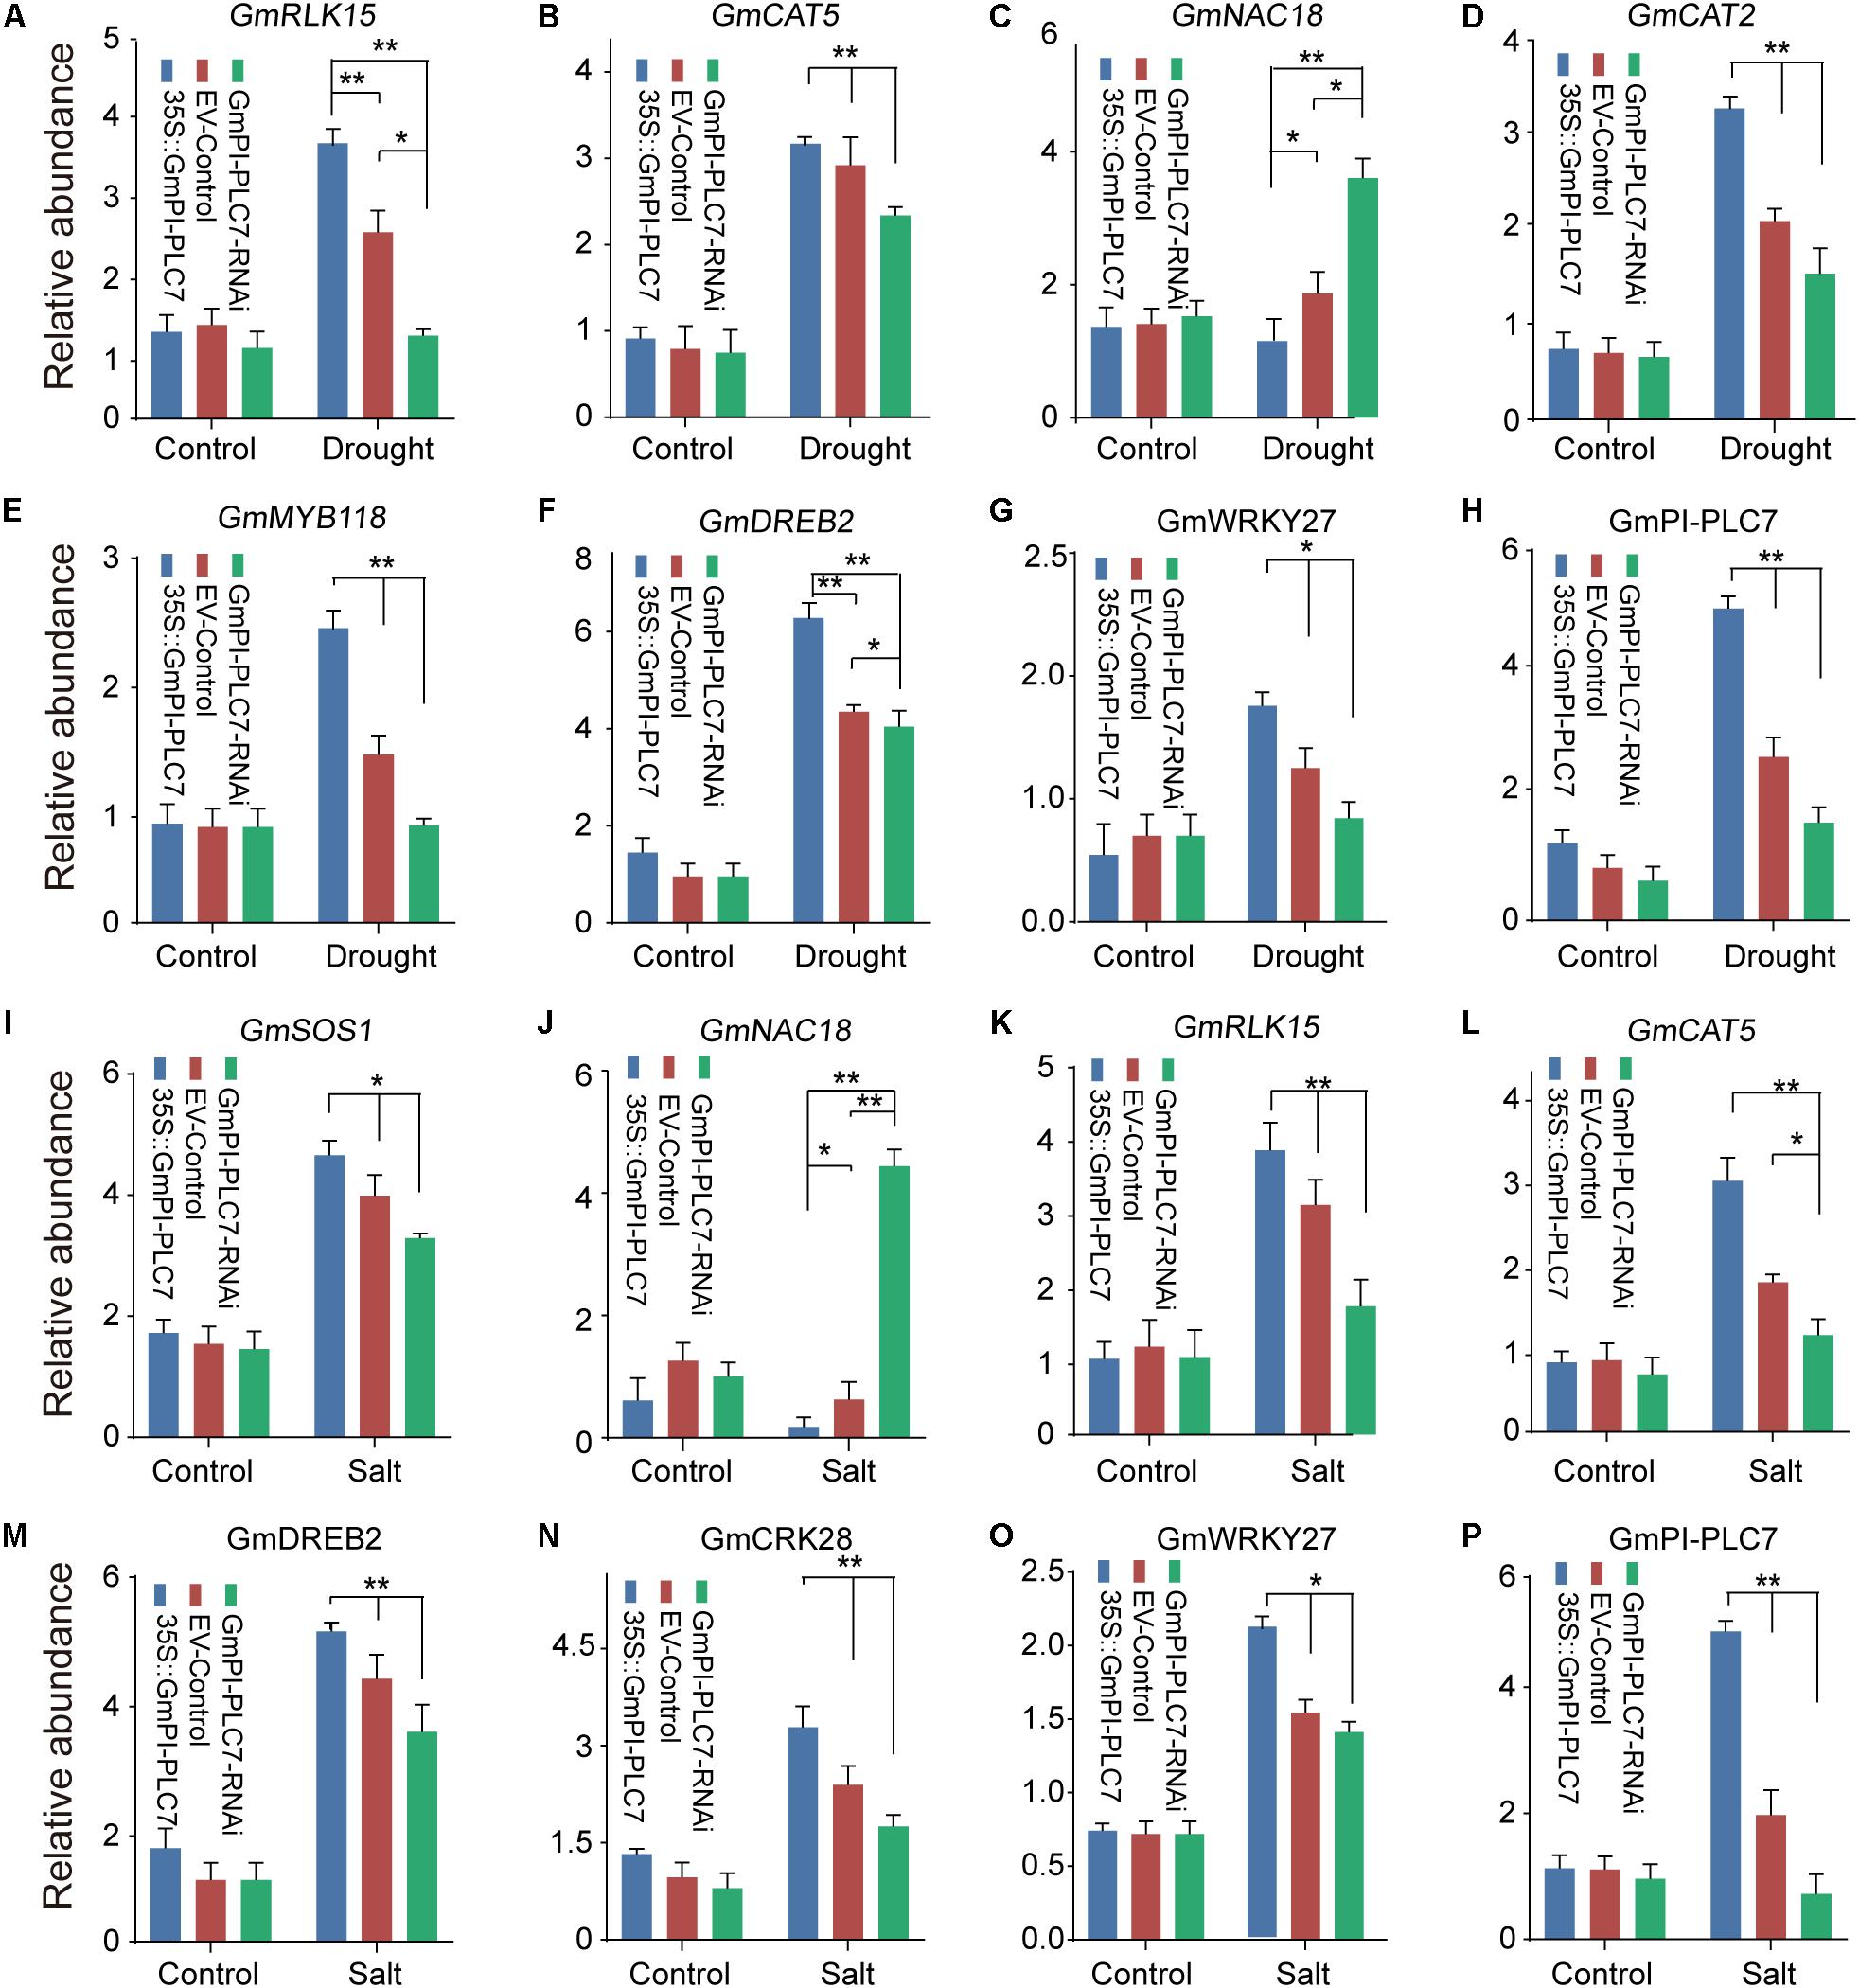
Figure 13. GmPI-PLC7 regulates stress-responsive gene expression in transgenic soybean plants. The expression levels of stress-related genes in the transgenic soybean plants under drought stress (A–G), respectively. The expression levels of stress-related genes in the transgenic soybean plants under salt stress (I–O), respectively. The expression levels of GmPI-PLC7 in the transgenic soybean plants under drought stress (H). The expression levels of GmPI-PLC7 in the transgenic soybean plants under salt stress (P). The data are means ± SDs of three replicates. ANOVA was used to determine significant differences (*P < 0.05, **P < 0.01).
Discussion
The PLC family of phospholipid hydrolases were first discovered in animals (Mayer et al., 1988). In recent years, PLCs have been extensively studied in various plants. This paper aimed to identify GmPLC members and revealed 24 PLC genes in soybean. GmPLC genes can be divided into two groups, PI-PLC and NPC, and PI-PLCs are reported as the major members of PLCs in plants (Kopka, 1998; Tasma et al., 2008; Nakamura and Sano, 2009). Our multiple-sequence analysis revealed that the characteristic PI-PLC-X and PI-PLC-Y domains and phospholipid-binding C2 domain were present in all GmPI-PLC members except GmPI-PLC11. Notably, an EF hand-like motif was found in five GmPI-PLC members (GmPI-PLC1, GmPI-PLC4, GmPI-PLC7, GmPI-PLC8, and GmPI-PLC13). Studies have shown that EF-hand motifs and the C2 domain may interact to facilitate membrane targeting and catalytic activity (Nomikos et al., 2015).
Intron gains and losses occur at low rates during the evolution of genomesand have significant impacts on structural and functional differentiation (Xu and Dunbrack, 2012). A previous study revealed that intron losses exceeded intron gains in rice and Arabidopsis at low rates (Roy and Penny, 2007). Structural analysis of GmPLCs revealed that all but one (GmPI-PLC1) of the PI-PLC members contained nine introns, and the intron-exon pattern was conserved in soybean. NPC members contained 2–4 introns in both soybean and Arabidopsis. Members of NPCs have been divided into two groups (I and II) based on the number of introns in Arabidopsis (Xu and Dunbrack, 2012); however, the two groups were not observed in GmNPCs. In brief, GmPLCs in the same clade have similar intron-exon combinations, which were similar to the findings of Arabidopsis and rice studies, suggesting that PLCs may perform similar functions across species. A limitation of this study is that only 24 genes were used in our analysis so the conclusions cannot fully elucidate the evolutionary characteristics of the introns. Therefore, there is still much room for improvement in determining the mechanisms of intron evolution in PLC.
The expression of genes usually reflects the potential functions of the genes. For example, the expression of the AtPI-PLC2 gene is involved in reproductive organ development (Li et al., 2015), and the expression of the AtPI-PLC3, AtPI-PLC9, and AtNPC1 genes are important for heat tolerance (Kang et al., 2014; Pejchar et al., 2015), whereas the AtNPC4 and AtNPC5 genes are essential for salt stress response (Kocourková et al., 2011; Peters et al., 2014). In rice, OsPI-PLC1 is associated with disease resistance and SIPLC4/6 have distinct functions in Cf-4-mediated disease resistance (Song and Goodman, 2002). These studies indicate that the expression of the large number of PLCs could be induced by hormones, chemicals, environmental stresses and pathogen infection.
The expression patterns of GmPLCs in different tissues in response to abiotic stress conditions have been studied in several species. Previous studies reported that different PLC genes were differentially expressed and played diverse physiological roles. For example, the expression levels of StPLC1 and StPLC2 in potato leaves increased significantly, while the level of StPLC3 remained unaltered (Kopka, 1998). GmPI-PLCs were clearly expressed in various tissues and significantly increased under various stresses (Figure 7), indicating that PI-PLCs may play important roles in plant growth and abiotic stress-response. Our results matched those observed in earlier studies where most GmPLCs exhibited only background levels of expression under normal abiotic conditions, while the same GmPLCs could be induced by a variety of abiotic stresses. For example, GmPI-PLC1, GmPI-PLC3, and GmNPC8 were only slightly expressed in normal conditions, while high expression levels were observed after drought treatment. In addition, the expression level of GmPI-PLC7 increased significantly due to the drought, mannitol and melatonin treatments (Figures 8–10).
Gene duplication is a major mechanism in expanding functional diversity, which facilitates plant adaptations to their diverse environments (Schmutz et al., 2010), and functionally different duplicated-genes are more likely to be preserved during evolution (Schlueter et al., 2007). In addition, tandemly duplicated genes can produce rapid differentiation in gene expression, while some duplicated genes tend to maintain the same expression patterns (Ganko et al., 2007). Our results showed that duplicated genes exhibited diverse expression patterns (Figures 8–10).
Previous studies showed that PLC’s involvement in plant development and ABA signaling, in Arabidopsis, AtPLC3 improved the drought tolerance by promoting root development, seed germination and stomatal opening (Zhang et al., 2018). In addition, ABA signaling occurring at the plasma membrane may be mediated by C2 domain proteins (Rodriguez et al., 2014). In this study, the C2 domain was identified in GmPI-PLCs, which showed that GmPI-PLCs may have participated in the regulation of the ABA signaling pathway in soybean. However, osmotic and temperature stresses can also induce various lipid signals (Hou et al., 2016). In the salt overly sensitive (SOS) pathway, the cytosolic Ca2+ signal was detected by a calcium-binding protein named EF-hand SOS3 in plants exposed to salt treatment (Xiong et al., 2002). In our study, the GmPI-PLC7 genes have an EF-hand domain, therefore we inferred that the PLC genes may improve soybean tolerance to salt stress by participating in the SOS signaling pathway (Xiong et al., 2002). In Arabidopsis, background expression levels of DREB2 genes were negatively regulated by PI-PLC (Ruelland et al., 2013). In our study, the analysis of cis-acting elements suggested that the PLC genes might be involved in responses to abiotic stresses (Supplementary Figure 4). The water loss measurements of detached leaves as ABA-related experimental data proved that GmPI-PLC7 improves the drought tolerance of soybeans (Figure 11K). It is worth noting that the expression of GmDREB2 were induced by both ABA-independent and ABA-dependent regulatory pathways (Chen et al., 2007). GmNAC was induced by dehydration and ABA, and regulated drought response in an ABA-dependent manner (Tran et al., 2009). The transcript levels of 13 known abiotic stress-responsive genes (Related to drought, salt, and ABA) were analyzed in our transgenic and control soybean plants under the drought- and salt-stress treatment (Figure 13). Among them, transcription of GmRLK15, GmCAT5, GmNAC18, GmCAT2, GmDREB2, and GmWRKY27 were significantly higher than that in the control lines under drought stress, while transcription of GmRLK15, GmCAT5, GmNAC18, GmSOS1, GmDREB2, GmCRK28, and WRKY27 were clearly higher than that in the control lines under salt stress. These results altogether showed that GmPI-PLC7 participated in soybean response to abiotic stresses.
In summary, GmPI-PLC7 may enhance drought and salt tolerance in soybean through the ABA signaling pathway and the SOS-related calcium-signaling pathway. Fully elucidating its role in these pathways still requires further research.
Conclusion
In our study, 15 GmPI-PLC genes and 9 GmNPC genes were identified in soybean. GmPI-PLC7 enhanced the drought and salt tolerance of soybeans most likely through the ABA signaling pathway and the SOS-related Ca2+-signaling pathway, respectively.
Data Availability Statement
The original contributions presented in the study are included in the article/Supplementary Material, further inquiries can be directed to the corresponding author/s.
Author Contributions
Z-SX coordinated the project, and conceived and designed experiments. Z-FC performed experiments and wrote the first draft. YD and J-NR conducted the bioinformatic work and performed experiments. JC, Y-BZ, and MC provided analytical tools and managed reagents. G-ZS, X-HZ, and Y-ZM contributed with valuable discussions. All authors have read and approved the final manuscript.
Funding
This research was financially supported by the National Natural Science Foundation of China (31871624) and Fundamental Research Funds for Central Non-Profit of Institute of Crop Sciences, Chinese Academy of Agricultural Sciences (Y2020PT12 and S2020ZC02).
Conflict of Interest
The authors declare that the research was conducted in the absence of any commercial or financial relationships that could be construed as a potential conflict of interest.
Acknowledgments
We are grateful to Drs. Lijuan Qiu and Shi Sun of the Institute of Crop Science, Chinese Academy of Agricultural Sciences for kindly providing soybean seeds.
Supplementary Material
The Supplementary Material for this article can be found online at: https://www.frontiersin.org/articles/10.3389/fpls.2021.631470/full#supplementary-material
Supplementary Figure 1 | Phylogenetic analyses of PLC proteins from Arabidopsis, rice, and soybean. Each clade is marked by a separate color.
Supplementary Figure 2 | Measures of stress-related physiological indicators.
Supplementary Figure 3 | GmPI-PLC7 regulates stress-responsive gene expression in transgenic soybean plants.
Supplementary Figure 4 | Putative cis-element in a 2-kb 5′ flanking region upstream from the start codon. Different cis-elements are indicated by colored symbols.
Supplementary Table 1 | Phospholipase C genes in soybean. Detailed genomic information include Phytozome locus, chromosome, protein length, genomic locus (chromosomal location), ±stand, isoelectric point, molecular weight (kDa), and number of introns within ORFs of the PLC proteins.
Supplementary Table 2 | Primers and sequences used in this study.
Supplementary Table 3 | The IDs of PLC genes from Arabidopsis and rice.
Supplementary Table 4 | The Expressions of PLC genes from soybean.
Supplementary Table 5 | Downstream genes primers and sequences used in this study.
Abbreviations
PLC, phospholipase C; PI-PLC, phosphatidylinositol-specific phospholipase C; NPC, phosphatidylcholine-hydrolyzing phospholipase C; DAB 3, 3-diaminobenzidine; NBT, nitro blue tetrazolium; qRT-PCR, quantitative Real-time polymerase chain reaction.
References
Amarjeet, S., Poonam, K., Amita, P., Tyagi, A. K., Sopory, S. K., Sanjay, K., et al. (2013). Comprehensive genomic analysis and expression profiling of phospholipase C gene family during abiotic stresses and development in rice. PLoS One 8:e62494. doi: 10.1371/journal.pone.0062494
Axelrod, H. L., Das, D., Abdubek, P., Astakhova, T., Bakolitsa, C., Carlton, D., et al. (2010). Structures of three members of Pfam PF02663 (FmdE) implicated in microbial methanogenesis reveal a conserved α+β core domain and an auxiliary C-terminal treble-clef zinc finger. Acta Crystallogr. Sect. F Struct. Biol. Cryst. Commun. 66(Pt 10), 1335–1346. doi: 10.1107/s1744309110020166
Berridge, M. J. (1993). Inositol triphosphate and calcium signalling. Nature 361, 315–325. doi: 10.1038/361315a0
Chen, M., Wang, Q. Y., Cheng, X. G., Xu, Z. S., Li, L. C., Ye, X. G., et al. (2007). GmDREB2, a soybean DRE-binding transcription factor, conferred drought and high-salt tolerance in transgenic plants. Biochem. Biophys. Res. Commun. 353, 299–305. doi: 10.1016/j.bbrc.2006.12.027
Das, S., Hussain, A., Bock, C., Keller, W. A., and Georges, F. (2005). Cloning of Brassica napus phospholipase C2 (BnPLC2), phosphatidylinositol 3-kinase (BnVPS34) and phosphatidylinositol synthase1 (BnPtdIns S1)–comparative analysis of the effect of abiotic stresses on the expression of phosphatidylinositol signal transduction-related genes in B. napus. Planta 220, 777–784. doi: 10.1007/s00425-004-1389-0
Dowd, P. E., Coursol, S., Skirpan, A. L., and Gilroy, K. S. (2006). Petunia phospholipase C1 is involved in pollen tube growth. Plant Cell 18, 1438–1453. doi: 10.1105/tpc.106.041582
Drøbak, B. K. (1992). The plant phosphoinositide system. Biochem. J. 288, 697–712. doi: 10.1042/bj2880697
Du, Y. T., Zhao, M. J., Wang, C. T., Gao, Y., Wang, Y. X., Liu, Y. W., et al. (2018). Identification and characterization of GmMYB118 responses to drought and salt stress. BMC Plant Biol. 18:320.
Einspahr, K. J., Peeler, T. C., and Thompson, G. A. (1989). Phosphatidylinositol 4,5-bisphosphate phospholipase C and PHosphomonoesterase in Dunaliella salina membranes. Plant Physiol. 90, 1115–1120. doi: 10.1104/pp.90.3.1115
Finn, R. D., Clements, J., and Eddy, S. R. (2011). HMMER web server: interactive sequence similarity searching. Nucleic Acids Res. 39, W29–W37.
Ganko, E. W., Meyers, B. C., and Vision, T. J. (2007). Divergence in expression between duplicated genes in Arabidopsis. Mol. Biol. Evol. 24, 2298–2309. doi: 10.1093/molbev/msm158
Goodstein, D. M., Shu, S., Russell, H., Rochak, N., Hayes, R. D., Joni, F., et al. (2012). Phytozome: a comparative platform for green plant genomics. Nucleic Acids Res. 40, D1178–D1186.
Hirayama, T., Ohto, C., Mizoguchi, T., and Shinozaki, K. (1995). A gene encoding a phosphatidylinositol-specific phospholipase C is induced by dehydration and salt stress in Arabidopsis thaliana. Proc. Natl. Acad. Sci. USA 92, 3903–3907. doi: 10.1073/pnas.92.9.3903
Hong, Y., Zhao, J., Guo, L., Kim, S. C., Deng, X., Wang, G., et al. (2016). Plant phospholipases D and C and their diverse functions in stress responses. Prog. Lipid Res. 62, 55–74. doi: 10.1016/j.plipres.2016.01.002
Hou, Q., Ufer, G., and Bartels, D. (2016). Lipid signalling in plant responses to abiotic stress. Plant Cell Environ. 39, 1029–1048. doi: 10.1111/pce.12666
Hu, B., Jin, J., Guo, A. Y., Zhang, H., Luo, J., and Gao, G. (2015). GSDS 2.0: an upgraded gene feature visualization server. Bioinformatics 31, 1296–1297. doi: 10.1093/bioinformatics/btu817
Hunt, L., Otterhag, L., Lee, J. C., Lasheen, T., Hunt, J., Seki, M., et al. (2004). Gene-specific expression and calcium activation of Arabidopsis thaliana phospholipase C isoforms. New Phytol. 162, 643–654.
Jessica, A. S., Jer, Y. L., Shannon, D. S., Iryna, F., and Vasylenko, S. (2004). Gene-specific expression and calcium activation of Arabidopsis thaliana phospholipase C isoforms. New Phytol. 162, 643–654.
Kalachova, T., Puga-Freitas, R., Kravets, V., Soubigou-Taconnat, L., Repellin, A., Balzergue, S., et al. (2016). The inhibition of basal phosphoinositide-dependent phospholipase C activity in Arabidopsis suspension cells by abscisic or salicylic acid acts as a signalling hub accounting for an important overlap in transcriptome remodelling induced by these hormones. Environ. Exp. Bot. 123, 37–49. doi: 10.1016/j.envexpbot.2015.11.003
Kang, G., Yu-Liang, L., Bing, L., Ren-Gang, Z., Da-Ye, S., and Shu-Zhi, Z. (2014). Arabidopsis thaliana phosphoinositide-specific phospholipase C isoform 3 (AtPLC3) and AtPLC9 have an additive effect on thermotolerance. Plant Cell Physiol. 55, 1873–1883. doi: 10.1093/pcp/pcu116
Kereszt, A., Li, D., Indrasumunar, A., Nguyen, C. D., Nontachaiyapoom, S., Kinkema, M., et al. (2007). Agrobacterium rhizogenes-mediated transformation of soybean to study root biology. Nat. Protoc. 2, 948–952. doi: 10.1038/nprot.2007.141
Kocourková, D., Krková, Z., Pejchar, P., Veselková, T., Valentová, O., Wimalasekera, R., et al. (2011). The phosphatidylcholine-hydrolysing phospholipase C NPC4 plays a role in response of Arabidopsis roots to salt stress. J. Exp. Bot. 62, 3753–3763. doi: 10.1093/jxb/err039
Kopka, J. (1998). Molecular and enzymatic characterization of three phosphoinositide-specific phospholipase c isoforms from potato. Plant Physiol. 116, 239–250. doi: 10.1104/pp.116.1.239
Letunic, I., Doerks, T., and Bork, P. (2012). SMART 7: recent updates to the protein domain annotation resource. Nucleic Acids Res. 40, D302–D305.
Li, L., He, Y., Wang, Y., Zhao, S., and Chen, X. (2015). Arabidopsis PLC2 is involved in auxin-modulated reproductive development. Plant J. 84, 504–515. doi: 10.1111/tpj.13016
Li, L., Wang, F., Yan, P., Jing, W., Zhang, C., Kudla, J., et al. (2017). A phosphoinositide-specific phospholipase C pathway elicits stress-induced Ca2+ signals and confers salt tolerance to rice. New Phytol. 214, 1172–1187. doi: 10.1111/nph.14426
Liu, Q., Kasuga, M., Sakuma, Y., Abe, H., Miura, S., Yamaguchi-Shinozaki, K., et al. (1998). Two transcription factors, DREB1 and DREB2, with an EREBP/AP2 DNA binding domain separate two cellular signal transduction pathways in drought- and low-temperature-responsive gene expression, respectively, in Arabidopsis. Plant Cell 10, 1391–1406. doi: 10.2307/3870648
Luo, Q., Yu, B., and Liu, Y. (2005). Differential sensitivity to chloride and sodium ions in seedlings of Glycine max and G. soja under NaCl stress. J. Plant Physiol. 162, 1003–1012. doi: 10.1016/j.jplph.2004.11.008
Mayer, B. J., Hamaguchi, M., and Hanafusa, H. (1988). A novel viral oncogene with structural similarity to phospholipase C. Nature 332, 272–275. doi: 10.1038/332272a0
Mcmurray, W. C., and Irvine, R. F. (1988). Phosphatidylinositol 4,5-bisphosphate phosphodiesterase in higher plants. Biochem. J. 249, 877–881. doi: 10.1042/bj2490877
Meijer, H. J., and Munnik, T. (2003). Phospholipid-based signaling in plants. Annu. Rev. Plant Biol. 54, 265–306.
Nakamura, K., and Sano, H. (2009). A plasma-membrane linker for the phosphoinositide-specific phospholipase C in tobacco plants. Plant Signal. Behav. 4, 26–29. doi: 10.4161/psb.4.1.7222
Nakamura, Y., and Ngo, A. H. (2020). Non-specific phospholipase C (NPC): an emerging class of phospholipase C in plant growth and development. J. Plant Res. 133, 489–497. doi: 10.1007/s10265-020-01199-8
Nakamura, Y., Awai, K., Masuda, T., Yoshioka, Y., Takamiya, K., and Ohta, H. (2005). A novel phosphatidylcholine-hydrolyzing phospholipase C induced by phosphate starvation in Arabidopsis. J. Biol. Chem. 280, 7469–7476. doi: 10.1074/jbc.m408799200
Nomikos, M. (2015). Novel signalling mechanism and clinical applications of sperm-specific PLCζ. Biochem. Soc. Trans. 43, 371–376. doi: 10.1042/bst20140291
Nomikos, M., Sanders, J. R., Parthimos, D., Buntwal, L., Calver, B. L., Stamatiadis, P., et al. (2015). Essential role of the EF-hand domain in targeting sperm phospholipase czeta to membrane phosphatidylinositol 4,5-bisphosphate (PIP2). J. Biol. Chem. 290, 29519–29530. doi: 10.1074/jbc.m115.658443
Pejchar, P. E., Pejchar, P., Potocký, M., Krčková, Z., Brouzdová, J., Daněk, M., et al. (2015). Non-specific phospholipase C4 mediates response to aluminum toxicity in Arabidopsis thaliana. Front. Plant Sci. 6:66.
Peters, C., Kim, S. C., Devaiah, S., Li, M., and Wang, X. (2014). Non-specific phospholipase C5 and diacylglycerol promote lateral root development under mild salt stress in Arabidopsis. Plant Cell Environ. 37, 2002–2013. doi: 10.1111/pce.12334
Peters, C., Li, M., Narasimhan, R., Roth, M., Welti, R., and Wang, X. (2010). Nonspecific phospholipase C NPC4 promotes responses to abscisic acid and tolerance to hyperosmotic stress in Arabidopsis. Plant Cell 22, 2642–2659. doi: 10.1105/tpc.109.071720
Pical, M. R. (2002). Inositol phospholipid metabolism in arabidopsis. characterized and putative isoforms of inositol phospholipid kinase and phosphoinositide-specific phospholipase C. Plant Physiol. 130, 22–46. doi: 10.1104/pp.004770
Pokotylo, I., Pejchar, P., Potocký, M., Kocourková, D., and Martinec, J. (2013). The plant non-specific phospholipase C gene family. novel competitors in lipid signalling. Prog. Lipid Res. 52, 62–79. doi: 10.1016/j.plipres.2012.09.001
Rodriguez, L., Gonzalez-Guzman, M., Diaz, M., Rodrigues, A., Izquierdo-Garcia, A. C., and Peirats-Llobet, M. (2014). C2-domain abscisic acid-related proteins mediate the interaction of PYR/PYL/RCAR abscisic acid receptors with the plasma membrane and regulate abscisic acid sensitivity in Arabidopsis. Plant Cell 26, 4802–4820. doi: 10.1105/tpc.114.129973
Rombauts, S., Dehais, P., Montagu, V., and Rouze, P. (1999). PlantCARE, a plant cis-acting regulatory element database. Nucl Acid Res. 30, 325–327. doi: 10.1093/nar/30.1.325
Roy, S. W., and Penny, D. (2007). Patterns of intron loss and gain in plants: intron loss-dominated evolution and genome-wide comparison of O. sativa and A. thaliana. Mol. Biol. Evol. 24, 171–181. doi: 10.1093/molbev/msl159
Ruelland, E., Djafi, N., and Zachowski, A. (2013). The phosphoinositide dependent-phospholipase C pathway differentially controls the basal expression of DREB1 and DREB2 genes. Plant Signal. Behav. 8:307.
Rupwate, S. D., and Rajasekharan, R. (2012). C2 domain is responsible for targeting rice phosphoinositide specific phospholipase C. Plant Mol. Biol. 78, 247–258. doi: 10.1007/s11103-011-9862-1
Schlueter, J. A., Lin, J. Y., Schlueter, S. D., Vasylenko-Sanders, I. F., Deshpande, S., Yi, J., et al. (2007). Gene duplication and paleopolyploidy in soybean and the implications for whole genome sequencing. BMC Genomics 8:330. doi: 10.1186/1471-2164-8-330
Schmutz, J., Cannon, S. B., Schlueter, J., Ma, J., Mitros, T., Nelson, W., et al. (2010). Erratum: genome sequence of the palaeopolyploid soybean. Nature 465, 120–120.
Shi, J., Gonzales, R. A., and Bhattacharyya, M. K. (1995). Characterization of a plasma membrane-associated phosphoinositide-specific phospholipase C from soybean. Plant J. 8, 381–390. doi: 10.1046/j.1365-313x.1995.08030381.x
Song, F., and Goodman, R. M. (2002). Molecular cloning and characterization of a rice phosphoinositide-specific phospholipase C gene, OsPI-PLC1, that is activated in systemic acquired resistance. Physiol. Mol. Plant Pathol. 61, 31–40. doi: 10.1016/s0885-5765(02)90414-5
Su, H. G., Zhang, X. H., Wang, T. T., Wei, W. L., and Min, D. H. (2020). Genome-wide identification, evolution, and expression of GDSL-type esterase/lipase gene family in soybean. Front. Plant Sci. 11:726.
Tasma, I. M., Brendel, V., Whitham, S. A., and Bhattacharyya, M. K. (2008). Expression and evolution of the phosphoinositide-specific phospholipase C gene family in Arabidopsis thaliana. Plant Physiol. Biochem. 46, 627–637. doi: 10.1016/j.plaphy.2008.04.015
Tran, L. S., Quach, T. N., Guttikonda, S. K., Aldrich, D. L., Kumar, R., Neelakandan, A., et al. (2009). Molecular characterization of stress-inducible GmNAC genes in soybean. Mol. Genet. Genomics 281, 647–664. doi: 10.1007/s00438-009-0436-8
Venkataraman, G., Goswami, M., Tuteja, N., Reddy, M. K., and Sopory, S. K. (2003). Isolation and characterization of a phospholipase C delta isoform from pea that is regulated by light in a tissue specific manner. Mol. Genet. Genomics 270, 378–386. doi: 10.1007/s00438-003-0925-0
Vossen, J. H., Abd-El-Haliem, A., Fradin, E. F., Berg, G. C. M. V. D., Ekengren, S. K., Meijer, H. J. G., et al. (2010). Identification of tomato phosphatidylinositol-specific phospholipase-C (PI-PLC) family members and the role of PLC4 and PLC6 in HR and disease resistance. Plant J. 62, 224–239. doi: 10.1111/j.1365-313x.2010.04136.x
Wang, F., Chen, H. W., Li, Q. T., Wei, W., Li, W., Zhang, W. K., et al. (2015a). GmWRKY27 interacts with GmMYB174 to reduce expression of GmNAC29 for stress tolerance in soybean plants. Plant J. 83, 224–236. doi: 10.1111/tpj.12879
Wang, F., Deng, Y., Zhou, Y., Dong, J., Chen, H., Dong, Y., et al. (2015b). Genome-Wide analysis and expression profiling of the phospholipase C gene family in soybean (Glycine max). PLoS One 10:e0138467.
Wang, N., Zhang, W., Qin, M., Li, S., Qiao, M., Liu, Z., et al. (2017). Drought tolerance conferred in soybean (Glycine max. L) by GmMYB84, a novel R2R3-MYB transcription factor. Plant Cell Physiol. 58, 1764–1776. doi: 10.1093/pcp/pcx111
Wang, X., Wang, Y., Tian, J., Lim, B. L., Yan, X., and Liao, H. (2009). Overexpressing AtPAP15 enhances phosphorus efficiency in soybean. Plant Physiol. 151, 233–240. doi: 10.1104/pp.109.138891
Whitham, S. A., Qi, M., Innes, R. W., Ma, W., Lopes-Caitar, V., and Hewezi, T. (2016). Molecular soybean-pathogen interactions. Annu. Rev. Phytopathol. 54, 443–468. doi: 10.1146/annurev-phyto-080615-100156
Xiong, L. M., Schumaker, K. S., and Zhu, J. K. (2002). Cell signaling during cold, drought, and salt stress. Plant Cell 14, S165–S183. doi: 10.1105/tpc.000596
Xu, Q., Dunbrack, R. L., and Jr. (2012). Assignment of protein sequences to existing domain and family classification systems: pfam and the PDB. Bioinformatics 28, 2763–2772. doi: 10.1093/bioinformatics/bts533
Xu, Z. S., Ni, Z. Y., Liu, L., Nie, L. N., Li, L. C., Chen, M., et al. (2008). Characterization of the TaAIDFa gene encoding a CRT/DRE-binding factor responsive to drought, high-salt, and cold stress in wheat. Mol. Genet. Genomics 280, 497–508. doi: 10.1007/s00438-008-0382-x
Yasuhiro, K., Ken, S., and Cyril, Z. (2015). Regulation of the NADPH Oxidase RBOHD during plant immunity. Plant Cell Physiol. 56, 1472–1480. doi: 10.1093/pcp/pcv063
Yun, J. K., Kim, J. E., Lee, J. H., Lee, M. H., Jung, H. W., Bahk, Y. Y., et al. (2004). The Vr-PLC3 gene encodes a putative plasma membrane-localized phosphoinositide-specific phospholipase C whose expression is induced by abiotic stress in mung bean (Vigna radiata L.). Febs Lett. 556, 127–136. doi: 10.1016/s0014-5793(03)01388-7
Zhai, S., Sui, Z., Yang, A., and Zhang, J. (2005). Characterization of a novel phosphoinositide-specific phospholipase C from zea mays and its expression in Escherichia coli. Biotechnol. Lett. 27, 799–804. doi: 10.1007/s10529-005-5802-y
Zhang, K., Jin, C., Wu, L., Hou, M., Dou, S., Pan, Y., et al. (2014). Expression analysis of a stress-related phosphoinositide-specific phospholipase C gene in wheat (Triticum aestivum L.). Plos One 9:e105061. doi: 10.1371/journal.pone.0105061
Keywords: PLC proteins, genomic-wide analysis, abiotic stresses, hairy root assay, Glycine max
Citation: Chen Z-F, Ru J-N, Sun G-Z, Du Y, Chen J, Zhou Y-B, Chen M, Ma Y-Z, Xu Z-S and Zhang X-H (2021) Genomic-Wide Analysis of the PLC Family and Detection of GmPI-PLC7 Responses to Drought and Salt Stresses in Soybean. Front. Plant Sci. 12:631470. doi: 10.3389/fpls.2021.631470
Received: 20 November 2020; Accepted: 10 February 2021;
Published: 03 March 2021.
Edited by:
Sergio J. Ochatt, INRA UMR 1347 Agroécologie, FranceReviewed by:
Shabir Hussain Wani, Sher-e-Kashmir University of Agricultural Sciences and Technology, IndiaJunya Mizoi, The University of Tokyo, Japan
Richard Odongo Magwanga, Cotton Research Institute (CAAS), China
Copyright © 2021 Chen, Ru, Sun, Du, Chen, Zhou, Chen, Ma, Xu and Zhang. This is an open-access article distributed under the terms of the Creative Commons Attribution License (CC BY). The use, distribution or reproduction in other forums is permitted, provided the original author(s) and the copyright owner(s) are credited and that the original publication in this journal is cited, in accordance with accepted academic practice. No use, distribution or reproduction is permitted which does not comply with these terms.
*Correspondence: Zhao-Shi Xu, eHV6aGFvc2hpQGNhYXMuY24=; Xiao-Hong Zhang, emh4aDI0OTNAMTI2LmNvbQ==
†These authors have contributed equally to this work