 Anna L. Schwabe
 Connor J. Hansen1,2
- 1School of Biological Sciences, University of Northern Colorado, Greeley, CO, United States
- 2Department of Chemistry and Biochemistry, University of Northern Colorado, Greeley, CO, United States
Currently in the United States, the sole licensed facility to cultivate Cannabis sativa L. for research purposes is the University of Mississippi, which is funded by the National Institute on Drug Abuse (NIDA). Studies researching Cannabis flower consumption rely on NIDA-supplied “research grade marijuana.” Previous research found that cannabinoid levels of NIDA-supplied Cannabis do not align with commercially available Cannabis. We sought to investigate the genetic identity of Cannabis supplied by NIDA relative to common categories within the species. This is the first genetic study to include “research grade marijuana” from NIDA. Samples (49) were assigned as Wild Hemp (feral; 6) and Cultivated Hemp (3), NIDA (2), CBD drug type (3), and high THC drug type subdivided into Sativa (11), Hybrid (14), and Indica (10). Ten microsatellites targeting neutral non-coding regions were used. Clustering and genetic distance analyses support a division between hemp and drug-type Cannabis. All hemp samples clustered genetically, but no clear distinction of Sativa, Hybrid, and Indica subcategories within retail marijuana samples was found. Interestingly, the two analyzed “research grade marijuana” samples obtained from NIDA were genetically distinct from most drug-type Cannabis available from retail dispensaries. Although the sample size was small, “research grade marijuana” provided for research is genetically distinct from most retail drug-type Cannabis that patients and patrons are consuming.
Introduction
Humans have a long history with Cannabis sativa, with evidence of cultivation dating back as far as 10,000years (Abel, 2013). The World Health Organization reports Cannabis as the most widely cultivated, trafficked and abused illicit drug, and it constitutes over half of worldwide drug seizures (World Health Organization, 2018). The United States is currently experiencing drastic changes in patterns of Cannabis use associated with widespread relaxation of laws that previously limited both medical and recreational consumption (Cousijn et al., 2018), as well as hemp cultivation. This has led to a need for extensive research into the basic biology and taxonomy of Cannabis sativa (Hillig, 2005; Clarke and Merlin, 2013; Lynch et al., 2016; Vergara et al., 2016; Small, 2017).
Cannabis sativa is the only described species in the genus Cannabis (Cannabaceae) but there are several commonly described subcategories that are widely recognized. There are two primary groups, which are well-supported by genetic analyses (Sawler et al., 2015; Lynch et al., 2016; Dufresnes et al., 2017; Soler et al., 2017): (1) hemp or hemp type which is legally defined in the United States as Cannabis containing no more than 0.3% THC, and (2) marijuana, drug type, or drug type which encompasses all Cannabis with THC concentrations >0.3% THC. The term marijuana is controversial, so unless referencing “research grade marijuana” as defined by the US government, we utilize the term “drug type,” as there is no acceptable widely used term for Cannabis that does not classify as hemp. It is important to note that much of the confusion around Cannabis groups is related to the fact that hemp and drug types are distinguished based on % THC content, which is a variable trait that has been selected for or against in the two groups. Hemp types tend to have higher concentrations of CBD than drug types (de Meijer et al., 1992). High THC drug types generally contain >12% THC and average ~10–23% THC in dispensaries (Potter et al., 2008; Vergara et al., 2017; Jikomes and Zoorob, 2018). Within the two major groups, Cannabis can be further divided into varietals or strains. High THC drug types are often categorized further in the commercial marketplace: Sativa, Indica, and Hybrid strains, which reportedly have different intoxicating effects (Heilig, 2011; Hazekamp and Fischedick, 2012; Smith, 2012; McPartland, 2017; Leafly, 2018). There is continuing debate among experts surrounding the appropriate taxonomic treatment of Cannabis groups, which is confounded by colloquial usage of these terms vs. what researchers suggest is more appropriate nomenclature (Small et al., 1976; Emboden, 1977, 1981; Clarke and Merlin, 2015; Small, 2015, 2016; McPartland, 2017; McPartland and Guy, 2017). Genetic analyses have not shown clear and consistent differentiation among the three commonly described high THC drug strain categories (Sawler et al., 2015; Lynch et al., 2016), but both the recreational and medical Cannabis communities maintain that there are distinct differences in effects between Sativa and Indica strains (Smith, 2012; Leafly, 2018).
Although Cannabis has been federally controlled in the United States since 1937, as of February 2021, 36 states and the District of Columbia (DC) allow regulated medical use, and 16 states and Washington DC allow adult recreational use (ProCon, 2018a). However, because the DEA lists THC as a Schedule I substance (United States Congress, 1970), research on all aspects of this plant has been limited. In the United States, a Schedule I substance is described as a drug with no accepted medical use and a high potential for abuse (United States Congress, 1970). Surgeon General Jerome Adams recently expressed concern that the current scheduling in the most restrictive category is inhibiting research on Cannabis as a potentially therapeutic plant (Jaeger, 2018). The University of Mississippi, funded through the National Institutes of Health/National Institute on Drug Abuse (NIH/NIDA), currently holds the only license issued by the Drug Enforcement Administration (DEA) for the cultivation of Cannabis for research purposes (Drug Enforcement Administration and Department of Justice, 2016). As such, NIDA serves as the sole legal provider of drug-type Cannabis for federally funded medical research in the United States. NIDA does not grow or distribute hemp-type Cannabis.
Medical research on Cannabis has primarily focused on isolated THC and CBD (Borgelt et al., 2013; Maa and Figi, 2014; Backes and Weil 2014; National Institute on Drug Abuse, 2016a, 2019, 2020; Baron, 2018; Citti et al., 2018; Cousijn et al., 2018) but there are hundreds of other chemical constituents in Cannabis (ElSohly, 2007), including cannabinoids and terpenes (Baron, 2018). Recent research has documented that NIDA-provided Cannabis has distinctly different cannabinoid profiles than commercially available Cannabis (Vergara et al., 2017). Specifically, Vergara et al. (2017) found that NIDA-reported THC and CBD concentrations were only 27 and 48%, respectively, of the mean values of commercially available drug-type Cannabis samples in the four US cities (Vergara et al., 2017). Due to the growing evidence that chemical constituents in various combinations and abundances in the whole plant work in concert to create the suite of reported physiological effects (Baron, 2018; Nahler et al., 2019; Russo, 2019; Ferber et al., 2020), it is important to know how strains vary in all relevant components. The chemical makeup of each variant of Cannabis is influenced by environmental conditions (e.g., light, water, nutrients, soil, airflow, etc.) and the underlying genetic makeup. Since genotype does not change, genetic data is essential baseline information for understanding Cannabis diversity, consistency, and potential effects.
In the current study, we investigated the genetic relationship of two types of NIDA-obtained Cannabis to commercially available drug-type Cannabis, as well as wild (feral) and cultivated hemp. Since Cannabis has been under heavy artificial selection for different traits such as THC content or industrial uses, we focused solely on genetic data. We assessed ten variable nuclear microsatellite loci targeting non-coding regions of the genome to examine genetic differentiation among our samples independent of recent human selection. Included in the present study were samples from NIDA (high THC and high THC/CBD), high THC drug type, low THC/high CBD drug type, wild growing hemp (presumed escapees from cultivation), and cultivated hemp. This study aimed to investigate where research grade Cannabis supplied by NIDA falls on the genetic spectrum of Cannabis groups.
Materials and Methods
Cannabinoid concentrations were not measured for any of the samples, as this was a genetic study. Samples were categorized based on the information provided at the time of acquisition. A total of 49 Cannabis samples acquired in the United States were used in this research (Supplementary Table 1), including Wild (feral) hemp (6), Cultivated hemp (3), NIDA samples (2), high CBD drug type (3), and high THC drug type (35). The wild collected hemp was sampled from herbaria collections and is presumed to represent feral specimens that escaped from cultivation. NIDA “research grade marijuana” was limited to two samples obtained via another study: “high THC” defined by NIDA as containing >5–10% THC (RTI log number 13494-22, reference number SAF 027355) and “high THC/CBD” defined by NIDA as containing 5–10% of both THC and CBD (RTI log number 13784-1114-18-6, reference number SAF 027355: National Institute on Drug Abuse, 2016b). NIDA has limited the access of “research grade marijuana” for non-medical research, so we did not have access to a wider sampling of the types they provide. High THC drug-type samples were further subdivided into three frequently used colloquial strain categories: Sativa (11), Hybrid (14), and Indica (10) based on information available online (Leafly, 2018; PotGuide.com, 2018; Wikileaf, 2018; Seedfinder, 2020). Cannabis is genetically diverse and based on our research which included 122 samples (Schwabe and McGlaughlin, 2019), and other published research (Gao et al., 2014; Sawler et al., 2015; Lynch et al., 2016; Dufresnes et al., 2017; Soler et al., 2017; Pisupati et al., 2018), the sampling used here adequately captures the genetic diversity within and among the groups.
DNA was extracted using a CTAB extraction protocol (Doyle, 1987) modified to use 0.035–0.100g of dried flower tissue per extraction. Ten variable microsatellite loci developed by Schwabe & McGlaughlin (Schwabe and McGlaughlin, 2019) were used in this study following their previously described procedures.
GENALEX ver. 6.4.1 (Peakall and Smouse, 2006, 2012; 59, 60) was used to calculate pairwise genetic differentiation (FST) and Nei’s genetic distance (D) between each of the seven groups and to determine the presence of private alleles. PCoA eigenvalues calculated in GENALEX were used to plot the PCoA in RStudio with the ggplot package (R Studio Team, 2015) with 95% confidence interval ellipses.
Genotypes were analyzed using the Bayesian cluster analysis program STRUCTURE ver. 2.4.2 (Pritchard et al., 2000). Burn-in and run-lengths of 50,000 generations were used with ten independent replicates for each STRUCTURE analysis, testing K=1–10. The number of genetic groups for the data set was determined by STRUCTURE HARVESTER (Earl and vonHoldt, 2012), which implements the method of Evanno et al. (2005).
Maverick v1.0.5 (Verity and Nichols, 2016) was used as an additional verification of Bayesian clustering analysis using thermodynamic integration to determine the appropriate number of genetic groups. The following parameters were used: admixture parameter (alpha) of 0.03 with a standard deviation (alphaPropSD) of 0.008, ten replicates (mainRepeats), 1,000 Burn-in iterations (mainBurnin), 5,000 sample iterations (mainSamples), 100 TI rungs (thermodynamicRungs), 500 TI Burn-in iterations (thermodynamicBurnin), and 1,000 TI iterations (thermodynamicSamples).
Results
Our analyses examined the genetic differentiation and structure of samples from seven Cannabis groups (Supplementary Table 1): (1) Wild hemp – feral wild collected hemp; (2) Cultivated hemp – obtained from hemp cultivators; (3) NIDA – “research grade marijuana” samples obtained from NIDA classified as high THC or high THC/CBD; (4) high CBD – drug-type Cannabis with relatively high levels of CBD and low levels of THC; and commercially available high THC drug-type Cannabis described as (5) Sativa, (6) Hybrid, or (7) Indica. With the exception of genetic distance statistics, the analyses were performed on samples at the individual level, where the genetic placement of each sample is determined independent of its’ putative Cannabis group. Conducting analyses at an individual level controls for biases that might arise due to the artificial nature of named groups and varying group sample sizes. Clustering (PCoA) and proportion of genetic assignment (STRUCTURE) analyses are presented first by assigning each sample by color to either hemp type or drug type (Figures 1, 2; Supplementary Figure 1), as these have previously been shown to separate well using genetic data (Datwyler and Weiblen, 2006; Piluzza et al., 2013; Sawler et al., 2015; Lynch et al., 2016; Dufresnes et al., 2017). The same analyses are then presented by color assignment to one of the seven subcategories to determine further possible relationships within and among these groups (Figures 3, 4).
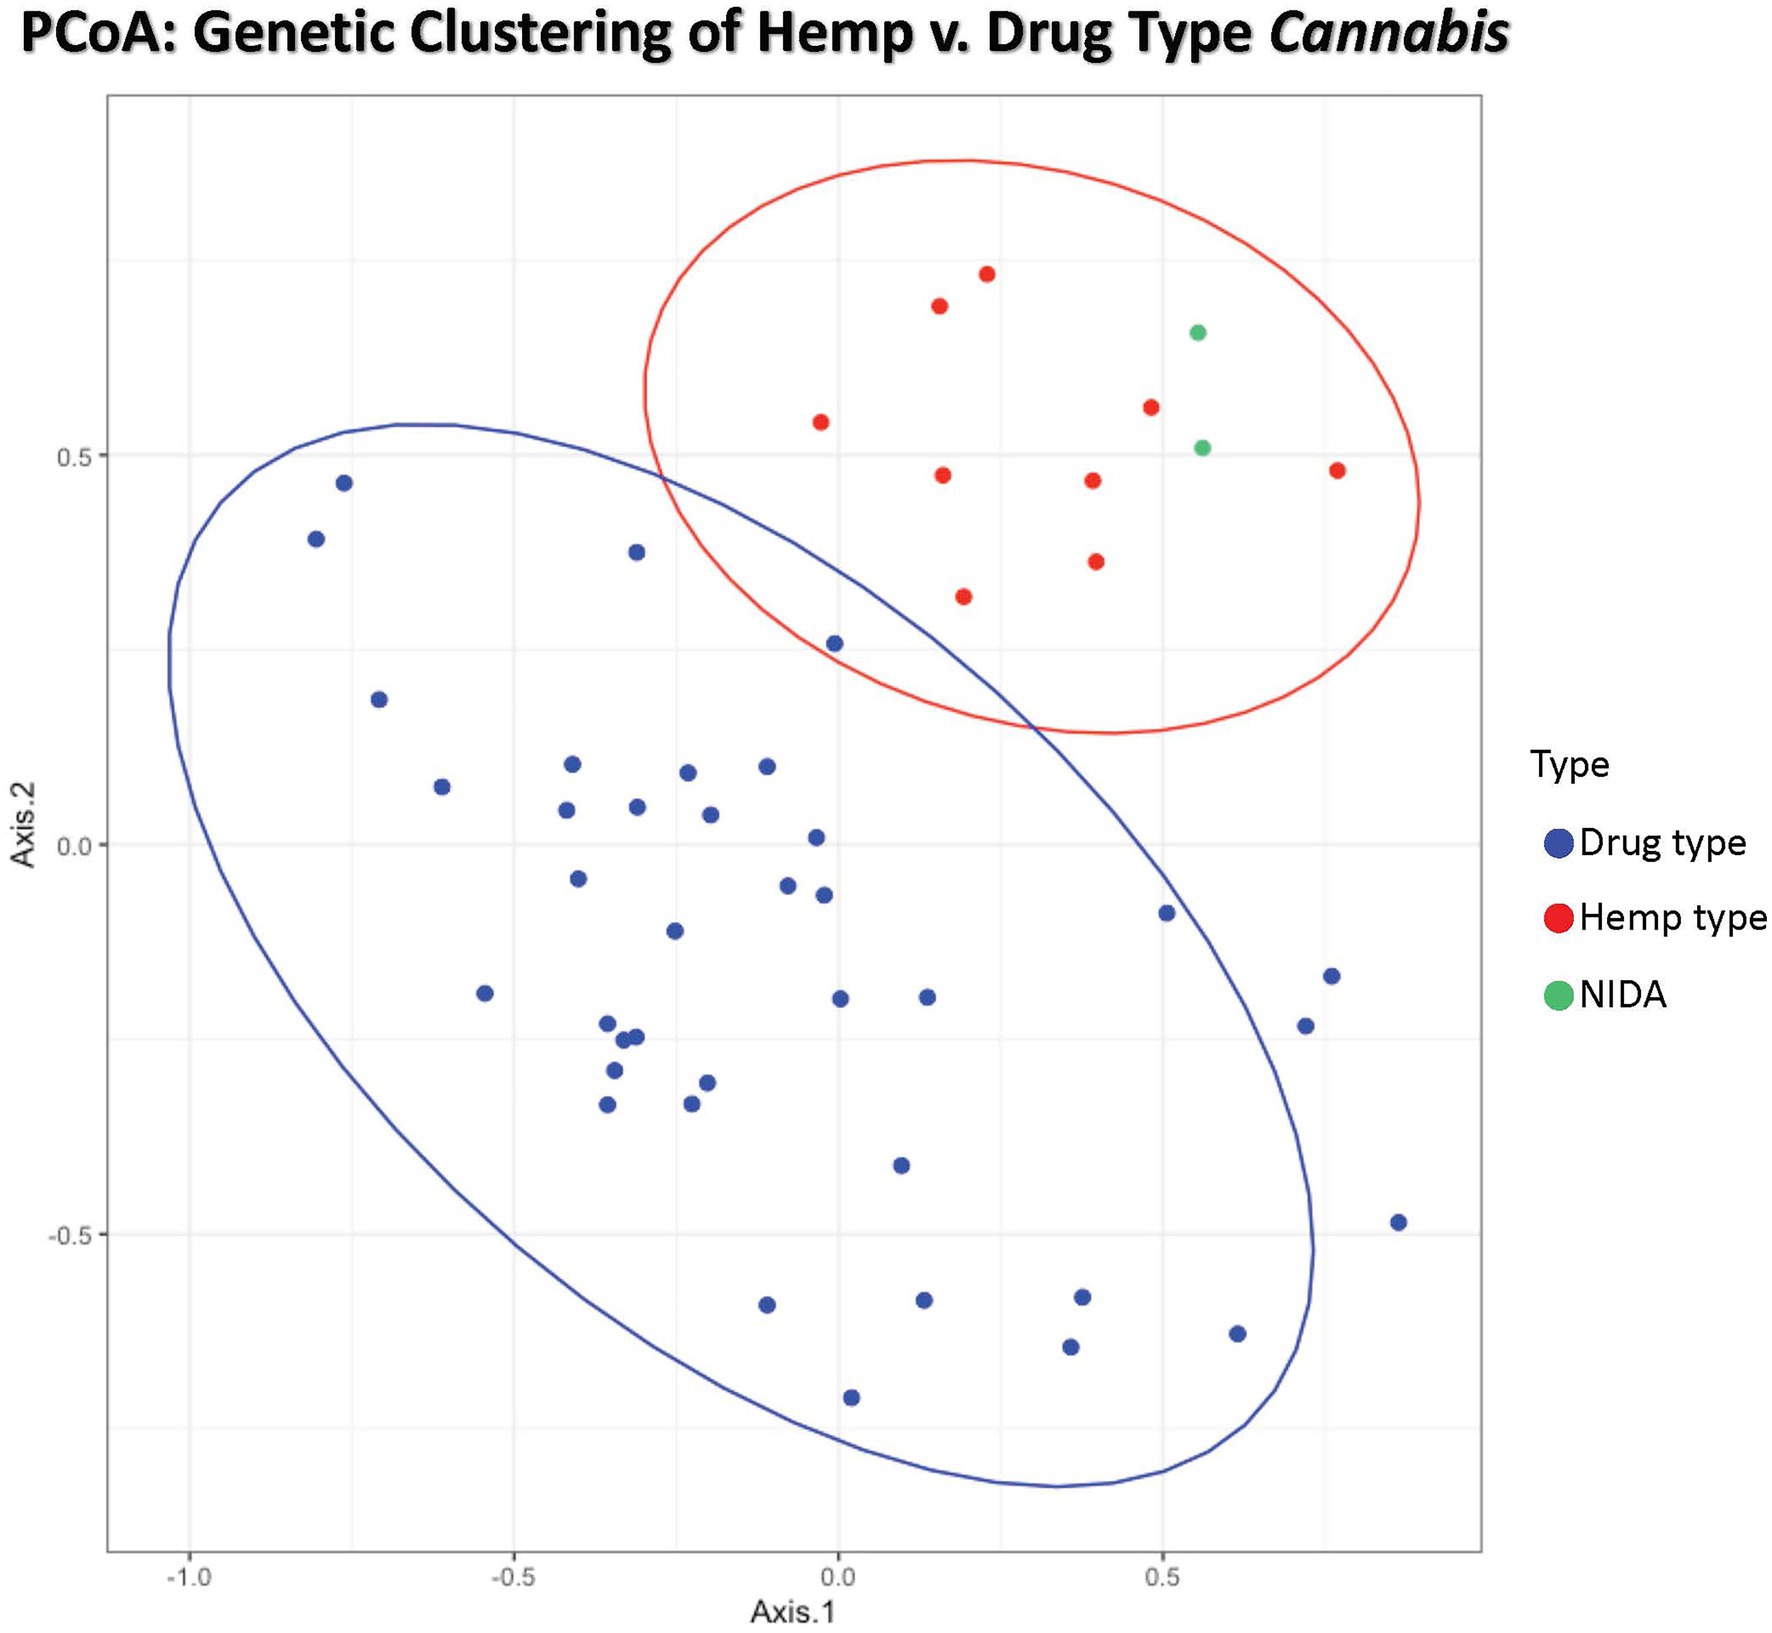
Figure 1. Principal coordinates analysis of genetic distance among samples. Samples clustering together are more closely related. The ellipses represent 95% confidence intervals for each group (Cultivated hemp = orange, Wild hemp = yellow, NIDA = blue, High CBD = pink, Sativa = red, Hybrid = green, Indica = purple). Approximately 24% of the genetic variation in these groups is shown (Axis 1 = 13.02% and Axis 2 = 11.17%).
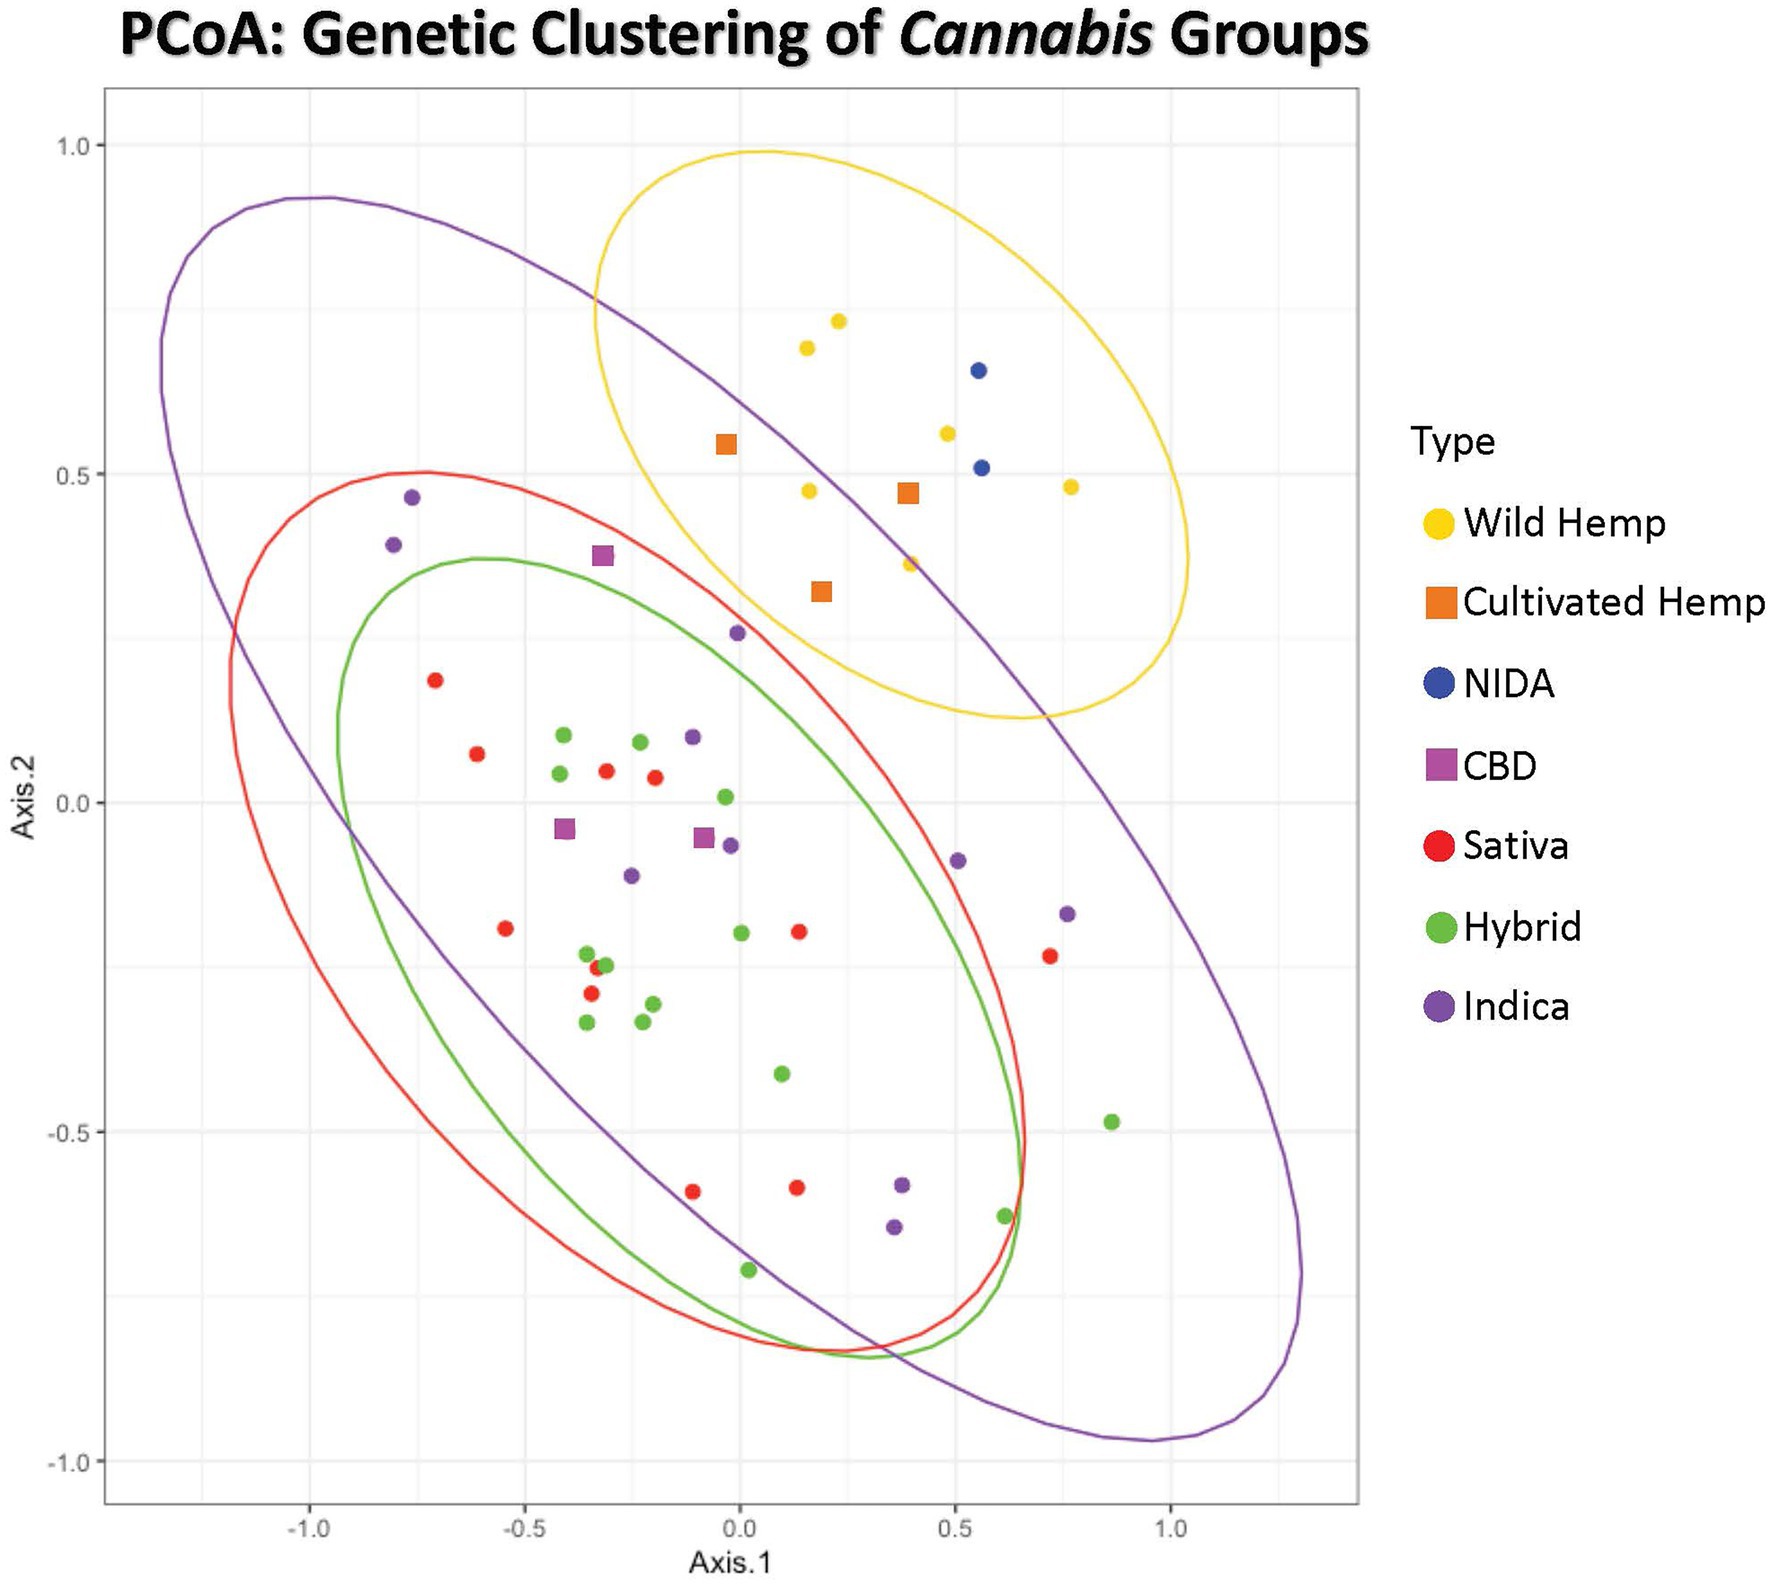
Figure 2. Principal Coordinates Analysis of genetic distance among samples. Samples clustering together are more closely related. The ellipses represent 95% confidence intervals for each group (Cultivated hemp = orange, Wild hemp = yellow, NIDA = blue, High CBD = pink, Sativa = red, Hybrid = green, Indica = purple). Approximately 24% of the genetic variation in these groups is shown (coordinate 1= 13.02% and coordinate 2 = 11.17%). No confidence intervals were drawn for NIDA, High CBD, or Cultivated Hemp samples due to the small sample size (n = 2, n = 3, and n = 3, respectively).
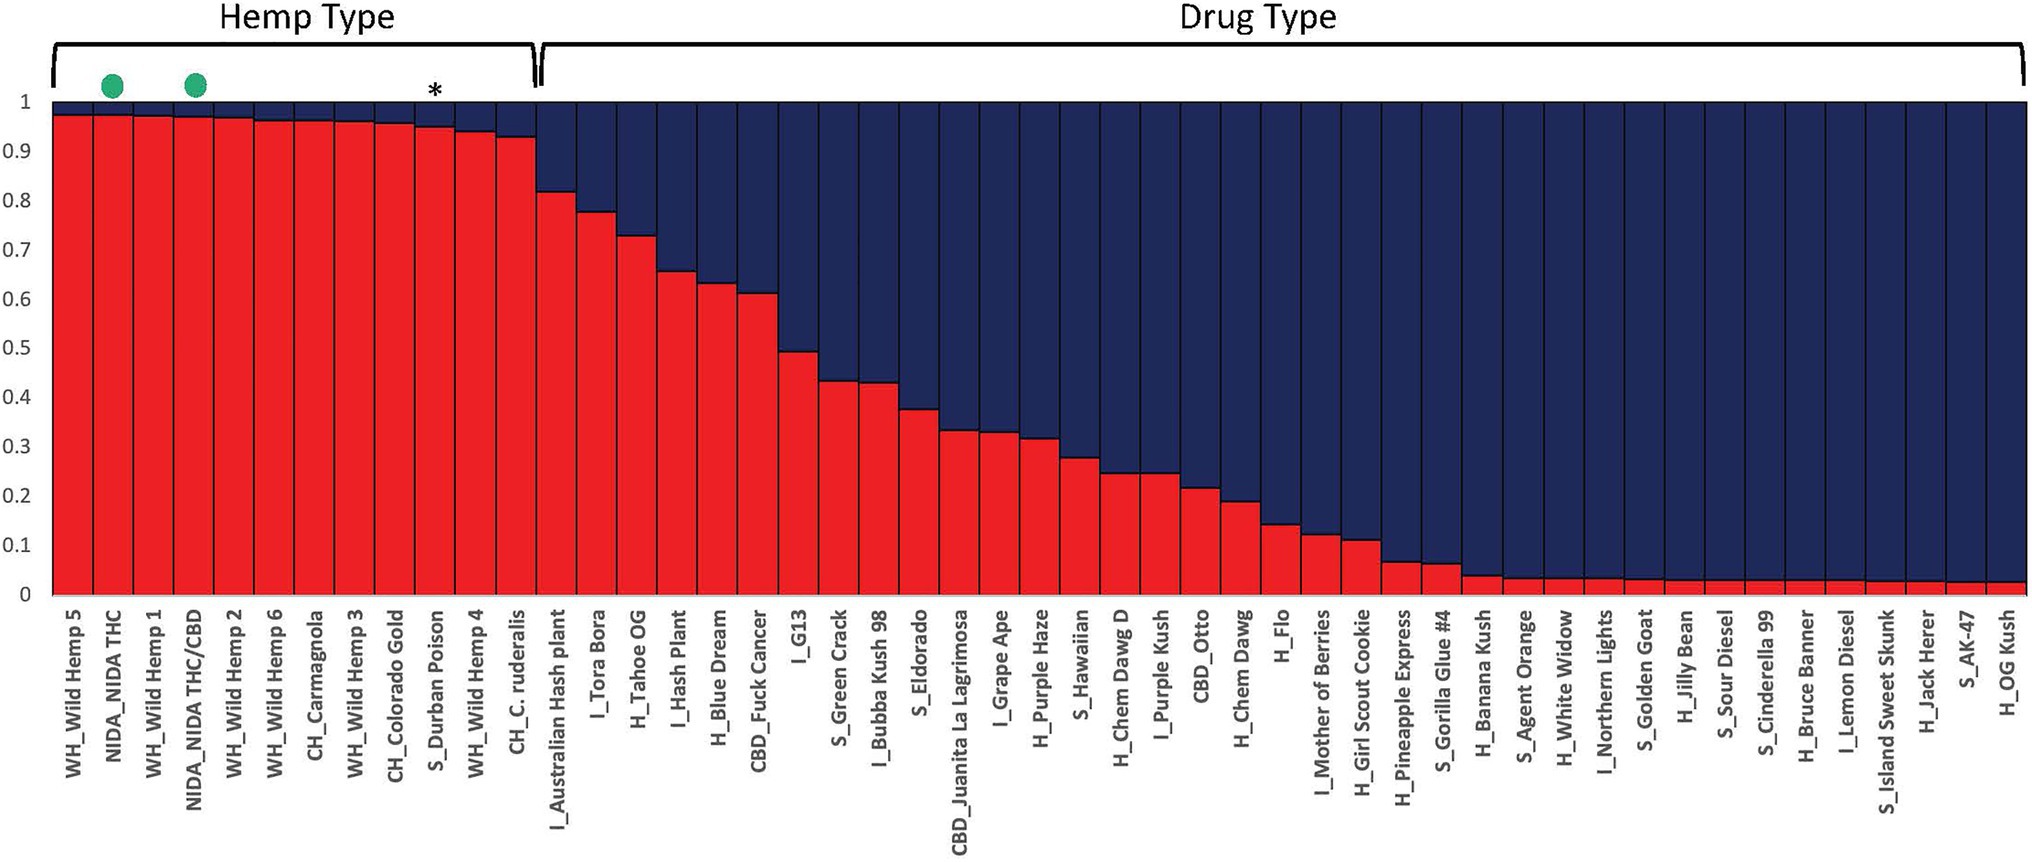
Figure 3. Bayesian clustering analysis from STRUCTURE with the proportion of inferred ancestry for two genetic groups (K=2) sorted by proportion of genotype assignment. Each individual is represented as a single bar in the graph. The NIDA samples are indicated by a green dot. * “Durban Poison” is a drug type assigned 0.95 to hemp ancestry. The letters preceding the sample name relate to the category the sample was place in (WH, wild hemp; CH, cultivated hemp; CBD, high CBD drug type; S, sativa drug type; H, hybrid drug type; I, Indica drug type).
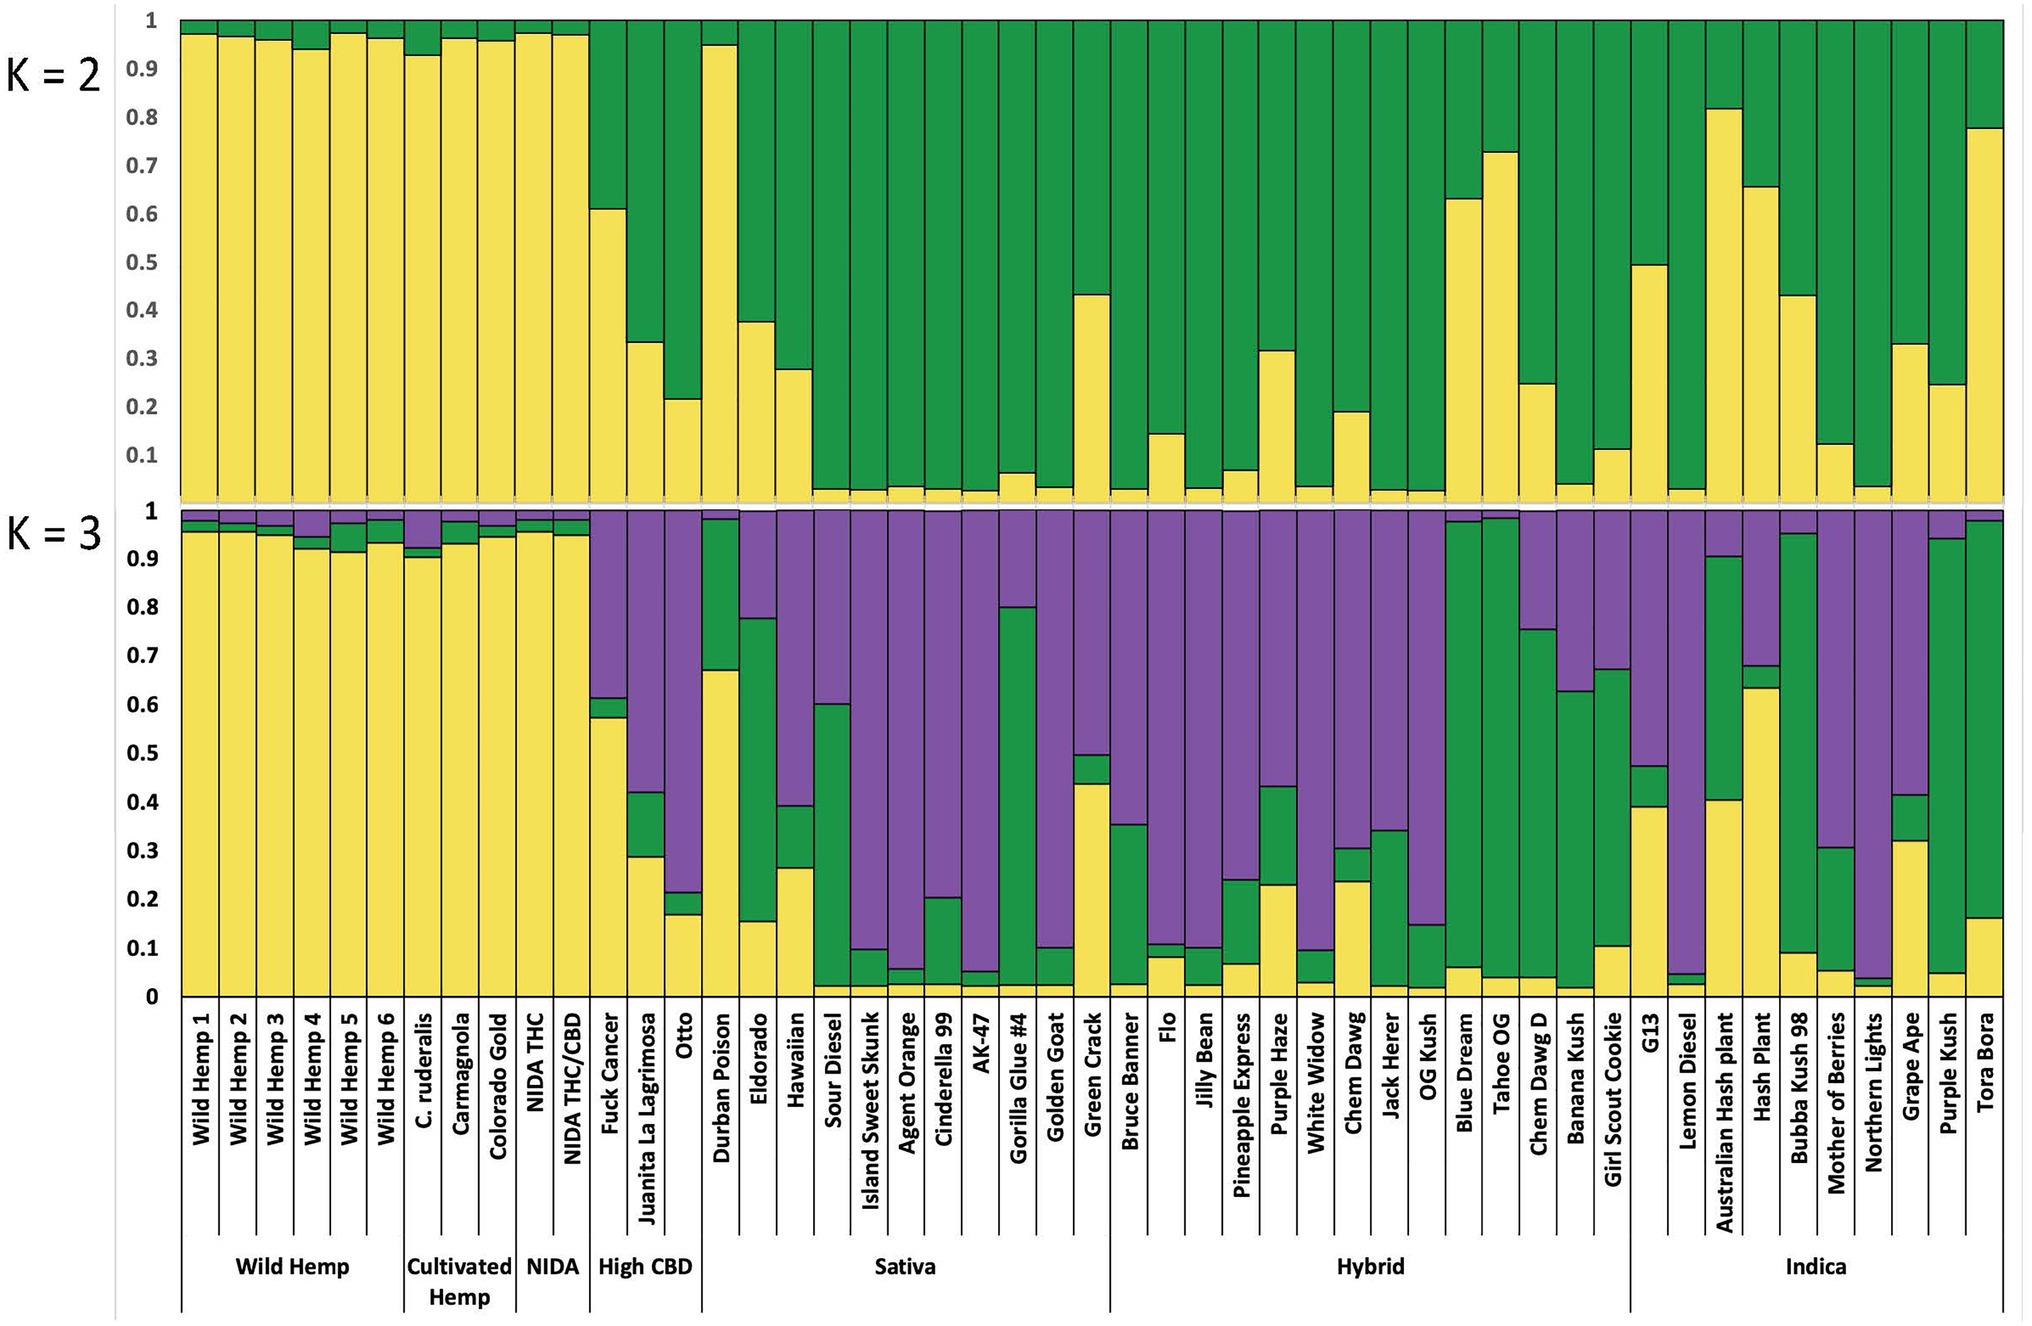
Figure 4. Bayesian clustering analysis from STRUCTURE with the proportion of inferred ancestry for two genetic groups (K=2, top), and for three genetic groups (K=3, bottom), Each individual is represented as a single bar in the graph.
Genetic Analyses: Individual Level
Hemp V. Drug Types
Principal coordinate analysis (PCoA) with 95% confidence interval ellipses around the hemp-type (red) and drug-type (blue) groups shows clear separation of hemp samples from the drug types. NIDA samples are indicated in green and cluster within the hemp confidence interval (Figure 1). Coordinate 1 explains 13.02% of the genetic variation, and an additional 11.17% of the genetic variation is explained by coordinate 2.
STRUCTURE was used to examine sample assignment to genetic groups while allowing admixture. The appropriate number of STRUCTURE groups from K=1–10 was validated using STRUCTURE HARVESTER (Earl and vonHoldt, 2012), which had high support for two genetic groups (K=2, ∆K=61.35). An additional genetic structure analysis (MAVERICK 1.0.5: Verity and Nichols, 2016) was conducted to independently test group assignments and verified strong support for two genetic groups with the same assignment of individuals (K=2, probability 0.999, data not shown). The two genetic group STRUCTURE analysis (Figure 3) shows consistent differentiation between hemp-type and drug-type Cannabis. All hemp samples were assigned a genetic proportion of inferred ancestry (Q) greater than 0.92 (hemp mean group 1, Q=0.96). All but two drug-type samples showed admixture associated with hemp <0.78 (range 0.03–0.78) with 31 of 38 (83%) samples <0.50 proportion of ancestry associated with hemp genetic signal.
Categorical Group Analysis
Principal coordinate analysis with 95% confidence interval ellipses around the major groups shows that there is clear separation of hemp samples from the drug types, with NIDA samples (green) clustering within the hemp confidence interval (Figure 2). The drug-type samples (Indica, Sativa, Hybrid, and high CBD) all occupy the same character space, distinct from hemp.
For the categorical group STRUCTURE analyses, the two genetic group STRUCTURE analysis (K2, Figure 4) shows consistent differentiation between hemp- and drug-type samples. All hemp samples were assigned to genetic group 1 (yellow) with a proportion of inferred ancestry (Q) greater than 0.93 (hemp mean group 1, Q=0.96). High THC drug-type samples showed some admixture with 29 of 35 samples having the majority of the genetic signal assigned to genetic group 2 (green; high THC drug-type mean group 2, Q=0.75). The three high CBD drug-type samples were assigned with a mean of 0.61 to group 1 and 0.39 to groups 2. NIDA samples were assigned to genetic group 1 (NIDA mean group 1, Q=0.97), demonstrating a strong genetic association with hemp in this analysis.
Although not strongly supported, the three genetic group STRUCTURE analysis (K3, Figure 4) shows some additional genetic structure among drug-type samples. All hemp-type samples were assigned to genetic group 1 (yellow) with a proportion of inferred ancestry (Q) greater than 0.90 (hemp mean group 1, Q=0.93). The high THC drug-type samples demonstrated some admixture with 12 of 35 samples assigned genetic signal Q=>0.50 to group 2 (green; high THC drug-type mean group 2, Q=0.33), and 21 of 35 samples assigned genetic signal Q=>0.50 to group 3 (purple; high THC drug-type mean group 3, Q=0.53). The three high CBD drug-type samples were assigned with a mean of 0.34 to group 1, 0.10 to group 2 and 0.58 to group 3. NIDA samples were assigned to genetic group 1 (NIDA mean group 1, Q=0.95) with similarly low signal from groups 2 and 3 (0.03 and 0.02 respectively) demonstrating a strong genetic association with hemp. STRUCTURE analysis results are also presented from K=2–10 (Supplementary Figure 1).
Genetic Analyses: Population Level
Genetic Differentiation
Pairwise genetic differentiation (Fst and Nei’s D) calculated in GENALEX ver. 6.4.1 [59, 60] found the highest level of divergence between NIDA and high CBD drug type (Fst=0.394) and between hemp and Sativa high THC drug type (Nei’s D=1.026; Table 1). The least divergence was observed among the high THC drug types (Fst=0.023–0.039; Nei’s D=0.066–0.102).
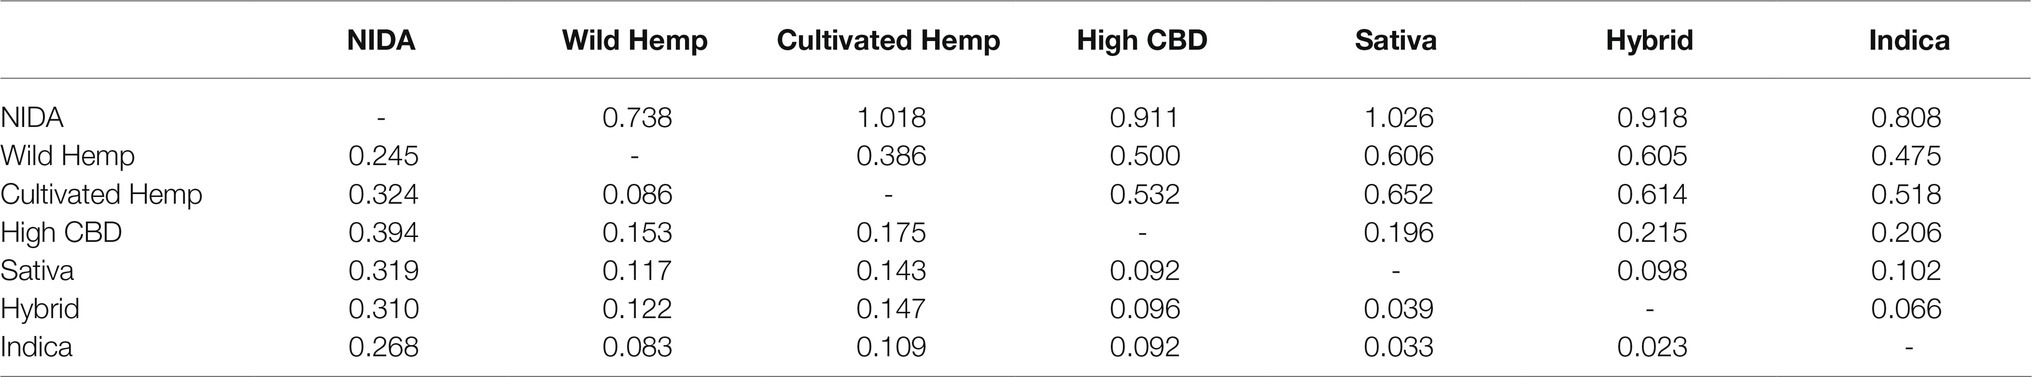
Table 1. Pairwise Fst values (below the diagonal) and Nei’s D (above the diagonal) for major Cannabis groups.
Private Alleles
Private alleles, alleles found only in a single group, are commonly used in population genetic studies to identify divergent groups. Eight of the ten utilized loci contained at least one private allele in one Cannabis group (Table 2). Wild hemp contained the most private alleles, 12, while the high CBD group contained only 1. Given that we only sampled two NIDA individuals, the four observed private alleles indicate that this group contains unique genetic signal.
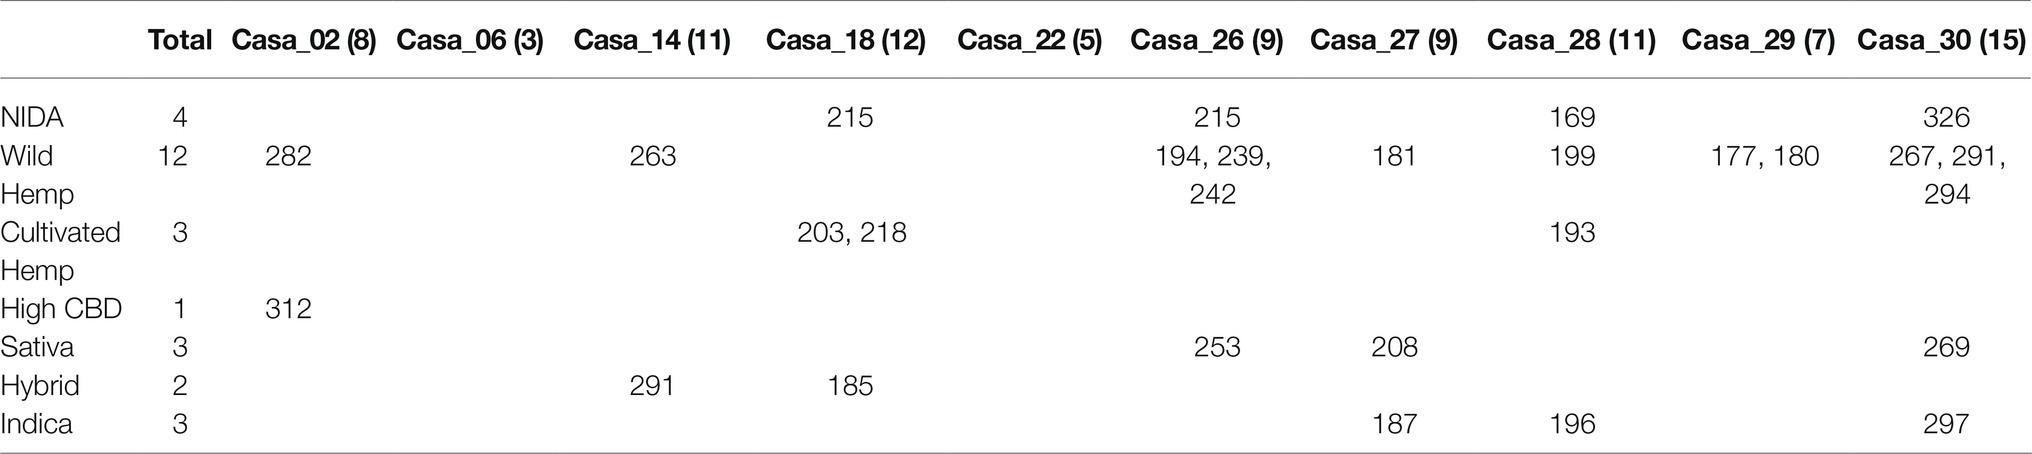
Table 2. Private alleles in each categorical group for ten loci. The number in parentheses after the locus name is number total number alleles for a locus.
Discussion
The purpose of this study was to examine the genetic relationship of Cannabis samples from each of the common categories and subgroups and to determine where NIDA samples fall on the Cannabis genetic spectrum. The genetic regions used in this study were designed to target non-coding regions of the genome, and therefore less likely to reflect artifacts related to recent human selection. Our results clearly demonstrate that NIDA Cannabis samples are substantially genetically different from most commercially available drug-type strains and share a genetic affinity with hemp samples in several of the analyses. We do not claim that NIDA is supplying hemp for Cannabis research, rather we are confident that our analyses show that the “research grade marijuana” supplied by NIDA is genetically different from the retail drug-type samples analyzed in this study. Previous research has found that medical and recreational Cannabis from California, Colorado, and Washington differs significantly in cannabinoid levels from the “research grade marijuana” supplied by NIDA (Vergara et al., 2017). This investigation adds to the previous research, indicating that the sampled NIDA Cannabis is also genetically distinctive from commercially available medical and recreational Cannabis. Given both this genetic and previous chemotypic investigations have concluded that NIDA is supplying product that does not align with what is available for consumers, our hope is that the NIH and NIDA will support the cultivation of Cannabis that is representative of what medical and recreational consumers are using. Medical practitioners, researchers and patients deserve access to Cannabis products that are comparable to products available on the legal market.
The genetic data collected in this study indicate that two major genetic groups exist within Cannabis sativa (Figures 1, 3). These results contribute to the growing consensus that hemp- and drug-type Cannabis can be consistently differentiated (Forapani et al., 2001; Datwyler and Weiblen, 2006; McPartland, 2006; Hakki et al., 2007; Sawler et al., 2015; Lynch et al., 2016; Dufresnes et al., 2017; Soler et al., 2017), but all Cannabis groups are currently considered a single species that has been selected for different uses. Some admixture of the hemp-type genetic signal is seen in many of the drug-type samples; this is not unexpected as the legal definition of hemp (0.3% total THC by dry weight) is not biologically significant and therefore holds no scientific basis for formal taxonomic separation. To our knowledge, this study and collaborative work investigating the genomic Cannabis data (Vergara et al., 2021) are the first to include “research grade marijuana” from NIDA. The placement of NIDA samples with hemp in multiple analyses was unexpected. However, it is important to note that some drug-type samples (e.g., “Durban Poison,” Figure 3) are also placed in the hemp-type genetic group. This finding supports that although there are two distinct Cannabis genetic groups (hemp type and drug type), some strains within those groups have been selected to have the characteristics that we do not commonly associate with their specific genetic background. Crosses between hemp-type and drug-type strains may have been intentional, such as the recently developed high CBD drug strains that have low THC concentrations or the development of auto-flowering drug strains that flower as a function of age rather than photoperiod, which is a trait historically seen in some hemp varieties (Punja et al., 2017). Additionally, most Cannabis strains are a product of clandestine breeding in underground markets, so their presumed lineage may not match their actual genetic group. Hence, the finding that NIDA samples belong in the hemp-type genetic group in several analyses does not make these samples hemp, but it does demonstrate that they are different than the majority of drug-type Cannabis found in the marketplace.
Analyses were also conducted to examine how NIDA samples relate to traditionally recognized subgroups of Cannabis. It is important to note that some of the subgroups we assigned samples to are largely artificial and were based on information provided by online databases, which is the information that a recreational or medical consumer would have access to (Leafly, 2018; PotGuide.com, 2018; Wikileaf, 2018; Seedfinder, 2020). Although the categories Sativa, Indica and Hybrid are frequently used in the Cannabis industry and among consumers, researchers have yet to find consistent phenotypic and/or genotypic traits driving these widely referenced categories (Hillig, 2005; McPartland, 2017; McPartland and Guy, 2017; McPartland and Small, 2020). Given the high degree of intentional hybridization among drug-type Cannabis, it stands to reason that we would not see clear genetic separation among these categories. Additionally, the growing interest in Cannabis with alternative combinations of cannabinoids other than THC has led to increased breeding efforts between hemp and drug types, further diluting any historical genetic distinctions that might have existed. Therefore, we did not expect the seven groups we used here to resolve as genetically unique. The analyses of genetic distance (Table 1) and private alleles (Table 2) support that NIDA samples are substantially diverged from all other Cannabis groups, including hemp, and contain a unique genetic profile. The high CBD drug-type samples are genetically more divergent from the hemp group than the high THC drug-type groups, suggesting that these are hybrids of hemp-type and high THC drug-type Cannabis. Additionally, the high CBD drug-type samples and several drug-type samples are admixed with some genetic signal assigned to both hemp and drug groups. Given the intentional breeding of different Cannabis groups and the fact that hemp-type and drug-type Cannabis are defined by total THC content, a trait under selection, the lack of genetic support for many distinct groups is not surprising.
The University of Mississippi National Center for Natural Products Research (NCNPR) produces research grade drug-type Cannabis for NIDA. NCNPR does not provide variety or strain information when filling Cannabis orders, so it is unclear what is currently grown for federally funded Cannabis research. Our data suggest that the NIDA Cannabis analyzed in this study was sourced from a single strain or two very closely related strains within the NCNPR stock. Without additional information about NCNPR Cannabis production, it is difficult to know how many strains are provided for federally funded research using Cannabis from NIDA. This study included only two Cannabis samples from NIDA which limits what we can conclude about the breadth of genetic diversity contained in NIDA collections. The inclusion of additional NIDA samples would be beneficial, but additional sampling would in no way change the genotypes of the samples included in this study, which was supplied to researchers conducting federally approved Cannabis research. Although the sample size of NIDA samples could impact their placement in group-based analyses of genetic distance (Table 1), all other analyses were carried out at an individual level (Figures 1–4, and Supplemental Figure 1) to avoid this issue. The exact cause of the genetic distinction in NIDA samples cannot be determined, but many factors could play a role such as directional selection, inbreeding, sourcing of ancestral strains not currently represented in the commercial market, and/or cross-pollination from wild or cultivated hemp. It is our hope that this study will inspire further investigation of additional material supplied by NIDA.
Our study indicates the need for additional research and refinement of our understanding of Cannabis genetic structure and how those differences might impact Cannabis consumers. As the demand for medical Cannabis increases, it is important that research examining the threats and benefits of Cannabis use accurately reflects the experiences of the general public.
Given the rapidly changing landscape of Cannabis regulation and consumption (ProCon, 2018a,b), it is not surprising that commercially available Cannabis contains a diversity of genetic types. Commercially available Cannabis has come to market through non-traditional means leading to many inconsistencies. We have previously documented (Schwabe and McGlaughlin, 2019) that there is substantial genetic divergence among samples within named strains, which only exacerbates questions about the impacts of Cannabis consumption. These results emphasize the need to increase consistency within the Cannabis marketplace, and the need for “research grade marijuana” to accurately represent what is accessible to consumers.
This study highlights the genetic difference between “research grade marijuana” provided by NIDA and commercial Cannabis available to medical and recreational users. Hence, research conducted with NIDA Cannabis may not be indicative of the effects that consumers are experiencing. Additionally, research has demonstrated that Cannabis distributed by NIDA has lower levels of the principal medicinal cannabinoids (THC and CBD) and higher levels of the THC degradation product cannabinol (CBN; Vergara et al., 2017). Taken together, these results demonstrate the need for there to be a greater diversity of Cannabis available for medical research and that the genetic provenance of those samples to be established to fully understand the implications of results.
Data Availability Statement
The original contributions presented in the study are included in the article/Supplementary Material, further inquiries can be directed to the corresponding authors.
Author Contributions
AS conceived the project, collected the samples, conducted DNA extractions, designed and optimized microsatellite primers, compiled and analyzed the data, and drafted manuscript content. CH conducted DNA extractions, compiled and analyzed the data, and prepared the first draft of the manuscript. RH provided DNA from the NIDA samples. MM directed the project, provided some funding, and contributed to statistical analysis and manuscript revisions. All authors contributed to the article and approved the submitted version.
Funding
The University of Northern Colorado Graduate Student Association and the Gerald Schmidt Memorial Biology Scholarship awarded grants providing partial funding for this project. Funding was also obtained from the University of Northern Colorado School of Biological Sciences. These funding sources did not play any roles in the development, design, execution, or analysis of this study, nor did they contribute to the writing of the manuscript and had no input in the decision to publish this research.
Conflict of Interest
The authors declare that the research was conducted in the absence of any commercial or financial relationships that could be construed as a potential conflict of interest.
Publisher’s Note
All claims expressed in this article are solely those of the authors and do not necessarily represent those of their affiliated organizations, or those of the publisher, the editors and the reviewers. Any product that may be evaluated in this article, or claim that may be made by its manufacturer, is not guaranteed or endorsed by the publisher.
Acknowledgments
The National Institute on Drug Abuse provided the Research Grade Cannabis samples from which DNA used in this study was extracted. We thank Matt Kahl and Caren Kershner for providing hemp samples for this project, Melissa Islam, Associate Director of Biodiversity Research at the Denver Botanic Gardens for access to wild collected hemp herbarium specimens (Kathryn Kalmbach Herbarium), and the Cannabis Genome Research Initiative for the sample of Cannabis ruderalis. Funding for this project was provided through research grants awarded to A. Schwabe by the University of Northern Colorado Graduate Student Association and the University of Northern Colorado College of Natural and Heath Sciences, and the McGlaughlin Lab, School of Biological Sciences, University of Northern Colorado. We appreciate and are grateful to Samantha Naibauer and Emily Schumacher for assisting with the figures. Many thanks to Nolan Kane who provided feedback and support for this research. Finally, thank you Daniela Vergara for providing feedback and support for this research, and on the manuscript preparation.
Supplementary Material
The Supplementary Material for this article can be found online at: https://www.frontiersin.org/articles/10.3389/fpls.2021.675770/full#supplementary-material
References
Abel, E. L. (2013). Marihuana: The First Twelve Thousand Years. New York, NY: Springer Science & Business Media.
Backes, M., and Weil, A. (2014). Use of Medicinal Cannabis. In Cannabis Pharmacy: The Practical Guide to Medical Marijuana. Black Dog & Leventhal, 230. New York.
Baron, E. P. (2018). Medicinal properties of cannabinoids, terpenes, and flavonoids in Cannabis, and benefits in migraine, headache, and pain: an update on current evidence and Cannabis science. Headache 58, 1139–1186. doi: 10.1111/head.13345
Borgelt, L. M., Franson, K. L., Nussbaum, A. M., and Wang, G. S. (2013). The pharmacologic and clinical effects of medical cannabis. Pharmacotherapy: The Journal of Human Pharmacology and Drug Therapy. 33, 195–209. doi: 10.1002/phar.1187
Citti, C., Braghiroli, D., Vandelli, M. A., and Cannazza, G. (2018). Pharmaceutical and biomedical analysis of cannabinoids: a critical review. J. Pharm. Biomed. Anal. 147, 565–579. doi: 10.1016/j.jpba.2017.06.003
Clarke, R. C., and Merlin, M. D. (2013). Cannabis: Evolution and Ethnobotany. Berkeley: University of California Press.
Clarke, R. C., and Merlin, M. D. (2015). Letter to the editor: small, ernest. 2015. Evolution and classification of Cannabis sativa (marijuana, hemp) in relation to human utilization. Bot. Rev. 81, 295–305. doi: 10.1007/s12229-015-9158-2
Cousijn, J., Nunez, A. E., and Filbey, F. M. (2018). Time to acknowledge the mixed effects of cannabis on health: a summary and critical review of the NASEM 2017 report on the health effects of cannabis and cannabinoids. Addiction 113, 958–966. doi: 10.1111/add.14084
Datwyler, S. L., and Weiblen, G. D. (2006). Genetic variation in hemp and marijuana (Cannabis sativa L.) according to amplified fragment length polymorphisms. J. Forensic Sci. 51, 371–375. doi: 10.1111/j.1556-4029.2006.00061.x
de Meijer, E. P. M., Vanderkamp, H. J., and Vaneeuwijk, F. A. (1992). Characterization of Cannabis accessions with regard to cannabinoid content in relation to other plant characters. Euphytica 62, 187–200. doi: 10.1007/BF00041753
Doyle, J. J. (1987). A rapid DNA isolation procedure for small quantities of fresh leaf tissue. Phytochemi. Bulletin 4, 359–361.
Drug Enforcement Administration and Department of Justice (2016). Applications to become registered under the controlled substances act to manufacture marijuana to supply researchers in the United States. Policy statement. Fed. Regist. 81, 53846–53848.
Dufresnes, C., Jan, C., Bienert, F., Goudet, J., and Fumagalli, L. (2017). Broad-scale genetic diversity of Cannabis for forensic applications. PLoS One 12:e0170522. doi: 10.1371/journal.pone.0170522
Earl, D. A., and vonHoldt, B. M. (2012). STRUCTURE HARVESTER: a website and program for visualizing STRUCTURE output and implementing the Evanno method. Conserv. Genet. Resour. 4, 359–361. doi: 10.1007/s12686-011-9548-7
Emboden, W. A. (1981). The genus Cannabis and the correct use of taxonomic categories. J. Psychoactive Drugs 13, 15–21. doi: 10.1080/02791072.1981.10471446
Evanno, G., Regnaut, S., and Goudet, J. (2005). Detecting the number of clusters of individuals using the software STRUCTURE: a simulation study. Mol. Ecol. 14, 2611–2620. doi: 10.1111/j.1365-294X.2005.02553.x
Ferber, S. G., Namdar, D., Hen-Shoval, D., Eger, G., Koltai, H., Shoval, G., et al. (2020). The “entourage effect:” terpenes coupled with cannabinoids for the treatment of mood disorders and anxiety disorders. Curr. Neuropharmacol. 18, 87–96. doi: 10.2174/1570159X17666190903103923
Forapani, S., Carboni, A., Paoletti, C., Cristiana, V. M., Ranalli, N. P., and Mandolino, G. (2001). Comparison of hemp varieties using random amplified polymorphic DNA markers. Crop Sci. 41, 1682–1689. doi: 10.2135/cropsci2001.1682
Gao, C. S., Xin, P. F., Cheng, C. H., Tang, Q., Chen, P., Wang, C. B., et al. (2014). Diversity analysis in Cannabis sativa based on large-scale development of expressed sequence tag-derived simple sequence repeat markers. PLoS One 9:e110638. doi: 10.1371/journal.pone.0110638
Hakki, E. E., Kayis, S. A., Pinarkara, E., and Sag, A. (2007). Inter simple sequence repeats separate efficiently hemp from marijuana (Cannabis sativa L.). Electron. J. Biotechnol. 10, 570–581. doi: 10.2225/vol10-issue4-fulltext-4
Hazekamp, A., and Fischedick, J. T. (2012). Cannabis - from cultivar to chemovar. Drug Test. Anal. 4, 660–667. doi: 10.1002/dta.407
Heilig, S. (2011). The pot book: a complete guide to Cannabis, its role in medicine, politics, science, and culture. J. Psychoactive Drugs 43, 76–77. doi: 10.1080/02791072.2011.566505
Hillig, K. W. (2005). Genetic evidence for speciation in Cannabis (Cannabaceae). Genet. Resour. Crop. Evol. 52, 161–180. doi: 10.1007/s10722-003-4452-y
Jaeger, K. (2018). Surgeon General Says Marijuana's Schedule 1 Status Hinders Research. Available at: https://www.marijuanamoment.net/surgeon-general-says-marijuanas-schedule-i-status-hinders-research/ (Accessed January 7, 2019).
Jikomes, N., and Zoorob, M. (2018). The cannabinoid content of legal cannabis in Washington state varies systematically across testing facilities and popular consumer products. Sci. Rep. 8:4519. doi: 10.1038/s41598-018-22755-2
Leafly (2018). Cannabis Strain Explorer. Available at: https://www.leafly.com/explore (Accessed September 12, 2018).
Lynch, R. C., Vergara, D., Tittes, S., White, K., Schwartz, C. J., Gibbs, M. J., et al. (2016). Genomic and chemical diversity in Cannabis. Crit. Rev. Plant Sci. 35, 349–363. doi: 10.1080/07352689.2016.1265363
Maa, E., and Figi, P. (2014). The case for medical marijuana in epilepsy. Epilepsia 55, 783–786. doi: 10.1111/epi.12610
McPartland, J. M. (2006). Commentary on: Datwyler SL, Weiblen GD. Weiblen. Genetic variation in hemp and marijuana (Cannabis sativa L.) according to amplified fragment length polymorphisms. J. Forensic Sci. 51:1405. doi: 10.1111/j.1556-4029.2006.00276.x
McPartland, J. M. (2017). “Cannabis sativa and Cannabis indica versus “Sativa” and “Indica”,” in Botany and Biotechnology. eds. S. Chandra, H. Lata, and M. ElSohly (Cham: Springer).
McPartland, J. M., and Guy, G. W. (2017). Models of Cannabis taxonomy, cultural bias, and conflicts between scientific and vernacular names. Bot. Rev. 83, 327–381. doi: 10.1007/s12229-017-9187-0
McPartland, J. M., and Small, E. (2020). A classification of endangered high-THC cannabis (Cannabis sativa subsp. indica) domesticates and their wild relatives. Phytokeys 144, 81–112. doi: 10.3897/phytokeys.144.46700
Nahler, G., Jones, T., and Russo, E. (2019). Cannabidiol and contributions of major hemp phytocompounds to the “entourage effect;” possible mechanisms. J. Altern. Complement. Int. Med. 5:070. doi: 10.24966/ACIM-7562/100066
National Institute on Drug Abuse (2016a). NIDA Research on Marijuana and Cannabinoids. Available at: https://www.drugabuse.gov/drug-topics/marijuana/nida-research-marijuana-cannabinoids (Accessed November 15, 2019).
National Institute on Drug Abuse (2016b). Marijuana Plant Material Available From the Nida Drug Supply Program. Available at: https://www.drugabuse.gov/research-training/research-data-measures-resources/nida-drug-supply-program-dsp/marijuana-plant-material-available-nida-drug-supply-program (Accessed June, 2020).
Peakall, R., and Smouse, P. E. (2006). GENALEX 6: genetic analysis in excel. Population genetic software for teaching and research. Mol. Ecol. Notes 6, 288–295. doi: 10.1111/j.1471-8286.2005.01155.x
Peakall, R., and Smouse, P. E. (2012). GENALEX 6.5: genetic analysis in excel. Population genetic software for teaching and research-an update. Bioinformatics 28, 2537–2539. doi: 10.1093/bioinformatics/bts460
Piluzza, G., Delogu, G., Cabras, A., Marceddu, S., and Bullitta, S. (2013). Differentiation between fiber and drug types of hemp (Cannabis sativa L.) from a collection of wild and domesticated accessions. Genet. Resour. Crop. Evol. 60, 2331–2342. doi: 10.1007/s10722-013-0001-5
Pisupati, R., Vergara, D., and Kane, N. C. (2018). Diversity and evolution of the repetitive genomic content in Cannabis sativa. BMC Genomics 19:156. doi: 10.1186/s12864-018-4494-3
PotGuide.com (2018). Marijuana Strain Profiles. Available at: https://potguide.com/strain-profiles/ (Accessed March, 2018).
Potter, D. J., Clark, P., and Brown, M. B. (2008). Potency of delta(9)-THC and other cannabinoids in Cannabis in England in 2005: implications for psychoactivity and pharmacology. J. Forensic Sci. 53, 90–94. doi: 10.1111/j.1556-4029.2007.00603.x
Pritchard, J. K., Stephens, M., and Donnelly, P. (2000). Inference of population structure using multilocus genotype data. Genetics 155, 945–959. doi: 10.1093/genetics/155.2.945
ProCon (2018a). Legal medical marijuana states and DC. Available at: https://medicalmarijuana.procon.org/view.resource.php?resourceID=000881 (Accessed February 2021).
ProCon (2018b). Number of legal medical marijuana patients (as of May 17 2018). Available at: https://medicalmarijuana.procon.org/view.resource.php?resourceID=005889 (Accessed February 2021).
Punja, Z. K., Rodriguez, G., and Chen, S. (2017). “Assessing genetic diversity in Cannabis sativa using molecular approaches,” in Cannabis sativa L. - Botany and Biotechnology. eds. S. Chandra, H. Lata, and M. A. ElSohly (Cham, Switzerland: Springer International Publishing AG), 395–418.
Russo, E. B. (2019). The case for the entourage effect and conventional breeding of clinical Cannabis: no ‘strain,’ no gain. Front. Plant Sci. 9:1969. doi: 10.3389/fpls.2018.01969
Sawler, J., Stout, J. M., Gardner, K. M., Hudson, D., Vidmar, J., Butler, L., et al. (2015). The genetic structure of marijuana and hemp. PLoS One 10:e0133292. doi: 10.1371/journal.pone.0133292
Schwabe, A. L., and McGlaughlin, M. E. (2019). Genetic tools weed out misconceptions of strain reliability in Cannabis sativa: implications for a budding industry. J. Cannabis Res. 1:332320. doi: 10.1186/s42238-019-0001-1
Seedfinder (2020). Seed-Finder. Available at: https://en.seedfinder.eu/ (Accessed January, 2020)
Small, E. (2015). Evolution and classification of Cannabis sativa (marijuana, hemp) in relation to human utilization. Bot. Rev. 81, 189–294. doi: 10.1007/s12229-015-9157-3
Small, E. (2017). “Classification of Cannabis sativa L. in relation to agricultural, biotechnological, medical and recreational utilization,” in Cannabis sativa L. - Botany and Biotechnology. eds. S. Chandra, H. Lata, and M. A. ElSohly (Cham, Switzerland: Springer International Publishing AG), 1–62.
Small, E., Jui, P. Y., and Lefkovitch, L. P. (1976). A numerical taxonomic analysis of Cannabis with special reference to species delimitation. Syst. Bot. 1, 67–84. doi: 10.2307/2418840
Smith, M. H. (2012). Heart of Dankness: Underground Botanists, Outlaw Farmers, and the Race for the Cannabis Cup. New York, NY: Broadway Books.
Soler, S., Gramazio, P., Figas, M. R., Vilanova, S., Rosa, E., Llosa, E. R., et al. (2017). Genetic structure of Cannabis sativa var. indica cultivars based on genomic SSR (gSSR) markers: implications for breeding and germplasm management. Ind. Crop. Prod. 104, 171–178. doi: 10.1016/j.indcrop.2017.04.043
United States Congress (1970). Comprehensive Drug Abuse Prevention and Control Act of 1970. United States: Public Law.
Vergara, D., Baker, H., Clancy, K., Keepers, K. G., Mendieta, J. P., Pauli, C. S., et al. (2016). Genetic and genomic tools for Cannabis sativa. Crit. Rev. Plant Sci. 35, 364–377. doi: 10.1080/07352689.2016.1267496
Vergara, D., Bidwell, L. C., Gaudino, R., Torres, A., Du, G., Ruthenburg, T. C., et al. (2017). Compromised external validity: federally produced cannabis does not reflect legal markets. Sci. Rep. 7:1. doi: 10.1038/srep46528
Vergara, D., Huscher, E. L., Keepers, K. G., Pisupati, R., Schwabe, A. L., McGlaughlin, M. E., et al. (2021). Genomic evidence that governmentally produced Cannabis sativa poorly represents genetic variation available in state markets. Front. Plant Sci. [Preprint]. doi: 10.3389/fpls.2021.668315
Verity, R., and Nichols, R. A. (2016). Estimating the number of subpopulations (K) in structured populations. Genetics 203, 1827–1839. doi: 10.1534/genetics.115.180992
Wikileaf (2018). Cannabis Strains: Strain Library. Available at: https://www.wikileaf.com/strains/ (Accessed March, 2018).
World Health Organization (2018). Management of Substance Abuse, Cannabis. Available at: http://www.who.int/substance_abuse/facts/cannabis/en/ (Accessed November 15, 2018).
Keywords: Cannabis sativa, NIDA, genotype, marijuana, microsatellite, phenotype, strains, hemp (Cannabis sativa L.)
Citation: Schwabe AL, Hansen CJ, Hyslop RM and McGlaughlin ME (2021) Comparative Genetic Structure of Cannabis sativa Including Federally Produced, Wild Collected, and Cultivated Samples. Front. Plant Sci. 12:675770. doi: 10.3389/fpls.2021.675770
Edited by:
Derek Stewart, The James Hutton Institute, United KingdomReviewed by:
Gordon J. McDougall, The James Hutton Institute, United KingdomMichael Benjamin Kantar, University of Hawaii, United States
Copyright © 2021 Schwabe, Hansen, Hyslop and McGlaughlin. This is an open-access article distributed under the terms of the Creative Commons Attribution License (CC BY). The use, distribution or reproduction in other forums is permitted, provided the original author(s) and the copyright owner(s) are credited and that the original publication in this journal is cited, in accordance with accepted academic practice. No use, distribution or reproduction is permitted which does not comply with these terms.
*Correspondence: Anna L. Schwabe, c2NodzA3MDFAYmVhcnMudW5jby5lZHU=; Mitchell E. McGlaughlin, bWl0Y2hlbGwubWNnYWx1Z2hsaW5AdW5jby5lZHU=