 Jing Gao1,2
 Paula J. M. van Kleeff2,3
 Mark H. de Boer2
 Alexander Erban4
 Joachim Kopka4Dirk K. Hincha4Albertus H. de Boer2,5*
- 1Institute of Apicultural Research, Chinese Academy of Agricultural Sciences, Beijing, China
- 2Department of Structural Biology, Faculty of Earth and Life Sciences, Vrije Universiteit Amsterdam, Amsterdam, Netherlands
- 3Department of Plant Physiology, Swammerdam Institute for Life Sciences, University of Amsterdam, Amsterdam, Netherlands
- 4Department Willmitzer, Max Planck Institute Molecular Plant Physiology, Potsdam, Germany
- 5Department of Medicinal Chemistry, Beta Faculty, Vrije Universiteit Amsterdam, Amsterdam, Netherlands
Salinity is one of the major abiotic stresses that limits agricultural productivity worldwide. Many proteins with defined functions in salt stress adaptation are controlled through interactions with members of the 14-3-3 family. In the present study, we generated three 14-3-3 quadruple knockout mutants (qKOs: klpc, klun, and unpc) to study the role of six non-epsilon group 14-3-3 proteins for salt stress adaptation. The relative growth inhibition under 100 mM of NaCl stress was the same for wild-type (Wt) and qKOs, but the accumulation of Na+ in the shoots of klpc was significantly lower than that in Wt. This difference correlated with the higher expression of the HKT1 gene in klpc. Considering the regulatory role of 14-3-3 proteins in metabolism and the effect of salt stress on metabolite accumulation, we analyzed the effect of a 24-h salt treatment on the root metabolome of nutrient solution-grown genotypes. The results indicated that the klpc mutant had metabolome responses that were different from those of Wt. Notably, the reducing sugars, glucose and fructose, were lower in klpc under control and salt stress. On the other hand, their phosphorylated forms, glucose-6P and fructose-6P, were lower under salt stress as compared to Wt. This study provided insight into the functions of the 14-3-3 proteins from non-epsilon group members. In summary, it was found that these proteins control ion homeostasis and metabolite composition under salt stress conditions and non-stressed conditions. The analyses of single, double, and triple mutants that modify subsets from the most effective qKO mutant (klpc) may also reveal the potential redundancy for the observed phenotypes.
Introduction
Salinity is one of the major abiotic stresses that limits agricultural productivity worldwide. Drought periods, in combination with irrigation, results in an increase in the secondary salinization of agronomically important soils and a loss of crop yield (Fita et al., 2015). At the cellular level, osmotic stress and ion toxicity are the two sides of salt stress that limit growth and, in turn, productivity (Yadav et al., 2011). During the first phase of salt stress, plant growth is inhibited by the osmotic effect, which reduces water uptake and turgor pressure. The second phase then relates to ion over-accumulation resulting in cell death (Munns and Tester, 2008). As a consequence of these two phases, secondary stresses, such as nutritional imbalance, oxidative stress, and infections, are also induced by salt stress (Isayenkov, 2012). Subsequently, the metabolic composition of the plants changes (Richter et al., 2015).
In order to adapt and survive under high-salinity conditions, a signaling network, including various ion transporters, signaling molecules [e.g., Ca2+, abscisic acid (ABA)], transcription factors, protein kinases, organic osmolytes, reactive oxygen species, etc., are triggered when plants are exposed to high salinity (Golldack et al., 2014). For example, SOS3 encodes a calcium sensor and activates SOS2 protein kinase activity in a Ca2+-dependent manner (Halfter et al., 2000). A calcium activated SOS3/SOS2 complex then maintains the cellular Na+ homeostasis through phosphorylation and the activation of the Na+/H+ antiporter SOS1 (Qiu et al., 2002; Quintero et al., 2002). In addition, the SOS3-like Ca2+-binding protein/calcineurin B-like protein (SCaBP8/CBLs) regulates the degradation of 14-3-3 proteins in response to salt stress (Tan et al., 2016). During this salt stress, the phosphorylation and interaction between SOS2-like protein kinase 5 (PKS5) and SOS2 could increase the interaction between SOS2 and Arabidopsis 14-3-3 kappa and lambda, which further repress SOS2 activity (Yang et al., 2019). These findings suggest that 14-3-3 and SOS3 proteins coordinately activate/inactivate the downstream protein kinases SOS2 and PKS5 to regulate cellular Na+ homeostasis. Furthermore, the overexpression of the plasma membrane transporter SOS1 C-term leads to the sequestration of inhibitory 14-3-3 proteins, which makes SOS1 more activated and thereby improving salt tolerance in Arabidopsis (Duscha et al., 2020). Arabidopsis has a single gene that encodes the HKT1 protein, which is expressed in root stellar cells and controls the root:shoot allocation of Na+ by means of Na+ retrieval from the xylem (Xue et al., 2011). The overexpression of AtHKT1 is also conducive to the regulation of K+ status and reduction of Na+ toxicity under salt stress (Wang et al., 2018). In addition, HKT1 and the SOS-pathway are interconnected, since HKT1 mutations suppress the Na+ hypersensitivity of sos3-1 mutant seedlings (Rus et al., 2001; Wang et al., 2019). Thus, Na+ and K+ homeostasis in Arabidopsis under salt stress is improved through the coordinated expression of AtHKT1;1 and AtSOS1 (Wang et al., 2014b).
Salt stress also induces many metabolic changes as a result of an altered gene expression and the post-translational modification of proteins (Sanchez et al., 2008). In particular, the ability to maintain intracellular compatible solute pools can reduce the damage caused by high extracellular osmolality when plants suffer salt stress. Multiple metabolomics studies have also shown that the pool sizes of many metabolites that share the properties of polarity, high water-solubility and no net charge at physiological pH, such as organic acids, amino acids, sugars, polyols, and sulfonium compounds, increase under salinity stress (Alla et al., 2012; Hill et al., 2013; Wu et al., 2013; Richter et al., 2015). Nevertheless, how these global metabolic responses participate in osmotic stress, ion homeostasis, and detoxification and whether the metabolic phenotype correlates with its ability to tolerate certain levels of osmotic stress remain poorly understood.
Proteins from the 14-3-3 family are a class of molecular chaperones that have important functions in the adaptation of plants to salt and drought stress (Chen et al., 2006; Kaeodee et al., 2011). These functions are explained by the interaction of 14-3-3s with proteins that control ion homeostasis (Bunney et al., 2002; De Boer et al., 2013), ABA signaling (Sirichandra et al., 2010; Sun et al., 2015), and metabolism (Chung et al., 1999; Shin et al., 2011). The 14-3-3 protein is also one of the key regulators for coordinating many plant metabolic pathways, e.g., nitrate and carbohydrate metabolism (Lambeck et al., 2010; Gao et al., 2014; Wang et al., 2014a). Furthermore, 14-3-3 proteins do not have enzymatic activity, but act as sensors for target protein phosphorylation, whereby the phosphorylation of a specific motif dramatically increases the affinity for the target, e.g., 14-3-3 proteins bind to the phosphorylated C-terminus of H+-ATPases (Baunsgaard et al., 1998), whereas the phosphorylation of the C-terminal motif can be driven by light (Kinoshita and Shimazaki, 2002), auxin (Takahashi et al., 2012), and salt stress (Shan'ko and Babakov, 2002).
Since 14-3-3 proteins control so many proteins/enzymes with a function in salt stress adaption, it is to be expected that knockout mutations in 14-3-3 genes will result in salt stress-related phenotypes. However, the Arabidopsis genome contains 13 expressed 14-3-3 genes, with redundancy possibly existing between these isoforms (Roberts and De Bruxelles, 2002; Paul et al., 2012). To address the question of redundancy and/or specificity, we generated a range of stacked mutants in the non-epsilon group of 14-3-3 paralogs (Van Kleeff et al., 2014). The analyses of root growth, hormone sensitivity, and, more specifically, the activation of a neutral cytosolic invertase indeed showed both specificity and redundancy among the six genes analyzed (Gao et al., 2014; Van Kleeff et al., 2014). Thus, in this study, we used a set of 14-3-3 quadruple knockout mutants (14-3-3 qKOs) composed of kappa/lambda/upsilon/nu (klun), kappa/lambda/phi/chi (klpc), and upsilon/nu/phi/chi (unpc) to get insight in the role that higher order Arabidopsis 14-3-3 mutants play in ion homeostasis and metabolite production during salt stress adaptation. We determined the accumulation of Na+ and K+ in the rosette leaves and flower stalks of the 14-3-3 qKOs and Wt plants. In addition, the root metabolic profiles of the different genotypes in response to salt stress were analyzed by gas chromatography–mass spectrometry (GC-MS). Principal component analysis (PCA), orthogonal projections to latent structures discriminant analysis (OPLS-DA), and hierarchical cluster analysis (HCA) were used to show that the root metabolite composition of mutant plants differed from those in Wt roots. The expression of HKT1, which was previously identified as significantly altered in salt stress in Arabidopsis, was also investigated by quantitative reverse transcription PCR (qRT-PCR). Taken together, our results demonstrated that 14-3-3 proteins are involved in multiple salt stress-related metabolic and signaling pathways, with both redundancy and specificity between the 14-3-3 proteins.
Materials and Methods
Plant Growth Conditions
The homozygous 14-3-3 quadruple KO mutants were generated by crossing the double mutants as described in a previous study reported by Van Kleeff et al. (2014). The seeds of the homozygous athkt1;1 mutant (Columbia-0) were obtained from the Nottingham Arabidopsis Stock Center (NASC) (N6531). These seeds [Arabidopsis thaliana Columbia ecotype (Col-0)] were also surface-sterilized in 70% ethanol for 10 min, washed in 25% bleach + 0.1% Tween-20 (Sigma-Aldrich, St. Louis, MO, USA) for 10 min, subsequently washed three times with sterilized MilliQ (Millipore, Burlington, MA, USA), and resuspended in 0.1% sterile agarose. The seeds were then placed onto a half-strength Murashige and Skoog (MS) medium (Murashige & Skoog, 1962; Sigma-Aldrich, Hamburg, Germany) solidified with 1% of plant agar (Sigma-Aldrich, Burlington, MA, USA) (pH 5.8) and stratified for 3 days at 4°C. For germination, plates were placed vertically in a growth chamber with 14 h of light, 170 μmol m−2 s−1 (22°C)/10 h of darkness (18°C). For the biomass and ion content measurement, the seedlings were transplanted to 8-cm pots (with one seedling per pot) filled with regular garden soil in a greenhouse 15 days after germination. Plants were then watered every 2 days. For NaCl treatment, the pots were incubated in 2-cm deep water and supplemented with 0 or 100 mM NaCl for 2 h. This was repeated twice with a 3-day interval. After 14 days, the plants were harvested, and the fresh weight of the rosette leaves and flower stalks was immediately determined. After weighing, the plant material was dried at 75°C for 2 days, with the dry material subsequently being used for Na+ and K+ content measurement.
Na+ and K+ Content Measurement
Na+ and K+ concentrations were determined in leaves and flower stalks by high performance liquid chromatography (HPLC Shimadzu Class-LC10A system, Shimadzu Corporation, Kyoto, Japan). Then, the oven-dried plant material was ground into a powder using a mortar and pestle. After that, 5 mg of the dried material was weighed and boiled in tubes containing 5 ml of MilliQ water for 1 h at 100°C in a water bath. After boiling, samples were filtered through 0.2-mm filters (Whatman, Maidstone, United Kingdom) and Na+ and K+ concentrations were determined by injecting 5 μl of sample in a Shimadzu HPLC system (10 Series, Shimadzu) equipped with an IC-YS50 column (Shimadzu). As an eluent, 4 mM of methane sulfonic acid was used in an HPLC-grade H2O (J.T. Baker, Deventer, the Netherlands) with a flow rate of 1 ml/min. A calibration curve was then made by injecting 1, 2, 5, 10, and 25 μl of a standard solution containing 5 mM of NaCl and 5 mM of KCl.
Water Loss Rate
The rate of water loss in Wt plants and 14-3-3 mutants growing in the green house was measured. These plants were grown in pots with regular garden soil for 24 days before salt treatment. Each pot was covered with aluminum foil to prevent water loss from the soil surface. The next day, the plants were placed in trays with water or 100 mM of NaCl (pots were 3 cm deep in the solution). The pots were left for 3 h to absorb the water or salt, followed by the removal of adhering water, and then the weight loss of each pot was recorded over time inside the greenhouse. After the experiment, the shoot fresh weight of each plant was determined and used to calculate the rate of water loss per unit time per unit fresh weight.
Real-Time PCR Assay
To analyze the expression pattern of AtHKT1 in the Wt plants and 14-3-3 mutants, quantitative RT-PCR analyses were performed. The plants used were from the same batch of plants that were used for the transpiration experiment. Here, the greenhouse plants were treated with 0 or 100 mM of NaCl for 1 day. Then, the plants were carefully pulled from the soil, with between 1 and 2 cm of the main root being harvested and the roots from three plants being pooled for each treatment. Furthermore, the soil was carefully removed and the taproots were frozen in liquid nitrogen. The total RNA was extracted from the root tissue using the NucleoSpin® RNA Plant Kit (Macherey-Nagel, Düren, Germany), and first-strand cDNA was synthesized from 2 mg of the total RNA using the Superscript II Kit (Invitrogen, Waltham, MA, USA) with oligo d(T)18 primers according to the instructions of the manufacturer. Quantitative RT-PCR reactions contained 100 ng of cDNA, 1 pmol of each primer (HKT1, forward primer 5′-3′ TATGGGTTTGCAGGACGATGGAGT, reverse primer 5′-3′ GCCAGATTTGGCTGTGAACTGCTT; Actin 2 forward primer 5′-3′ AGTGGTCGTAC AACCGGTATTGT, reverse primer 5′-3′ GATGGCATGAGGAAGAGAGAAAC; UBQ5 forward primer 5′-3′ AGGCGAAGATCCAAGACAAG, reverse primer 5′-3′ TGAACCTTTCCAGATCCATCG), and 2 × SYBR Green PCR buffer (Bio-Rad, Hercules, CA, USA). The PCR conditions for the amplification of HKT1 and actin were as follows: 1 min at 94°C, followed by 30 cycles of 45 s at 94°C, 60 s at 54°C and 75 s at 72°C. The PCR products were examined according the 2−ΔΔCT method (Livak and Schmittgen, 2001). Finally, five biological replicates and three technical replicates were analyzed.
Metabolome Profiling
For the metabolomics analysis in the roots of the 14-3-3 qKOs, the plants were grown in a greenhouse with a one-half strength Hoagland solution, i.e., 3 mM of KNO3, 2 mM of Ca(NO3)2, 1 mM of NH4H2PO4, 20 μM of Fe-EDTA,0.5 mM of MgSO4, 1 μM of KCl, 25 μM of H3BO3, 2 μM of MnSO4, 2 μM of ZnSO4, and 0.1 μM of CuSO4,0.1 μM of (NH4)6Mo7O24 at pH 5.5. When the plants were 22 days old, the Hoagland solution was replaced by a fresh identical solution or by a one-half strength Hoagland solution supplemented with 100 mM of NaCl. After 24 h, the roots were harvested, immediately rinsed with Milli Q water for 10–20 s, dried rapidly on tissue paper, and snap frozen in liquid nitrogen. Total root systems were ground in liquid nitrogen, weighed, and stored until further processing at −80°C.
Metabolite profiling by GC-time of flight–MS (GC-TOF-MS) was performed as described in previous studies (Lisec et al., 2006; Erban et al., 2007) by split-less and subsequent split injections of the same samples (Supplementary Table 1). Approximately 50 mg of frozen ground material was then homogenized in 300 μl of methanol at 70°C for 15 min. Then, 200 μl of chloroform was added, and extraction continued at 37°C for 5 min. Next, the polar fraction was prepared by liquid partitioning through the addition of 400 μl of water. A dried 160 μl aliquot of the polar fraction was then chemically derivatized by methoxyamination and subsequent trimethylsilylation. After that, samples were analyzed using GC-TOF-MS (ChromaTOF software, Pegasus driver 1.61; LECO Instrumente GmbH, Mönchengladbach, Germany). Furthermore, the chromatograms and mass spectra were evaluated using the TagFinder (Luedemann et al., 2008) and NIST05 softwares (http://www.nist.gov/srd/mslist.cfm). Metabolite annotation was manually supervised using the mass spectral and retention index collection of the Golm Metabolome Database (Kopka et al., 2005; Hummel et al., 2010), with the annotation criteria being reported in Supplementary Table 1. The peak heights of the recorded mass fragments were normalized on the basis of the fresh weight of the sample and an internal standard added during extraction [(13C6)-sorbitol] and subsequently maximum scaled per metabolite, i.e., normalized abundances (Watanabe et al., 2013). Each condition was analyzed by 4–5 biological replicates.
Data Analysis
The biomass and Na+ and K+ concentrations were tested using a two-way ANOVA followed by a Tukey test for multiple comparisons (p < 0.05) using SPSS 19.0. The normalized abundances of the annotated known yet non-identified metabolites from the root metabolite profiles were statistically assessed by ANOVAs, a Mack–Skillings test, and pairwise comparisons via a heteroscedastic Student's t-test. These calculations and heat map visualizations were performed by the Multi-Experiment Viewer software, MeV [Version 4.9.0; http://www.tm4.org/mev/ (Saeed et al., 2003, 2006)], or by Microsoft Office Excel 2016 and the SAS statistical analysis software (SAS Institute Inc., Cary, NC, USA). Then, the log2-transformed response ratio data were subjected to multivariate analysis by fitting PCA-X and OPLS-DA using the SIMCA-P software v.14.1 (Umetrics, Umea, Sweden). A hierarchical clustering analysis of selected metabolites was also performed by MeV (Version 4.9.0) using the replicate means of the Wt plants.
Results
14-3-3 Mutants Show Reduced Na+ Accumulation During Salt Stress
Three 14-3-3 quadruple KOs, namely, kappa/lambda/phi/chi (klpc), kappa/lambda/upsilon/nu (klun), and upsilon/nu/phi/chi (unpc), were used in this study. The quadruple mutants were generated by crossing two double mutants: kl*pc, kl*un, and un*pc (Supplementary Figure 1A) (for details, see Van Kleeff et al., 2014). T-DNA insertions were also monitored using PCR, and the mutants were scored on full-length 14-3-3 transcripts (Supplementary Figure 1B). To check whether the 14-3-3 protein levels were altered by the loss of four 14-3-3s, Western blotting with a 14-3-3 antibody [pan 14-3-3, (K-19) (Santa Cruz Biotechnology, Santa Cruz, CA) was performed to analyze the 14-3-3 protein levels in the 14-3-3 qKOs (Supplementary Figure 1C). As a result, a loss of the upper band was observed in the klun mutant, suggesting that the reduction in the total 14-3-3 protein levels was consistently observed in klun.
To evaluate the physiological effects of high salinity on the three 14-3-3 qKOs, plants were germinated for 15 days on agar plates and then grown with garden soil in a greenhouse. The experiment plants were then exposed to 0 or 100 mM of NaCl during the last 2 weeks. Shoot fresh weight and the accumulation of Na+ and K+ in rosette leaves (L) and flower stalks (F) of the mutants were also determined and compared to those of the Wt plants. As a Na+ hyper-accumulator, we also included the Athkt1 mutant in the experiment. Two independent experiments were done: one in the winter (Exp. 1: from December to January, with 18–20°C, 8-h photoperiod, and a relative humidity of 70%) and the other in the summer (Exp. 2: from July to August, with 25–28°C, 14-h photoperiod, and a relative humidity of 75%).
Plant Growth
A two-way ANOVA showed a significant varietal effect of salinity on the fresh weight of rosette leaves of all experiment plants after the 100-mM NaCl treatment (P < 0.001), while there were no significant interactions between genotype and NaCl treatment (Figure 1 and Supplementary Table 1). Overall, the mutant plants showed the same relative growth inhibition by salt as the Wt plants (~30–40%) (Supplementary Figures 2, 3). The unpc mutant showed a higher reduction in rosette leaf growth with 100-mM NaCl compared to Wt (two-way ANOVA interaction, P < 0.001), while the other two 14-3-3 qKOs (klpc and klun) were indistinguishable from Wt (Figures 1A,B). Furthermore, the inflorescence fresh weight and flower stem length of the klun mutant was much lower than those of the Wt plants (Figures 1C–F). In the experiment conducted in the winter, klpc and unpc also showed shorter flower stems compared with Wt plants, but the differences were not observed in the experiment that was carried out in the summer (Figures 1E,F). Notably, the roots were not included since it was not possible to harvest all the roots of each plant from the soil.
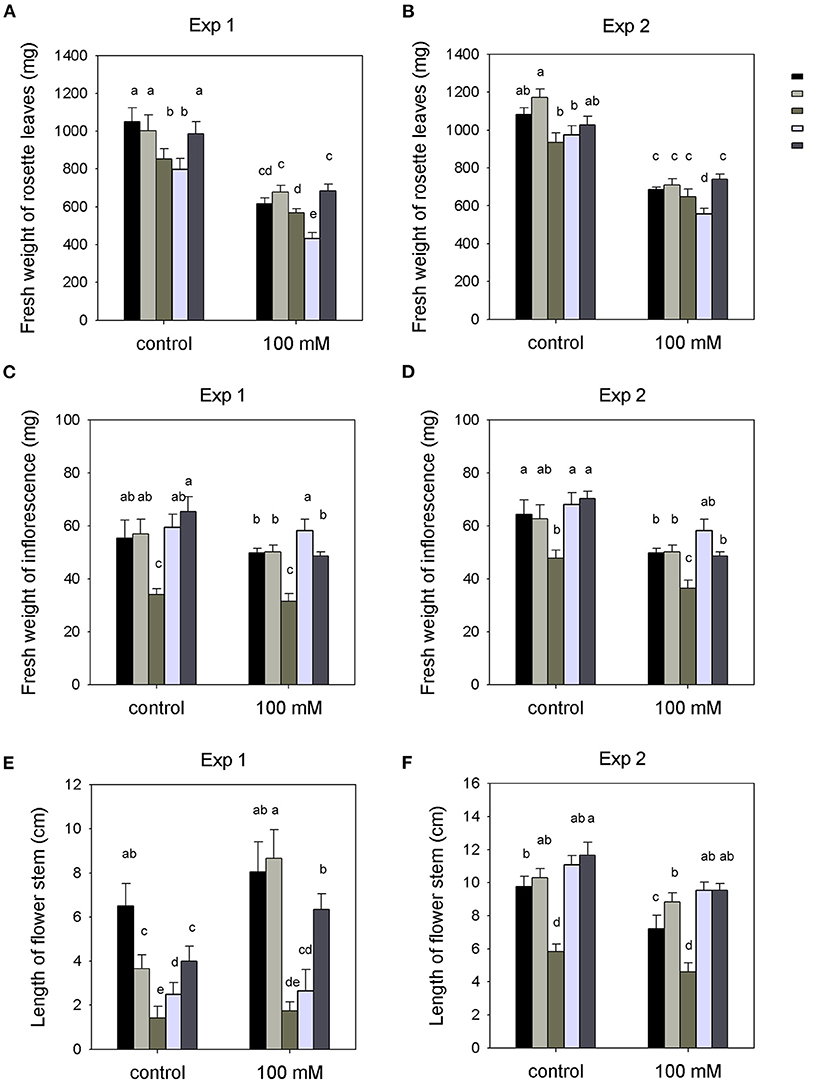
Figure 1. Shoot biomass production of wild-type (Wt), 14-3-3 quadruple knockout mutants (qKOs), and hkt1 mutant plants grown in soil with and without (= control) the addition of 100 mM of NaCl to the pots. Two independent experiments were done: Exp. 1 (in the winter) and Exp. 2 (in the summer). (A,B) fresh weight of rosette leaves. (C,D) fresh weight of inflorescence. (E,F) length of flower stem. Values are averages ± SE (n = 3~5). Different letters above the column indicate significant differences between the treatments or genotypes according to a two-way ANOVA (P < 0.05; Tukey's test). Statistics can be found in Supplementary Table 1.
Sodium and Potassium Concentrations
Next, we evaluated salt accumulation as Na+ and K+ contents in the shoots. The amounts of Na+ and K+ in rosette leaves and flower stalks are shown in Figure 2. The Na+ and K+ contents of rosette leaves were significantly influenced by genotype and NaCl treatment, and there were significant interactions between genotype and NaCl treatment (Supplementary Table 2). The Na+ hyper-accumulating phenotype of hkt1 plants as reported in other studies (Maser et al., 2002; Rus et al., 2006; Jha et al., 2010) was also evident in our study; for instance, even in plants from pots where no NaCl was added, the hkt1 plants accumulated relatively large amounts of Na+ in the shoots (P < 0.001). This showed that, even at low soil Na+ levels, an efficient Na+-exclusion mechanism is operational in Wt and 14-3-3 mutant plants. Furthermore, in the summer experiment, all 14-3-3 mutant plants grown without salt had significantly less Na+ in the leaves than Wt plants, whereas the Na+ content of the flower stalks was the same (Figures 2A,C). However, the 14-3-3 mutant plants grown in low-Na+ soil had similar levels of Na+ in the leaves and flower stalks compared to Wt plants in the winter experiment (Figures 2B,D). Additionally, salt-treated Wt and 14-3-3 mutant plants showed a 2- to 3-fold increase in Na+ in both experiments. However, under both summer and winter conditions, the klpc mutant contained significantly less Na+ in the leaves and stalks as compared to Wt plants (35–45% less) (two-way ANOVA interaction, P < 0.001). As expected, the hkt1 mutant showed strong reductions in K+ concentrations in the rosette leaves as compared to those in Wt plants, both in control and salt-stressed plants (P < 0.001, Figures 2E,F). However, in the flower stalks, there was little to no reduction in K+ accumulation (Figures 2G,H); this is noteworthy in view of the high level of Na+ accumulation in the hkt1 flower stalks under all conditions (Figures 2A–D). How this differential flow of Na+ was achieved remains an intriguing question. In the 14-3-3 mutant plants, klpc showed a significant reduction in the K+ content of rosette leaves as compared to that in Wt leaves, both in control and salt-stressed conditions (Figures 2E,F). However, the K+ content of the klpc flower stalks was the same as those of Wt plants (Figures 2G,H).
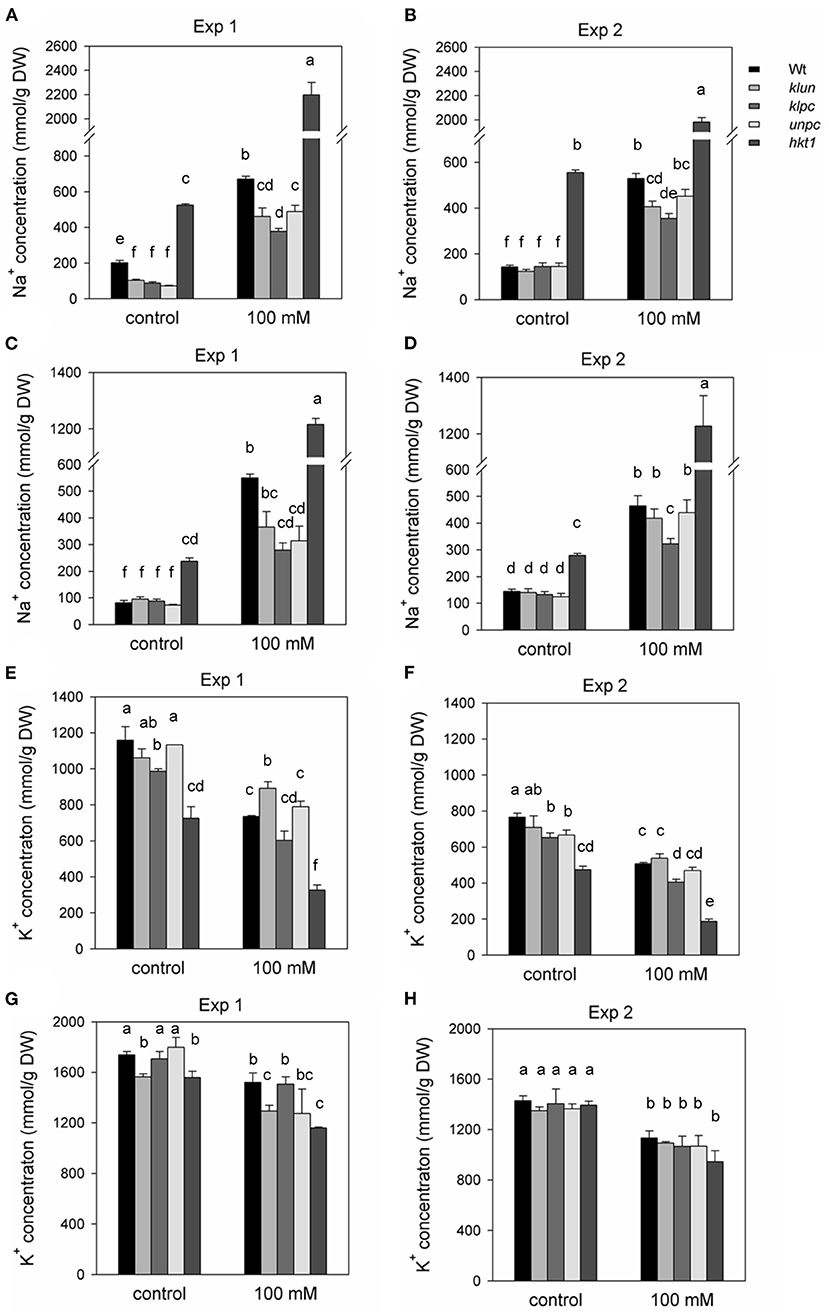
Figure 2. Na+ and K+ contents of the rosette leaves and flower stalks of Wt, 14-3-3 qKOs, and hkt1 mutant plants grown in soil with and without (= control) the addition of 100 mM of NaCl. Two independent experiments were done: Exp. 1 (in the winter) and Exp. 2 (in the summer). (A,B) Na+ content of rosette leaves. (C,D) Na+ content of inflorescence. (E,F) K+ content of rosette leaves. (G,H) K+ content of inflorescence. Values are averages ± SE (n = 3~5). Different letters above the column indicate significant differences between the treatments or genotypes according to a two-way ANOVA (P < 0.05; Tukey's test). Statistics can be found in Supplementary Table 2.
Na+/K+ Ratio
Maintaining a low Na+/K+ ratio is a good strategy for plants to adapt to salt stress (Serrano and Rodriguez-Navarro, 2001). Figure 3 shows the Na+/K+ ratios as calculated from the data shown in Figure 2. The Na+/K+ ratio of hkt1 plants was very high (ranging from 5 to 7), although this was not reflected in the salt-dependent reduction of growth (Figure 1). Under salt stress, leaves (not the stalks) of the klun plants showed a significantly lower Na+/K+ ratio than Wt plants (Figures 3A,B), whereas the flower stalks (not the leaves) of the klpc plants showed a significantly lower ratio than Wt plants (Figures 3C,D). Therefore, although we found clear differences in the Na+ and K+ accumulations and ratios between Wt and mutant plants, we did not find a correlation between ion homeostasis and growth performance under salt stress, not even for the hkt1 mutant plants.
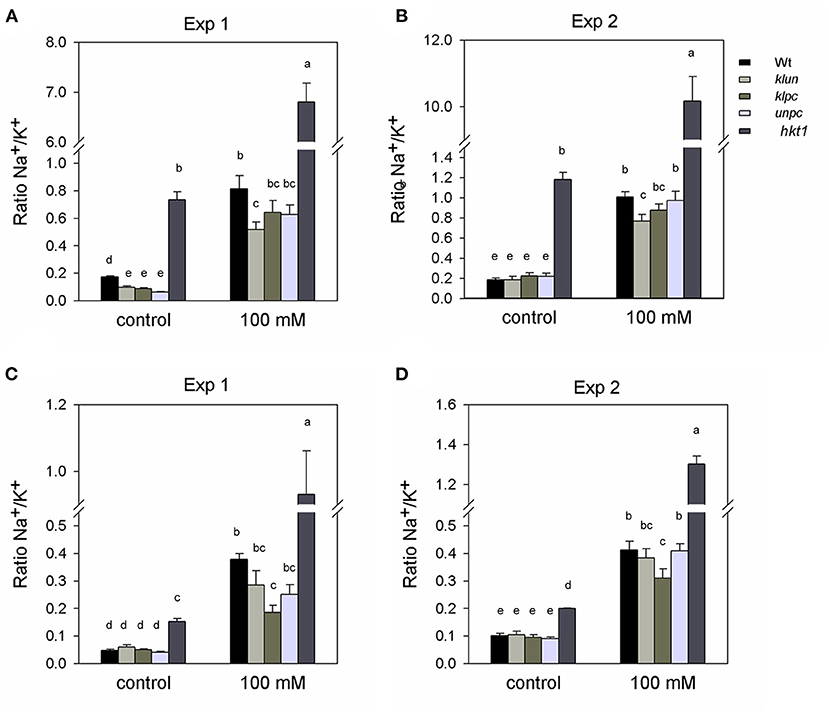
Figure 3. Na+:K+ ratio calculated for the rosette leaves and inflorescence of Wt, 14-3-3 qKOs, and hkt1 mutant plants, grown with and without (= control) the addition of 100 mM of NaCl. Two independent experiments: Exp. 1 (in the winter) and Exp. 2 (in the summer). (A,B) Na+: K+ ratio of rosette leaves. (C,D) Na+: K+ ratio of inflorescence. Values are averages ± SE (n = 3~5). Different letters above the column indicate significant differences between the treatments or genotypes according to a two-way ANOVA (P < 0.05; Tukey's test). Statistics can be found in Supplementary Table 3.
Rate of Water Loss of 14-3-3 Quadruple Mutants
Since the role of 14-3-3 proteins in stomatal opening and development is well-documented (Kinoshita et al., 2003; Tseng et al., 2012; Sun et al., 2014), the delivery of Na+ and K+ from roots to shoots by the transpiration stream might be affected by mutations in the 14-3-3 genes, e.g., the lower Na+ concentrations in the shoot of klpc plants could be the result of reduced stomatal openings and a lower overall transpiration rate. To test this hypothesis, Wt, klun, klpc, and unpc plants grown in the green house were exposed to 0 or 100 mM of NaCl for 3 h, and the rates of water loss (decrease in fresh weight per hour) were measured after 1 h. As shown in Figure 4, salt stress caused a significant decrease in the transpiration of the salt-treated Wt plants, while all three 14-3-3 qKO mutants maintained their transpiration rates despite the salt treatment. Therefore, transpiration differences between Wt and qKOs do not provide an explanation for the reduction in the Na+ accumulation in the klpc mutants.
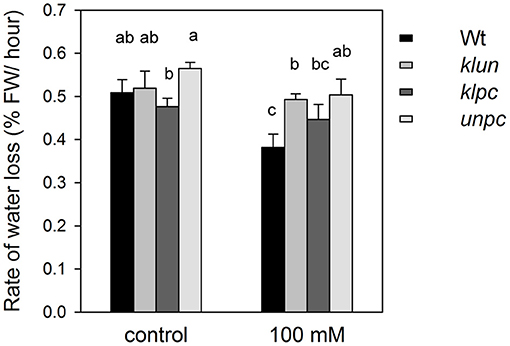
Figure 4. Water loss by transpiration of 24-day-old Wt and 14-3-3 qKO plants grown in soil and treated with 0 (= control) or 100 mM of NaCl for 3 h. Transpiration was calculated by monitoring the decrease in pot weight over several hours. Values are averages ± SE (n = 6). Different letters indicate significant differences between the treatments or genotypes according to a two-way ANOVA followed by Tukey's test. Fgenotype = 6.936 (P = 0.015), Ftreatment = 1.303 (P = 0.059), and Fgenotype×treatment = 0.087 (P = 0.771).
AtHKT1 Expression Is Altered in the klpc Mutant
The analysis of the hkt1 mutant plants (Figure 2) clearly showed the dramatic effect of the absence of a functional HKT1 protein on Na+ and K+ accumulations in the shoots. Therefore, if 14-3-3 proteins act as repressors of the salt-induced expression of HKT1, e.g., through their interaction with the SOS2 kinase (Zhou et al., 2014), and assuming a coordinating role for the activated SOS2 in HKT1 expression (Wang et al., 2014b), then this might explain the observed changes in Na+/K+ homeostasis in the 14-3-3 mutants. Obvious physiological changes of plants require exposure to long-term high salt stress, but gene expression will respond within 24 h (Huang et al., 2012). Therefore, we measured the gene expression of HKT1 in the primary roots of the Wt plants and 14-3-3 qKOs after 24-h exposure to high salinity by quantitative real-time PCR (qPCR). As shown in Figure 5, the HKT1 transcript levels in Wt were significantly higher in Wt plants after treatment with NaCl (1.41-fold). The HKT1 transcript levels in unpc and klun were also comparable to those in Wt plants, with and without salt stress. However, salt-treated klpc plants showed a more than 2-fold higher expression of HKT1 compared to Wt plants (Figure 5). To avoid biased normalization under salt stress, UBQ5 was also used as a reference gene according to the recommendations of various abiotic stress studies. After salt treatment, the HKT1 transcript levels in klpc were also higher than those in Wt and the other two 14-3-3 KOs, albeit not significantly (p > 0.05; Supplementary Figure 4). Therefore, we concluded that the reduction in the accumulation of Na+ in the shoots of klpc correlates with a higher level of HKT1 expression in the main roots of this mutant. Furthermore, we found that the combination of the KLPC 14-3-3 proteins negatively regulates HKT1 expression, either directly or indirectly.
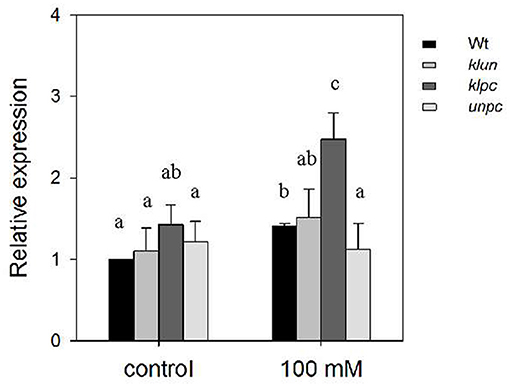
Figure 5. Relative expression of HKT1 in the primary root of Wt and 14-3-3 qKO plants grown with and without 100 mM of NaCl. Soil-grown plants (aged 24 days) were treated with 0 or 100 mM NaCl for 1 day and then had their primary roots harvested (first 2 cm below the rosette leaves) and total RNA extracted. Each sample was assayed three times. Expression levels were normalized to Actin and then to the HKT1 expression level of the Wt plants under control conditions. Different letters indicate the means ± SD, which are significantly different at p < 0.05 (ANOVA followed by Tukey's test, n = 5 biological replicates). Fgenotype = 4.302 (P = 0.011), Ftreatment = 42.132 (P < 0.001), and Fgenotype×treatment = 1.522 (P = 0.234).
Metabolome Profiling of Wt and 14-3-3 qKOs Roots
Although salt stress is known to alter the levels of many metabolites (Hill et al., 2013) and 14-3-3 proteins play a crucial role in many metabolic pathways (Diaz et al., 2011; Swatek et al., 2011), little is known about the role of 14-3-3 proteins in salinity-induced changes of the metabolome. Since roots are the primary organs involved in ion homeostasis and salt tolerance for plants, we hypothesized that 14-3-3 proteins are instrumental in the salt-induced changes of the metabolite profile. Thus, we tested this assumption by generating the metabolic profiles of roots from Wt plants and the 14-3-3 qKOs. Because it was impossible to harvest all the roots of each plant from the soil, we switched to hydroponics (with a one-half strength Hoagland) to grow plants. After being exposed to 0 or 100 mM of NaCl for 24 h, the total root systems of the 14-3-3 qKO and Wt plants were harvested for an analysis of the metabolomics changes under salt stress. A total of 153 metabolites in the control and salt-treated plants were monitored by the GC-TOF-MS profiling of a metabolite fraction enriched for primary metabolites. This set included 80 known annotated metabolites and 73 known yet non-identified metabolites (Supplementary Table 1).
To visualize the metabolomic changes of Wt and the three 14-3-3 qKOs in response to salt stress, PCA and OPLS-DA of the complete metabolite profiling data were used to predict the way the samples were grouped and distributed (Figure 6). The non-supervised PCA scatter plot showed that the samples were clustered with respect to their treatments. The first two principal components (PC1 and PC2) accounted for a total of 47.1% of the variances. Subsequently, the supervised OPLS-DA revealed the clear separation between the klpc mutant from the Wt plants and the other mutants under both stressed and control conditions (Figure 6B). A combination of a two-way ANOVA, Mack–Skillings analyses, and the statistical testing of pairwise comparisons with all tests set to a threshold of P < 0.01 identified 51 known metabolites and 48 known yet non-identified compounds that were either stress responsive or relevant for the distinction among mutants and Wt. At the same significance threshold, we did not find apparent interactions between the factors of stress and genotype (Supplementary Table 1). We selected the subset of 51 relevant and known metabolites for an HCA applying Pearson's correlation and complete linkage to log2-transformed response ratios calculated relative to the mean Wt control (Figure 7). In agreement with the PCA analysis, HCA demonstrated that salt stress was the main factor of the experiment. Furthermore, the HCA of the relevant known metabolites confirmed that the central metabolism of the klpc mutant deviated most from Wt, klun, and unpc under both stressed and non-stressed conditions. We identified the six clusters (I–VI) of metabolites that represent the different response patterns of metabolites to salt stress across genotypes (Figure 7). Clusters I–III contained metabolites that accumulated in response to salt stress, whereas clusters IV–VI contained metabolites that did not change or decreased relative to control conditions. Notably, several metabolites, such as proline, galactinol, raffinose, and ascorbic acid, of cluster II accumulated highly across all tested genotypes. However, less extremely accumulating metabolites sorted into cluster I. Furthermore, the phosphorylated sugars of cluster VI, e.g., glucose-6P and fructose-6P, commonly depleted in response to salt stress. Metabolites that decreased less in response to salt stress also partitioned into clusters IV and V. Additionally, several clusters indicated mutant-specific metabolic changes under control conditions and specifically highlighted the changes caused by the klpc mutation. Cluster III also contained metabolites that accumulated in klpc under control conditions and remained upregulated under salt stress. Inversely, cluster IV contained metabolites that decreased in klpc under control conditions and remained decreased under salt stress. In summary, this analysis confirmed the largely common metabolic changes in salt-stressed roots across the genotypes but indicated characteristics and, in the case of klpc, performed metabolic changes under control conditions.
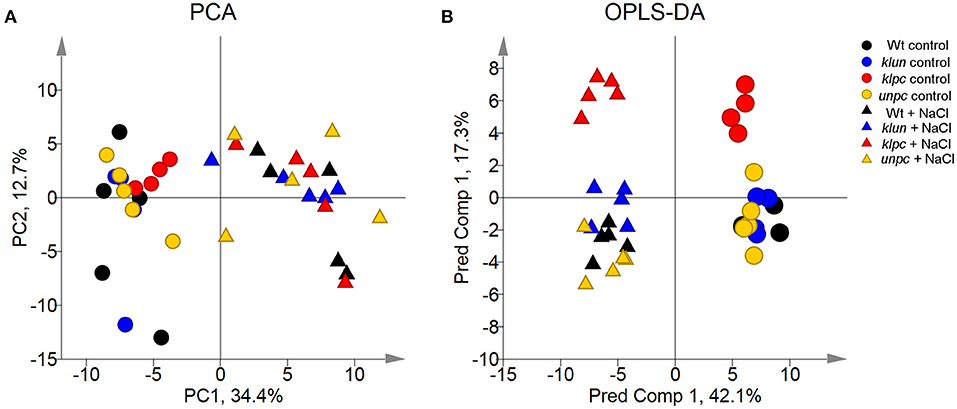
Figure 6. Principal component analysis (PCA) and orthogonal projections to latent structures discriminant analysis (OPLS-DA) score scatter plots of the metabolite profiles of klpc, klun, unpc, and Wt plants. (A) Principal component (PC) 1 and PC 2 represent the first two principal components accounting for a total of 47.1% of the variances. (B) The OPLS-DA model of the metabolic profiles shows three significant components with R2X, R2Y, and Q2 values of 0.639, 0.403, and 0.298, respectively. Log2-transformed response ratios based on the replicate medians of all measured metabolites relative to the Wt control were analyzed. Each condition was analyzed by 4~5 biological replicates. Missing values were replaced by 0 after log2-transformation. Different colored symbols indicate the different genotypes. Circle symbols, control samples; triangle symbols, salt-treated samples.
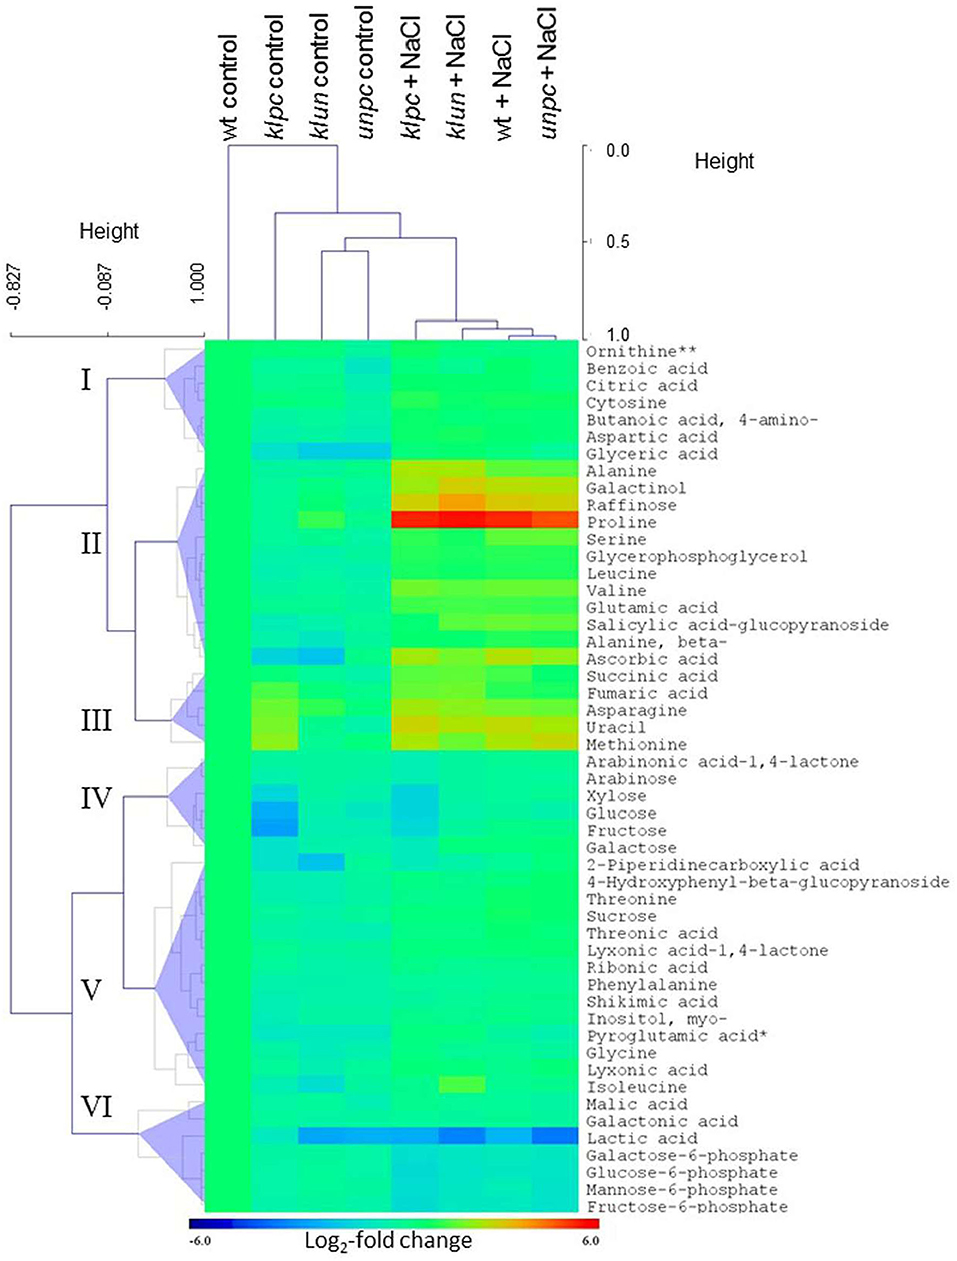
Figure 7. Pearson's correlation of log2-transformed response ratios comparing the metabolic salt stress responses of roots from the 14-3-3 quadruple mutants to the Wt salt stress response. Response ratios of klun, klpc, unpc, and Wt metabolite pools under salt stress were calculated relative to the Wt control and averaged across replicate measurements before log-transformation (n = 4–5). Each item represents a metabolite. The correlation coefficient (r2) of the Pearson's correlation and the linear equation are reported by inserts. Note the lower correlation coefficient (r2) and deviation of the linear slope from 1 of the comparison between klpc and Wt.
14-3-3 qKO Specific Metabolic Changes
These observations prompted us to assess the degree of commonality between Wt responses to salt stress and the respective 14-3-3 qKO mutant responses. For this purpose, we analyzed the bi-plots of the salt-induced log2-transformed relative changes in the mutants compared to Wt (Figure 8). This analysis revealed that the klpc mutant had the most divergent salt stress response, according to Pearson's correlation, r2 = 0.79, in comparison to Wt plants. In contrast, the klun and unpc salt responses were more similar to the Wt, as was indicated by r2 = 0.894 and 0.931, respectively (Figure 8).
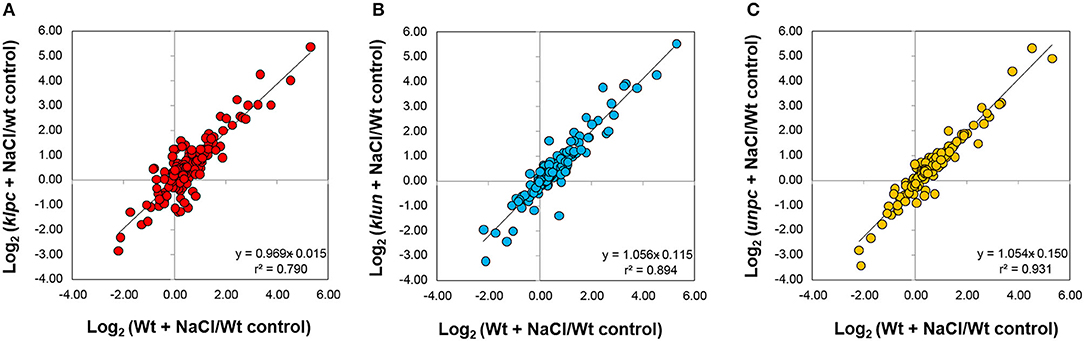
Figure 8. Hierarchical cluster analysis (HCA) and the heat map of metabolite profiles of the klpc, klun, and unpc mutants and Wt plants. HCA was performed using log2-transformed response ratios relative to Wt control means (n = 4–5). Pearson's correlation (r) and complete linkage were applied. The analysis was based on 51 known metabolites selected at P < 0.01 of either a two-way ANOVA, Mack-Skillings tests, or heteroscedastic Student's t-tests (Supplementary Table 1). Clusters I–VI were defined below half the height of the metabolite clustering tree. The color key indicates the relative changes in metabolites compared to Wt plants (Log2-fold changes). Note the similarity of metabolite profiles from klun, unpc, and Wt plants under salt stress and control conditions and the corresponding dissimilarity of klpc plants. **Due to the constraints of the GC-MS-based metabolite profiling, ornithine represents the sum of arginine, citrulline, and ornithine.
To visualize the induced production of metabolites in response to salinity, we selected metabolites that were significantly changed (P < 0.01, heteroscedastic Student's t-test) compared to Wt plants cultivated under control conditions (Table 1). This analysis revealed that 30 known metabolites changed significantly in at least one genotype in response to salt treatment. By far, most of the salt-responsive metabolites accumulated and were common among Wt and the mutants, e.g., the top-ranking proline, galactinol, raffinose, and ascorbic acid (Figure 7 and Table 1), while only a few metabolites decreased according to this selection, e.g., mannose-6P and galactose-6P. These metabolites were already reduced by tendency in Wt, but became significantly reduced in the 14-3-3 qKO mutants (P < 0.01) compared to the Wt control. Furthermore, the general metabolic shifts of 14-3-3 qKOs and Wt were highly similar, but several attenuations or losses of significance were detected in the 14-3-3 qKOs, e.g., galactonic acid and shikimic acid in all three qKOs, alanine in klun and unpc, and salicylic acid-glucopyranoside that accumulated less in klpc.
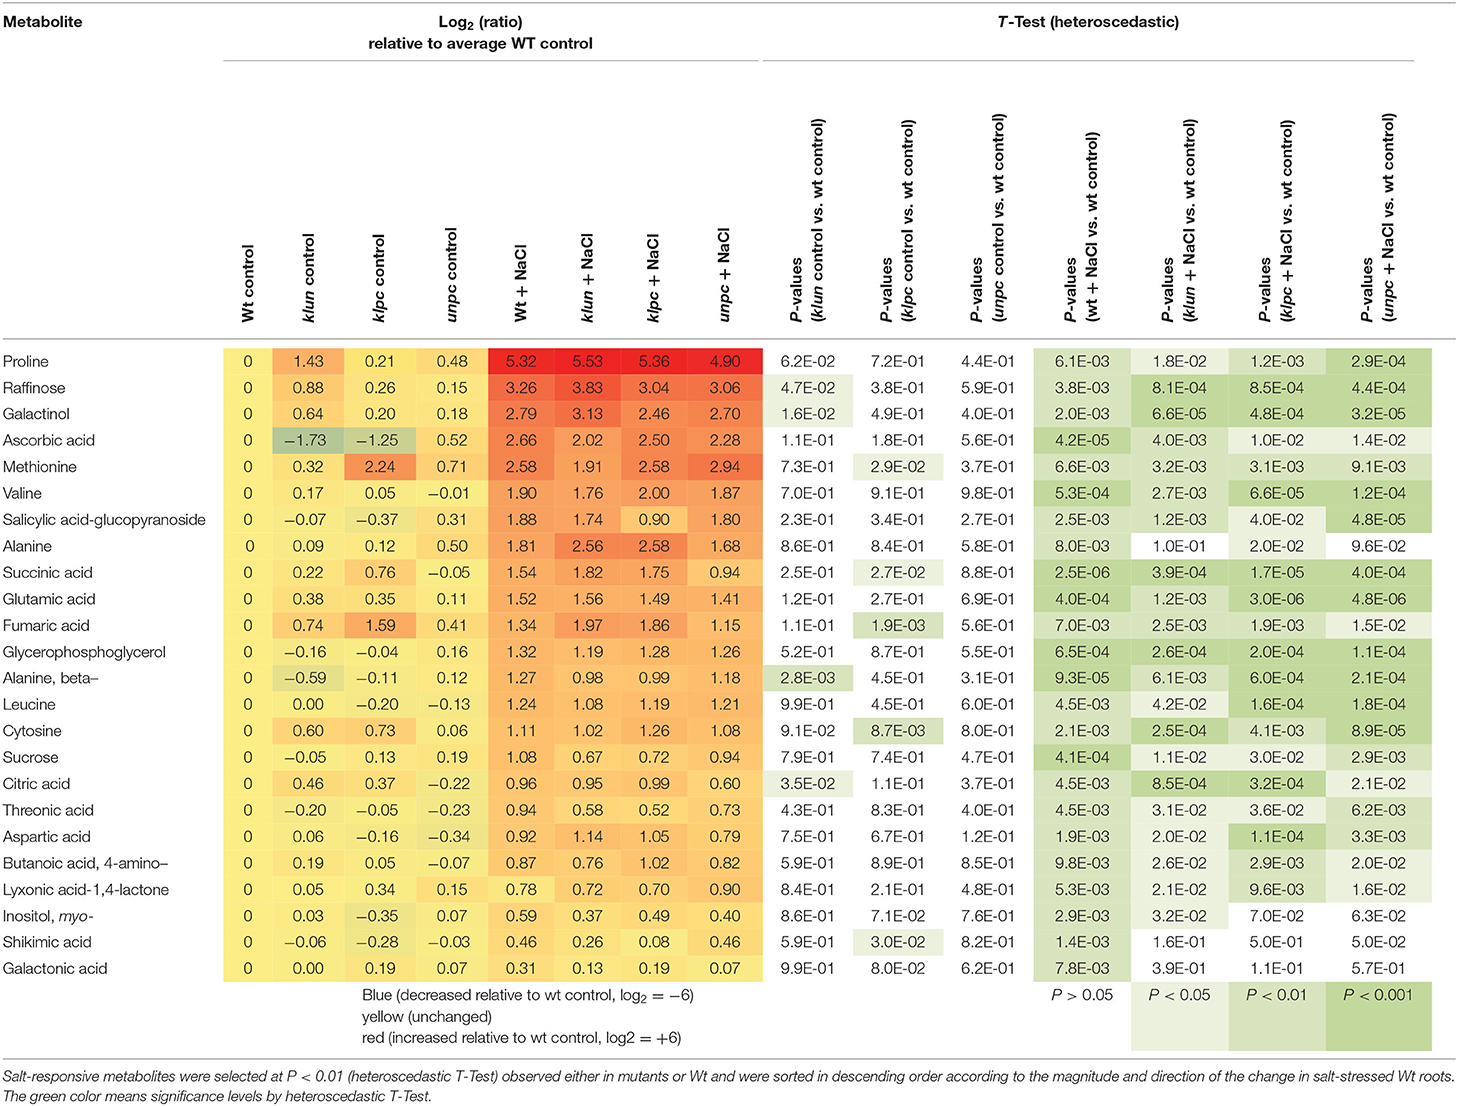
Table 1. Salt-responsive metabolites of Wt roots compared to klun, klpc, and unpc mutant roots.
To identify the specific differences among the metabolic responses to NaCl, the metabolite profiles of Wt plants and 14-3-3 qKOs were evaluated for differential salt-responsive metabolites (Supplementary Table 1). At this significance threshold, we found no common difference of all mutants vs. Wt. We only found a single significant change each for klun and unpc, namely, sucrose and succinic acid, respectively. In contrast, nine known metabolites (Table 2) and three non-identified compounds (Supplementary Table 1) were different for klpc. Fructose, glucose, and several minor carbohydrates, such as galactose, arabinose, and xylose, were, in part, more than 2-fold decreased under salt stress relative to the Wt control. Many of these changes were already present and more extreme under control conditions, e.g., fructose, glucose and galactose (Table 2). Furthermore, a subsequent analysis of mutant-specific metabolic changes under control conditions revealed five differential known metabolites (Table 3) and seven known yet non-identified compounds (Supplementary Table 1). Most of the preformed metabolic changes were observed in klpc, namely, asparagine, fumaric acid, cytosine, and fructose, as expected (Table 2). However, unpc had no significant difference to Wt under control conditions. klun, on the other hand, had decreased beta-alanine levels, shared accumulation of asparagine, and a tendency for fumaric acid and cytosine under control conditions (Table 3).
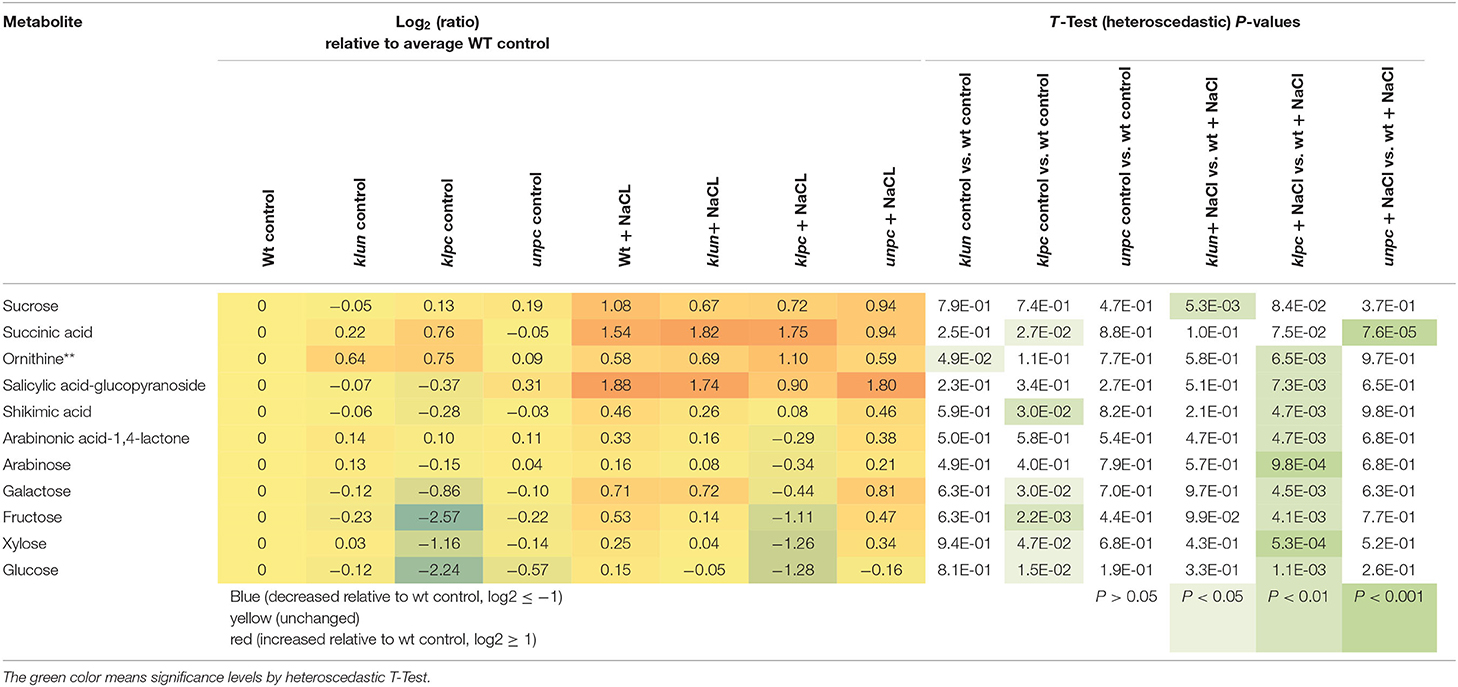
Table 2. Differential metabolic response to salt stress in klun, klpc, and unpc mutant roots compared to Wt. Log2 (ratios) and significance values (P < 0.01, heteroscedastic T-Test) are listed.
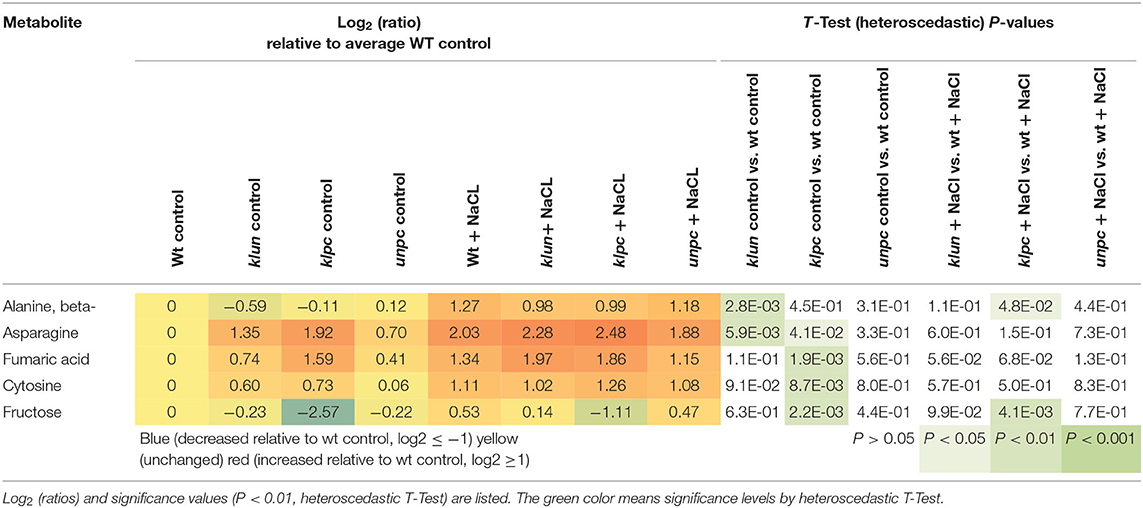
Table 3. Differential metabolic changes in klun, klpc, and unpc mutant roots compared to Wt under control conditions.
Taken together, the supervised statistical analyses confirmed and refined the global observations made by the PCA and HCA analyses. Our analyses suggested that the metabolic responses to salinity between the Wt and 14-3-3 qKOs were largely similar, and that preformed isoform-specific differences exist at the metabolome level in the klpc mutant.
Exemplary Differential Metabolites of klpc
The metabolic defect of the klpc mutant pointed to a dysregulation of the carbohydrate metabolism, however, with no direct consequences of 14-3-3 qKO mutations for the accumulation of sucrose and decreases of glucose-6P and fructose-6P in roots under salt stress (Figure 9). In contrast to these salt-regulated metabolites, the non-salt-responsive sugars, glucose and fructose, were specifically reduced in klpc mutant roots. This more than 2-fold decrease of glucose and fructose was highly specific to klpc (Figure 9) and extended only in part to minor carbohydrates. The lack of glucose and galactose was associated with the reduced accumulation of salicylic acid-glucopyranoside (Table 2) but not by altered galactinol or raffinose accumulations under salt stress.
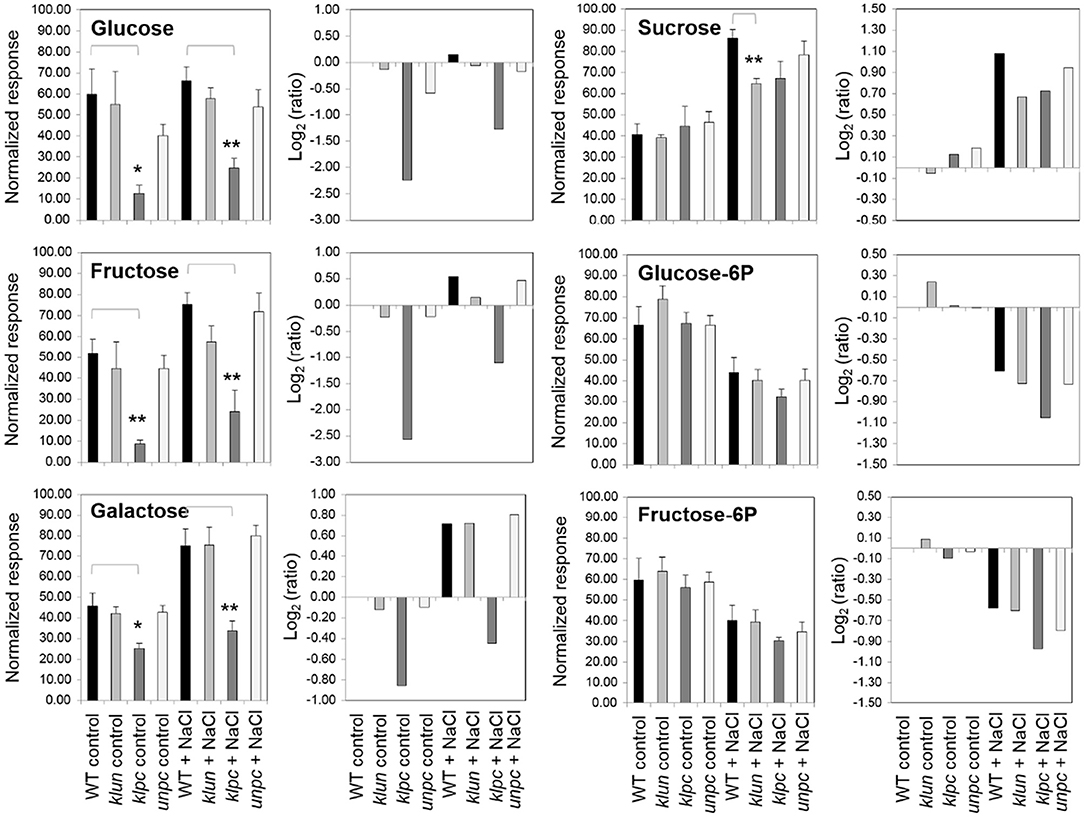
Figure 9. Changes in selected metabolites from klun, klpc, and unpc mutant roots compared to Wt under control and salt stress conditions. Normalized responses (left panels, mean ± standard error) and log2-transformed response ratios (right panels) were calculated relative to the Wt control. Bar diagrams show medians and standard errors. Stars indicate significant changes compared to the Wt as indicated by brackets (*P < 0.05, **P < 0.01, heteroscedastic T-Test). Note the specific constitutive changes of glucose, galactose, and fructose levels in klpc plants compared to the largely common salt-induced responses of sucrose, glucose-6P, and fructose-6P.
Discussion
Proteins from the 14-3-3 family are important regulators of ion homeostasis and the primary nitrogen/carbon metabolism. They have also been reported to play a role in abiotic stress adaptation (Huber et al., 2002; Diaz et al., 2011; De Boer et al., 2013). In this study, we used different 14-3-3 mutants to demonstrate the relevance of 14-3-3 proteins in the salt stress adaptation of Arabidopsis. Since there was a likely redundancy between the members of the 14-3-3 family, we selected six members from the non-epsilon group of the Arabidopsis 14-3-3 family and generated three quadruple knockout mutants by crossing double mutants made of closely related gene pairs (Van Kleeff et al., 2014). First, we phenotyped these mutants for salinity-affected growth and Na+/K+ ion homeostasis when grown in soil under natural greenhouse conditions. Next, we analyzed the root metabolome of the mutants grown in one-half strength Hoagland as affected by salt stress and compared this with the Wt metabolome.
To validate our method of salt stress application, we included the Na+-hyper-accumulating mutant hkt1. As shown in Figure 2, hkt1 accumulated large amounts of Na+ not only in salt treated pots, but even from the control pots. This “sponge-like” behavior with respect to shoot Na+ accumulation was even observed when hkt1 mutants were grown on a Hoagland solution with minimal amounts of Na+ (Hill et al., 2013). Surprisingly, despite the much higher accumulation of Na+ and stronger reduction in K+ levels in the rosette leaves, the hkt1 mutant plants performed similar to the Wt plants. In another study, the growth of soil-grown hkt1 mutant plants was strongly reduced by salt; however, in this study, the salt exposure lasted 6 weeks (Rus et al., 2006). Moreover, the strong reduction in rosette leaf K+ of the hkt1 mutant was not reflected in the K+-levels of the flower stalks. How this mutant allocated enough K+ to the flower stalk when the leaf K+ was much lower remains an open question. The extremely high Na+/K+ ratios in the hkt1 mutant, combined with a lack of growth inhibition, warrant further studies.
The biomass productions of all genotypes were equally reduced by the salt treatment, specifically, a reduction of around 30–40%. unpc seemed to be more affected by salt than Wt. The klpc mutant also stood out when looking at Na+ and K+ homeostasis under salt stress, as it contained significantly less Na+ in the rosette leaves and flower stalks as compared to Wt. K+ levels in the klpc leaves were also lower compared to Wt leaves, but the flower stalks maintained K+ levels equal to those in Wt stalks (Figure 2). Therefore, the klpc mutant showed a clear Na+ and K+ phenotype. Furthermore, van Kleef et al. have shown that double mutant un showed fewer reductions in primary root growth in a 100-mM NaCl treatment, while kl and pc were indistinguishable from Wt (Van Kleeff et al., 2014). Whether the different root morphology changes can also be observed in the three quadruple mutants needs further study. In the present study, however, neither the combination of kl with un (klun), nor un with pc (unpc) showed the same phenotype as the klpc mutant, suggesting that there was specificity among the 14-3-3 genes tested. Whether there was redundancy between the four 14-3-3 KLPC genes can also be tested by analyzing the triple, double, and single mutants.
The lower levels of Na+ and K+ in klpc were not due to a reduced transpiration rate under salt stress, but correlated with an increase in the expression of the HKT1 gene in this mutant (Figure 5). A model wherein a specific set of 14-3-3 proteins acts as repressor of HKT1 expression could explain this observation. Additionally, HKT proteins counteract the activation of the Salt Overly Sensitive (SOS) pathway for salt tolerance (Katschnig et al., 2015). Na+ and K+ homeostasis in Arabidopsis under salt stress has also been found to be improved by the coordinated expression of AtHKT1;1 and AtSOS1 (Wang et al., 2014b). Furthermore, 14-3-3 acts as an upstream regulator of the SOS pathway via not only interacting with and inhibiting SOS2 activity, but also reducing SOS1 transporter activity (Duscha et al., 2020). It has also been reported that members of the non-epsilon group, 14-3-3 KAPPA and LAMBDA, interact with and repress the activity of SOS2 in the absence of salt (Zhou et al., 2014; Yang et al., 2019). When plants were exposed to salt, the SOS2/14-3-3 interaction was reduced and SOS2 kinase activity enhanced. It may be more than a coincidence that KAPPA and LAMBDA are also represented in the klpc 14-3-3 qKO that shows this reduced Na+ accumulation phenotype.
We used multivariate data analyses (PCA, OPLS-DA, and HCA models) to extract interpretable information from the multidimensional data generated by the GC-TOF-MS analysis. The global view as depicted by the PCA and OPLS-DA scores managed to separate control and salt-treated samples into distinct groups (Figure 6). The HCA also gave a separation quite similar to the one seen in the OPLS-DA, as shown in Figure 7, as control and salt-treated samples were again found in distinct groups. Furthermore, the HCA showed that salt stress was the main effector on root metabolism. Also, the heat map suggested that the salt stress response of the mutants was, in general, similar compared to Wt, while several metabolites showed priori differences compared to Wt (klpc in cluster III and V).
The mutant that differed most from the salt stress responses of Wt in terms of metabolite composition was the klpc mutant (Figure 8). The most notable differences were the lower levels of fructose, glucose, and galactose (Figure 9). The reduction in glucose and fructose levels could be assigned to the positive regulation of root alkaline invertase by 14-3-3 proteins (Gao et al., 2014). A number of other enzymes with a function in carbohydrate metabolism have also been reported to be controlled by 14-3-3 proteins, such as sucrose phosphate synthase (SPS), 6-phosphofructo-2-kinase/fructose-2,6-bisphosphatase (6PF2K), and trehalose-phosphate synthase (TPS) (Kulma et al., 2004; Bornke, 2005; Harthill et al., 2006). This may explain why, in a previous 14-3-3 over-expression study, 14-3-3KAPPA-OX and 14-3-3CHI-OX plants also showed a reduction in sugars (sucrose, glucose, and fructose), although these measurements were done on shoot material (Diaz et al., 2011).
Differences in the mutant metabolomes vs. those of the Wt as seen under control conditions all disappeared (except for the sugars and some acids in klpc) when the plants were salt stressed, e.g., cytosine, fumaric acid, and raffinose (Supplementary Figure 5). One explanation for this is that, under salt stress, the mutants compensated for the loss of some of the 14-3-3 proteins through the salt-induced upregulation of redundant 14-3-3 genes. Such an upregulation of 14-3-3 genes by salt was also observed in cotton (Wei et al., 2009) and tomato roots (Xu and Shi, 2006).
As expected, each genotype showed a multitude of salt-induced metabolic changes (Table 2). Global metabolic changes upon high salinity included increases in the levels of amino acids, sugars, and polyols, which have been previously identified as stress-responsive metabolites. In our experiments, the response of most metabolites was the same for Wt and 14-3-3 qKOs, but the mutants accumulated different amounts of salts (Figure 2). We also saw an increase in the levels of many amino acids and sugars, while the klpc mutant showed significant reductions in intermediates of glycolysis (Table 1 and Figure 9). The latter fit the conclusion that we reached in a review that 14-3-3 is a key regulator of glycolysis through interactions with many individual glycolytic enzymes and/or enzyme complexes (De Boer et al., 2013). Thus, glycolytic regulation is evidently complex, as the over-expression of single 14-3-3 genes (KAPPA and CHI) induced a strong reduction in the level of key metabolites in glycolysis (Diaz et al., 2011). The physiological role of the salt-responsive metabolites that are specifically changed in klpc remains to be investigated. Furthermore, the observation from Figure 9 indicated that more sucrose accumulated in roots under salt stress while the levels of glucose-6P and fructose-6P declined. Raffinose biosynthesis requires sucrose and galactose that are conjugated to myo-inositol to form galactinol. The galactose moiety is then transferred as the galactinol intermediate to sucrose for raffinose production. In these aspects, the klpc mutant roots largely do not differ from salt-stressed Wt and the other mutants, likely meaning that it is able to compensate for its defect concerning the 14-3-3-driven activation of the cytosolic invertase AtCINV1 (Gao et al., 2014). Additionally, Arabidopsis compensated for this dysregulation, which only had a few pleiotropic effects, e.g., the accumulation of ornithine that, due to the constraints of GC-MS-based metabolite profiling, represents the sum of urea cycle metabolites, arginine, citrulline, and ornithine (Table 1). It may be that this compensation reflects the lower cellular stress in klpc (due to the reduced Na+-accumulation) compared to Wt. Alternatively, these metabolites may rather be involved in other physiological processes such as signaling or act as repositories of carbon and nitrogen. Whether this compensation invests resources into enhanced growth and less Na+ accumulation under salt stress needs to be further investigated. The over-expression of cytosolic invertase under a salt-inducible promoter may also prove important for future functional analyses. Clearly, the non-supervised and supervised analyses in this study showed differences in metabolite levels between klpc and Wt. The question on whether the differences in salt-induced changes in specific metabolite productions can be separated from the higher level of HKT1 expression and reduced Na+-accumulation as observed in the klpc quadruple mutant may be answered by the analyses of the same parameters in the triple, double, and single mutants.
In conclusion, we addressed research questions regarding the role of higher order Arabidopsis 14-3-3 mutants in ion homeostasis and metabolite composition, both in control and salt-stressed conditions. The metabolomic analysis revealed that the 14-3-3 qKOs mutants had different metabolic profiles compared to Wt and that, notably, the metabolome of klpc plants under control and salt-stressed condition differed from that in Wt. These observations indicate that 14-3-3 proteins directly or indirectly affect the amino acid metabolism, TCA cycle, and carbohydrate metabolism both under non-stressed conditions and long-term salt stress. Our results confirmed that 14-3-3 proteins are involved in multiple salt stress-related signaling pathways, with both broad redundancy and specificity considering the tested non-epsilon 14-3-3 members. Further analyses of single, double, and triple mutants that constitute subsets of the most effective qKO mutant (klpc) may reveal details of the redundancy that appears to control ion homeostasis and the associated metabolic phenotypes.
Data Availability Statement
The original contributions presented in the study are included in the article/Supplementary Material, further inquiries can be directed to the corresponding author/s.
Author Contributions
AB conceived and designed the experiments. JG and MB performed the experiments. PK generated the 14-3-3 mutant plants. AE and JK performed the analysis of the metabolomics analyses. JG wrote the manuscript with suggestions by AB, JK, and DH. All authors read and approved the final manuscript.
Funding
The project was supported by a grant from the Netherlands Organization for Scientific Research (NWO; 817.02.006) to AB and a grant from the National Natural Science Foundation of China (No. 31802146) to JG.
Conflict of Interest
The authors declare that the research was conducted in the absence of any commercial or financial relationships that could be construed as a potential conflict of interest.
Publisher's Note
All claims expressed in this article are solely those of the authors and do not necessarily represent those of their affiliated organizations, or those of the publisher, the editors and the reviewers. Any product that may be evaluated in this article, or claim that may be made by its manufacturer, is not guaranteed or endorsed by the publisher.
Acknowledgments
The authors thank Daniel da Costa Pereira and Jinhong Luo for their excellent technical assistance with the qRT-PCR measurements. JK and AE kindly acknowledge Federico Martinez-Seidel for advice and support of the statistical data analysis. We dedicate this paper in memory of our colleague DH.
Supplementary Material
The Supplementary Material for this article can be found online at: https://www.frontiersin.org/articles/10.3389/fpls.2021.697324/full#supplementary-material
Abbreviations
qKOs, quadruple knockout mutants; Exp, experiment; SOS, Salt Overly Sensitive; PCA, principal component analysis; OPLS-DA, orthogonal projections to latent structures discriminant analysis; HCA, hierarchical cluster analysis.
References
Alla, M. M. N., Khedr, A.-H. A., Serag, M. M., Abu-Alnaga, A. Z., and Nada, R. M. (2012). Regulation of metabolomics in Atriplex halimus growth under salt and drought stress. Plant Growth Regul. 67, 281–304. doi: 10.1007/s10725-012-9687-1
Baunsgaard, L., Fuglsang, A. T., Jahn, T., Korthout, H., De Boer, A. H., and Palmgren, M. G. (1998). The 14-3-3 proteins associate with the plant plasma membrane H+-ATPase to generate a fusicoccin binding complex and a fusicoccin responsive system. Plant J. 13, 661–671. doi: 10.1046/j.1365-313X.1998.00083.x
Bornke, F. (2005). The variable C-terminus of 14-3-3 proteins mediates isoform-specific interaction with sucrose-phosphate synthase in the yeast two-hybrid system. J. Plant Physiol. 162, 161–168. doi: 10.1016/j.jplph.2004.09.006
Bunney, T. D., Van Den Wijngaard, P. W. J., and De Boer, A. H. (2002). 14-3-3 protein regulation of proton pumps and ion channels. Plant Mol. Biol. 50, 1041–1051. doi: 10.1023/A:1021231805697
Chen, F., Li, Q., Sun, L., and He, Z. (2006). The rice 14-3-3 gene family and its involvement in responses to biotic and abiotic stress. DNA Res. 13, 53–63. doi: 10.1093/dnares/dsl001
Chung, H. J., Sehnke, P. C., and Ferl, R. J. (1999). The 14-3-3 proteins: cellular regulators of plant metabolism. Trends Plant Sci. 4, 367–371. doi: 10.1016/S1360-1385(99)01462-4
De Boer, A. H., Van Kleeff, P. J. M., and Gao, J. (2013). Plant 14-3-3 proteins as spiders in a web of phosphorylation. Protoplasma 250, 425–440. doi: 10.1007/s00709-012-0437-z
Diaz, C., Kusano, M., Sulpice, R., Araki, M., Redestig, H., Saito, K., et al. (2011). Determining novel functions of Arabidopsis 14-3-3 proteins in central metabolic processes. BMC Syst. Biol. 5:192. doi: 10.1186/1752-0509-5-192
Duscha, K., Rodrigues, C. M., Mueller, M., Wartenberg, R., Fliegel, L., Deitmer, J. W., et al. (2020). 14-3-3 Proteins and other candidates form protein-protein interactions with the cytosolic C-terminal end of SOS1 affecting its transport activity. Int. J. Mol. Sci. 21:3334. doi: 10.3390/ijms21093334
Erban, A., Schauer, N., Fernie, A. R., and Kopka, J. (2007). Nonsupervised construction and application of mass spectral and retention time index libraries from time-of-flight gas chromatography-mass spectrometry metabolite profiles. Methods Mol. Biol. 358, 19–38. doi: 10.1007/978-1-59745-244-1_2
Fita, A., Rodriguez-Burruezo, A., Boscaiu, M., Prohens, J., and Vicente, O. (2015). Breeding and domesticating crops adapted to drought and salinity: a new paradigm for increasing food production. Front. Plant Sci. 6:978. doi: 10.3389/fpls.2015.00978
Gao, J., Van Kleeff, P. J, Oecking, C., Li, K. W, Erban, A., Kopka, J., et al. (2014). Light modulated activity of root alkaline/neutral invertase involves the interaction with 14-3-3 proteins. Plant J. 80, 785–796. doi: 10.1111/tpj.12677
Golldack, D., Li, C., Mohan, H., and Probst, N. (2014). Tolerance to drought and salt stress in plants: unraveling the signaling networks. Front. Plant Sci. 5, 151–151. doi: 10.3389/fpls.2014.00151
Halfter, U., Ishitani, M., and Zhu, J. K. (2000). The Arabidopsis SOS2 protein kinase physically interacts with and is activated by the calcium-binding protein SOS3. Proc. Natl. Acad. Sci. U. S. A. 97, 3735–3740. doi: 10.1073/pnas.97.7.3735
Harthill, J. E., Meek, S. E. M., Morrice, N., Peggie, M. W., Borch, J., Wong, B. H. C., et al. (2006). Phosphorylation and 14-3-3 binding of Arabidopsis trehalose-phosphate synthase 5 in response to 2-deoxyglucose. Plant J. 47, 211–223. doi: 10.1111/j.1365-313X.2006.02780.x
Hill, C. B., Jha, D., Bacic, A., Tester, M., and Roessner, U. (2013). Characterization of ion contents and metabolic responses to salt stress of different Arabidopsis AtHKT1;1 genotypes and their parental strains. Mol. Plant 6, 350–368. doi: 10.1093/mp/sss125
Huang, T.-L., Quynh Thi Thuy, N., Fu, S.-F., Lin, C.-Y., Chen, Y.-C., and Huang, H.-J. (2012). Transcriptomic changes and signalling pathways induced by arsenic stress in rice roots. Plant Mol. Biol. 80, 587–608. doi: 10.1007/s11103-012-9969-z
Huber, S. C., Mackintosh, C., and Kaiser, W. M. (2002). Metabolic enzymes as targets for 14-3-3 proteins. Plant Mol. Biol. 50, 1053–1063. doi: 10.1023/A:1021284002779
Hummel, J., Strehmel, N., Selbig, J., Walther, D., and Kopka, J. (2010). Decision tree supported substructure prediction of metabolites from GC-MS profiles. Metabolomics 6, 322–333. doi: 10.1007/s11306-010-0198-7
Isayenkov, S. V. (2012). Physiological and molecular aspects of salt stress in plants. Cytol. Genet. 46, 302–318. doi: 10.3103/S0095452712050040
Jha, D., Shirley, N., Tester, M., and Roy, S. J. (2010). Variation in salinity tolerance and shoot sodium accumulation in Arabidopsis ecotypes linked to differences in the natural expression levels of transporters involved in sodium transport. Plant Cell Environ. 33, 793–804. doi: 10.1111/j.1365-3040.2009.02105.x
Kaeodee, M., Pongsomboon, S., and Tassanakajon, A. (2011). Expression analysis and response of Penaeus monodon 14-3-3 genes to salinity stress. Comp. Biochem. Physiol. B Biochem. Mol. Biol. 159, 244–251. doi: 10.1016/j.cbpb.2011.05.004
Katschnig, D., Bliek, T., Rozema, J., and Schat, H. (2015). Constitutive high-level SOS1 expression and absence of HKT1;1 expression in the salt-accumulating halophyte Salicornia dolichostachya. Plant Sci. 234, 144–154. doi: 10.1016/j.plantsci.2015.02.011
Kinoshita, T., Emi, T., Tominaga, M., Sakamoto, K., Shigenaga, A., Doi, M., et al. (2003). Blue-light- and phosphorylation-dependent binding of a 14-3-3 protein to phototropins in stomatal guard cells of broad bean. Plant Physiol. 133, 1453–1463. doi: 10.1104/pp.103.029629
Kinoshita, T., and Shimazaki, K. (2002). Biochemical evidence for the requirement of 14-3-3 protein binding in activation of the guard-cell plasma membrane H+-ATPase by blue light. Plant Cell Physiol. 43, 1359–1365. doi: 10.1093/pcp/pcf167
Kopka, J., Schauer, N., Krueger, S., Birkemeyer, C., Usadel, B., Bergmuller, E., et al. (2005).R01EQENTQi5EQg==: the Golm Metabolome Database. Bioinformatics 21, 1635–1638. doi: 10.1093/bioinformatics/bti236
Kulma, A., Villadsen, D., Campbell, D. G., Meek, S. E. M., Harthill, J. E., Nielsen, T. H., et al. (2004). Phosphorylation and 14-3-3 binding of Arabidopsis 6-phosphofructo-2-kinase/fructose-2,6-bisphosphatase. Plant J. 37, 654–667. doi: 10.1111/j.1365-313X.2003.01992.x
Lambeck, I., Chi, J.-C., Krizowski, S., Mueller, S., Mehlmer, N., Teige, M., et al. (2010). Kinetic Analysis of 14-3-3-Inhibited Arabidopsis thaliana Nitrate Reductase. Biochemistry 49, 8177–8186. doi: 10.1021/bi1003487
Lisec, J., Schauer, N., Kopka, J., Willmitzer, L., and Fernie, A. R. (2006). Gas chromatography mass spectrometry-based metabolite profiling in plants. Nat. Protoc. 1, 387–396. doi: 10.1038/nprot.2006.59
Livak, K. J., and Schmittgen, T. D. (2001). Analysis of relative gene expression data using real-time quantitative PCR and the 2(T)(-Delta Delta C) method. Methods 25, 402–408. doi: 10.1006/meth.2001.1262
Luedemann, A., Strassburg, K., Erban, A., and Kopka, J. (2008). TagFinder for the quantitative analysis of gas chromatography - mass spectrometry (GC-MS)-based metabolite profiling experiments. Bioinformatics 24, 732–737. doi: 10.1093/bioinformatics/btn023
Maser, P., Eckelman, B., Vaidyanathan, R., Horie, T., Fairbairn, D. J., Kubo, M., et al. (2002). Altered shoot/root Na+ distribution and bifurcating salt sensitivity in Arabidopsis by genetic disruption of the Na+ transporter AtHKTI1. Febs Lett. 531, 157–161. doi: 10.1016/S0014-5793(02)03488-9
Munns, R., and Tester, M. (2008). Mechanisms of salinity tolerance. Annu. Rev. Plant Biol. 59, 651–681. doi: 10.1146/annurev.arplant.59.032607.092911
Paul, A.-L., Denison, F. C., Schultz, E. R., Zupanska, A. K., and Ferl, R. J. (2012). 14-3-3 phosphoprotein interaction networks - does isoform diversity present functional interaction specification? Front. Plant Sci. 3:190. doi: 10.3389/fpls.2012.00190
Qiu, Q. S., Guo, Y., Dietrich, M. A., Schumaker, K. S., and Zhu, J. K. (2002). Regulation of SOS1, a plasma membrane Na+/H+ exchanger in Arabidopsis thaliana, by SOS2 and SOS3. Proc. Natl. Acad. Sci. U. S. A. 99, 8436–8441. doi: 10.1073/pnas.122224699
Quintero, F. J., Ohta, M., Shi, H. Z., Zhu, J. K., and Pardo, J. M. (2002). Reconstitution in yeast of the Arabidopsis SOS signaling pathway for Na+ homeostasis. Proc. Natl. Acad. Sci. U. S. A. 99, 9061–9066. doi: 10.1073/pnas.132092099
Richter, J. A., Erban, A., Kopka, J., and Zoerb, C. (2015). Metabolic contribution to salt stress in two maize hybrids with contrasting resistance. Plant Sci. 233, 107–115. doi: 10.1016/j.plantsci.2015.01.006
Roberts, M. R., and De Bruxelles, G. L. (2002). Plant 14-3-3 protein families: evidence for isoform-specific functions? Biochem. Soc. Trans. 30, 373–378. doi: 10.1042/bst0300373
Rus, A., Baxter, I., Muthukumar, B., Gustin, J., Lahner, B., Yakubova, E., et al. (2006). Natural variants of AtHKT1 enhance Na+ accumulation in two wild Populations of Arabidopsis. PLoS Genet. 2:e210. doi: 10.1371/journal.pgen.0020210
Rus, A., Yokoi, S., Sharkhuu, A., Reddy, M., Lee, B. H., Matsumoto, T. K., et al. (2001). AtHKT1 is a salt tolerance determinant that controls Na+ entry into plant roots. Proc. Natl. Acad. Sci. U. S. A. 98, 14150–14155. doi: 10.1073/pnas.241501798
Saeed, A. I., Hagabati, N. K., Braisted, J. C., Liang, W., Sharov, V., Howe, E. A., et al. (2006). TM4 microarray software suite. Methods Enzymol. 11, 134–193. doi: 10.1016/S0076-6879(06)11009-5
Saeed, A. I., Sharov, V., White, J., Li, J., Liang, W., Bhagabati, N., et al. (2003). TM4: A free, open-source system for microarray data management and analysis. Biotechniques. 34, 374–378. doi: 10.2144/03342mt01
Sanchez, D. H., Siahpoosh, M. R., Roessner, U., Udvardi, M., and Kopka, J. (2008). Plant metabolomics reveals conserved and divergent metabolic responses to salinity. Physiol. Plant. 132, 209–219. doi: 10.1111/j.1399-3054.2007.00993.x
Serrano, R., and Rodriguez-Navarro, A. (2001). Ion homeostasis during salt stress in plants. Curr. Opin. Cell Biol. 13, 399–404. doi: 10.1016/S0955-0674(00)00227-1
Shan'ko, A. V., and Babakov, A. V. (2002). Regulation of plasma membrane H+-pump activity by 14-3-3 proteins in barley (Hordeum disticum) roots under salt stress. Russ. J. Plant Physiol. 49, 754–760. doi: 10.1023/A:1020905410587
Shin, R., Jez, J. M., Basra, A., Zhang, B., and Schachtman, D. P. (2011). 14-3-3 Proteins fine-tune plant nutrient metabolism. Febs Lett. 585, 143–147. doi: 10.1016/j.febslet.2010.11.025
Sirichandra, C., Davanture, M., Turk, B. E., Zivy, M., Valot, B., Leung, J., et al. (2010). The Arabidopsis ABA-activated kinase OST1 phosphorylates the bZIP transcription factor ABF3 and creates a 14-3-3 binding site involved in its turnover. PLoS One 5:e13935. doi: 10.1371/journal.pone.0013935
Sun, X., Luo, X., Sun, M., Chen, C., Ding, X., Wang, X., et al. (2014). A glycine soja 14-3-3 protein GsGF14o participates in stomatal and root hair development and drought tolerance in Arabidopsis thaliana. Plant Cell Physiol. 55, 99–118. doi: 10.1093/pcp/pct161
Sun, X., Sun, M., Jia, B., Chen, C., Qin, Z., Yang, K., et al. (2015). A 14-3-3 family protein from wild soybean (glycine soja) regulates ABA sensitivity in Arabidopsis. PLoS One 10:e0146163. doi: 10.1371/journal.pone.0146163
Swatek, K. N., Graham, K., Agrawal, G. K., and Thelen, J. J. (2011). The 14-3-3 isoforms chi and epsilon differentially bind client proteins from developing arabidopsis seed. J Proteome Res. 10, 4076–4087. doi: 10.1021/pr200263m
Takahashi, K., Hayashi, K.-I., and Kinoshita, T. (2012). Auxin activates the plasma membrane H+-ATPase by phosphorylation during hypocotyl elongation in Arabidopsis. Plant Physiol. 159, 632–641. doi: 10.1104/pp.112.196428
Tan, T., Cai, J., Zhan, E., Yang, Y., Zhao, J., Guo, Y., et al. (2016). Stability and localization of 14-3-3 proteins are involved in salt tolerance in Arabidopsis. Plant Mol. Biol. 92, 391–400. doi: 10.1007/s11103-016-0520-5
Tseng, T.-S., Whippo, C., Hangarter, R. P., and Briggs, W. R. (2012). The role of a 14-3-3 protein in stomatal opening mediated by PHOT2 in Arabidopsis. Plant Cell 24, 1114–1126. doi: 10.1105/tpc.111.092130
Van Kleeff, P. J. M., Jaspert, N., Li, K. W., Rauch, S., Oecking, C., and De Boer, A. H. (2014). Higher order Arabidopsis 14-3-3 mutants show 14-3-3 involvement in primary root growth both under control and abiotic stress conditions. J. Exp. Bot. 65, 5877–5888. doi: 10.1093/jxb/eru338
Wang, L., Cui, N., Zhao, X. C., Fan, H. Y., and Li, T. L. (2014a). Accumulation of carbohydrate and regulation of 14-3-3 protein on sucrose phosphate synthase (SPS) activity in two tomato species. J. Integr. Agric. 13, 358–364. doi: 10.1016/S2095-3119(13)60373-1
Wang, L., Liu, Y., Feng, S., Wang, Z., Zhang, J., Zhang, J., et al. (2018). AtHKT1 gene regulating K+ state in whole plant improves salt tolerance in transgenic tobacco plants. Sci. Rep. 8:16585. doi: 10.1038/s41598-018-34660-9
Wang, Q., Guan, C., Wang, P., Ma, Q., Bao, A.-K., Zhang, J.-L., et al. (2019). The effect of AtHKT1;1 or AtSOS1 mutation on the expressions of Na+ or K+ transporter genes and ion homeostasis in Arabidopsis thaliana under salt stress. Int. J. Mol. Sci. 20:1085. doi: 10.3390/ijms20051085
Wang, Q., Guan, C., and Wang, S.-M. (2014b). Coordination of AtHKT1;1 and AtSOS1 facilitates Na+ and K+ homeostasis in Arabidopsis thaliana under salt stress. J. Plant Biol. 57, 282–290. doi: 10.1007/s12374-014-0222-y
Watanabe, M., Balazadeh, S., Tohge, T., Erban, A., Giavalisco, P., Kopka, J., et al. (2013). Comprehensive dissection of spatiotemporal metabolic shifts in primary, secondary, and lipid metabolism during developmental senescence in Arabidopsis. Plant Physiol. 162, 1290–1310. doi: 10.1104/pp.113.217380
Wei, X., Zhang, Z., Li, Y., Wang, X., Shao, S., Chen, L., et al. (2009). Expression analysis of two novel cotton 14-3-3 genes in root development and in response to salt stress. Prog. Nat. Sci. 19, 173–178. doi: 10.1016/j.pnsc.2008.06.016
Wu, D., Cai, S., Chen, M., Ye, L., Chen, Z., Zhang, H., et al. (2013). Tissue metabolic responses to salt stress in wild and cultivated barley. PLoS One 8:e55431. doi: 10.1371/journal.pone.0055431
Xu, W. F., and Shi, W. M. (2006). Expression profiling of the 14-3-3 gene family in response to salt stress and potassium and iron deficiencies in young tomato (Solanum lycopersicum) roots: analysis by real-time RT-PCR. Ann. Bot. 98, 965–974. doi: 10.1093/aob/mcl189
Xue, S., Yao, X., Luo, W., Jha, D., Tester, M., Horie, T., et al. (2011). AtHKT1;1 mediates nernstian sodium channel transport properties in Arabidopsis root stelar cells. PLoS One 6:e24725. doi: 10.1371/journal.pone.0024725
Yadav, S., Irfan, M., Ahmad, A., and Hayat, S. (2011). Causes of salinity and plant manifestations to salt stress: a review. J. Environ. Biol. 32, 667–685. doi: 10.1007/s11852-010-0106-3
Yang, Z., Wang, C., Xue, Y., Liu, X., Chen, S., Song, C., et al. (2019). Calcium-activated 14-3-3 proteins as a molecular switch in salt stress tolerance. Nat. Commun. 10:1199. doi: 10.1038/s41467-019-09181-2
Keywords: 14-3-3, salinity, metabolism, ion homeostasis, plant abiotic stress
Citation: Gao J, van Kleeff PJM, de Boer MH, Erban A, Kopka J, Hincha DK and de Boer AH (2021) Ion Homeostasis and Metabolome Analysis of Arabidopsis 14-3-3 Quadruple Mutants to Salt Stress. Front. Plant Sci. 12:697324. doi: 10.3389/fpls.2021.697324
Received: 19 April 2021; Accepted: 11 August 2021;
Published: 13 September 2021.
Edited by:
Vicent Arbona, University of Jaume I, SpainReviewed by:
Vivek Dogra, Institute of Himalayan Bioresource Technology (CSIR), IndiaDavid Jespersen, University of Georgia, United States
Copyright © 2021 Gao, van Kleeff, de Boer, Erban, Kopka, Hincha and de Boer. This is an open-access article distributed under the terms of the Creative Commons Attribution License (CC BY). The use, distribution or reproduction in other forums is permitted, provided the original author(s) and the copyright owner(s) are credited and that the original publication in this journal is cited, in accordance with accepted academic practice. No use, distribution or reproduction is permitted which does not comply with these terms.
*Correspondence: Albertus H. de Boer, YWhkZWJvZXI1NEBnbWFpbC5jb20=