 Anne Charlott Fitzky1
 Arianna Peron2
 Lisa Kaser2
 Thomas Karl2Martin Graus2
 Danny Tholen3
 Mario Pesendorfer1
 Maha Mahmoud1,3
 Hans Sandén1*
 Boris Rewald1
- 1Department of Forest and Soil Sciences, Institute of Forest Ecology, University of Natural Resources and Life Sciences Vienna, Vienna, Austria
- 2Institute of Atmospheric and Cryospheric Sciences, University of Innsbruck, Innsbruck, Austria
- 3Institute of Botany, University of Natural Resources and Life Sciences Vienna, Vienna, Austria
Volatile organic compounds (VOCs) emitted by plants consist of a broad range of gasses which serve purposes such as protecting against herbivores, communicating with insects and neighboring plants, or increasing the tolerance to environmental stresses. Evidence is accumulating that the composition of VOC blends plays an important role in fulfilling these purposes. Constitutional emissions give insight into species-specific stress tolerance potentials and are an important first step in linking metabolism and function of co-occurring VOCs. Here, we investigate the blend composition and interrelations among co-emitted VOCs in unstressed seedlings of four broad-leaved tree species, Quercus robur, Fagus sylvatica, Betula pendula, and Carpinus betulus. VOCs of Q. robur and F. sylvatica mainly emitted isoprene and monoterpenes, respectively. B. pendula had relatively high sesquiterpene emission; however, it made up only 1.7% of its total emissions while the VOC spectrum was dominated by methanol (∼72%). C. betulus was emitting methanol and monoterpenes in similar amounts compared to other species, casting doubt on its frequent classification as a close-to-zero VOC emitter. Beside these major VOCs, a total of 22 VOCs could be identified, with emission rates and blend compositions varying drastically between species. A principal component analysis among species revealed co-release of multiple compounds. In particular, new links between pathways and catabolites were indicated, e.g., correlated emission rates of methanol, sesquiterpenes (mevalonate pathway), and green leaf volatiles (hexanal, hexenyl acetate, and hexenal; lipoxygenase pathway). Furthermore, acetone emissions correlated with eugenol from the Shikimate pathway, a relationship that has not been described before. Our results thus indicate that certain VOC emissions are highly interrelated, pointing toward the importance to improve our understanding of VOC blends rather than targeting dominant VOCs only.
Introduction
Plants emit over 30,000 different biogenic volatile organic compounds (VOCs) into the atmosphere (Trowbridge and Stoy, 2013). Chemically, VOCs are molecules of low molar mass, consisting of isoprenoids (isoprene, monoterpenes, and sesquiterpenes), oxygenated chemical species (OVOCs, e.g., methanol, ethanol, acetone, and acetaldehyde) and green leaf volatiles (GLVs; e.g., hexenals) (Oikawa and Lerdau, 2013). Among biogenic VOCs, isoprene accounts for ∼44% of all emissions, and monoterpenes and methanol each constitute ∼11% of all VOC emissions (Guenther et al., 1995; Guenther et al., 2006). Sesquiterpenes and a great number of other compounds are often emitted in lesser quantities (Duhl et al., 2008; Loreto and Schnitzler, 2010; Niinemets and Monson, 2013). Among vegetation components, woody species are generally considered a major source of VOCs (Rosenkranz and Schnitzler, 2013). However, type and rate of VOC emissions are highly species-specific. Species with high emission rates are thus frequently divided into isoprene, monoterpene, and sesquiterpene emitters, and distinguished from non- or “close-to-zero”-emitting species (see Niinemets and Monson, 2013 and references within; Dani et al., 2014). In addition, other VOCs emitted in larger quantities, such as methanol, are used for classification (Brunner et al., 2007). While common classification schemes focus on the emission rate of dominant VOCs (Karl M. et al., 2009; Dani et al., 2014) or single VOCs of (assumed) functional significance (Kanagendran et al., 2018; Werle et al., 2019), trees, as other plant species, emit several VOCs simultaneously—creating a diverse blend of compounds (Niinemets and Monson, 2013).
Primary functions of individual airborne VOCs have been related to the defense of plants against herbivores and pathogens, the attraction of pollinators, seed dispersers and other beneficial animals and microorganisms, and signaling in plant–plant interaction (Holopainen and Gershenzon, 2010; Oikawa and Lerdau, 2013). In addition, specific VOCs were reported to increase the tolerance for abiotic stresses, e.g., by detoxification of deposited photooxidation products, or outcompeting neighboring species via an induced growth-repression (Trowbridge and Stoy, 2013; Canaval et al., 2020). In addition to single VOC effects, evidence on the functional significance of VOC blends is increasing, suggesting that multiple VOCs emitted simultaneously can constitute modified, synergistic responses (Niinemets and Monson, 2013). For example, the wound-induced GLVs emitted by Tanacetum cinerariifolium activated the biosynthesis of insecticidal metabolites in neighboring plants effectively only as a mixture of several compounds (Ueda et al., 2012). Similar, only the blend of different terpenes and GLVs was considered effective as an herbivore warning system in Betula nana (Li et al., 2019). The attraction of predators in response to an herbivorous attack on Festuca spp. was not determined by the total amount of VOCs emitted, but only by a specific combination of several VOCs (and their ratios)—a larger number of predators were attracted by an increased concentration of this VOC blend (Kergunteuil et al., 2020). Earlier it was shown that different monoterpene blends alter the abiotic stress tolerance of both emitting and neighboring non-emitting species differently (Copolovici et al., 2005). While the diversity and quantity of VOC blends are increasingly studied and reported to vary widely across species and environmental conditions, information about the correlated emission of VOCs remains limited (Laule et al., 2003; Niinemets and Monson, 2013).
Four main interrelated metabolic pathways are thought be involved in the synthesis of major VOCs: methylerythritol phosphate (MEP), mevalonic acid (MVA), lipoxygenase (LOX) and shikimate (Laule et al., 2003; Dudareva et al., 2013). Other VOCs originate from catabolic processes, or reactions within the cell membranes (Peñuelas and Staudt, 2010; Oikawa and Lerdau, 2013; Dorokhov et al., 2018). Common derivatives and transcriptional factors linking those pathways and catabolic processes have yet to be studied in relation to their overlapping/combined functions (Li and Sharkey, 2013; Monson, 2013). An increased understanding of the interactions between jointly emitted volatile substances and its functional significance, however, is restrained because full VOC emission spectra are not yet available for a broad set of species. This is partially due to inherent technical difficulties related to detecting VOCs at low concentrations. However, recent advances of online proton-transfer-reaction time-of-flight mass spectrometry (PTR-TOF-MS) systems, in combination with dynamic/open chamber systems, now allow for measurements of VOC blends at high mass and time resolution (Graus et al., 2010). Absorbance and reactions between VOCs can now be minimized compared to closed chamber systems or absorbent tubes (Tholl et al., 2006; Kolari et al., 2012). These novel approaches can thus provide more insights into the pathways involved in VOC synthesis, as they allow of the simultaneous measurements of low-concentration VOCs.
As most previous studies have predominantly targeted single VOCs, or VOC spectra of single individuals or mixed-species plantations, identification of species-specific “VOC fingerprints” and their inter-specific comparability is hampered. However, detailed characterization of constitutive VOC blends under non-stress conditions is a prerequisite for the assessment of functional changes in volatile spectra under altered environmental conditions. The general aim of this study is thus to determine the constitutive VOC emission spectra of four common European tree species, allowing (1) to compare species-specific VOC blends (i.e., “fingerprints”), and (2) to identify co-emission pattern of different VOCs which may hint at the underlying metabolic pathways. The selected tree species represent four major types of emitters, commonly classified as isoprene- (Quercus robur L.), monoterpene- (Fagus sylvatica L.), sesquiterpenes- (Betula pendula Roth.), and close-to-zero-emitters (Carpinus betulus L.).
Materials and Methods
Species and Growth Conditions
Two-year-old seedlings of Q. robur, F. sylvatica, B. pendula, and C. betulus were planted in 7 L pots filled with a 1:2 mixture of “Viennese soil substrate” (used by arborists for planting trees in Vienna; see Supplementary Materials and Methods for details) and quartz sand in March 2019. The species are major vegetation components in temperate forests across Europe (Ellenberg and Leuschner, 2010), and also frequently used for urban greenery (Pauleit et al., 2002; Sukopp and Wurzel, 2003). After planting, pots were fertilized using 50 g m–2 of a universal NPK fertilizer (8% N, 8% P2O5, 6% K2O, 0.02% Fe, 0.01% B and Mn, 0.002% Cu and Zn, and 0.001% Mo; NovaTec, Compo, Münster, Germany). Eight replicates per species were subsequently grown for 14–16 weeks in a greenhouse in Tulln (Austria) under well watered (∼100% field capacity, 13.4 vol.% water content; Fieldscout TDR100, 20 cm probe depth, Spectrum Technologies, United Kingdom) and near ambient light and temperature conditions. Two weeks before VOC sampling (June 2019), the seedlings had fully expanded and toughened leaves and were relocated to a ventilated greenhouse in Vienna and kept at near ambient temperature conditions. The shoots were carefully rinsed with tap water 1 week before measurements, removing dust and fingerprints, and from thereon were only handled with cotton gloves. The trees were moved to a climate chamber (Fitotron, Weiss Gallenkamp, United Kingdom; 25°C air temperature, 40% RH) for acclimation at least 24 h before enclosing them into VOC-chambers for measurements.
VOC Measurements
The VOC emission blends were measured in June and July 2019 in an acclimatized growth room at 25°C in the morning and afternoon, 4 days a week. The gas sampling was performed using two custom-made VOC-chambers (TC-400, Vienna Scientific Instruments, Alland, Austria), consisting of a polyethylenterephthalat (PET)-bag (∼12 L, 55 × 60 cm, Malvern, United Kingdom) placed over a polytetrafluorethylen (PTFE, “Teflon”) plate with elevated PTFE-coated inlets (Figure 1 and Supplementary Figure 1). To insert the tree into chamber 1 (tree-chamber), the table with the PTFE plate was split open to place the seedling’s stem in a centered hole in the plate. Before closing the table and sealing the stem with a PTFE-coated silicon stopper, a thermocouple (type K, PTFE wire IEC; RS Pro thermocouple, RS components, Gmünd, Germany) was placed underneath a mid-canopy leaf per tree to monitor leaf temperature (°C). The PET-bag was placed over the inserted tree and sealed around the PTFE plate. The chamber 2 (control-chamber) stayed empty for parallel background measurements. A thermocouple was placed ∼10 cm above the PTFE plate to determine ambient air temperature. A membrane compressor (Hiblow HP 200, Takatsuki, Japan) was used for drawing ambient air from outside via suction, which was dried by a de-humidifier to ∼32% RH (VPD 2.386 kPa) before being passed through a charcoal filter (maximum flow 6000 L min–1; PrimaKlima, Radnice, Czechia) to reduce background-VOCs (Sidheswaran et al., 2012). The air was subsequently channeled using PTFE tubes and divided into one channel per chamber. Air entered each chamber at 50 cm above the PTFE plate (Figure 1); the air flow was adjusted by a PTFE valve (rotameter series 4L, emtechnik, Maxdorf, Germany) to 10 L min–1. Customized LED lights (Eckel electronics, Trofaiach, Austria) provided 47% red, 21% green, 20% blue, 11% far-red light with 1450 μmol m–2 s–1 at mid chamber height. Light intensity was measured beforehand in an empty chamber at different heights and calculated for each tree individual at mid canopy height. Each chamber had two outlets in the bottom plate, which were either used for (1) online-VOC measurements with a PTR-TOF-MS (PTR-TOF 6000 X2, IONICON Analytik GmbH, Innsbruck, Austria; Sulzer et al., 2014) and CO2/H2O gas measurements (IRGA CIRAS-3 DC/SC, PP-System, Amesbury, MA, United States) or (2) as an overflow (preventing over-pressure). Outlets (1) of the tree- and control-chambers were sequentially sampled by PTR-TOF-MS and IRGA through a set of electric valves (Figure 1).
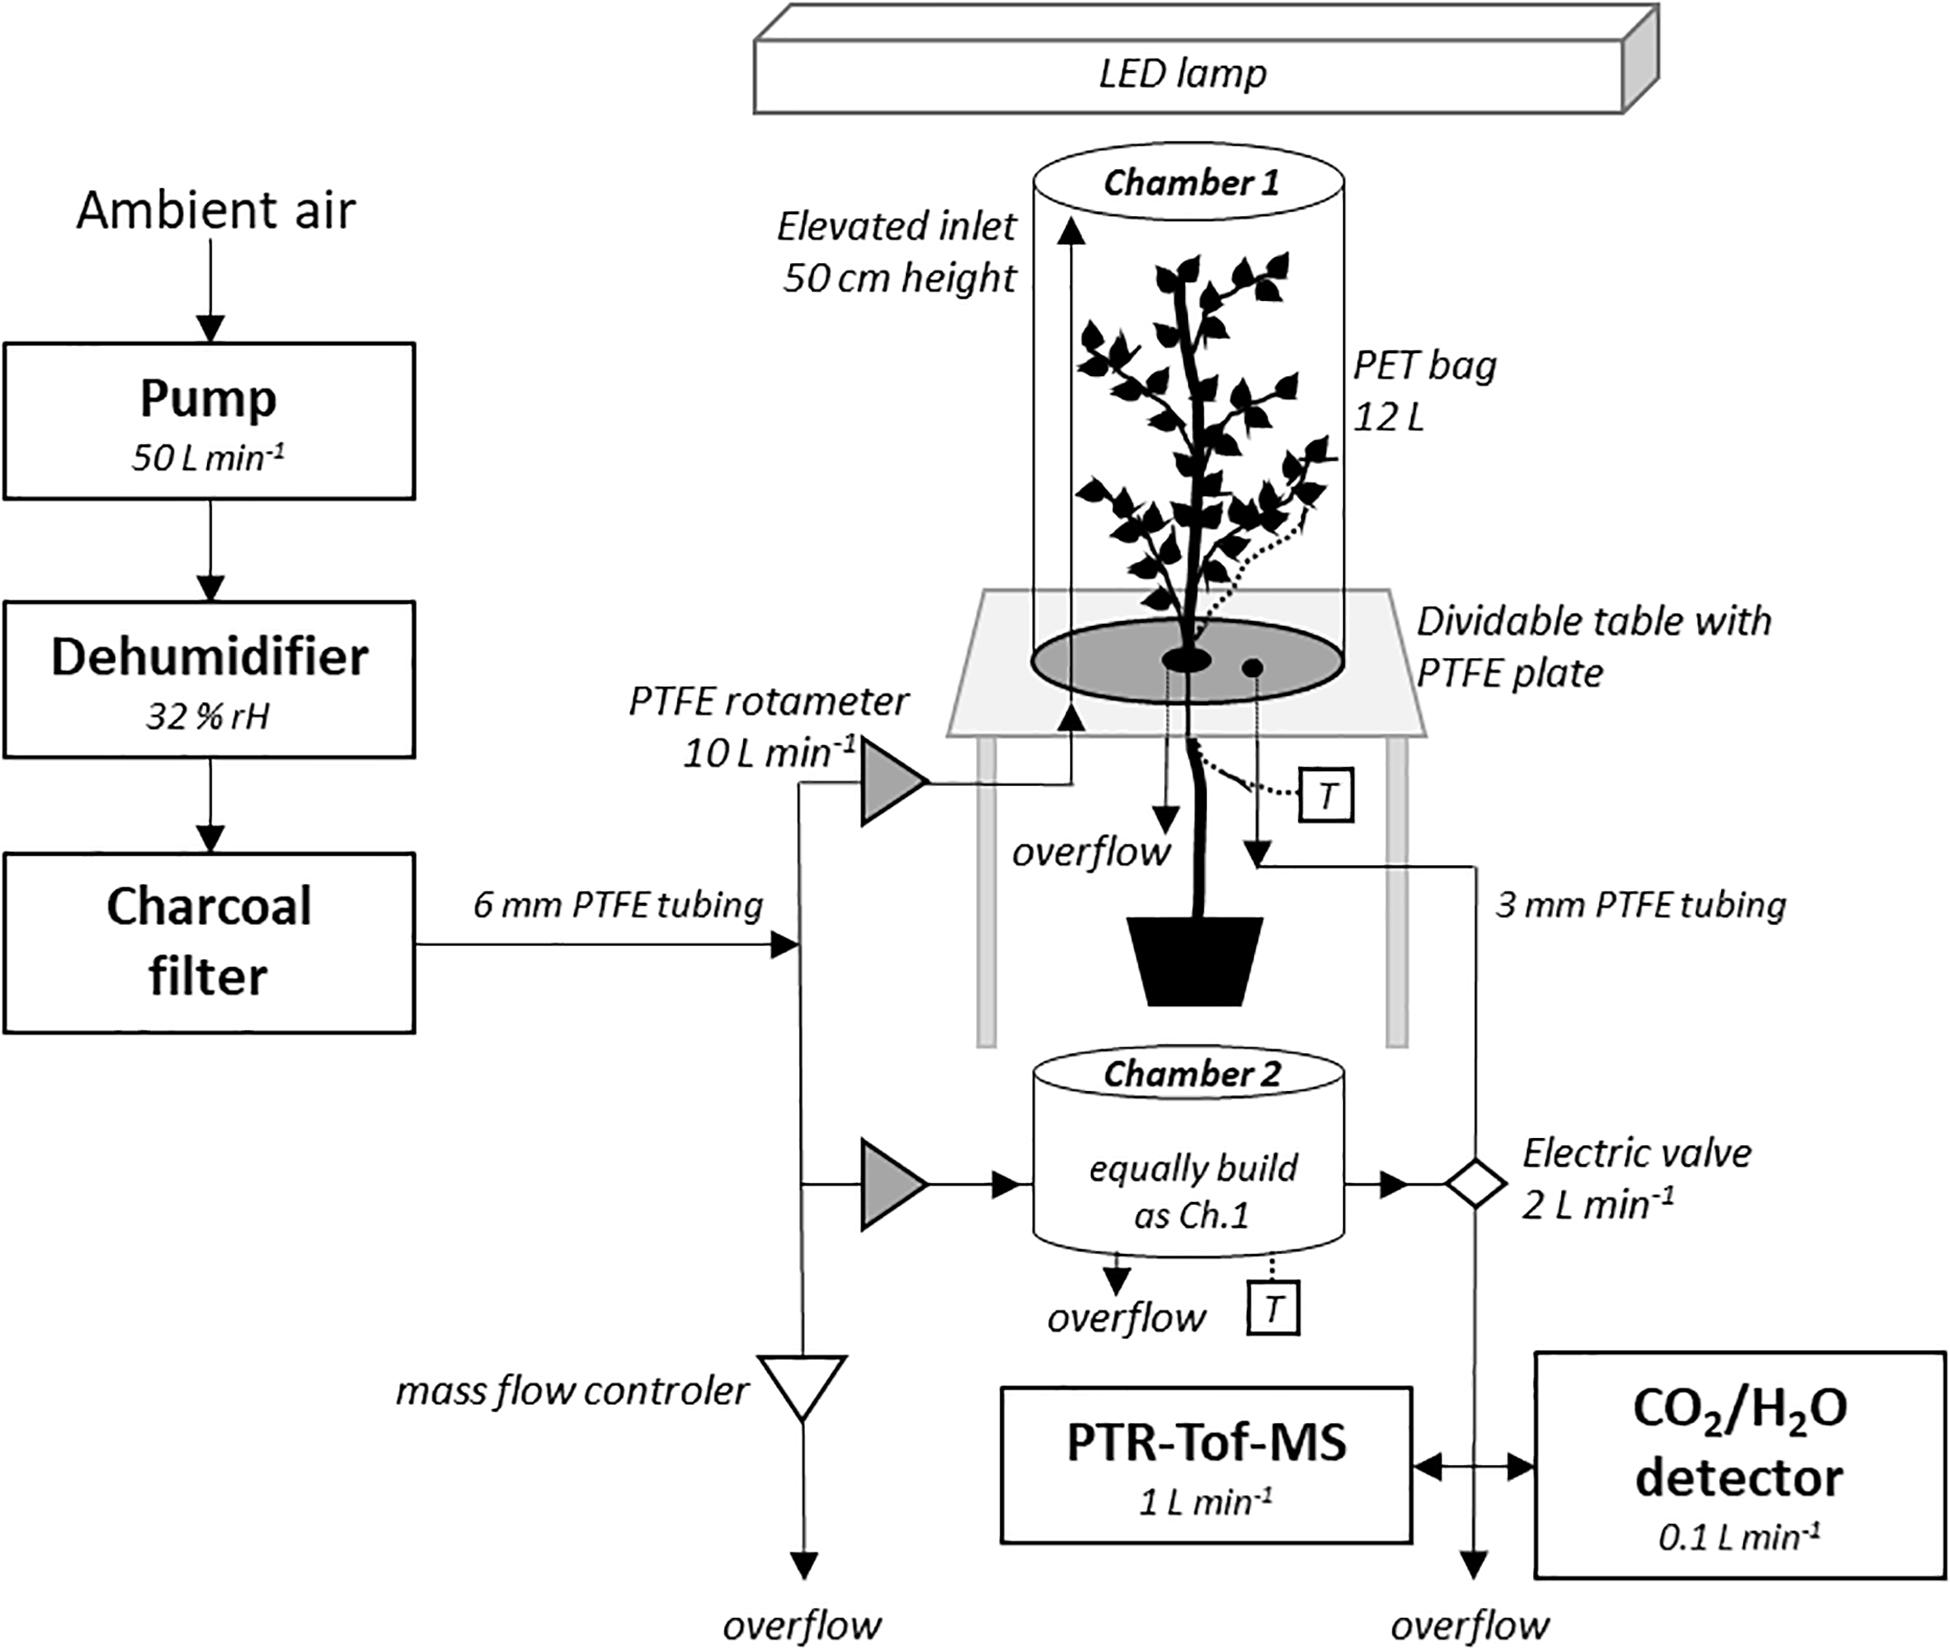
Figure 1. Setup of the experiment of the VOC chambers. Ambient air was flushed through the dehumidifier (32% RH) and the charcoal filter for providing close-to VOC-free air. The incoming air was entering each chamber through an elevated inlet. A mass flow controller was regulating the incoming air pressure. The PTFE-covered table was dividable, allowing for tree insertion, and sealed with a PTFE-coated silicon stopper. A tree was inserted into chamber 1, whereas chamber 2 remained empty for parallel VOC background measurements. A thermocouple (T) was installed at both chambers. A PET-bag was placed over the bottom plate and sealed. Two outlets in the bottom of the PTFE plates of each chamber were used as overflow and for gas analysis by the PTR-TOF-MS and CO2/H2O detector, respectively. See “Materials and Methods” for details, and Supplementary Figure 1 for images of the chamber.
Each tree was acclimated to the chamber environment for 2 h for stabilizing VOC emission rates. After 2 h, VOCs, CO2 and H2O were sampled twice for 5 min with a 15 min gap in between; means were calculated by combining both 5 min sampling periods. Detailed VOC emission calculations are listed in Supplementary Materials and Methods. The PTR-TOF-MS was operated in H3O+ mode at 350 V drift voltage, ion funnel settings of 1 MHz and 35 V amplitude as well as 35 VDC, drift pressure of 2.5 mbar and drift tube temperature of 100°C. It was calibrated daily using a VOC standard mixture (Apel Riemer Environmental Inc., Broomfield, CO, United States) containing 15 compounds following Peron et al. (2021). VOCs emitted by the tree-chamber and tubing were measured in the yet empty chamber (before enclosing a tree) and were subsequently subtracted from the VOC emission rates measured (see Supplementary Materials and Methods for details). Background VOCs of the incoming air (after passing the charcoal filter) were accounted for by the parallel, empty control-chamber (Figure 1).
We used the software Data Analyzer v.4 (Müller et al., 2013) to analyze PTR-TOF-MS results. Mass to charge ratios (m/z) were assigned to compounds as described in Peron et al. (2021); all the analyzed compounds are reported at the respective nominal m/z. Isoprene was detected at m/z 69, oxygenated products of isoprene methyl vinyl ketone (MVK) and methacrolein (MAC) at m/z 71, methyl ethyl ketone (MEK) at m/z 73, and 2-methyl-3-buten-2-ol (MBO) at m/z 87. The sum of monoterpenes (MT) was detected at m/z 137, and the sum of sesquiterpenes (SQT) at m/z 205. M/z 93 is indicative for toluene, but some monoterpenes show a minor fragment at that mass-to-charge ratio (Tani et al., 2003). Here, m/z 93 was associated to toluene emissions but the ambiguity is indicated throughout the text. GLVs were assigned to hexanal at m/z 101, hexenal at m/z 99, hexene at m/z 85, hexenyl acetate at m/z 143, and hexyl acetate at m/z 145. Shikimate BVOCs were tentatively assigned for benzene at m/z 79, benzaldehyde at m/z 107, methyl salicylate (MeSA) at m/z 153, and eugenol at m/z 165. Among oxygenated VOCs (OVOCs), methanol was assigned to m/z 33, ethanol to m/z 47, acetaldehyde to m/z 45, acetic acid to m/z 61, and acetone to m/z 59. Measurement precision, based on daily calibration, varied in the order of 8–20% depending on the compound (data not shown). Compounds with a concentration below <0.05 ppbv were considered not quantifiable (∼limit of quantification, LOQ). However, since the PTR-TOF-MS response is theoretically linear over the detected range, we extrapolated beyond the concentrations of the standard and report derived emission rates for these compounds. All emission rates were expressed per unit leaf area in nmol m–2 s–1. Light intensity and temperature recordings were used for calculating standardized VOC emissions for isoprene and acetaldehyde (Guenther et al., 1993), MT, and SQT emissions (Geron et al., 1994; see Supplementary Materials and Methods for details). All detected compounds were summed as total constitutive VOC emissions per species and expressed as absolute and relative values. VOC emission rates of “low concentration” VOCs, i.e., excluding the main emitted VOCs (isoprene for Q. robur, monoterpenes for F. sylvatica, and methanol for B. pendula and C. betulus) were calculated for comparison.
CO2 and H2O concentrations and leaf temperature in the chambers were used to calculate assimilation rate and stomatal conductance — characterizing plant physiological activity in parallel to the VOC measurements. In brief, the difference of gas concentrations in the tree-chamber and empty control-chamber during the VOC measurements and gas flow rates were used, following the manufacturer’s guidelines (PP-Systems, 2018); see Supplementary Materials and Methods for details.
Statistical Analyses
The data collected with the PTR-TOF-MS was processed and averaged over the sampling time periods with MATLAB (MATLAB and Statistics Toolbox Release 2017; The MathWorks, Inc., Natick, MA, United States). Statistical analysis of assimilation rate, stomatal conductance, and VOC emissions were performed using R 4.0.5 (R Core Team, 2020). The mean and SD were calculated for all VOC emissions per species. To investigate species differences of normally distributed data (i.e., log-transformed SQT and total VOC emissions, and stomatal conductance), one-way analysis of variance (ANOVA) and Tukey’s HSD test were performed. Relative emission rates were calculated and visualized using the R package “ggplot2” (Wickham, 2016). To determine whether VOC emission patterns co-varied along major axes across and within species, e.g., due to shared pathways, we conducted a principal component analysis (PCA) using R packages “factoextra” (Kassambara and Mundt, 2017) and “ggbiplot” (Wickham, 2016). Pearson correlations were conducted to determine correlations between single VOC emissions using R package “corrplot” (Wei et al., 2017). Across the manuscript, similar colors were used for VOCs related to specific pathways and/or identified as OVOCs.
Results and Discussion
Composition of VOC Blends
Our study found different VOC blends for Q. robur, F. sylvatica, B. pendula, and C. betulus at seedling stage (Table 1 and Supplementary Tables 2, 3). A total of 22 m/z were detected above background concentrations in a dynamic VOC-chamber system with an online PTR-TOF-MS (Figure 1). Throughout the sampling period, neither diurnal (morning, afternoon) nor weekly (June to July) changes of VOC emissions were observed (data not shown). While stomatal conductance partly regulates the constitutive emissions depending on the VOC’s volatility (Grote et al., 2013), stomatal conductance did not differ significantly between species. Assimilation rates suggest that the trees were not stressed (Supplementary Table 1).
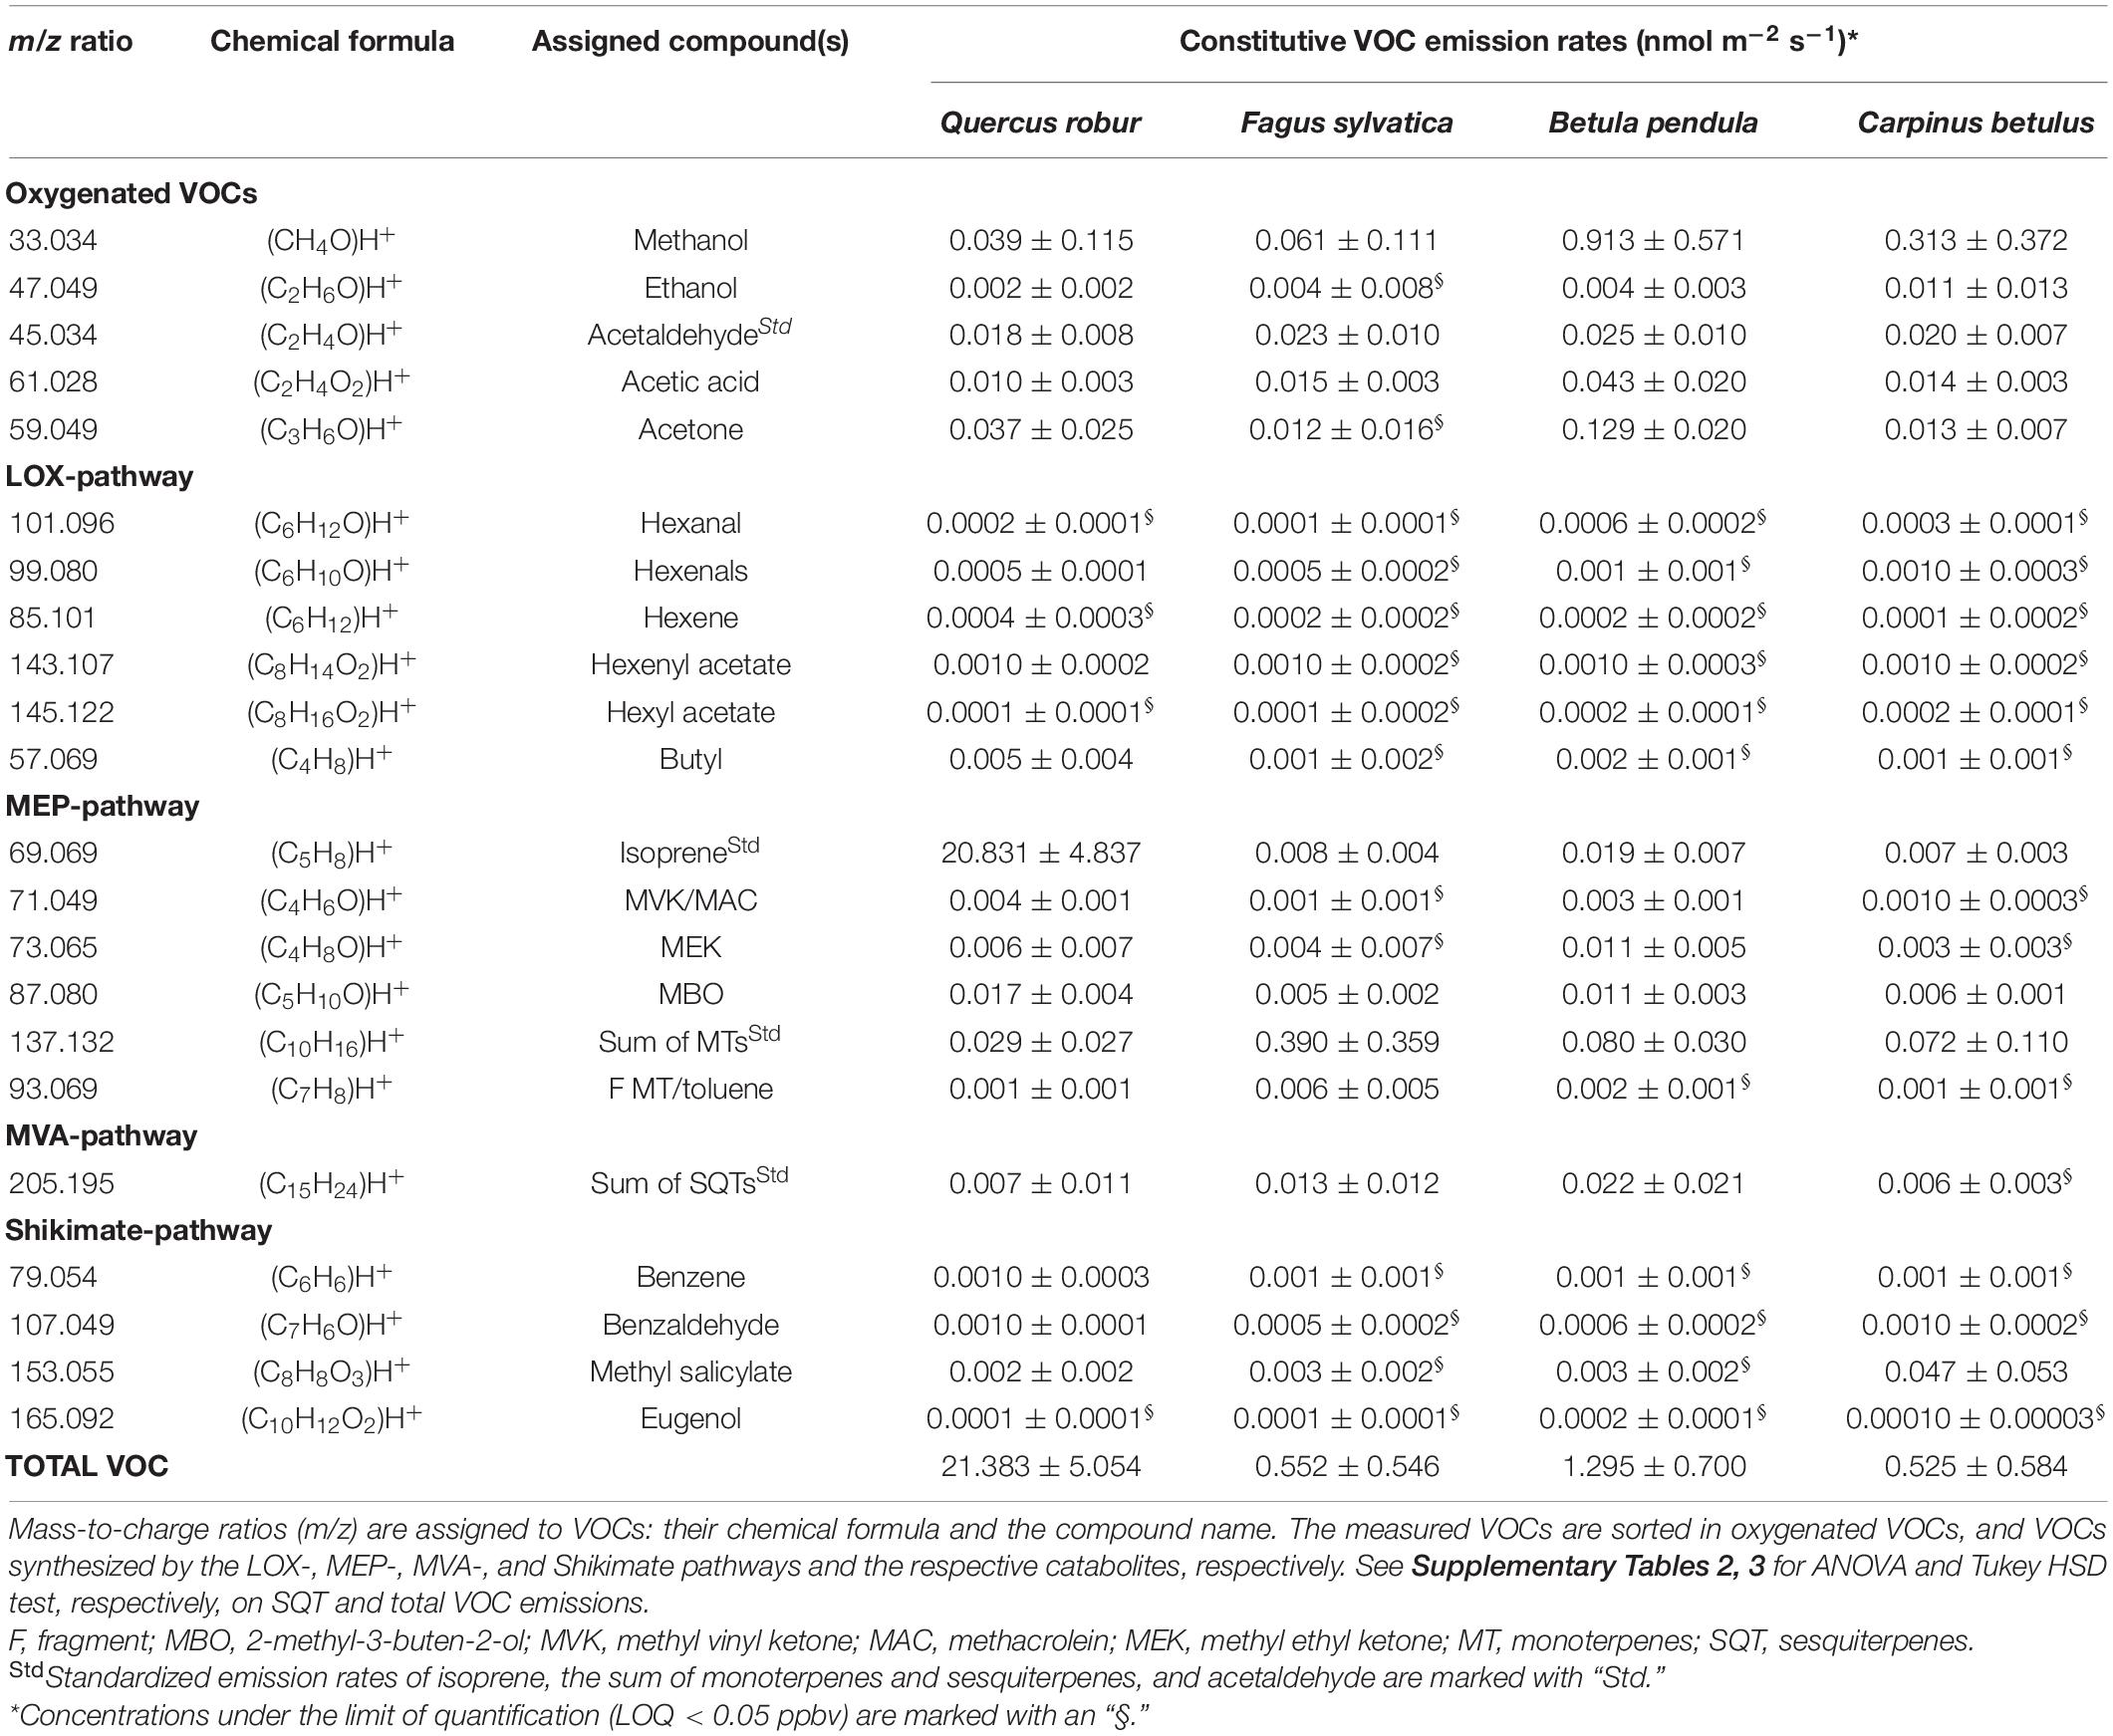
Table 1. Constitutive VOC emission rates (nmol m–2 s–1) of Q. robur, F. sylvatica, B. pendula, and C. betulus seedlings (Mean ± SD).
The main constitutive VOC emitted by Q. robur was isoprene (20.83 μmol m–2 s–1, 97.5% of total VOC emission), while monoterpenes (0.39 μmol m–2 s–1, 70.9% of total VOC emission; Table 1 and Figure 2) dominated the emission spectra of F. sylvatica, confirming previous reports (Karl M. et al., 2009; van Meeningen et al., 2016; Peron et al., 2021). B. pendula emitted significantly greater amounts of sesquiterpenes compared to Q. robur (p < 0.05; Table 1 and Supplementary Table 3). The recorded sesquiterpene emissions were 50% higher than previously reported (König et al., 1995; Duhl et al., 2008), but 90% lower than reported by Karl M. et al. (2009). However, sesquiterpene emissions contributed only 1.7% to B. pendula’s emission spectra, which was dominated by methanol (0.93 μmol m–2 s–1, 72.2%). The proposed “close-to-zero emitter” C. betulus (Karl M. et al., 2009) emitted VOCs in similar amounts as F. sylvatica and B. pendula (Table 1); the main emitted VOC was also methanol (0.31 μmol m–2 s–1, 60.3%; Table 1 and Figure 2). While elevated methanol emissions were often detected in above-canopy measurements of ecosystems containing C. betulus (Acton et al., 2016; Schallhart et al., 2016), specific methanol emission rates of C. betulus were, to the best of our knowledge, not previously reported, or even explicitly not detected among OVOCs (König et al., 1995). Our data thus constitutes that B. pendula and C. betulus seedlings dominantly emit OVOCs, specifically methanol. Monoterpene emissions of C. betulus constitute 13.8% of released VOCs (Figure 2), confirming earlier reports (Karl M. et al., 2009; Zemankova and Brechler, 2010).
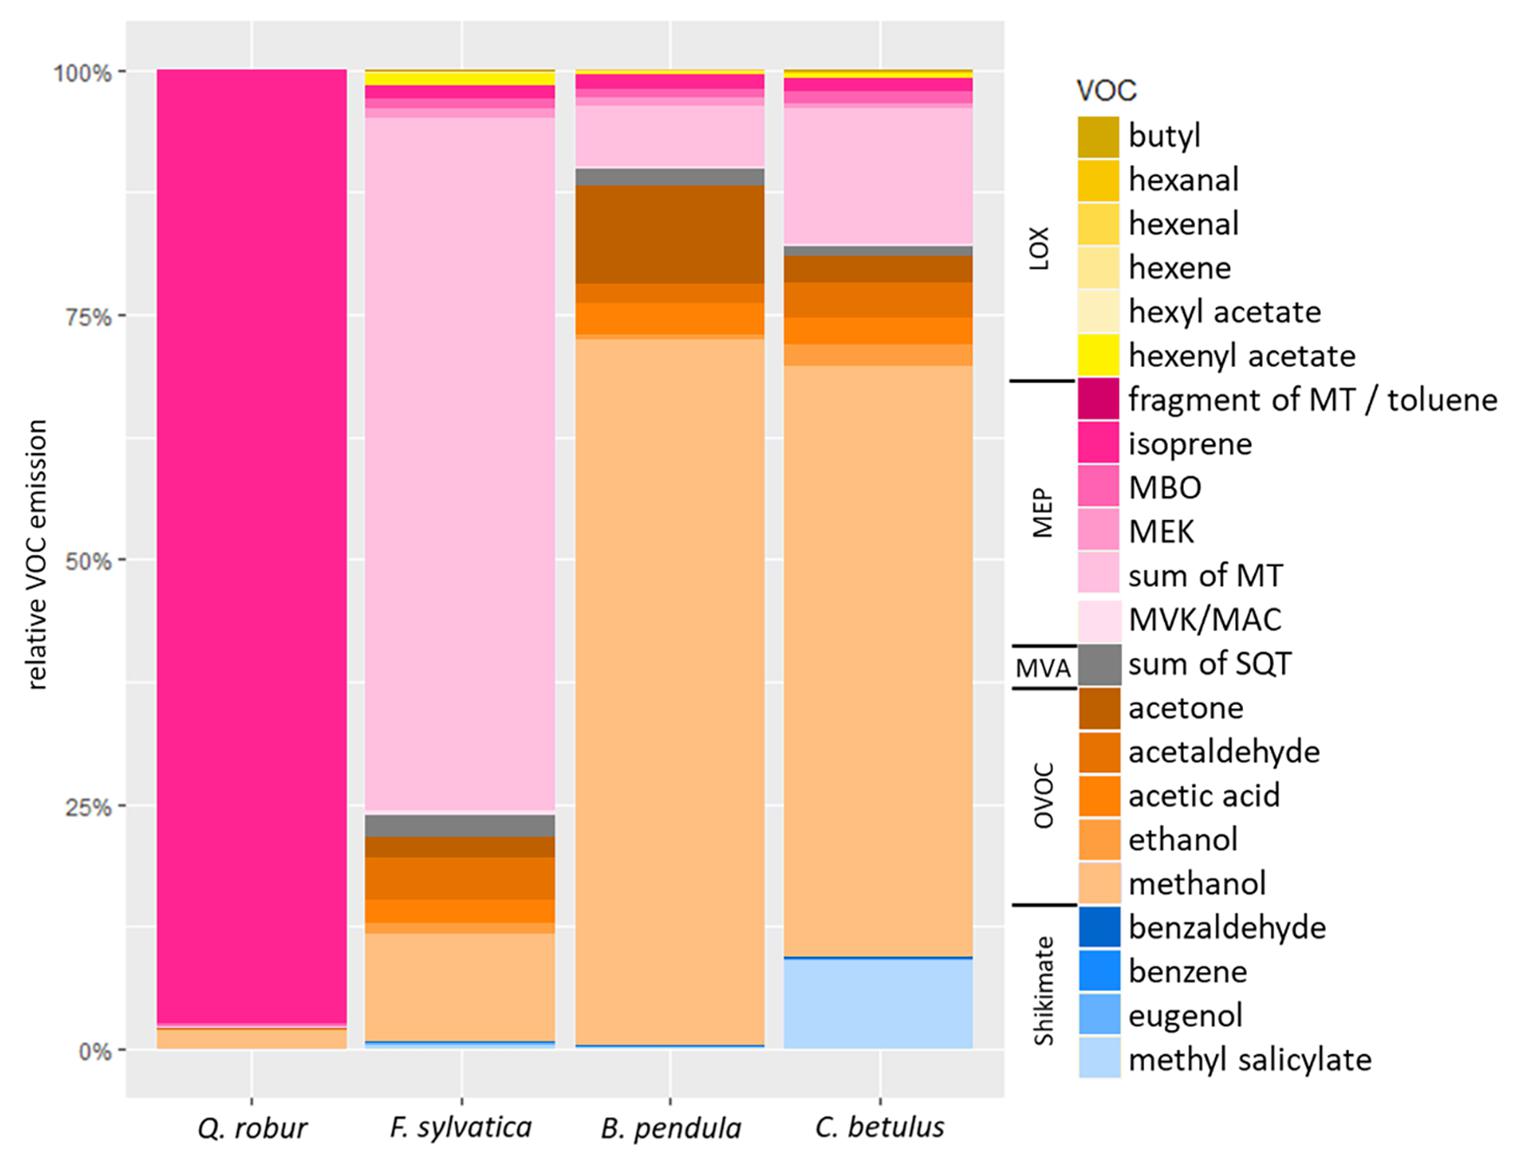
Figure 2. Relative constitutive VOC emission rates (%) of Q. robur, F. sylvatica, B. pendula, and C. betulus seedlings. VOCs are color-coded as being related to LOX- (yellow), MEP- (magenta), MVA- (gray), and Shikimate (blue) pathways or being oxygenated VOCs (OVOCs; orange). MBO, 2-methyl-3-buten-2-ol; MVK, methyl vinyl ketone; MAC, methacrolein; MEK, methyl ethyl ketone; MT, monoterpenes; SQT, sesquiterpenes. See Table 1 for VOC emission rates.
Out of the 22 detected VOCs, 18 were emitted at rates above LOQ by Q. robur (99.6% of total emissions), 7 by F. sylvatica (94.4%), 11 by B. pendula (99.1%), and 11 by C. betulus (96.9%; Table 1 and Figure 2). Excluding the mainly emitted VOCs discussed above, other VOCs accounted for 2.5% of total VOC emissions in Q. robur (0.55 μmol m–2 s–1) only, but amounted to ∼29% of total emissions in B. pendula and F. sylvatica (0.36 and 0.16 μmol m–2 s–1, respectively). In C. betulus, emissions of these “less frequent” VOCs even accounted for ∼40% (0.21 μmol m–2 s–1) of total emissions (Table 1 and Figure 2). Note that the proportion of non-quantifiable VOCs (<LOQ) was slightly greater in F. sylvatica and C. betulus than in the other two species, ranging between 3 and 5% of total emissions. For example, sesquiterpene concentrations were not quantifiable in C. betulus, contradicting high emission rates reported earlier (König et al., 1995). In turn, emissions of some GLVs (i.e., hexenal, hexenyl acetate, and butyl) were only quantifiable in Q. robur (Table 1). In contrast, two elevated emission rates in specific species are noteworthy: acetone emissions were particularly high in B. pendula (10.1% of total emission) while being rather low for other species (<2.6%). Similarly, MeSA constituted 9.1% of C. betulus total emissions, i.e., MeSA emission rates being ∼15 times greater than in the other tree species (Figure 2). Among the further VOCs emitted by all species at low rates, for example, ethanol, acetaldehyde, and acetic acid constituted <4.1% of total emissions, while MBO accounted for <1.2% of total emissions (Table 1 and Figure 2).
VOC Mapping to Metabolic Pathways, Catabolic Processes, and Known Functions
Volatile organic compounds are produced by all plant parts. However, as flowers were absent in the measured trees, synthesis of VOCs likely took place in mesophyll cells with release through stomata or cuticle (Loreto and Schnitzler, 2010). Some VOCs, however, may be released by the shoot after translocation from the root system (Delory et al., 2016). The detected VOCs are associated with either MEP-, MVA-, LOX-, and Shikimate pathways or are OVOCs derived from catabolic processes as discussed below. For a schematic overview on the interrelation of biochemical pathways related to VOC emissions see Maffei (2010).
Seven VOCs are related to the MEP-pathway (Table 1). Isoprene and monoterpenes were emitted by all species, as discussed above, and serve, e.g., as antioxidants under ozone and heat stress (König et al., 1995; Oikawa and Lerdau, 2013). MBO was emitted by all tree species at low rates (Table 1 and Figure 2). As isoprene, MBO is formed from the precursor DMAPP (dimethylallyl diphosphate) and has antioxidant functions (Lichtenthaler, 2007; Jardine et al., 2013). In contrast, MVK, MAC, and MEK are photo-oxidative products of isoprene and occur in high quantities at high ozone levels (Karl T. et al., 2009; Fares et al., 2015). Congruously, they were emitted by all studied tree species at rather low rates. Last, toluene (m/z 93), was emitted in quantifiable amounts by F. sylvatica and Q. robur (Table 1). The function and origin of toluene is still uncertain, particularly if it is synthesized by the MEP, MVA- or Shikimate-pathway (Heiden et al., 1999; Misztal et al., 2015). However, as m/z 93 may potentially comprise also a monoterpene fragment (in particular in the distinct MT emitter F. sylvatica), toluene has been assigned here as MEP-related.
Sesquiterpenes are synthesized by the MVA-pathway and were detected in all species. Sesquiterpenes constitute many different compounds, however, the SQTs blend emitted from herbivore- or phytopathogen-infested plants is often more diverse than of healthy plants (Mofikoya et al., 2019 and references within). As sesquiterpene emissions are often herbivore-induced, it is not surprising that SQTs were emitted at relatively low rates. The herbivore-free conditions of our experiment may also explain why SQT concentrations were not quantifiable in C. betulus, in contrast to earlier findings reporting high emission rates in situ (König et al., 1995).
Six different GLVs related to the LOX-pathway were identified and detected in all tree species. Since GLVs are mainly emitted in response to herbivory or other mechanical damage of leaf tissue, their constitutive emission rates could be expected to be low (Holopainen and Blande, 2013; Scala et al., 2013). However, among the plants initially established (i.e., at Tulln greenhouse) we observed few Q. robur individuals with a slight infection of powdered mildew (Erysiphe alphitoides), known to increase emissions of LOX-originated VOCs (Copolovici et al., 2014). While all individuals with visible infection signs were rigorous excluded from further use, we cannot completely preclude that some Q. robur plants were at an early stage of infection. This may have already induced elevated emissions of some GLVs (i.e., hexenal, hexenyl acetate, and butyl) in Q. robur (Table 1).
Four VOCs synthesized by the Shikimate-pathway were observed, mostly in low to very low concentrations (Table 1). MeSA emissions increase the stress tolerance against wounding, pathogen infestation and salt stress (Weaver and Herrmann, 1997; Zhang et al., 2011). Alternatively, benzenoids such as benzaldehyde, eugenol, and MeSA were previously related to insect attraction (Guerrieri, 2016; Junker, 2016; Binyameen et al., 2018). As neither such stressors nor flowers were present on the tested individuals, further studies are required to determine potential triggers, and the functional significance, of elevated MeSA emissions in C. betulus.
As methanol is the third most abundant VOC emitted by vegetation (Messina et al., 2016), it does not surprise that methanol is a key VOC within the emission blends of all four species—dominating in particular among the six OVOC compounds (Table 1). Since methanol is released during demethylesterification of cell wall pectins (Fall and Benson, 1996; Dorokhov et al., 2018), large methanol emissions may indicate rapid cell wall expansion and restructuring during growth (Niinemets et al., 2011). The greater juvenile growth rate of seedlings, particular of the fast-growing pioneer species B. pendula, may underlie the detected high methanol emissions compared to mature trees. Similar, we can only speculate that the greater acetone emissions of B. pendula were related to a high growth rate associated with changes among cellular membranes (Schade and Goldstein, 2006). Alternatively, cutting and/or fatty acid degradation have previously been shown to underly increased acetone emissions (Macdonald and Fall, 1993; De Gouw et al., 2000; Warneke et al., 2002). Ethanol, which is produced during low oxygen events by ethanol fermentation, can be upregulated during oxidative stress and can be transported from the roots into the leaves, where it is oxidized to acetaldehyde and eventually to acetic acid (Oikawa and Lerdau, 2013). During stress events, ethanol offers a fast C-source to be incorporated into steroids and fatty acids and is therefore catabolized to acetic acid (Kesselmeier and Staudt, 1999). Because the soil was watered to field capacity, hypoxic conditions resulting from water logging were unlikely to occur and the source of ethanol remains unknown. Acetaldehyde emissions can occur as a product of ethanol oxidation, and as a byproduct due to a release of excess pyruvate during dark/shaded conditions, whereas further origins are unknown (Karl et al., 2002).
Across the contrasting tree species, emitted VOCs were dominantly synthesized by the MEP-pathway or were OVOCs. C. betulus, however, additionally emitted larger quantities of MeSA, related to the Shikimate-pathway (Figure 2).
Co-emission Pattern Among VOCs
The detected emission spectra allow to speculate that a coordination between emission rates of specific VOCs, and thus potentially of stress responses, exist within and across pathways and catabolic reactions. To study the interrelation between emissions, a PCA was performed across species (Figure 3; PCAs per species can be found in Supplementary Figure 2). Pearson correlations were used to determine correlations between specific VOC emissions (Figure 4).
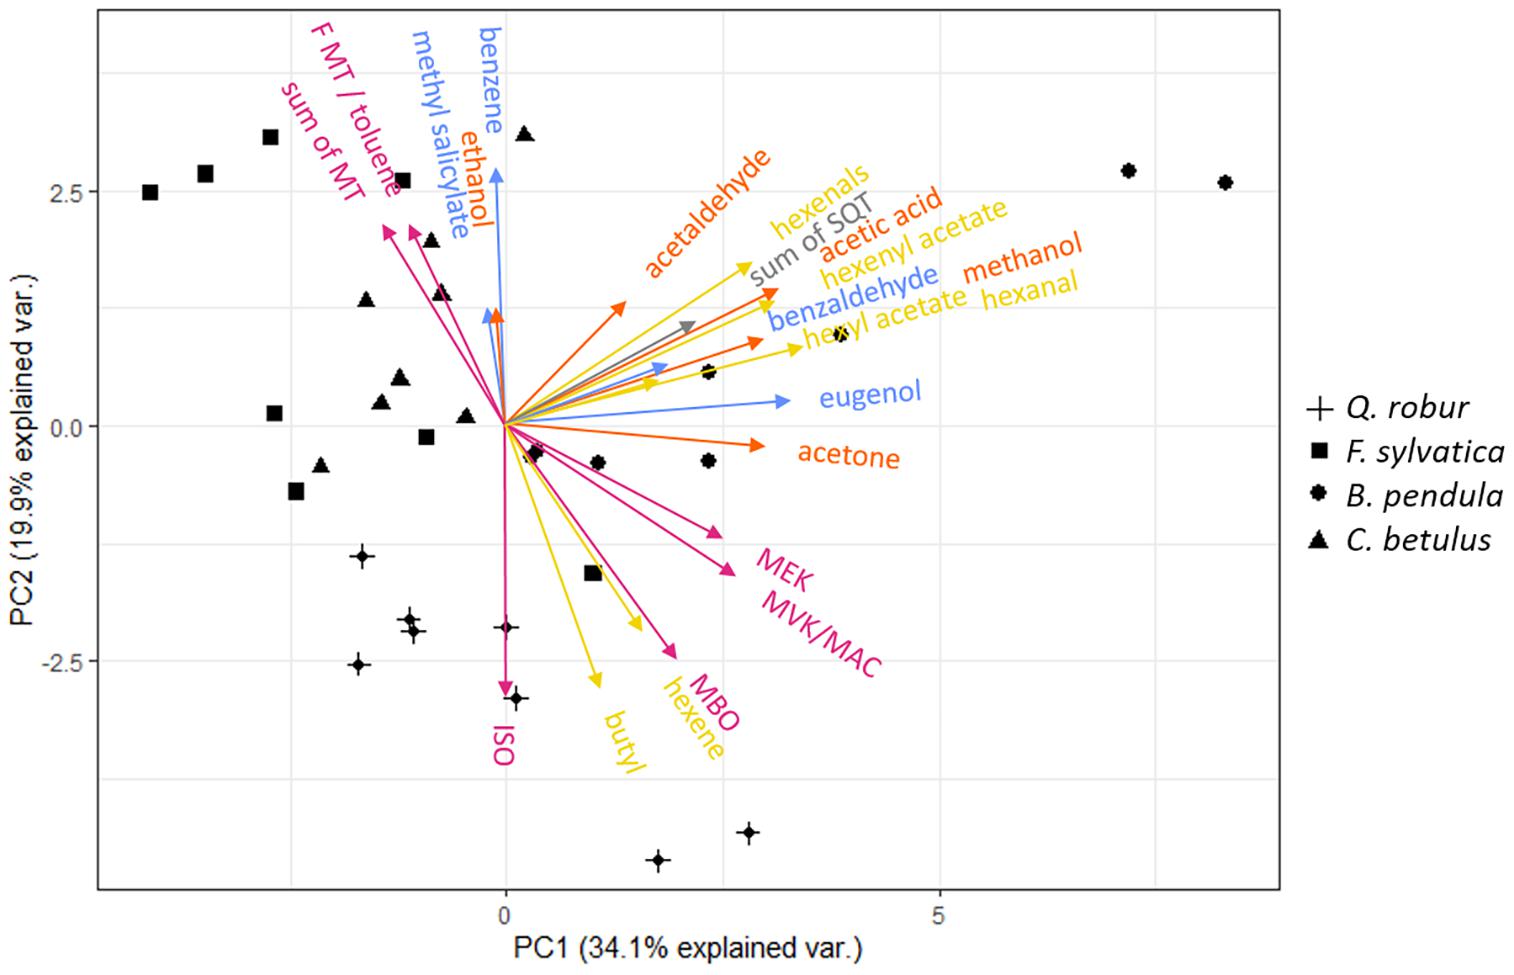
Figure 3. Principal component analysis (PCA) of 22 m/z assigned to constitutive VOC emissions of Q. robur (cross), F. sylvatica (square), B. pendula (circle), and C. betulus (triangle) seedlings. ISO, isoprene; MBO, 2-methyl-3-buten-2-ol; MVK, methyl vinyl ketone; MAC, methacrolein; MEK, methyl ethyl ketone; MT, monoterpenes; SQT, sesquiterpenes. Color-codes indicate VOC related to the LOX (yellow), MEP (magenta), Shikimate (blue), and MVA (gray, i.e., SQT) pathways, and oxygenated VOCs (orange), respectively. See Supplementary Table 4 for PC 1–4 loadings, and Supplementary Figure 2 for species-specific PCAs.
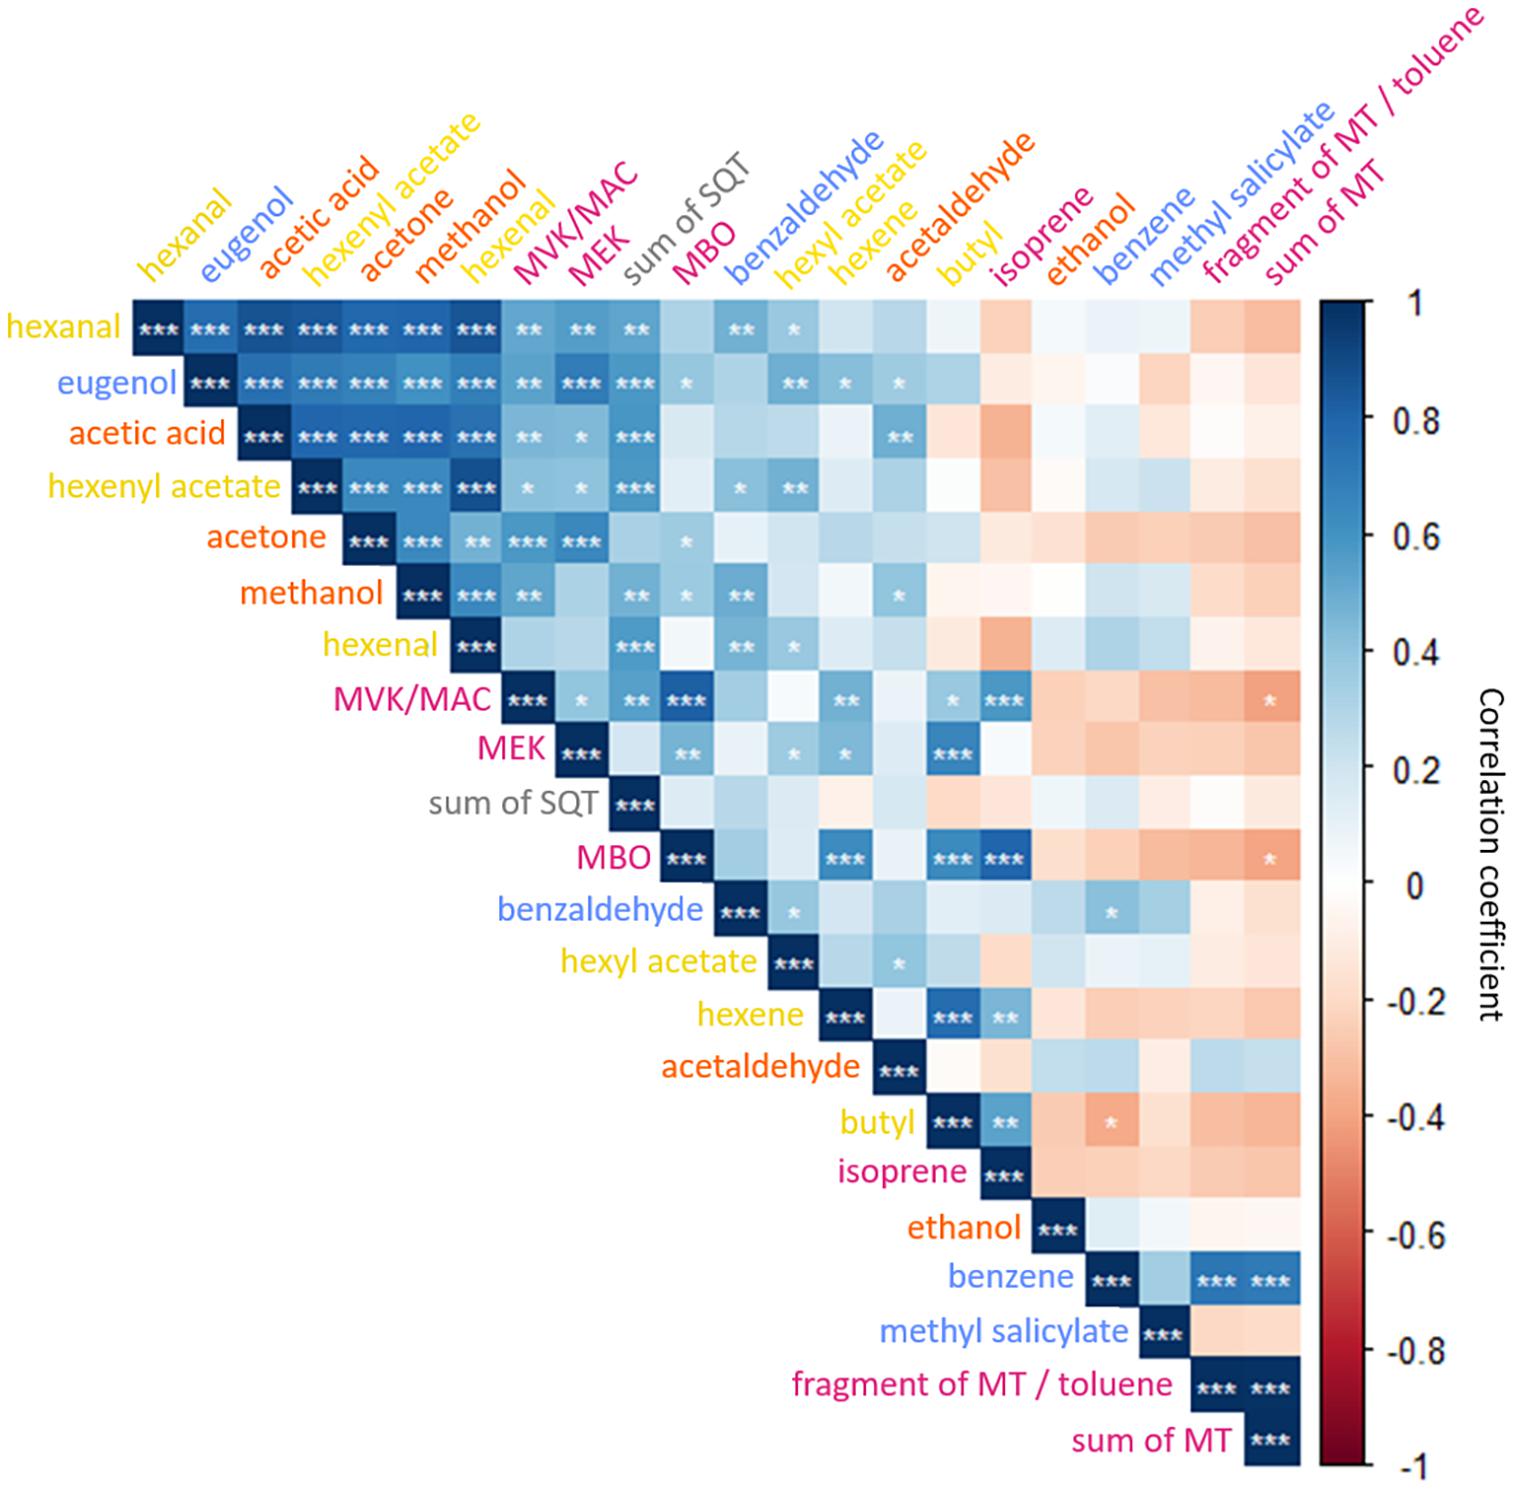
Figure 4. Matrix of Pearson correlation coefficients of 22 m/z assigned to constitutive VOCs of Q. robur, F. sylvatica, B. pendula, and C. betulus seedlings. Levels of significance among positive (blue) and negative (red) correlations are indicated as *p < 0.05, **p < 0.01, ***p < 0.001. ISO, isoprene; MBO, 2-methyl-3-buten-2-ol; MVK, methyl vinyl ketone; MAC, methacrolein; MEK, methyl ethyl ketone; MT, monoterpenes; SQT, sesquiterpenes. Color-code of VOC compounds indicates LOX (yellow), MEP (magenta), Shikimate (blue), and MVA (gray, i.e., SQT) pathways, and oxygenated VOCs (orange).
The two-dimensional space of the PCA ordinated the tree species according to the emissions: The emission composition spread from the most undifferentiated compound composition at the center to the most distinct in outer margins of the lowest compound variability. Spatially close vectors indicate tightly linked, potentially co-regulated VOC emissions. Principal component (PC) 1 separated emissions of hexyl acetate, eugenol, methanol, acetone, hexenal, and acetaldehyde from other VOCs, explaining 34.1% of the total variance. PC 2 separated emissions of monoterpenes, toluene (potentially summed with a MT fragment) and benzene from hexene, butyl, and isoprene, accounting for 19.9% of the total variance. PC 3 and 4 segregated monoterpene emissions and benzaldehyde from other VOCs, accounting for 10 and 8.6% of the total variance, respectively (see Supplementary Table 1 for details). A finer segregation by PC 1 and 2 was grouping hexanal, hexenyl acetate, acetic acid, and sesquiterpene emissions and MVK/MAC, MEK, and MBO emissions. Isoprene and its oxidation products MVK/MAC, MEK, and MBO, but also MTs and toluene (or fragment of MTs) were positively correlated (Figure 4). Methyl salicylate, ethanol, benzaldehyde, and hexyl acetate had small eigenvector values and therefore possess no strong links to other emitted VOCs (Supplementary Table 4).
Volatile organic compounds of the LOX pathway, i.e., hexenal, hexenyl acetate, and hexyl acetate, had a high covariance but did not correlate with hexene and butyl emission rates (Figure 4). Further, OVOCs were positively correlated among each other – except for ethanol. Emission rates of Shikimate pathway-related VOCs possessed no significant covariance among each other (Figure 4). VOCs related to either the LOX- and Shikimate pathways both correlated with the VOCs associated with MEP- and MVA pathways (Figure 4). In contrast, Shikimate-related benzene correlated with emitted monoterpenes, and butyl and hexene of the LOX-pathway with isoprene and OVOC emissions (Figures 3, 4). As the LOX- and Shikimate pathways are both upregulated during wounding and herbivore defense (Loreto and Schnitzler, 2010), it is likely that distinct correlations with other pathways could emerge under stress (Niinemets, 2010).
The segregation of isoprene, monoterpene, and sesquiterpene emissions were concomitant with the segregation of the emitting species, showing species-specific isoprene emissions for Q. robur, monoterpene emissions for F. sylvatica and sesquiterpene emissions for B. pendula (Figure 3). Although Vranová et al. (2013) outline that MEP- and MVA pathways share common metabolites and transcriptional factors, i.e., that MTs and SQTs can be synthesized from isopentenyl diphosphate (IPP) produced by both pathways, our results indicate that this shared precursor does not result in correlated emissions rates. This supports previous findings that isoprenoids synthesized via MEP- and MVA pathways are controlled by independent regulatory networks with restricted connectivity (Vranová et al., 2013). A closer look at VOCs synthesized by the MEP-pathway showed that high isoprene emissions are not associated with high monoterpene emissions (Figures 3, 4). This is supported by previous findings, showing that the MEP-pathway splits into either isoprene or monoterpene synthesis (Laule et al., 2003). Thus, a combined emission of isoprene and monoterpenes only occurs in species featuring isoprenoid-storing organs (Fineschi et al., 2013), which are neither found in Q. robur nor F. sylvatica. The synthesis of isoprene or monoterpenes suggests a species-dependent evolution with environmental stresses, e.g., as a response to high ozone levels and high temperatures (König et al., 1995; Oikawa and Lerdau, 2013).
Methanol emissions were highly correlated with sesquiterpenes, multiple VOCs from the LOX- and Shikimate pathways, and MVK/MAC and MBO (MEP pathway) emission rates (Figures 3, 4). No direct metabolic connection was previously reported for methanol and other VOCs (Loreto and Schnitzler, 2010; Oikawa and Lerdau, 2013; Dorokhov et al., 2018). However, emissions of methanol and GLVs of the LOX-pathway have both been shown to increase after damage or attacks by herbivores (Loreto and Schnitzler, 2010; Dorokhov et al., 2018). Further, we found acetone emissions closely linked with multiple VOCs including eugenol of the Shikimate pathway (Figures 3, 4); to the best of our knowledge, the latter has not been reported so far.
Conclusion
Addressing tree seedlings grown under non-stress conditions, our work showed that the main constitutive VOC of B. pendula was methanol rather than sesquiterpenes. Carpinus betulus can be classified as a methanol and low monoterpene emitter rather than a close-to-zero emitter since its emission rates were similar to those of F. sylvatica and B. pendula. A PCA revealed a main segregation between isoprene, monoterpene and sesquiterpene/methanol emission, which each could be assigned to a tree species. Summarizing, the emission spectra of C. betulus was dominated by MeSA and, as for all other species, by VOCs of the MEP pathway and OVOCs. Clustered PCA-vectors and highly significant Pearson correlations of methanol, ethanol, acetic acid, and acetone illustrate strong co-emission patterns among OVOCs. The diverse volatile blends, with up to 18 co-emitted, quantifiable VOCs in Q. robur, have multiple potential functions, e.g., herbivory defense and antioxidants. As VOC emissions are highly depended on plant physiological status under local environmental conditions (Fitzky et al., 2019), more measurements of full emission profiles under stress conditions are key to advance our understanding of plant-environmental interactions under advancing climate change. In particular, potential changes of VOC emission blends in urban areas require attention due to high concentrations of air pollutants.
Data Availability Statement
The raw data supporting the conclusions of this article will be made available by the authors upon request, without undue reservation.
Author Contributions
AF, TK, MG, DT, HS, and BR: theory and conceptualization. AF, AP, LK, and MM: experimental measurements. AF, AP, LK, and MP: data analysis. AF: figures and tables. AF, HS, MP, and BR: writing of the manuscript. All authors jointly revised and approved the final version.
Funding
Funded by the project “Urban trees and air pollution: Effect of drought and salt stress on the production of VOC and absorption of ozone by different city trees (UOzone)” by the Vienna Science and Technology Fund (WWTF, project number: ESR17-027). AP was partly funded by the doctoral school for “Mountain Climate and Environment” at the University of Innsbruck.
Conflict of Interest
The authors declare that the research was conducted in the absence of any commercial or financial relationships that could be construed as a potential conflict of interest.
Publisher’s Note
All claims expressed in this article are solely those of the authors and do not necessarily represent those of their affiliated organizations, or those of the publisher, the editors and the reviewers. Any product that may be evaluated in this article, or claim that may be made by its manufacturer, is not guaranteed or endorsed by the publisher.
Acknowledgments
The authors greatly thank Pavel Baykalov, Louison Cahen-Fourot, and Matthias Steinparzer for the supporting discussions and help regarding the statistical analysis. The comments of two reviewers significantly improved earlier versions of the manuscript.
Supplementary Material
The Supplementary Material for this article can be found online at: https://www.frontiersin.org/articles/10.3389/fpls.2021.708711/full#supplementary-material
References
Acton, W. J. F., Schallhart, S., Langford, B., Valach, A., Rantala, P., Fares, S., et al. (2016). Canopy-scale flux measurements and bottom-up emission estimates of volatile organic compounds from a mixed oak and hornbeam forest in northern Italy. Atmos. Chem. Phys. 16, 7149–7170. doi: 10.5194/acp-16-7149-2016
Binyameen, M., Ejaz, M., Shad, S. A., Razaq, M., Shah, R. M., and Schlyter, F. (2018). Eugenol, a plant volatile, synergizes the effect of the thrips attractant, ethyl iso-nicotinate. Environ. Entomol. 47, 1560–1564.
Brunner, A., Ammann, C., Neftel, A., and Spirig, C. (2007). Methanol exchange between grassland and the atmosphere. Biogeosciences 4, 395–410. doi: 10.5194/bg-4-395-2007
Canaval, E., Millet, D. B., Zimmer, I., Nosenko, T., Georgii, E., Partoll, E. M., et al. (2020). Rapid conversion of isoprene photooxidation products in terrestrial plants. Commun. Earth Environ. 1, 1–9. doi: 10.1038/s43247-020-00041-2
Copolovici, L. O., Filella, I., Llusià, J., Niinemets, Ü., and Peñuelas, J. (2005). The capacity for thermal protection of photosynthetic electron transport varies for different monoterpenes in Quercus ilex. Plant Physiol. 139, 485–496. doi: 10.1104/pp.105.065995
Copolovici, L., Väärtnõu, F., Estrada, M. P., and Niinemets, Ü. (2014). Oak powdery mildew (Erysiphe alphitoides)-induced volatile emissions scale with the degree of infection in Quercus robur. Tree Physiol. 34, 1399–1410. doi: 10.1093/treephys/tpu091
Dani, K. S., Jamie, I. M., Prentice, I. C., and Atwell, B. J. (2014). Evolution of isoprene emission capacity in plants. Trends Plant Sci. 19, 439–446. doi: 10.1016/j.tplants.2014.01.009
De Gouw, J. A., Howard, C. J., Custer, T. G., Baker, B. M., and Fall, R. (2000). Proton-transfer chemical-ionization mass spectrometry allows real-time analysis of volatile organic compounds released from cutting and drying of crops. Environ. Sci. Technol. 34, 2640–2648. doi: 10.1021/es991219k
Delory, B. M., Delaplace, P., Fauconnier, M.-L., and Du Jardin, P. (2016). Root-emitted volatile organic compounds: can they mediate belowground plant-plant interactions? Plant Soil 402, 1–26. doi: 10.1007/s11104-016-2823-3
Dorokhov, Y. L., Sheshukova, E. V., and Komarova, T. V. (2018). Methanol in plant life. Front. Plant Sci. 9:1623. doi: 10.3389/fpls.2018.01623
Dudareva, N., Klempien, A., Muhlemann, J. K., and Kaplan, I. (2013). Biosynthesis, function and metabolic engineering of plant volatile organic compounds. New Phytol. 198, 16–32. doi: 10.1111/nph.12145
Duhl, T., Helmig, D., and Guenther, A. (2008). Sesquiterpene emissions from vegetation: a review. Biogeosciences 4, 3987–4023. doi: 10.5194/bg-5-761-2008
Ellenberg, H., and Leuschner, C. (2010). Vegetation Mitteleuropas mit den Alpen: in Ökologischer, Dynamischer und Historischer Sicht. Stuttgart: UTB, 1095.
Fall, R., and Benson, A. A. (1996). Leaf methanol—the simplest natural product from plants. Trends Plant Sci. 1, 296–301. doi: 10.1016/S1360-1385(96)88175-0
Fares, S., Paoletti, E., Loreto, F., and Brilli, F. (2015). Bidirectional flux of methyl vinyl ketone and methacrolein in trees with different isoprenoid emission under realistic ambient concentrations. Environ. Sci. Technol. 49, 7735–7742. doi: 10.1021/acs.est.5b00673
Fineschi, S., Loreto, F., Staudt, M., Peñuelas, J., and Niinemets, Ü. (2013). “Diversification of volatile isoprenoid emissions from trees: evolutionary and ecological perspectives,” in Biology, Controls And Models Of Tree Volatile Organic Compound Emissions, ed. R. K. Monson (Dordrecht: Springer), 1–20. doi: 10.1007/978-94-007-6606-8_1
Fitzky, A. C., Sandén, H., Karl, T., Fares, S., Calfapietra, C., Grote, R., et al. (2019). The interplay between ozone and urban vegetation—BVOC emissions, ozone deposition, and tree ecophysiology. Front. For. Glob. Change 2:50. doi: 10.3389/ffgc.2019.00050
Geron, C. D., Guenther, A. B., and Pierce, T. E. (1994). An improved model for estimating emissions of volatile organic compounds from forests in the eastern United States. J. Geophys. Res. 99, 12773–12791. doi: 10.1029/94jd00246
Graus, M., Müller, M., and Hansel, A. (2010). High resolution PTR-TOF: quantification and formula confirmation of VOC in real time. J. Am. Soc. Mass Spectrom. 21, 1037–1044. doi: 10.1016/j.jasms.2010.02.006
Grote, R., Monson, R. K., and Niinemets, Ü. (2013). “Leaf-level models of constitutive and stress-driven volatile organic compound emissions,” in Biology, Controls And Models Of Tree Volatile Organic Compound Emissions, eds R. K. Monson and Ü. Niinemets (Dordrecht: Springer), 315–355. doi: 10.1007/978-94-007-6606-8_12
Guenther, A. B., Zimmerman, P. R., Harley, P. C., Monson, R. K., and Fall, R. (1993). Isoprene and monoterpene emission rate variability: model evaluations and sensitivity analyses. J. Geophys. Res. 98, 12609–12617. doi: 10.1029/93JD00527
Guenther, A., Hewitt, C. N., Erickson, D., Fall, R., Geron, C., Graedel, T., et al. (1995). A global model of natural volatile organic compound emissions. J. Geophys. Res. 100, 8873–8892. doi: 10.1029/94jd02950
Guenther, A., Karl, T., Harley, P., Wiedinmyer, C., Palmer, P. I., and Geron, C. (2006). Estimates of global terrestrial isoprene emissions using MEGAN (Model of Emissions of Gases and Aerosols from Nature). Atmos. Chem. Phys. 6, 3181–3210. doi: 10.5194/acp-6-3181-2006
Guerrieri, E. (2016). “Who’s listening to talking plants?,” in Deciphering Chemical Language Of Plant Communication, eds J. D. Blande and R. Glinwood (Dordrecht: Springer), 117–136. doi: 10.1007/978-3-319-33498-1_5
Heiden, A., Kobel, K., Komenda, M., Koppmann, R., Shao, M., and Wildt, J. (1999). Toluene emissions from plants. Geophys. Res. Lett. 26, 1283–1286. doi: 10.1029/1999gl900220
Holopainen, J. K., and Blande, J. D. (2013). Where do herbivore-induced plant volatiles go? Front. Plant Sci. 4:185. doi: 10.3389/fpls.2013.00185
Holopainen, J. K., and Gershenzon, J. (2010). Multiple stress factors and the emission of plant VOCs. Trends Plant Sci. 15, 176–184. doi: 10.1016/j.tplants.2010.01.006
Jardine, K. J., Meyers, K., Abrell, L., Alves, E. G., Serrano, A. M. Y., Kesselmeier, J., et al. (2013). Emissions of putative isoprene oxidation products from mango branches under abiotic stress. J. Exp. Bot. 64:3669. doi: 10.1093/jxb/ert202
Junker, R. R. (2016). “Multifunctional and diverse floral scents mediate biotic interactions embedded in communities,” in Deciphering Chemical Language Of Plant Communication, eds J. D. Blande and R. Glinwood (Dordrecht: Springer), 257–282. doi: 10.1007/978-3-319-33498-1_11
Kanagendran, A., Pazouki, L., and Niinemets, Ü. (2018). Differential regulation of volatile emission from Eucalyptus globulus leaves upon single and combined ozone and wounding treatments through recovery and relationships with ozone uptake. Environ. Exp. Bot. 145, 21–38. doi: 10.1016/j.envexpbot.2017.10.012
Karl, M., Guenther, A., Köble, R., Leip, A., and Seufert, G. (2009). A new European plant-specific emission inventory of biogenic volatile organic compounds for use in atmospheric transport models. Biogeosciences 6, 1059–1087. doi: 10.5194/bg-6-1059-2009
Karl, T., Curtis, A., Rosenstiel, T., Monson, R., and Fall, R. (2002). Transient releases of acetaldehyde from tree leaves- products of a pyruvate overflow mechanism? Plant Cell Environ. 25, 1121–1131. doi: 10.1046/j.1365-3040.2002.00889.x
Karl, T., Guenther, A., Turnipseed, A., Tyndall, G., Artaxo, P., and Martin, S. (2009). Rapid formation of isoprene photo-oxidation products observed in Amazonia. Atmos. Chem. Phys. 9, 7753–7767. doi: 10.5194/acp-9-7753-2009
Kassambara, A., and Mundt, F. (2017). Package “factoextra”. Available online at: https://cran.r-project.org/web/packages/factoextra/index.html (accessed October 1, 2020).
Kergunteuil, A., Humair, L., Maire, A. L., Moreno-Aguilar, M. F., Godschalx, A., Catalán, P., et al. (2020). Tritrophic interactions follow phylogenetic escalation and climatic adaptation. Sci. Rep. 10:2074. doi: 10.1038/s41598-020-59068-2
Kesselmeier, J., and Staudt, M. (1999). Biogenic volatile organic compounds (VOC): an overview on emission, physiology and ecology. J. Atmos. Chem. 33, 23–88. doi: 10.1023/A:1006127516791
Kolari, P., Bäck, J., Taipale, R., Ruuskanen, T. M., Kajos, M. K., Rinne, J., et al. (2012). Evaluation of accuracy in measurements of VOC emissions with dynamic chamber system. Atmos. Environ. 62, 344–351. doi: 10.1016/j.atmosenv.2012.08.054
König, G., Brunda, M., Puxbaum, H., Hewitt, C. N., Duckham, S. C., and Rudolph, J. (1995). Relative contribution of oxygenated hydrocarbons to the total biogenic VOC emissions of selected mid-European agricultural and natural plant species. Atmos. Environ. 29, 861–874. doi: 10.1016/1352-2310(95)00026-U
Laule, O., Fürholz, A., Chang, H.-S., Zhu, T., Wang, X., Heifetz, P. B., et al. (2003). Crosstalk between cytosolic and plastidial pathways of isoprenoid biosynthesis in Arabidopsis thaliana. Proc. Natl. Acad. Sci. U.S.A. 100, 6866–6871. doi: 10.1073/pnas.1031755100
Li, T., Holst, T., Michelsen, A., and Rinnan, R. (2019). Amplification of plant volatile defence against insect herbivory in a warming Arctic tundra. Nat. Plants 5, 568–574. doi: 10.1038/s41477-019-0439-3
Li, Z., and Sharkey, T. D. (2013). “Molecular and pathway controls on biogenic volatile organic compound emissions,” in Biology, Controls And Models Of Tree Volatile Organic Compound Emissions, eds R. K. Monson and Ü. Niinemets (Dordrecht: Springer), 119–151.
Lichtenthaler, H. K. (2007). Biosynthesis, accumulation and emission of carotenoids, α-tocopherol, plastoquinone, and isoprene in leaves under high photosynthetic irradiance. Photosyn. Res. 92, 163–179. doi: 10.1007/s11120-007-9204-y
Loreto, F., and Schnitzler, J. P. (2010). Abiotic stresses and induced BVOCs. Trends Plant Sci. 15, 154–166. doi: 10.1016/j.tplants.2009.12.006
Macdonald, R. C., and Fall, R. (1993). Acetone emission from conifer buds. Phytochemistry 34, 991–994. doi: 10.1016/s0031-9422(00)90700-3
Maffei, M. (2010). Changes in biosynthesis of aroma volatile compounds during on-tree maturation of “Pink Lady” apples. South Afr. J. Bot. 76, 612–631. doi: 10.1016/j.postharvbio.2007.07.003
Messina, P., Lathière, J., Sindelarova, K., Vuichard, N., Granier, C., Ghattas, J., et al. (2016). Global biogenic volatile organic compound emissions in the ORCHIDEE and MEGAN models and sensitivity to key parameters. Atmos. Chem. Phys. 16, 14169–14202. doi: 10.5194/acp-16-14169-2016
Misztal, P. K., Hewitt, C. N., Wildt, J., Blande, J. D., Eller, A. S., Fares, S., et al. (2015). Atmospheric benzenoid emissions from plants rival those from fossil fuels. Sci. Rep. 5, 1–10. doi: 10.1007/0-306-46922-7_1
Mofikoya, A. O., Bui, T. N. T., Kivimäenpää, M., Holopainen, J. K., Himanen, S. J., and Blande, J. D. (2019). Foliar behaviour of biogenic semi-volatiles: potential applications in sustainable pest management. Arthropod Plant Interact. 13, 193–212. doi: 10.1007/s11829-019-09676-1
Monson, R. K. (2013). “Metabolic and gene expression controls on the production of biogenic volatile organic compounds,” in Biology, Controls And Models Of Tree Volatile Organic Compound Emissions, eds R. K. Monson and Ü. Niinemets (Dordrecht: Springer), 153–179. doi: 10.1007/978-94-007-6606-8_6
Müller, M., Mikoviny, T., Jud, W., D’Anna, B., and Wisthaler, A. (2013). A new software tool for the analysis of high resolution PTR-TOF mass spectra. Chemometr. Intell. Lab. Syst. 127, 158–165. doi: 10.1016/j.chemolab.2013.06.011
Niinemets, Ü. (2010). Mild versus severe stress and BVOCs: thresholds, priming and consequences. Trends Plant Sci. 15, 145–153. doi: 10.1016/j.tplants.2009.11.008
Niinemets, Ü., Kuhn, U., Harley, P. C., Staudt, M., Arneth, A., Cescatti, A., et al. (2011). Estimations of isoprenoid emission capacity from enclosure studies: measurements, data processing, quality and standardized measurement protocols. Biogeosciences 8, 2209–2246. doi: 10.5194/bg-8-2209-2011
Niinemets, Ü., and Monson, R. K. (2013). “State-of-the-art of BVOC research: what do we have and what have we missed? A synthesis,” in Biology, Controls And Models Of Tree Volatile Organic Compound Emissions, eds R. K. Monson and Ü. Niinemets (Dordrecht: Springer), 509–528. doi: 10.1007/978-94-007-6606-8_18
Oikawa, P. Y., and Lerdau, M. T. (2013). Catabolism of volatile organic compounds influences plant survival. Trends Plant Sci. 18, 695–703. doi: 10.1016/j.tplants.2013.08.011
Pauleit, S., Jones, N., Garcia-Martin, G., Garcia-Valdecantos, J. L., Rivière, L. M., Vidal-Beaudet, L., et al. (2002). Tree establishment practice in towns and cities–Results from a European survey. Urban For. Urban Green. 1, 83–96. doi: 10.1078/1618-8667-00009
Peñuelas, J., and Staudt, M. (2010). BVOCs and global change. Trends Plant Sci. 15, 133–144. doi: 10.1016/j.tplants.2009.12.005
Peron, A., Kaser, L., Fitzky, A. C., Graus, M., Halbwirth, H., Greiner, J., et al. (2021). Combined effects of ozone and drought stress on the emission of biogenic volatile organic compounds from Quercus robur L. Biogeosciences 18, 535–556. doi: 10.5194/bg-18-535-2021
R Core Team (2020). R: A Language And Environment For Statistical Computing. Vienna: R Foundation for Statistical Computing.
Rosenkranz, M., and Schnitzler, J.-P. (2013). “Genetic engineering of BVOC emissions from trees,” in Biology, Controls And Models Of Tree Volatile Organic Compound Emissions, eds R. K. Monson and Ü. Niinemets (Dordrecht: Springer), 95–118. doi: 10.1007/978-94-007-6606-8_4
Scala, A., Allmann, S., Mirabella, R., Haring, M. A., and Schuurink, R. C. (2013). Green leaf volatiles: a plant’s multifunctional weapon against herbivores and pathogens. Inter. J. Mol. Sci. 14, 17781–17811. doi: 10.3390/ijms140917781
Schade, G. W., and Goldstein, A. H. (2006). Seasonal measurements of acetone and methanol: abundances and implications for atmospheric budgets. Glob. Biogeochem. Cycles 20:GB1011. doi: 10.1029/2005GB002566
Schallhart, S., Rantala, P., Nemitz, E., Taipale, D., Tillmann, R., Mentel, T. F., et al. (2016). Characterization of total ecosystem-scale biogenic VOC exchange at a Mediterranean oak–hornbeam forest. Atmos. Chem. Phys. 16, 7171–7194. doi: 10.5194/acp-16-7171-2016
Sidheswaran, M. A., Destaillats, H., Sullivan, D. P., Cohn, S., and Fisk, W. J. (2012). Energy efficient indoor VOC air cleaning with activated carbon fiber (ACF) filters. Build. Environ. 47, 357–367. doi: 10.1016/j.buildenv.2011.07.002
Sukopp, H., and Wurzel, A. (2003). The effects of climate change on the vegetation of central European cities. Urban Habit. 1, 66–86.
Sulzer, P., Hartungen, E., Hanel, G., Feil, S., Winkler, K., Mutschlechner, P., et al. (2014). A proton transfer reaction-quadrupole interface time-of-flight mass spectrometer (PTR-QiTOF): high speed due to extreme sensitivity. Int. J. Mass Spectrom. 368, 1–5. doi: 10.1016/j.ijms.2014.05.004
Tani, A., Hayward, S., and Hewitt, C. (2003). Measurement of monoterpenes and related compounds by proton transfer reaction-mass spectrometry (PTR-MS). Int. J. Mass Spectrom. 223, 561–578. doi: 10.1016/S1387-3806(02)00880-1
Tholl, D., Boland, W., Hansel, A., Loreto, F., Rose, U. S., and Schnitzler, J. P. (2006). Practical approaches to plant volatile analysis. Plant J. 45, 540–560. doi: 10.1111/j.1365-313X.2005.02612.x
Trowbridge, A. M., and Stoy, P. C. (2013). “BVOC-mediated plant-herbivore interactions,” in Biology, Controls And Models Of Tree Volatile Organic Compound Emissions, eds R. K. Monson and Ü. Niinemets (Dordrecht: Springer), 21–46. doi: 10.1007/978-94-007-6606-8_2
Ueda, H., Kikuta, Y., and Matsuda, K. (2012). Plant communication: mediated by individual or blended VOCs? Plant Signal. Behav. 7, 222–226. doi: 10.4161/psb.18765
van Meeningen, Y., Schurgers, G., Rinnan, R., and Holst, T. (2016). BVOC emissions from English oak (Quercus robur) and European beech (Fagus sylvatica) along a latitudinal gradient. Biogeosciences 13, 6067–6080. doi: 10.5194/bg-13-6067-2016
Vranová, E., Coman, D., and Gruissem, W. (2013). Network analysis of the MVA and MEP pathways for isoprenoid synthesis. Annu. Rev. Plant Biol. 64, 665–700. doi: 10.1146/annurev-arplant-050312-120116
Warneke, C., Luxembourg, S., De Gouw, J., Rinne, H., Guenther, A., and Fall, R. (2002). Disjunct eddy covariance measurements of oxygenated volatile organic compounds fluxes from an alfalfa field before and after cutting. J. Geophys. Res. 107, ACH 6-1–ACH 6-10.
Weaver, L. M., and Herrmann, K. M. (1997). Dynamics of the shikimate pathway in plants. Trends Plant Sci. 2, 346–351. doi: 10.1016/S1360-1385(97)84622-5
Wei, T., Simko, V., Levy, M., Xie, Y., Jin, Y., and Zemla, J. (2017). Package ‘corrplot’. Statistician 56:e24.
Werle, C. T., Ranger, C. M., Schultz, P. B., Reding, M. E., Addesso, K. M., Oliver, J. B., et al. (2019). Integrating repellent and attractant semiochemicals into a push–pull strategy for ambrosia beetles (Coleoptera: Curculionidae). J. Appl. Entomol. 143, 333–343. doi: 10.1111/jen.12594
Zemankova, K., and Brechler, J. (2010). Emissions of biogenic VOC from forest ecosystems in central Europe: Estimation and comparison with anthropogenic emission inventory. Environ. Pollut. 158, 462–469. doi: 10.1016/j.envpol.2009.08.032
Keywords: Betula pendula, Carpinus betulus, emission blends, Fagus sylvatica, Quercus robur, VOC pathways, volatile organic compounds
Citation: Fitzky AC, Peron A, Kaser L, Karl T, Graus M, Tholen D, Pesendorfer M, Mahmoud M, Sandén H and Rewald B (2021) Diversity and Interrelations Among the Constitutive VOC Emission Blends of Four Broad-Leaved Tree Species at Seedling Stage. Front. Plant Sci. 12:708711. doi: 10.3389/fpls.2021.708711
Received: 12 May 2021; Accepted: 09 August 2021;
Published: 24 September 2021.
Edited by:
Barbara Baesso Moura, University of Florence, ItalyReviewed by:
Tara Joy Massad, Gorongosa National Park, MozambiqueGiselle da Silva Pedrosa, Federal University of ABC, Brazil
Copyright © 2021 Fitzky, Peron, Kaser, Karl, Graus, Tholen, Pesendorfer, Mahmoud, Sandén and Rewald. This is an open-access article distributed under the terms of the Creative Commons Attribution License (CC BY). The use, distribution or reproduction in other forums is permitted, provided the original author(s) and the copyright owner(s) are credited and that the original publication in this journal is cited, in accordance with accepted academic practice. No use, distribution or reproduction is permitted which does not comply with these terms.
*Correspondence: Hans Sandén, aGFucy5zYW5kZW5AYm9rdS5hYy5hdA==