 Ke Xu1,2,3,4,5
 Yan Zhu1,2,3,4,5
 Weixing Cao1,2,3,4,5
 Xiaoping Jiang1,2,3,4,5Zhijian Jiang6Shuailong Li6
 Jun Ni1,2,3,4,5*
- 1College of Agriculture, Nanjing Agricultural University, Nanjing, China
- 2National Engineering and Technology Center for Information Agriculture, Nanjing, China
- 3Engineering Research Center of Smart Agriculture, Ministry of Education, Nanjing, China
- 4Jiangsu Key Laboratory for Information Agriculture, Nanjing, China
- 5Jiangsu Collaborative Innovation Center for the Technology and Application of Internet of Things, Nanjing, China
- 6College of Artificial Intelligence, Nanjing Agricultural University, Nanjing, China
Single-modal images carry limited information for features representation, and RGB images fail to detect grass weeds in wheat fields because of their similarity to wheat in shape. We propose a framework based on multi-modal information fusion for accurate detection of weeds in wheat fields in a natural environment, overcoming the limitation of single modality in weeds detection. Firstly, we recode the single-channel depth image into a new three-channel image like the structure of RGB image, which is suitable for feature extraction of convolutional neural network (CNN). Secondly, the multi-scale object detection is realized by fusing the feature maps output by different convolutional layers. The three-channel network structure is designed to take into account the independence of RGB and depth information, respectively, and the complementarity of multi-modal information, and the integrated learning is carried out by weight allocation at the decision level to realize the effective fusion of multi-modal information. The experimental results show that compared with the weed detection method based on RGB image, the accuracy of our method is significantly improved. Experiments with integrated learning shows that mean average precision (mAP) of 36.1% for grass weeds and 42.9% for broad-leaf weeds, and the overall detection precision, as indicated by intersection over ground truth (IoG), is 89.3%, with weights of RGB and depth images at α = 0.4 and β = 0.3. The results suggest that our methods can accurately detect the dominant species of weeds in wheat fields, and that multi-modal fusion can effectively improve object detection performance.
Introduction
Weeds are a major biological problem that limits the yield and quality of wheat by competing for light, water, fertilizer, and space (Munier-Jolain et al., 2013; Fahad et al., 2015). There are both grass and broad-leaf weeds (Gaba et al., 2010). Grass weeds have narrow, long leaves very similar to those of wheat, and consist mainly of Echinochloa crusgalli, Avena fatua, and Aegilops tauschii. Broad-leaf weeds look different, and include Pharbitis nil, Galium spurium, Veronica didyma, Capsella bursa-pastoris, and Convolvulus arvensis. Changes in farming practice and the introduction of new wheat varieties have led to significant changes in the species and occurrence of weeds. Grass weeds have invaded and dominated wheat fields, and like broad-leaf weeds, they threaten production (Ulber et al., 2009). They diminish wheat grain filling and have a greater impact on growth and yield (Siddiqui et al., 2010). Grass weeds have morphological characteristics and living habits similar to those of wheat, which interfere with their recognition.
Chemical herbicides have become the primary means of farmland weeds management worldwide because of their high efficiency (Jaime and Ricardo, 2017; Kniss, 2017). Due to the lack of information on weeds species and distribution, they are sprayed over large areas, resulting in overuse, low utilization, and serious pollution. Although herbicides can directly kill object wild plants, excessive use will cause serious environmental pollution (Rose et al., 2016), decrease the yield and quality of agricultural products, and reduce the efficiency of agricultural production. Site-specific weeds management (SSWM) is an important solution to herbicide overuse, whose study includes the aspects of crop and weeds detection systems, decision-making algorithms for herbicide application, and weeds control implementation (Camille et al., 2008; Christensen et al., 2010), among which the recognition and localization of weeds in fields are key issues.
Since images with high spatial resolution are usually easily available and not costly, they are favored in the integration and application of precision weeds management and adjustable spraying systems. Hence, weeds detection based on digital images is a key technical tool for the accurate recognition and localization of weeds in farmlands (Bakhshipour et al., 2017). Weeds detection with wheat field images using traditional machine learning methods usually requires the selection of an object area with a sliding window. Manually designed features, such as the color, location, morphology, and texture of wheat and weeds, are analyzed and extracted from wheat field images (Tellaeche et al., 2008; Petra et al., 2018). This process fails in multi-scale object detection tasks, the time complexity is high, and manually designed features are sensitive to sample variation (Pflanz et al., 2018; Xu et al., 2020a). Deep learning approaches based on CNNs avoid the use of manually designed features, can well detect objects of different sizes, and have been used in the study of weeds detection to significantly improve recognition efficiency (Patrícioa and Riederb, 2018; Smith et al., 2019; Alsamhi et al., 2021; Saleh et al., 2021). However, most weeds detection algorithms are based on the input of single-modal images (RGB), and the limited information makes it difficult to recognize different weeds species (Alessandro et al., 2017; Bah et al., 2018; Huang et al., 2018b). In particular, weeds detection in wheat fields is seriously restricted by the similar shapes of grass weeds and wheat, and the lack of recognizability in RGB images.
Studies have demonstrated that the fusion of multi-modal data can effectively improve the robustness of object detection in unfavorable environments, and the combination of RGB, depth and infrared information provides more richer feature space, which facilitates precise classification and detection (Haque et al., 2020). Since different modalities represent the same scene in different ways, their independence and complementarity can be used to improve the precision of object detection. RGB images, which contain color and texture information, and depth images, which contain geometric structure information, are widely used in object detection tasks because of their high complementarity (Qi et al., 2018). The pixel value in a depth image reflects the distance between the object and the sensor, and effectively describes the geometric characteristics of the object surface in an image. A depth image is therefore an effective supplement to an RGB image. Plant height is an important feature of growth status, which differs greatly between crops and weeds due to growth competition (Piron et al., 2009; Zhang and Grift, 2012). Therefore, we fuse the multi-modal information from RGB and depth images of wheat and weeds to detect weeds in wheat fields. Our work can be summarized as follows:
(1) A weeds-in-wheat-field RGB-D dataset for object detection is proposed, including 1,228 RGB images and corresponding depth images, and the weed areas are labeled as broad-leaf and grass.
(2) To address the CNN’s inability to extract abundant features from single-channel depth images, they are recoded by simulating the RGB image structure to generate new structure images that contain more geometric information and are more suitable for CNN-based feature learning.
(3) According to the concept of multiscale object detection and considering the independence and complementarity of multi-modal data, a three-channel network for weeds detection is proposed from the perspectives of feature-level fusion and decision-level fusion.
Materials and Methods
Experimental Design
Experiments on wheat and weeds were carried out from December 2017 to April 2020 at the demonstration base of the National Engineering and Technology Center for Information Agriculture in Rugao County, Nantong City, Jiangsu Province, China. The experimental area was 50 m long and 12 m wide (Figure 1). Weeds were not controlled during field management, and seeds of six weeds species commonly associated with wheat were randomly sown to simulate weeds growth in the open field. Alopecurus aequalis, Poa annua, Bromus japonicus, and E. crusgalli are grass weeds; Amaranthus retroflexus and C. bursa-pastoris are broad-leaf weeds; and the species composition was similar to that of actual weeds species in wheat fields.
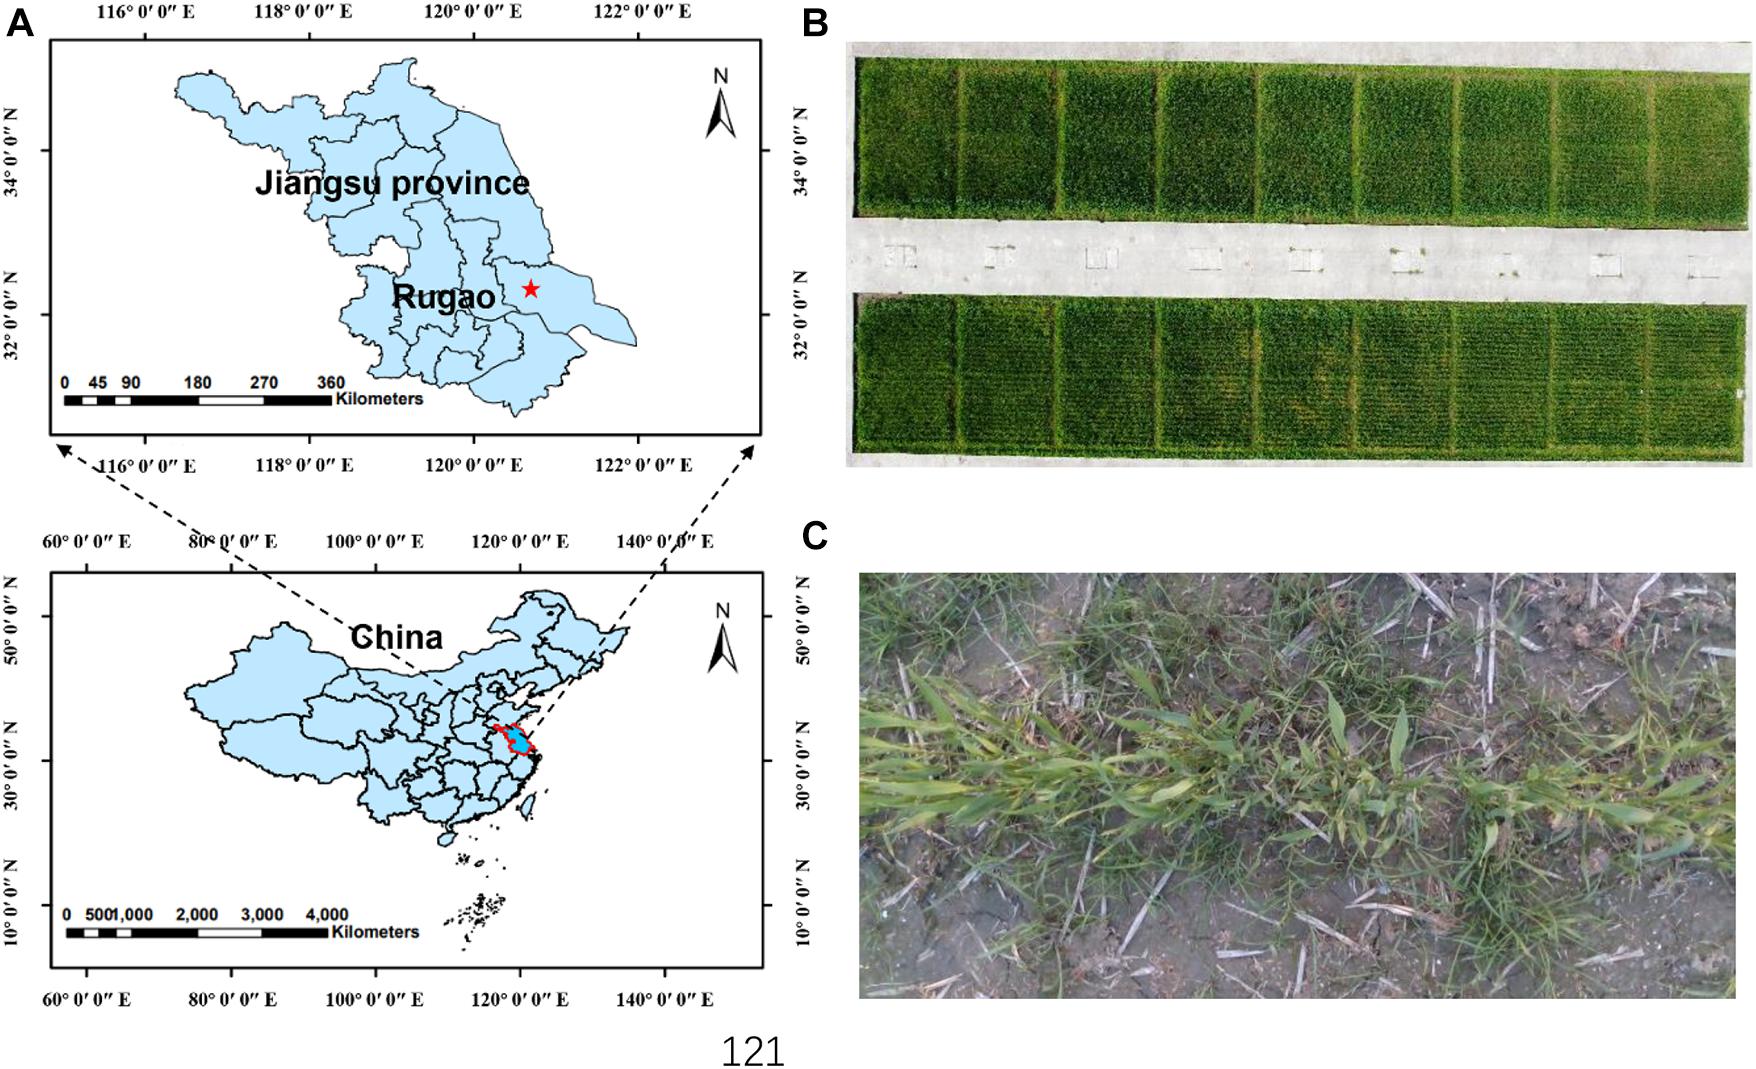
Figure 1. (A) Experimental site; (B) Images of all plots; (C) RGB image of wheat field. The red star represents the location of our experiments in the map.
Image Acquisition and Preprocessing
Wheat field images were acquired using an Intel RealSense Depth Camera D415 (99 mm × 20 mm × 23 mm), an RGB-D camera that adopts active infrared stereo vision technology. As shown in Figure 2A, there were two infrared stereo cameras, an infrared projector, and a color sensor. The infrared stereo cameras generate depth images, and the color sensor generates RGB images, both with a resolution of 1,280 × 720. RGB and depth field images under natural conditions were obtained at wheat tillering and jointing stages. Image collection was carried out under clear and windless weather conditions. The camera was 70 cm above the crop canopy, and set up in the field as shown in Figure 2B. Images were transmitted to a computer in real time via USB 3.0.
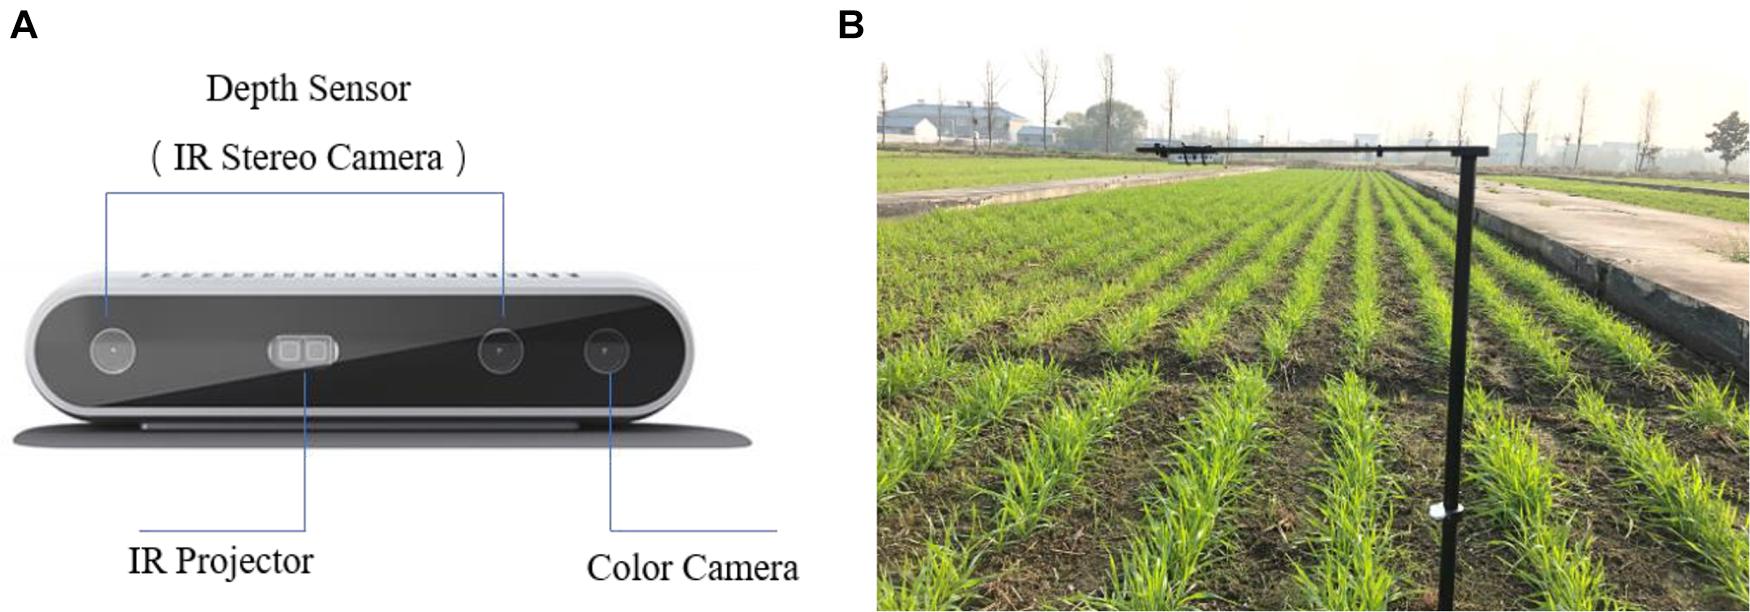
Figure 2. (A) Intel RealSense D415; (B) Equipment setup for field image acquisition.
Since the RGB and depth images had different origins, there is a mismatch problem between the data of different modalities, that is, the same object has a certain degree of position deviation on the images of different modalities. In order to share unified labeling results between RGB images and depth images in subsequent image samples and reduce the impact of mismatch on subsequent feature fusion, coordinate transformation is used first to align depth images and RGB images. The process of image alignment is firstly to restore the depth point of the depth image coordinate system to the world coordinate system, and then to convert the depth point of the world coordinate system to the RGB image coordinate system. The internal parameters matrix, rotation matrix, and translation vector of the depth camera and RGB camera were obtained from the System Design Kit (SDK) provided by Intel. Data loss (void) occurred in depth images due to lighting conditions, infrared reflective properties of object surface materials, and shielding, and depth images were repaired using a hole filling (HF) algorithm (Xu et al., 2020b) to obtain complete depth information for subsequent feature extraction.
Recoding Depth Images
A depth image contains data captured by a depth camera that reflect the distance between the object and the camera. A depth image provides information on object shape and geometry that are lost in RGB images but crucial for object detection. In many object detection studies based on multi-modal information, depth images provide supplementary information to RGB images and improve the performance of object detection (Gupta et al., 2010; Hedau et al., 2010). However, the original depth information is less representative. In particular, feature extraction from depth images with a CNN generates feature maps of distance rather than geometric structures with physical significance. Therefore, single-channel depth images were transformed to three-channel images by recoding the original images to make them more representative and structurally similar to RGB images. The three channels of recoded images are phase, height above ground, and angle with gravity, and recoded images are referred to as PHA images. Phase was calculated according to the mechanism by which depth information is generated (Cai et al., 2017),
where n ∈ ℕ, l ∈ ℕ, and 2πl is the uniqueness range of the camera. The natural number n ensures ϕ ∈ [0,2π]. The maximum distance in the depth image dmax was identified, and the relative distance between object and sensor was converted to height above ground,
where d(i,j) is the depth in image coordinates (i,j). The third channel (angle with gravity) is the angle between the local surface of a pixel and the direction of gravity (Gupta et al., 2013),
Where g is the direction of gravity, N1 represents the set of normals parallel to the direction of gravity, N2 represents the set of normals perpendicular to the direction of gravity, n1 and n2 represent some element in N1 and N2, respectively. And θ is the Angle between two vectors.
Weeds Object Detection Network Based on Multi-Modal Information
There are two primary approaches to detect objects based on multi-modal information from RGB-D: (1) to use a depth image as an additional channel of the RGB image (Couprie et al., 2014); and (2) to separately learn features from RGB and depth images (Wang et al., 2015). However, these methods can neither extract fine geometric features from depth images nor make full use of the complementarity of different modalities. We designed a network by considering the common features (complementarity) between the two modalities (RGB and depth) and the unique features (independence) learned from single modalities.
The network architecture is shown in Figure 3. We designed a three-channel CNN to learn different features from multi-modal information, including two channels for learning RGB- and depth-specific features, and one for learning RGB-D-correlated features. Each network was designed based on Faster R-CNN with VGG16 as a backbone. Since the object area of weeds varied greatly and some were thin and small, we introduced multiscale object detection when designing the correlated detection net. The concept of multiscale representation in CNNs has been demonstrated in previous studies. Low-level feature maps have smaller receptive fields and larger scales, and they contain less semantic information and more low-level feature information such as edges and colors. High-level feature maps contain more semantic information and high-level feature information such as object parts and components (Bell et al., 2016; Kong et al., 2016). Therefore, object detection using the last feature map is not favorable for the detection of multiscale and small objects. Therefore, when designing the architecture of correlated detection net, the basic idea is to utilize the advantages of different receptive fields in detecting targets of different scales so that the network can better deal with multi-scale targets and improve the overall detection accuracy. We used the structure of a hypernet as a reference in designing the structure of a correlated detection net (Kong et al., 2016), fusing the feature maps after the first, third, and fifth convolutional blocks in RGB- and depth-specific detection nets. Because layers had different feature map dimensions, max pool was used in the first layer, and deconv in the fifth layer, to facilitate calculation. To enhance the learning of complementary features by the correlated detection net, instead of directly connecting via add and concat, a previously described method (Xu et al., 2017) was used in the ultimate fusion of feature maps, and the fused feature map was defined as:
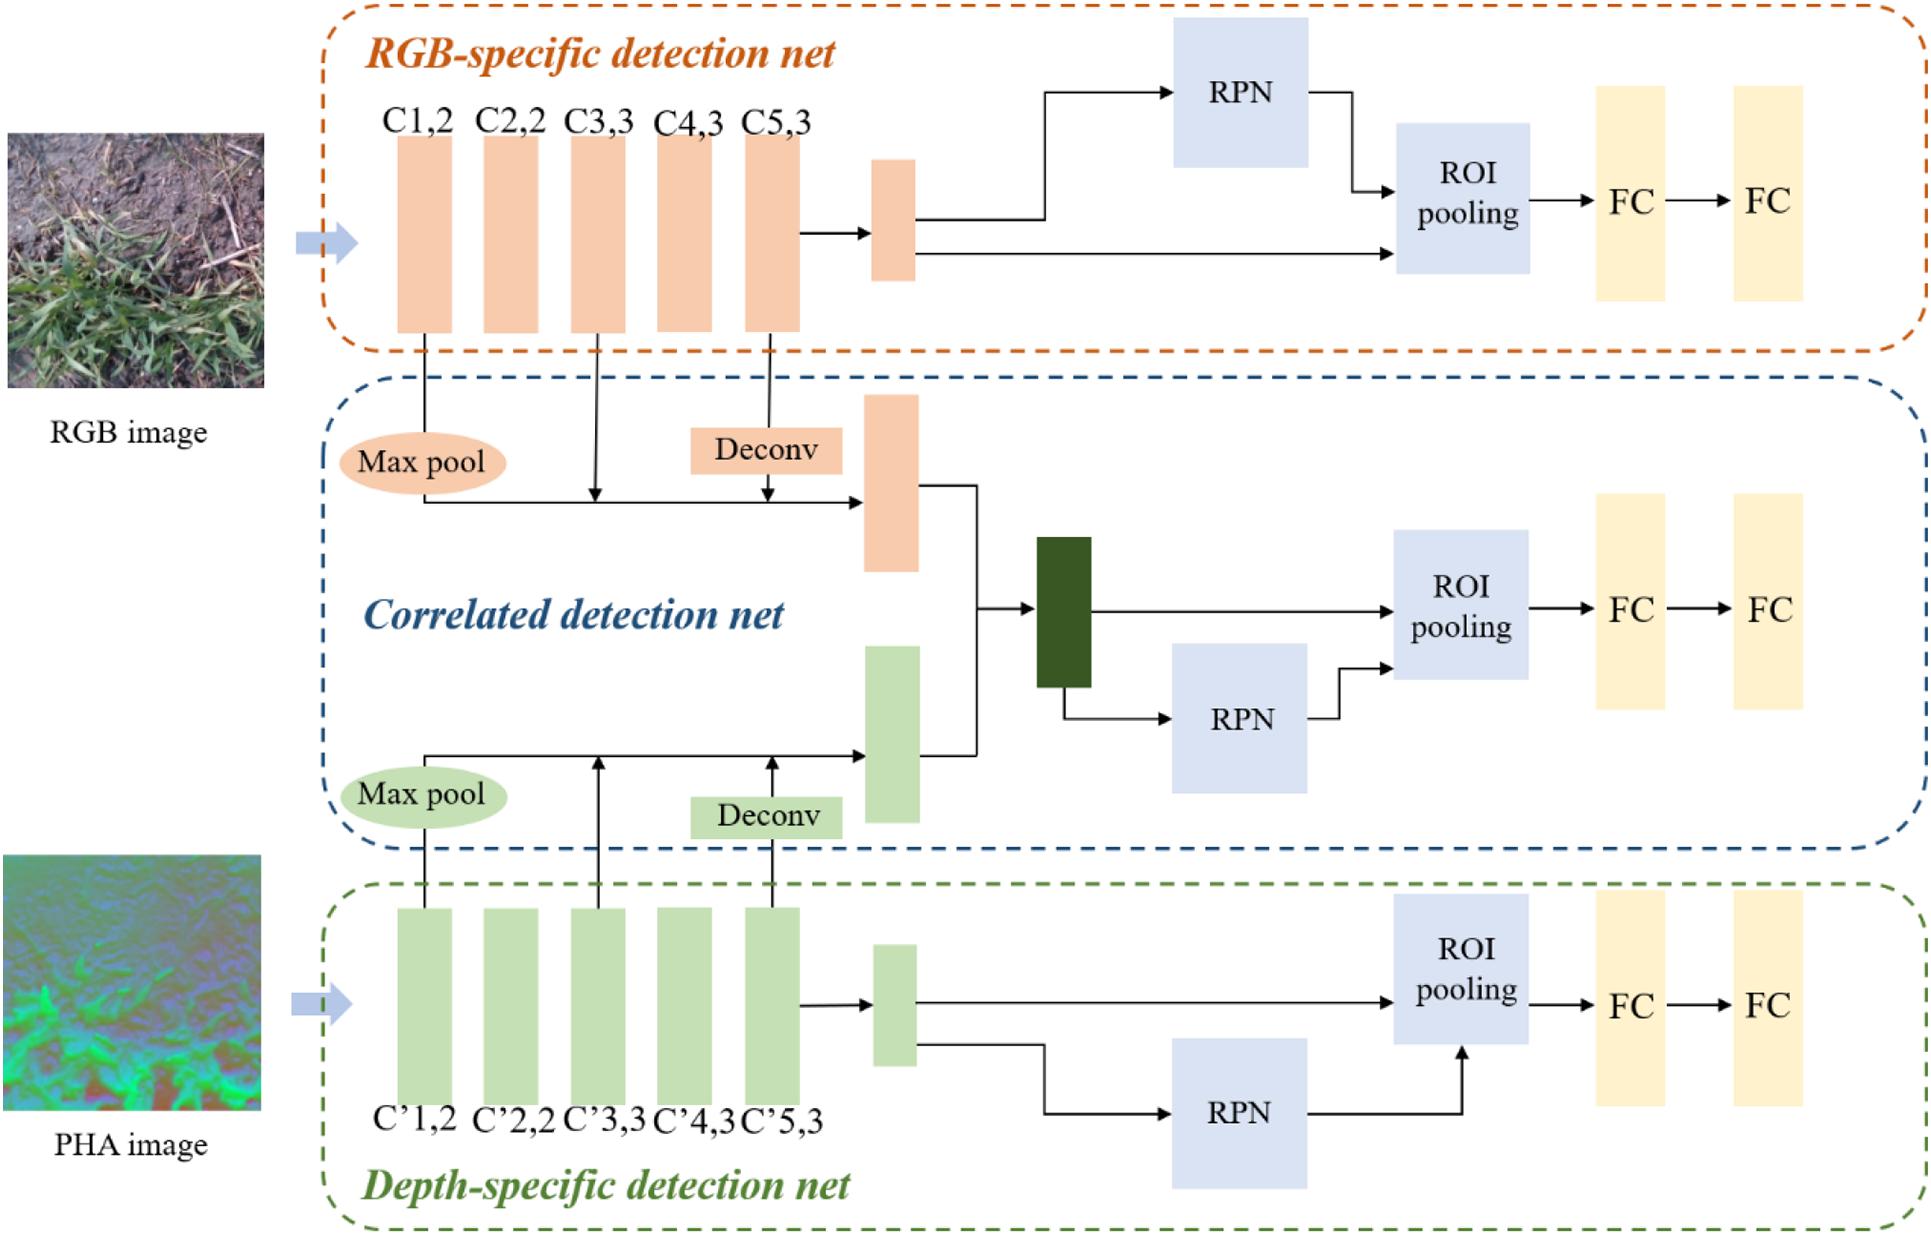
Figure 3. Weeds detection network architecture.
where fRGB and fDepth denote the feature maps generated by CNN in RGB- and depth-specific detection nets, respectively, and ° denotes the Hadamard product.
In order to generate multi-modal object proposals, three Region Proposal Networks (RPNs; Ren et al., 2017) are slid over last feature maps. One is for modality-correlated object estimation and the other two are for modality-specific object estimation. The loss function of RPN network is divided into two parts: the boundary-box regression loss function and the classification loss function. For bounding box regression, given an anchor box with (xa,ya,wa,ha), bounding box regression is developed to predict deviations following (Felzenszwalb et al., 2010; Girshick et al., 2013):
Where x,y,w and h denote the bounding box’s center coordinates and its width and height. x∗,y∗,w∗,h∗ and xa,ya,wa,ha are for the ground-truth box and anchor box, respectively. Smooth L1 (Girshick, 2015) is adopted to calculate the bounding box regression loss.
With these definitions, the object estimation multi-task loss L is defined as:
where the mini-batch size is ignored. i represents the index of an anchor point, pi and are the predicted object probability of an anchor and ground-truth label. If the anchor is positive, . And if the anchor is negative, . Two types of anchors are treated as positive: the anchors with the highest intersection over union (IoU) overlap with a ground-truth box, and the ones that have an IoU overlap higher than 0.7 with any ground-truth box. Lcls is log loss over. The two terms in Eq. (7) are normalized by Ncls and Nreg and weighted by a balancing parameter λ. The former is normalized by the mini-batch size and the latter is normalized by the number of anchor locations. The modality-correlated RPN and modality-specific RPNs are trained simultaneously with the same supervision.
To better exploit the complementarity of multi-modal data, we fused data at the decision level of the algorithm for ensemble learning and assigned weights to detection results of the three-channel network. The equation is as follows:
where, g(⋅) is the output of detection network, α, β (α≥0,β≥0,α + β≤1) are the ensemble weights for RGB and depth branch, respectively. α, β vary in [0,1] with a step size of 0.05.
Datasets and Model Training Methods
To increase the robustness of the object detection network, we performed image data enhancement by rotation and flipping. The resulting multi-modal weeds in the wheat field dataset (MWWFD) included 1,228 RGB images (500 × 500) and 1,228 corresponding depth images (500 × 500). Broad-leaf and grass weeds in images were labeled using LabelImg; 1,105 images were used for training, and 123 images for testing.
The deep learning framework used is TensorFlow, GPU is NVIDIA RTX2080Ti, CPU is Intel(R) Core(TM) i7-7800x CPU @ 3.50 GHz. The multi-modal weeds detection network was subjected to end-to-end training with backpropagation and stochastic gradient descent methods. For RPN networks, each mini-batch arises from a single image that contains many positive and negative example anchors. Some proposals generated by the region proposal network (RPN) overlapped significantly. To reduce redundancy, we performed non-maximum suppression (NMS) and set the threshold of IoU at 0.7. Other training hyperparameters are shown in Table 1. We adopted the weight sharing strategy in the training process, which has been proven effective in many studies because it greatly reduces model complexity and running time (Lecun and Bottou, 1998). Gupta et al. (2016) proved that features learned from depth images are complementary to RGB features even if a CNN based on depth images is supervised and trained by a CNN based on RGB images, and training a network with shared weights is effective.
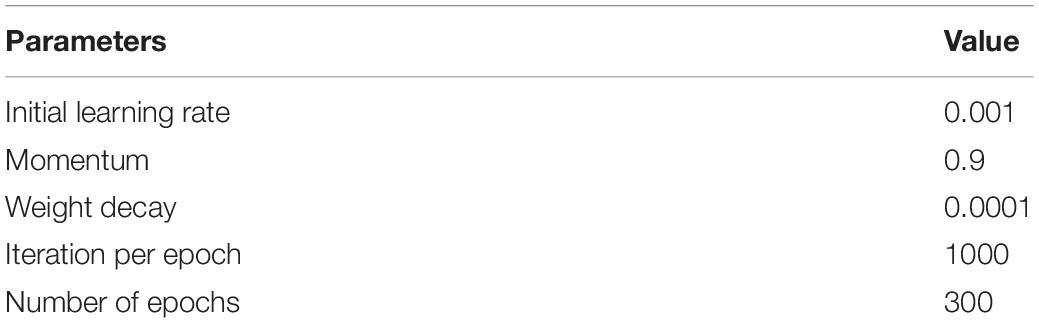
Table 1. Training parameters of multi-modal weeds detection network.
Evaluation Methods
Mean average precision (mAP) is a common and reliable measure of model performance in the detection of multi-category objects.
where P denotes the precision and R denotes the recall. mAP is APs averaged over all categories. However, in the detection of weeds in wheat fields, labeling was complicated by the cluster growth of weeds. As shown in Figure 4, labeling affected the evaluation of detection precision. Therefore, we used mAP to evaluate model detection performance, and intersection over ground truth (IoG), which is the quotient of the intersection and union of the detected and labeled datasets, to evaluate the overall precision of weed detection.
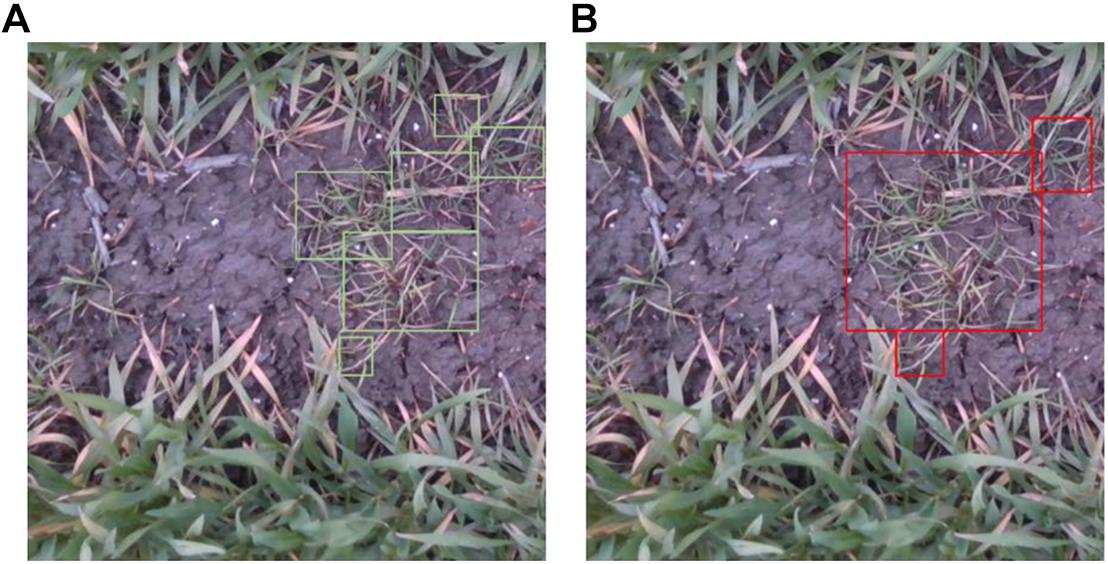
Figure 4. (A,B) Different labeling results of the same image.
Results
Evaluation of PHA Image Quality
We compared the structures of PHA and RGB images from two aspects for suitability in CNN-based feature learning. As shown in Figure 5, the entropy values of PHA and RGB images were closer to each other than to that of depth images, suggesting that they contained more information and were more closely correlated than depth images. Comparison of output from the first convolutional layer of VGG16 showed that PHA images well retained the height information in depth images, with yellow areas in the feature map representing a higher wheat canopy (Figure 6). The depth images had pixels with uniform color in soil and weeds areas, while PHA and RGB images had similar textures, which also indicated their similarity. These comparisons indicated that PHA images obtained by recoding depth images were similar to RGB images in terms of information and structure and were more suitable than depth images for CNN-based feature learning.
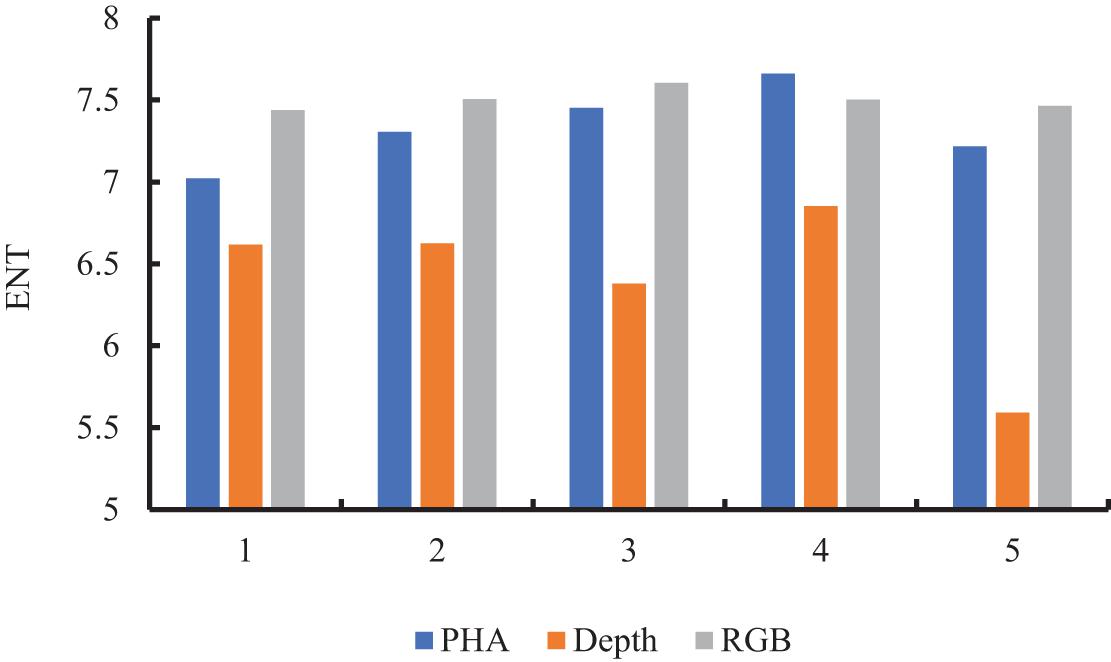
Figure 5. Entropy values of PHA, RGB, and depth images.
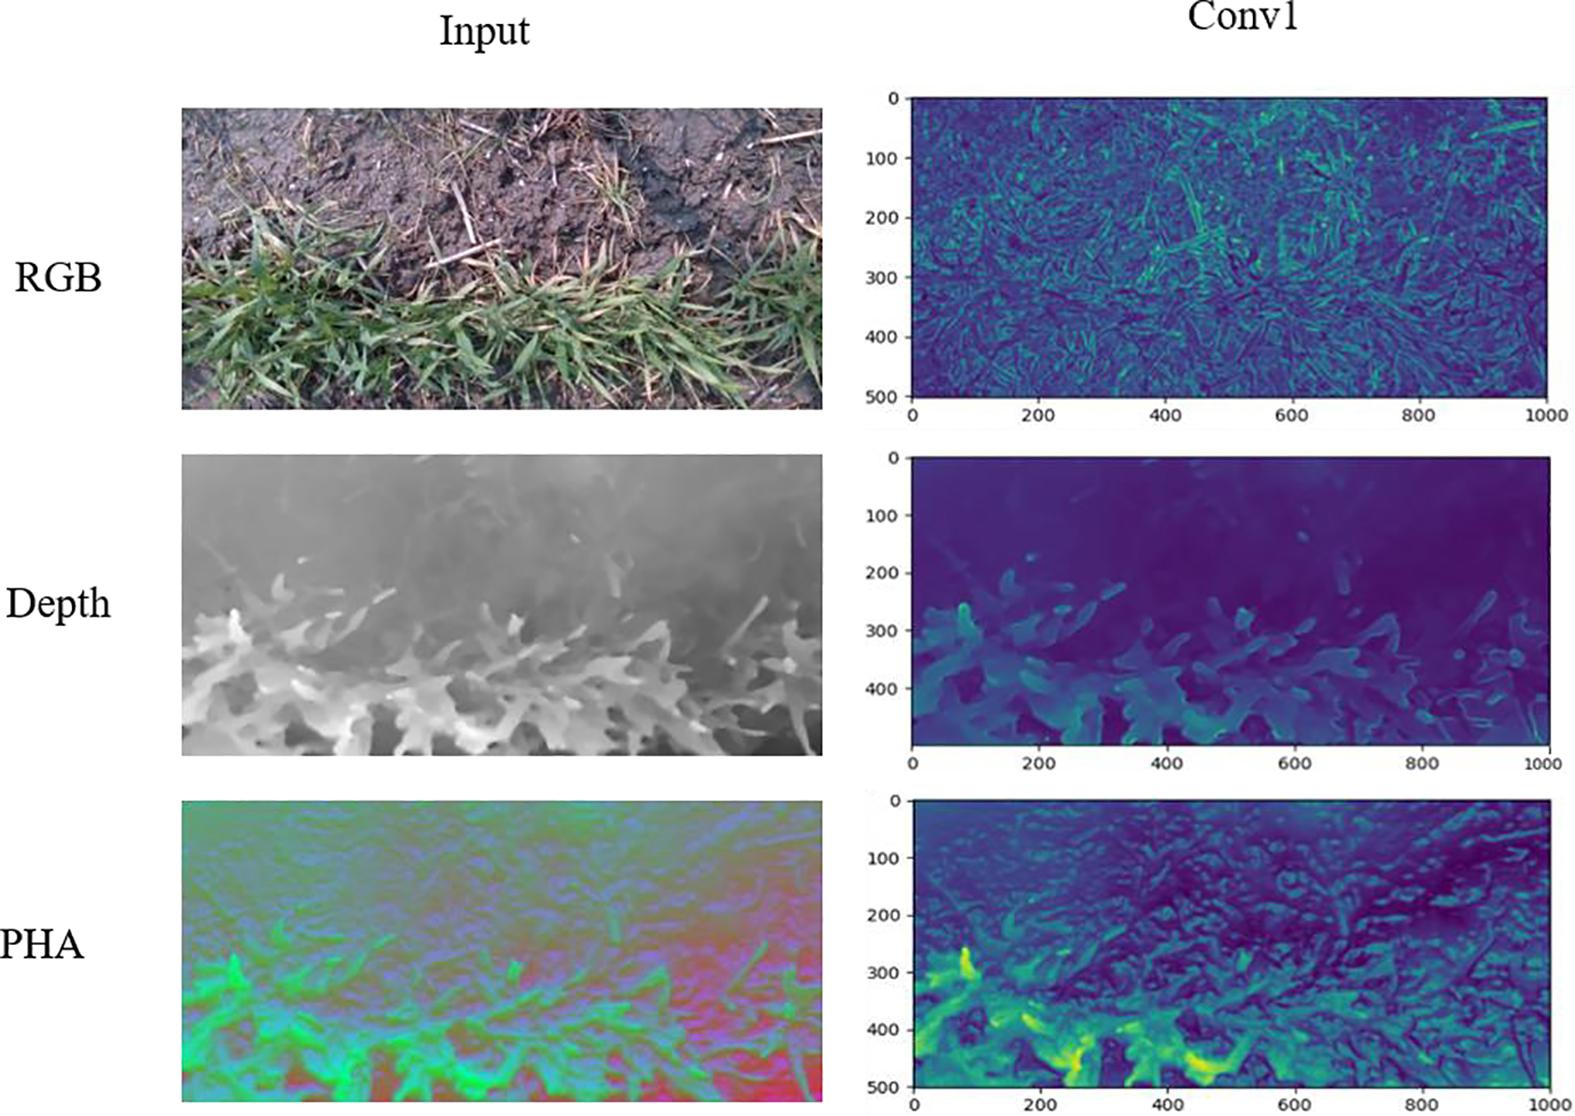
Figure 6. Feature maps from first convolutional layers in VGG16 network of PHA, RGB, and depth images.
Detection of Weeds in Wheat Fields With Different Datasets
The precision of weeds detection with different datasets is shown in Table 2. Detection based on the PHA dataset was significantly better than on the depth dataset, which confirmed that PHA was more suitable for CNN-based feature learning. Comparison of weeds detection with the three single-modal datasets showed that RGB images were superior in the detection of broad-leaf weeds. Depth and PHA images had similar detection performance regardless of weeds species, and PHA images had the best results in grass weeds detection. The geometric features extracted from PHA images effectively distinguished wheat from the various weeds species.
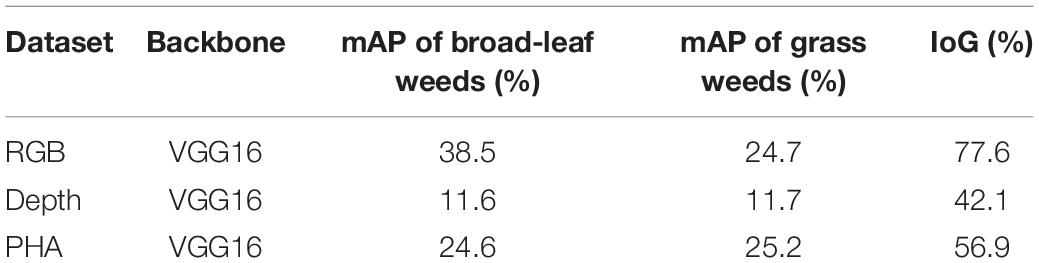
Table 2. Weeds detection with single-modal datasets.
Detection With Multi-Modal Datasets in Multichannel Network Architectures
We compared the detection of weeds in wheat fields with different multi-modal datasets and network architectures (Table 3). Dual-VGG16 is the direct superimposition of the last layers of feature maps of different modal images regardless of feature learning in the remaining convolutional layers. Direct superimposition of feature maps reduced precision compared to detection based on single-modal RGB images (Table 2). This is consistent with previous work (Gupta et al., 2016) showing that information mapping in the same scene varies across modalities, and direct fusion can cause the divergence of detection results and diminished precision. Therefore, the complementarity of different modality datasets was considered in network design, and detection performance was optimized by fusing feature maps from different convolutional layers. By comparing the performance of the same model in different datasets, it can be proved that the PHA image obtained by recoding is more conducive to weeds detection. The detection precision (mAP) of grass and broad-leaf weeds with correlated detection net (RPN-Corr) was 29.9 and 39.3%, respectively, and the overall precision (IoG) was 81.4%.
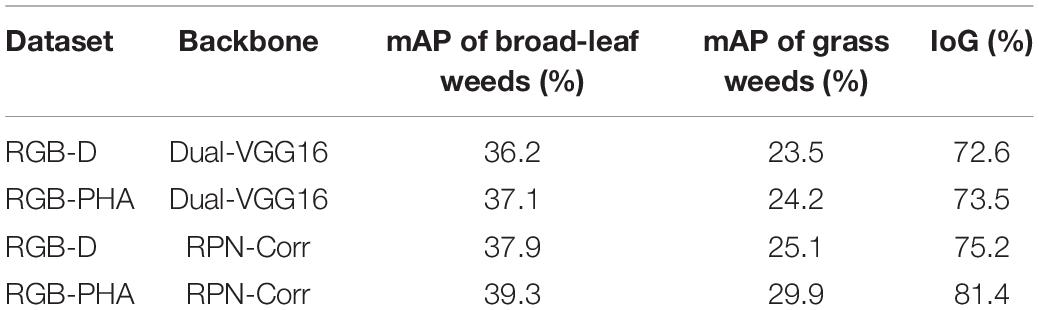
Table 3. Weed detection with multi-modal datasets in multichannel network.
Ensemble Learning Strategy
While taking into account the complementarity of multi-modal datasets, the independence of datasets was exploited through an ensemble learning strategy. Three independent detection models (RGB-specific, depth-specific, and RGB-D-correlated) were trained, and weights were assigned according to Eq. (3), with results as shown in Figure 7. The detection precision was improved compared to a correlated detection net. When α = 0.4 and β = 0.3, mAP = 39.6%. The detection precision of broad-leaf and grass weeds was 42.9% and 36.1%, respectively, and IoG = 89.3%. Figure 8 shows weeds results in different images. Notably, we still found some false positive cases on the test set. These cases may be caused by labeling errors. Due to complex field conditions and low image resolution, some fine weeds may be omitted in labeling. The existence of multiple labeling methods in the same weed area is also the main reason for false positive cases. Therefore, we proposed a new accuracy evaluation method, hoping to avoid the influence of such situation on detection results. In the second row of Figure 8, we can find that our method can well realize weed detection in wheat field under natural environment when there is no labeling information. Most areas of both grass and broad-leaf weeds were detected, and the majority of wheat leaves were correctly recognized even with the overlap of leaves in the fields.
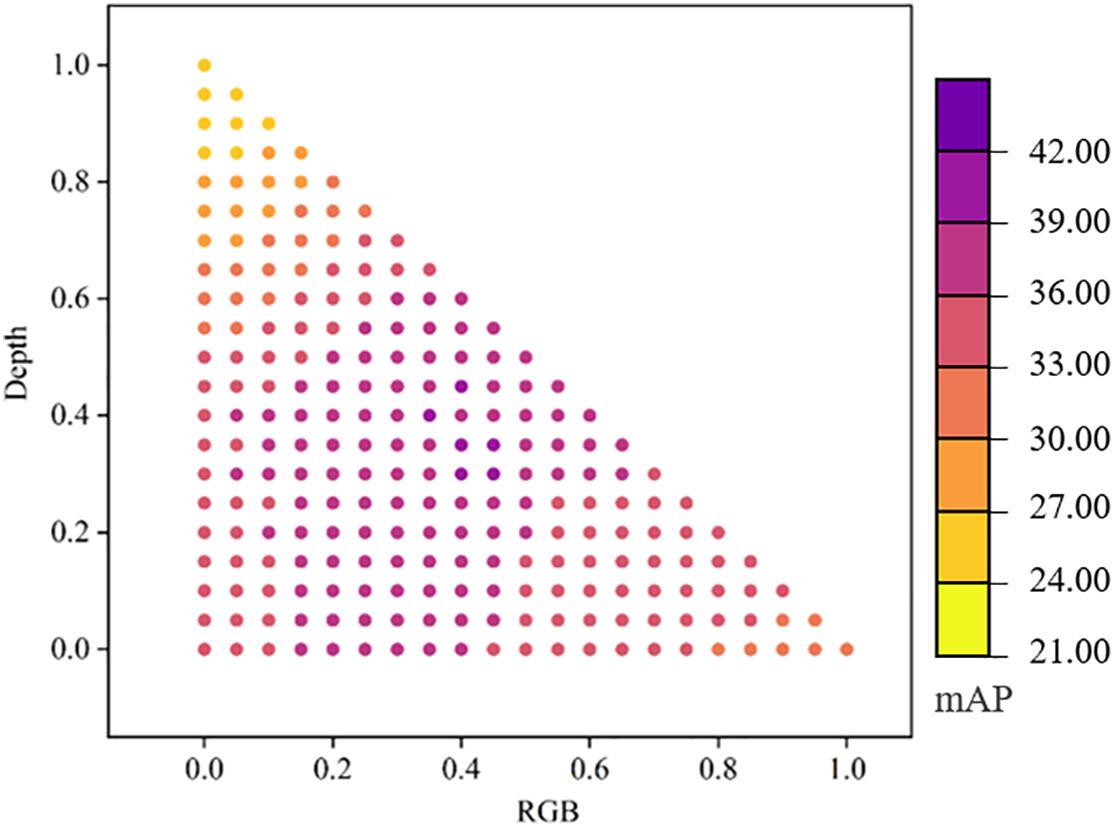
Figure 7. Ensemble learning results of RGB-specific, depth-specific, and RGB-D-correlated models with different weight assignments.
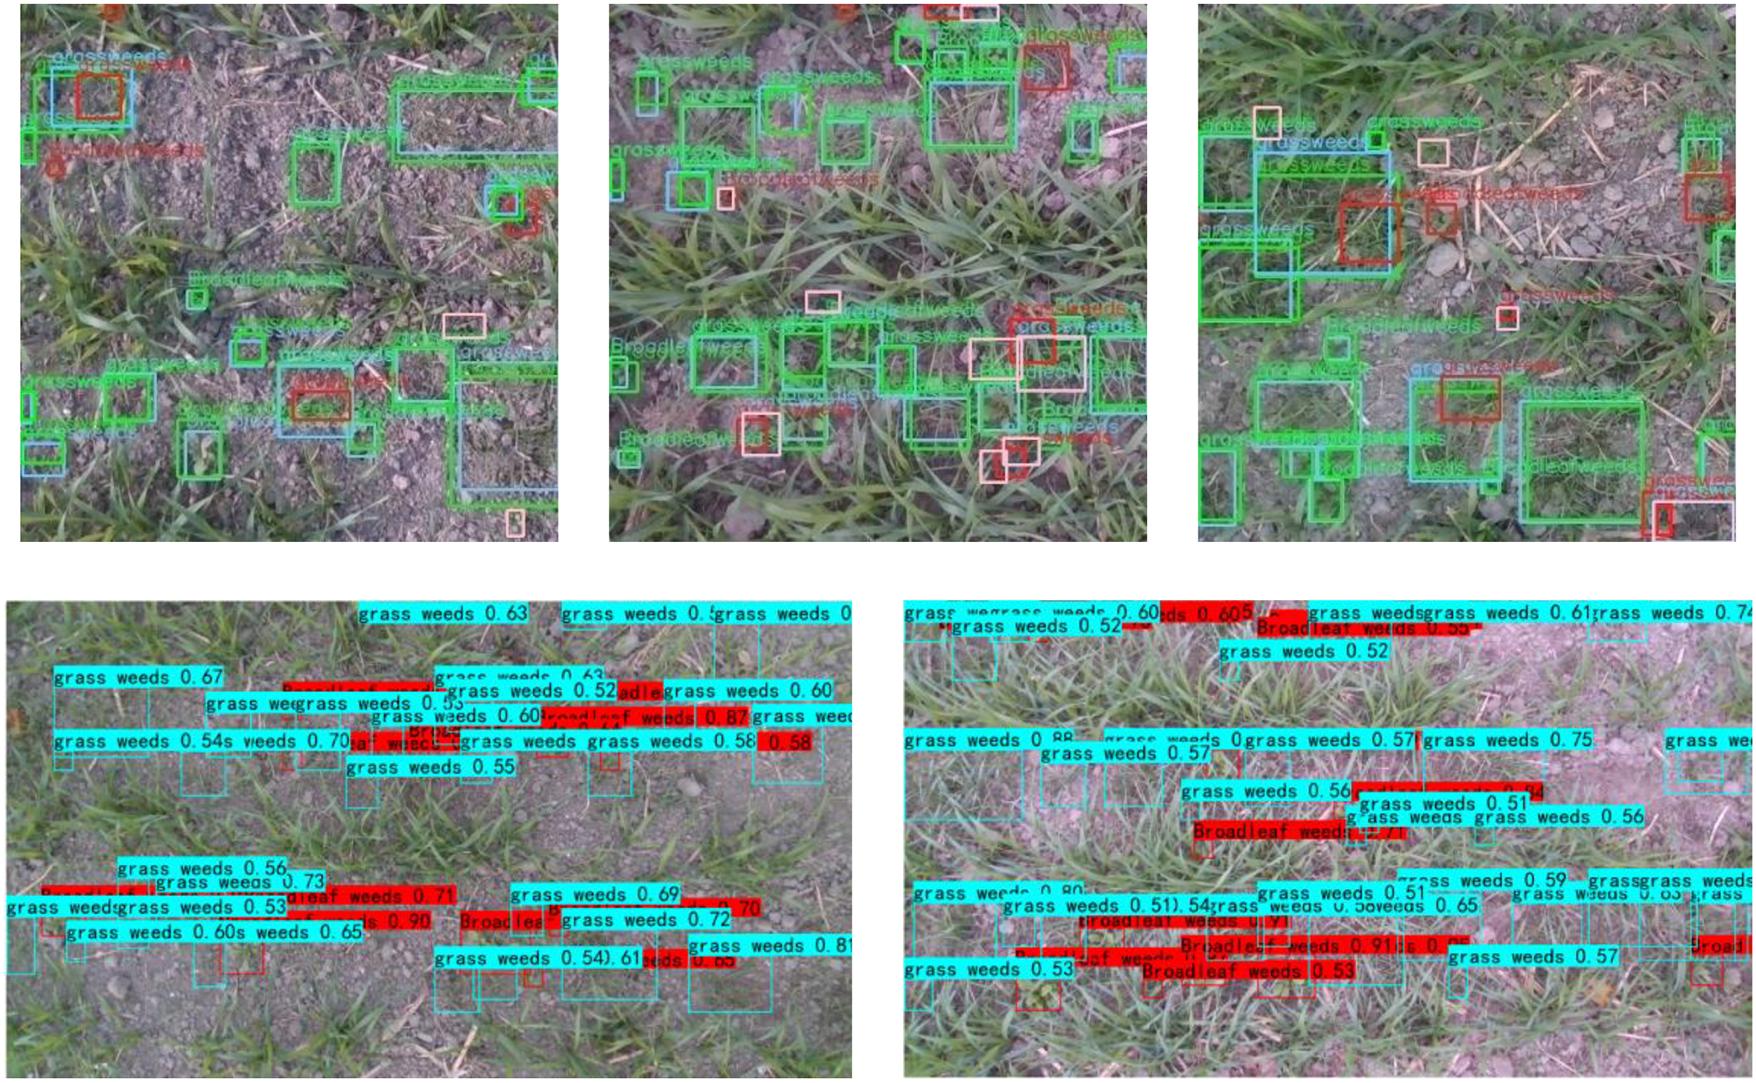
Figure 8. Weeds detection with images of wheat fields. The three graphs in the first row show the detection results of the test set, where green indicates true positive cases, blue indicates corresponding labeling results, pink indicates false negative cases, and red indicates false positive cases. The two graphs in the second row show the detection results of our method on images outside the MWWFD.
Discussion
Weeds Detection in Wheat Fields Based on Multi-Modal Information
Previous work in the accurate detection of weeds in wheat fields with information technology mostly used single modalities, such as spectral information and RGB images. However, because of the similar leaf shape and canopy structure of grass weeds and wheat, there are few differences in RGB image features and in reflectance spectra at characteristic wavelengths, which makes the use of modal information difficult for grass weeds detection (Gómez-Casero et al., 2010). We fused depth images with RGB images, extracted geometric features such as height from PHA images, and used multi-modal information for the effective detection of weeds in wheat fields. In the proposed three-channel weeds detection network, feature maps from different convolutional layers were fused using the concept of multiscale object detection. Ensemble learning was carried out at the decision level based on the independence and complementarity of different modalities, which effectively improved weeds detection precision. However, weight assignment in ensemble learning still relied on hand-designed weight gradient experiments, and detection precision remained suboptimal. Weight assignment methods should be further studied.
Application of Different Machine Learning Algorithms in Weeds Detection
The selection and improvement of machine learning algorithms are a focus in the development of weeds detection technologies. The accuracy and real-time of the detection algorithm determine whether it can be applied in practical agricultural production. In recent years, deep learning methods based on CNN have been widely used in weeds detection with the advantage of end-to-end, avoiding the influence of extraction of manually designed features on detection results (Huang et al., 2018a). This involves calculation of coordinates of bounding boxes around object objects and generates detection results in which the size of the predicted bounding box matches that of the actual weeds object, which improves the precision of weeds detection (Hall et al., 2017). We added a input channel and multi-modal feature fusion blocks, and realized high-precision weeds detection in wheat field through use of multi-modal information effectively. However, compared to traditional machine learning algorithms (Siddiqi et al., 2014; Xu et al., 2020a), the proposed weeds detection algorithm still suffers from a high computational load and low computational efficiency. Although weight sharing was used in training to reduce the computational burden, the demand on the hardware was still high. In future work, we will explore model compression to improve detection efficiency while maintaining precision.
Weeds Detection in Complex Wheat Field Background
Data (images) of a single category and simple background are usually used in weeds detection, which is limited to the early stage of wheat growth (Nieuwenhuizen et al., 2010; Tellaeche et al., 2011). We considered two growth periods with high incidence of weeds in wheat fields, and the cultivation conditions of field experiments were in line with the actual situation. A weeds detection model based on multiscale object detection was suitable to detect weeds areas of different sizes. However, due to shielding of wheat and weeds leaves in fields, RGB-D images from a single perspective failed to capture the information of the shielded objects. Therefore, we will adopt a multi-perspective approach for image acquisition to mitigate the effect of leaf shielding on weeds detection.
Conclusion
We proposed a three-channel weeds detection method based on multi-modal information by fusing RGB and depth images and applying the concept of multiscale object detection, which effectively improved the precision of weeds detection in wheat fields. The single-channel depth image is recoded, and the resulting PHA images were more similar in structure to RGB images and more suitable for CNN-based feature learning. The results showed that when the same network was used, weeds detection precision based on PHA images was 1.35-fold of that based on depth images. And the independence and complementarity of the two modalities of RGB and depth images were taken into account, and a three-channel weeds detection network was designed from the perspective of feature- and decision-level fusion. The results showed that the model could effectively detect different species of weeds in wheat fields (IoG = 89.3%).
Data Availability Statement
The original contributions presented in the study are included in the article/supplementary material, further inquiries can be directed to the corresponding author.
Author Contributions
JN, YZ, XJ, and WC designed the research. JN and KX developed the algorithms. KX, ZJ, and SL performed the research. KX analyzed the data and wrote the manuscript. All authors have read and approved the final manuscript.
Funding
This work was supported in part by the National Key Research and Development Program of China (Grant No. 2017YFD0201501), National Natural Science Foundation of China (Grant No. 31871524), Six Talent Peaks Project in Jiangsu Province (Grant No. XYDXX-049), Primary Research and Development Plan of Jiangsu Province of China (BE2017385, BE2018399, and BE2019306), and the 111 Project (B16026).
Conflict of Interest
The authors declare that the research was conducted in the absence of any commercial or financial relationships that could be construed as a potential conflict of interest.
Publisher’s Note
All claims expressed in this article are solely those of the authors and do not necessarily represent those of their affiliated organizations, or those of the publisher, the editors and the reviewers. Any product that may be evaluated in this article, or claim that may be made by its manufacturer, is not guaranteed or endorsed by the publisher.
References
Alessandro, D., Freitas, D. M., Gercina, G., Pistori, H., and Folhes, M. T. (2017). Weed detection in soybean crops using ConvNets. Comput. Electron. Agric. 143, 314–324. doi: 10.1002/ps.3839
Alsamhi, S. H., Almalki, F. A., Al-Dois, H., Ben Othman, S., Hassan, J., Hawbani, A., et al. (2021). Machine Learning for Smart Environments in B5G Networks: connectivity and QoS. Comput. Intell. Neurosci. 2021:6805151. doi: 10.1155/2021/6805151
Bah, M. D., Hafiane, A., and Canals, R. (2018). Deep Learning with Unsupervised Data Labeling for Weed Detection in Line Crops in UAV Images. Remote Sens. 10:1690. doi: 10.3390/rs10111690
Bakhshipour, A., Jafari, A., Nassiri, S. M., and Zare, D. (2017). Weed segmentation using texture features extracted from wavelet sub-images. Biosyst. Eng. 157, 1–12. doi: 10.1016/j.biosystemseng.2017.02.002
Bell, S., Zitnick, C. L., Bala, K., and Girshick, R. (2016). “Inside-Outside Net: Detecting Objects in Context with Skip Pooling and Recurrent Neural Networks,” in 2016 IEEE Conference on Computer Vision and Pattern Recognition (CVPR), (Piscataway: IEEE).
Cai, Z., Cai, Z., and Shao, L. (2017). “RGB-D data fusion in complex space,” in IEEE International Conference on Image Processing, 2017, (Beijing: IEEE).
Camille, L., Philippe, B., Guillaume, J., Bruno, R., Sylvain, L., and Frédéric, B. (2008). Assessment of Unmanned Aerial Vehicles Imagery for Quantitative Monitoring of Wheat Crop in Small Plots. Sensors 8, 3557–3585. doi: 10.3390/s8053557
Christensen, S., Søgaard, H., Kudsk, P., Nørremark, M., Lund, I., Nadimi, E. S., et al. (2010). Site-specific weed control technologies. Weed Res. 49, 233–241. doi: 10.1111/j.1365-3180.2009.00696.x
Couprie, C., Najman, L., and Lecun, Y. (2014). Convolutional Nets and Watershed Cuts for Real-Time Semantic Labeling of RGBD Videos. J. Mach. Learn. Res. 15, 3489–3511.
Fahad, S., Hussain, S., Chauhan, B. S., Saud, S., Wu, C., Hassan, S., et al. (2015). Weed growth and crop yield loss in wheat as influenced by row spacing and weed emergence times. Crop Protect. 71, 101–108. doi: 10.1016/j.cropro.2015.02.005
Felzenszwalb, P. F., Girshick, R. B., McAllester, D., and Ramanan, D. (2010). Object Detection with Discriminatively Trained Part-Based Models. IEEE Trans. Pattern Anal. Mach. Intell. 32, 1627–1645.
Gaba, S., Chauvel, B., Dessaint, F., Bretagnolle, V., and Petit, S. (2010). Weed species richness in winter wheat increases with landscape heterogeneity. Agric. Ecosyst. Environ. 138, 318–323.
Girshick, R. (2015). “Fast R-CNN,” in Computer Science 2015 IEEE International Conference on Computer Vision (ICCV), (Santiago: IEEE).
Girshick, R., Donahue, J., Darrell, T., and Malik, J. (2013). “Rich Feature Hierarchies for Accurate Object Detection and Semantic Segmentation,” in IEEE Conference on Computer Vision and Pattern Recognition, (Columbus: IEEE).
Gómez-Casero, M., Castillejo-González, I., García-Ferrer, A., Pe?a-Barragán, J. M., Jurado-Expósito, M., García-Torres, L., et al. (2010). Spectral discrimination of wild oat and canary grass in wheat fields for less herbicide application. Agron. Sustain. Dev. 30, 689–699.
Gupta, A., Hebert, M., Kanade, T., and Blei, D. M. (2010). “Estimating spatial layout of rooms using volumetric reasoning about objects and surfaces,” in Proceedings of (NeurIPS) Neural Information Processing Systems, (Pittsburgh: Carnegie Mellon University), 1288–1296.
Gupta, S., Arbelaez, P., and Malik, J. (2013). “Perceptual Organization and Recognition of Indoor Scenes from RGB-D Images,” in 26th IEEE Conference on Computer Vision and Pattern Recognition (CVPR), (Portland: IEEE), 564–571.
Gupta, S., Hoffman, J., and Malik, J. (2016). “Cross Modal Distillation for Supervision Transfer,” in Proceedings of the IEEE Conference on Computer Vision and Pattern Recognition, (Las Vegas: IEEE), 2827–2836.
Hall, D., Dayoub, F., Kulk, J., and Mccool, C. (2017). “Towards unsupervised weed scouting for agricultural robotics,” in 2017 IEEE International Conference on Robotics & Automation, (Piscataway: IEEE).
Haque, A., Milstein, A., and Li, F.-F. (2020). Illuminating the dark spaces of healthcare with ambient intelligence. Nature 585, 193–202. doi: 10.1038/s41586-020-2669-y
Hedau, V., Hoiem, D., and Forsyth, D. (2010). “Thinking inside the box: Using appearance models and context based on room geometry,” in ECCV’10: Proceedings of the 11th European conference on Computer vision: Part VI, (Heraklion: Springer), 224–237.
Huang, H., Deng, J., Lan, Y., Yang, A., Deng, X., and Zhang, L. (2018a). A fully convolutional network for weed mapping of unmanned aerial vehicle (UAV) imagery. PLoS One 13:e0196302. doi: 10.1371/journal.pone.0196302
Huang, H., Lan, Y., Deng, J., Yang, A., and Sheng, W. (2018b). A Semantic Labeling Approach for Accurate Weed Mapping of High Resolution UAV Imagery. Sensors 18:2113. doi: 10.3390/s18072113
Jaime, R., and Ricardo, D. C. (2017). Glyphosate Residues in Groundwater, Drinking Water and Urine of Subsistence Farmers from Intensive Agriculture Localities: a Survey in Hopelchén, Campeche, Mexico. International. J. Environ. Res. Public Health 14:595. doi: 10.3390/ijerph14060595
Kniss, A. R. (2017). Long-term trends in the intensity and relative toxicity of herbicide use. Nat. Commun. 8:14865. doi: 10.1038/ncomms14865
Kong, T., Yao, A., Chen, Y., and Sun, F. (2016). “HyperNet: Towards Accurate Region Proposal Generation and Joint Object Detection,” in 2016 IEEE Conference on Computer Vision and Pattern Recognition (CVPR), (Las Vegas: IEEE).
Lecun, Y., and Bottou, L. (1998). Gradient-based learning applied to document recognition. Proc. IEEE 86, 2278–2324. doi: 10.1109/5.726791
Munier-Jolain, N. M., Guyot, S., and Colbach, N. (2013). A 3D model for light interception in heterogeneous crop: weed canopies: model structure and evaluation. Ecol. Model. 250, 101–110. doi: 10.1016/j.ecolmodel.2012.10.023
Nieuwenhuizen, A. T., Hofstee, J. W., and Henten, E. (2010). Performance evaluation of an automated detection and control system for volunteer potatoes in sugar beet fields. Biosyst. Eng. 107, 46–53.
Patrícioa, D., and Riederb, R. (2018). Computer vision and artificial intelligence in precision agriculture for grain crops: a systematic review. Comput. Electron. Agric. 153, 69–81. doi: 10.1016/j.compag.2018.08.001
Petra, B., Tom, D., and Grzegorz, C. (2018). Analysis of morphology-based features for classification of crop and weeds in precision agriculture. IEEE Robot. Autom. Lett. 3, 2950–2956.
Pflanz, M., Nordmeyer, H., and Schirrmann, M. (2018). Weed Mapping with UAS Imagery and a Bag of Visual Words Based Image Classifier. Remote Sens. 10:1530.
Piron, A., Leemans, V., Lebeau, F., and Destain, M. F. (2009). Improving in-row weed detection in multispectral stereoscopic images. Comput. Electron. Agric. 69, 73–79.
Qi, C. R., Wei, L., Wu, C., Hao, S., and Guibas, L. J. (2018). “Frustum PointNets for 3D Object Detection from RGB-D Data,” in 2018 IEEE/CVF Conference on Computer Vision and Pattern Recognition (CVPR), (Salt Lake City: IEEE).
Ren, S., He, K., Girshick, R., and Sun, J. (2017). Faster R-CNN: towards Real-Time Object Detection with Region Proposal Networks. IEEE Trans. Pattern Anal. Mach. Intell. 39, 1137–1149. doi: 10.1109/TPAMI.2016.2577031
Rose, M. T., Cavagnaro, T. R., Scanlan, C. A., Rose, T. J., Vancov, T., Kimber, S., et al. (2016). Impact of herbicides on soil biology and function. Adv. Agron. 136, 133–220.
Saleh, H., Alharbi, A., and Alsamhi, S. H. (2021). OPCNN-FAKE: optimized Convolutional Neural Network for Fake News Detection. IEEE Access 9, 129471–129489.
Siddiqi, M. H., Lee, S. W., and Khan, A. M. (2014). Weed Image Classification using Wavelet Transform, Stepwise Linear Discriminant Analysis, and Support Vector Machines for an Automatic Spray Control System. J. Inform. Sci. Eng. 30, 1227–1244.
Siddiqui, I., Bajwa, R., and Javaid, A. (2010). Effect of six problematic weeds on growth and yield of wheat. Pak. J. Bot. 42, 2461–2471.
Smith, D. M., Eade, R., Scaife, A. A., Caron, L. P., Danabasoglu, G., Delsole, T. M., et al. (2019). A comprehensive review on automation in agriculture using artificial intelligence. NPJ Clim. Atmos. Sci. 2, 1–12.
Tellaeche, A., Burgosartizzu, X. P., Pajares, G., Ribeiro, A., and Fernández-Quintanilla, C. (2008). A new vision-based approach to differential spraying in precision agriculture. Comput. Electron. Agricu. 60, 144–155.
Tellaeche, A., Pajares, G., Burgos-Artizzu, X. P., and Ribeiro, A. (2011). A computer vision approach for weeds identification through Support Vector Machines. Appl. Soft Comput. 11, 908–915
Ulber, L., Steinmann, H. H., Klimek, S., and Isselstein, J. (2009). An on-farm approach to investigate the impact of diversified crop rotations on weed species richness and composition in winter wheat. Weed Res. 49, 534–543.
Wang, A., Lu, J., Cai, J., Cham, T. J., and Wang, G. (2015). Large-Margin Multi-Modal Deep Learning for RGB-D Object Recognition. IEEE Trans. Multimedia 17, 1887–1898. doi: 10.1109/tmm.2015.2476655
Xu, K., Li, H., Cao, W., Zhu, Y., Chen, R., and Ni, J. (2020a). Recognition of Weeds in Wheat Fields Based on the Fusion of RGB Images and Depth Images. IEEE Access 8, 110362–110370. doi: 10.1109/access.2020.3001999
Xu, K., Zhang, J., Li, H., Cao, W., and Ni, J. (2020b). Spectrum-and RGB-D-Based Image Fusion for the Prediction of Nitrogen Accumulation in Wheat. Remote Sens. 12:4040. doi: 10.3390/rs12244040
Xu, X., Li, Y., Wu, G., and Luo, J. (2017). Multi-modal deep feature learning for RGB-D object detection. Pattern Recognit. 72, 300–313. doi: 10.1109/TIP.2019.2891104
Keywords: weeds detection, RGB-D image, multi-modal deep learning, machine learning, three-channel network
Citation: Xu K, Zhu Y, Cao W, Jiang X, Jiang Z, Li S and Ni J (2021) Multi-Modal Deep Learning for Weeds Detection in Wheat Field Based on RGB-D Images. Front. Plant Sci. 12:732968. doi: 10.3389/fpls.2021.732968
Received: 29 June 2021; Accepted: 19 October 2021;
Published: 05 November 2021.
Edited by:
Yiannis Ampatzidis, University of Florida, United StatesReviewed by:
Liujun Li, Missouri University of Science and Technology, United StatesSaeed Hamood Alsamhi, Ibb University, Yemen
Vinay Vijayakumar, University of Florida, United States
Copyright © 2021 Xu, Zhu, Cao, Jiang, Jiang, Li and Ni. This is an open-access article distributed under the terms of the Creative Commons Attribution License (CC BY). The use, distribution or reproduction in other forums is permitted, provided the original author(s) and the copyright owner(s) are credited and that the original publication in this journal is cited, in accordance with accepted academic practice. No use, distribution or reproduction is permitted which does not comply with these terms.
*Correspondence: Jun Ni, bmlqdW5AbmphdS5lZHUuY24=