 Augusto Giaretta
 Bruce Murphy
 Olivier Maurin
 Fiorella F. Mazine
 Paulo Sano
 Eve Lucas
- 1Faculdade de Ciências Biológicas e Ambientais, Universidade Federal da Grande Dourados, Unidade II, Dourados, Brazil
- 2Laboratório de Sistemática Vegetal, Departamento de Botânica, Instituto de Biociências, Universidade de São Paulo, São Paulo, Brazil
- 3Jodrell Laboratory, Royal Botanic Gardens, Kew, Surrey, United Kingdom
- 4Department of Life Sciences, Imperial College, London, United Kingdom
- 5Centro de Ciências e Tecnologias para a Sustentabilidade, Universidade Federal de São Carlos, Campus Sorocaba, Sorocaba, Brazil
- 6Herbarium, Royal Botanic Gardens, Kew, Surrey, United Kingdom
Eugenia is one of the most taxonomically challenging lineages of flowering plants, in which morphological delimitation has changed over the last few years resulting from recent phylogenetic study based on molecular data. Efforts, until now, have been limited to Sanger sequencing of mostly plastid markers. These phylogenetic studies indicate 11 clades formalized as infrageneric groups. However, relationships among these clades are poorly supported at key nodes and inconsistent between studies, particularly along the backbone and within Eugenia sect. Umbellatae encompasses ca. 700 species. To resolve and better understand systematic discordance, 54 Eugenia taxa were subjected to phylogenomic Hyb-Seq using 353 low-copy nuclear genes. Twenty species trees based on coding and non-coding loci of nuclear and plastid datasets were recovered using coalescent and concatenated approaches. Concordant and conflicting topologies were assessed by comparing tree landscapes, topology tests, and gene and site concordance factors. The topologies are similar except between nuclear and plastid datasets. The coalescent trees better accommodate disparity in the intron dataset, which contains more parsimony informative sites, while concatenated trees recover more conservative topologies, as they have narrower distribution in the tree landscape. This suggests that highly supported phylogenetic relationships determined in previous studies do not necessarily indicate overwhelming concordant signal. Congruence must be interpreted carefully especially in concatenated datasets. Despite this, the congruence between the multi-species coalescent (MSC) approach and concatenated tree topologies found here is notable. Our analysis does not support Eugenia subg. Pseudeugenia or sect. Pilothecium, as currently circumscribed, suggesting necessary taxonomic reassessment. Five clades are further discussed within Eugenia sect. Umbellatae progress toward its division into workable clades. While targeted sequencing provides a massive quantity of data that improves phylogenetic resolution in Eugenia, uncertainty still remains in Eugenia sect. Umbellatae. The general pattern of higher site coefficient factor (CF) than gene CF in the backbone of Eugenia suggests stochastic error from limited signal. Tree landscapes in combination with concordance factor scores, as implemented here, provide a comprehensive approach that incorporates several phylogenetic hypotheses. We believe the protocols employed here will be of use for future investigations on the evolutionary history of Myrtaceae.
Introduction
Eugenia P. Micheli ex L. is arguably one of the most taxonomically challenging lineages of flowering plants, with more than 1,100 species distributed throughout tropical and subtropical areas but with a main center of diversity in the Neotropics (Wilson, 2011; World Checklist of Selected Plant Families [WCSP], 2021). Eugenia is a dominant tree genus in some tropical forest biomes, has high ecological importance for frugivores, and is used as a surrogate for tree species diversity and evolution in Neotropical biomes (Oliveira-Filho and Fontes, 2000; Lucas and Bünger, 2015). For many years, Eugenia existed as a morphologically homogeneous genus with a well-delimited circumscription (Candolle, 1828; Berg, 1857). Later, the understanding of Eugenia was enhanced by recognition and description of its growing species diversity especially in the Neotropics (e.g., Berg, 1857; Amshoff, 1951; McVaugh, 1956; Landrum and Kawasaki, 1997). Biological classifications are permanently “works in progress” (e.g., The Angiosperm Phylogeny Group [APG], 1998, 2003, 2009, 2016), and this is particularly true for Eugenia, where morphological delimitation has substantially changed over the last few years. These changes have been driven by recent phylogenetic studies based on molecular data (van der Merwe et al., 2005; Cruz et al., 2013; Mazine et al., 2014; Bünger et al., 2016a; Mazine et al., 2018; Giaretta et al., 2019b; Flickinger et al., 2020). According to these molecular phylogenetic reconstructions, the following formerly segregated genera are now treated under Eugenia: Calycorectes O.Berg, Catinga Aubl., Calyptrogenia Burret, Hexachlamys O. Berg, Hottea Urb., Jossinia Comm. ex DC., Phyllocalyx O.Berg, Pseudanamomis Kausel, and Stenocalyx O.Berg (see World Checklist of Selected Plant Families [WCSP], 2021).
Information from several sources has changed morphological understanding and challenged generic concepts in Eugenia. For example, the standard tetramerous flower in Eugenia is nearly ubiquitous except in Hexachlamys (currently treated under Eugenia), which can express penta- and hexamerous flowers (Cruz et al., 2013; Vasconcelos et al., 2018). Flowers with six apparent petals, previously placed in Calycorectes, also appear to depart from the basic arrangement in Eugenia, although a detailed study on flower development, in fact, reveals a pair of internal sepals expressing petal-like features (Giaretta et al., 2019a,b). Furthermore, species with a “six petals” display are associated with fused calyces, a condition contrasting with free lobes found in the basic arrangement of the genus (Landrum and Kawasaki, 1997). Likewise, species previously assigned to Phyllocalyx because of remarkably extended free sepals (Berg, 1857) that enlarge quickly in early development stages (Vasconcelos et al., 2018) are currently treated as an infrageneric group supported by morphological and molecular data (Bünger et al., 2016a; Mazine et al., 2016; Mazine et al., 2018).
Phylogenetic reconstructions based on Sanger sequencing resulted in the classification of Eugenia comprising 11 infrageneric groups (Figure 1). These studies used both plastid and nuclear markers with a multitude of plastid markers, while the nuclear genome was often represented only by the ITS region (e.g., Mazine et al., 2018; Giaretta et al., 2019b; Flickinger et al., 2020). In practice, this means resulting phylogenetic trees are largely reconstructions of the genealogical history of the plastid genome rather than consensus between this and the nuclear genome. The implication for Eugenia systematics remains unclear, because the few commonly used nuclear markers are not sufficient to reliably tackle genealogical comparative topologies. Despite this, phylogenies inferred from concatenation of both genomes converged on strongly monophyletic Eugenia and foundation for the infrageneric classification of 11 the groups (Mazine et al., 2016; Mazine et al., 2018). However, statistical support for relationships among the infrageneric groups remains low especially in the backbone of Eugenia. Coalescent-based methods, which, in theory, can provide a more reliable species tree when individual markers are in conflict, have not been used in a comprehensive approach. Therefore, uncertainty accompanies the taxonomic classification in which Eugenia is currently divided into subgenera Eugenia, Hexachlamys, and Pseudeugenia. Subgenus Eugenia encompasses the great majority of species, and includes nine sections, while the subgenera Hexachlamys and Pseudeugenia include one homonymous section each (Mazine et al., 2018). Efforts to reconcile recent molecular phylogenies with morphological features have resulted in the current taxonomic arrangement in Eugenia (Mazine et al., 2016; Giaretta et al., 2019b). Nevertheless, the highly diverse Eugenia sect. Umbellatae O.Berg, which includes ca. 700 species, has low support at internal nodes and remains the major challenge. Furthermore, despite a preliminary survey (Mazine et al., 2018), morphological synapomorphies have not been identified to distinguish internal divisions of this section. These issues have impeded the development of a reliable classification and continue to render Eugenia sect. Umbellatae taxonomically unmanageable (Mazine et al., 2018). To further clarify phylogenetic relationships and understand the evolution of morphological traits within Eugenia, a methodological step-change that will add significantly more molecular data than previous Sanger sequencing efforts is desirable.
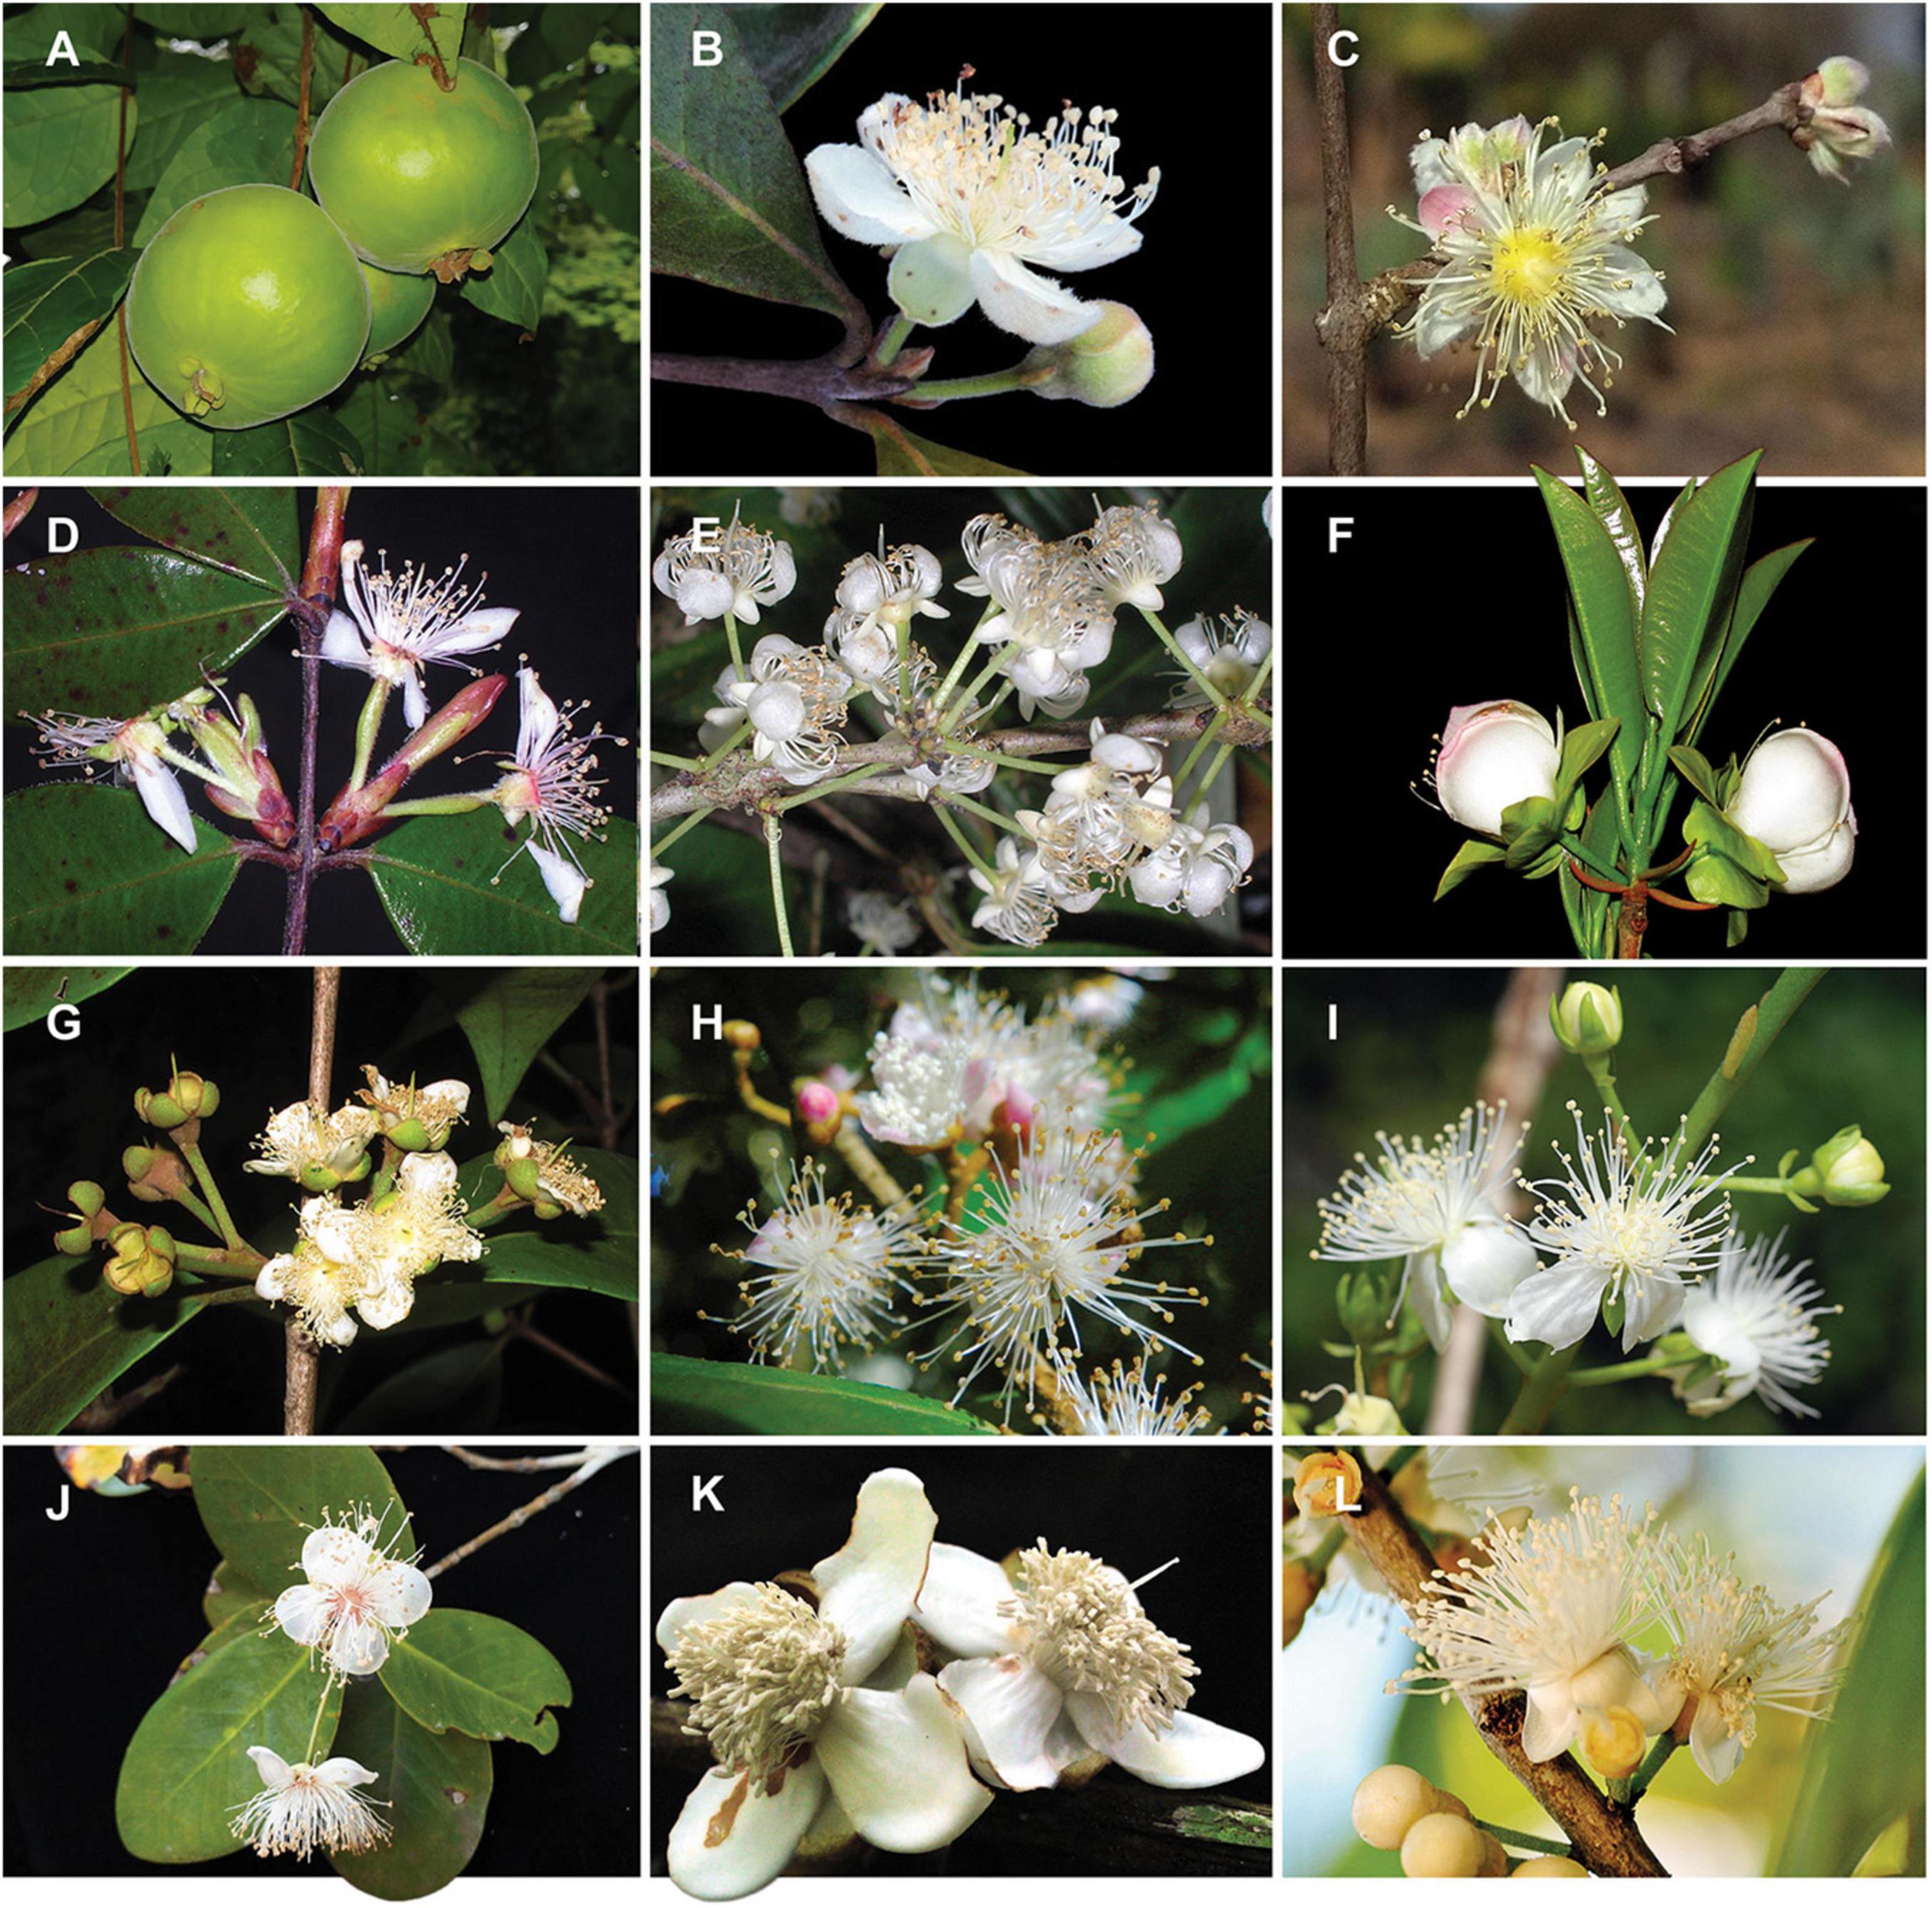
Figure 1. Diversity of infrageneric groups of Eugenia. (A) E. stipitata – sect. Pilothecium. (B)E. klotzschiana – sect. Pseudeugenia. (C) E. myrcianthes – sect. Hexachlamys. (D) E. neosilvestris – sect. Eugenia. (E) E. excelsa – sect. Excelsae. (F) E. involucrata – sect. Phyllocalyx. (G) E. acutata – sect. Schizocalomyrtus. (H) E. disperma – sect. Racemosae. (I) E. bunchosiifolia – sect. Speciosae. (J) E. reinwardtiana – sect. Jossinia. (K) E. abunan – sect. Umbellatae. (L) E. pluriflora – sect. Umbellatae. Size of reproductive organs varies between c. 1 and 7 cm. Pictures by A. Giaretta (A,D,E–G), K. Valdemarin (B), P. Gaem (C), A. Maruyama (H), E. Lucas (I), Y.W. Low (J), M. Simon (K), O.J. Pereira (L).
In this study, we aim to reconstruct relationships within Eugenia using the universal Angiosperm-353 target sequencing kit, which uses a probe set designed to selectively capture low-copy nuclear orthologs (Johnson et al., 2019). This approach generates comprehensive phylogenies entirely based on the nuclear genome, with additional recovery of off-target plastid sequences also possible; this is the first use of phylogenomic methods in Eugenia. Specific objectives of this study are to: (1) test the concordance of phylogenetic reconstructions based on nuclear and plastid data; (2) assess the effectiveness of increasing genetic data from diverse sources (intron and intergenic spacers) to increase statistical support for relationships; (3) compare topologies from phylogenetic reconstructions based on concatenated and multi-species coalescent (MSC) approaches; and (4) establish well-supported systematic relationships in Eugenia, particularly within Eugenia sect. Umbellatae.
Materials and Methods
Molecular Sampling
Material composed of 54 taxa was successfully sequenced from the DNA (32 samples) and dried leaf tissue (22 samples) banks at the Royal Botanic Gardens, Kew (RBG-Kew). The sampling strategy adopted was to include as many species as possible, representing all previously recognized infrageneric groups, to resolve relationships along the Eugenia backbone and within Eugenia sect. Umbellatae. The only group not represented, because of unsuccessful recovery, was Eugenia sect. Hexachlamys. Seven outgroup taxa were used, such as Myrcianthes, which is shown as sister to Eugenia in previous molecular phylogenies based on Sanger sequencing (e.g., Mazine et al., 2014; Giaretta et al., 2019b). Outgroup sequence data are taken from the Myrtales-focused study of Maurin et al. (2021) and are available on the Kew Tree of Life Explorer (https://treeoflife.kew.org; Baker et al., 2021). Sample voucher details are provided in Supplementary Table 1.
DNA Extraction and Library Preparation
Total DNA was extracted from each of the 22 silica-dried leaf samples with QIAGEN® DNeasy® Plant Maxi Kits, using 0.2 g of the ground tissue material to generate 1.5 ml of solution, as per the manufacturer’s protocol. Fragment size was estimated using Agilent 4200 TapeStation (Agilent Technologies, Palo Alto, CA, United States). To homogenize median fragment size across all samples, those with fragment sizes >400 bp were sonicated in Covaris AFA Fiber Pre-Slit Snap-Cap micro TUBEs for 40 s using Covaris E220 Focused-Ultrasonicator (Covaris, Inc., Woburn, MA, United States) with peak power set to 50W and duty factor at 20%.
Sequencing libraries were created with the NEBNext Ultra (New England Biolabs, Ipswich, MA, United States) kit, using 200 ng of fragmented DNA for each sample and size-selecting at 550 bp with Ampure magnetic beads. The libraries were prepared in 25 μl (half volume) to maximize reagents and indexes, and then amplified through eight cycles of PCR amplification. DNA was quantified using a Quantus (Promega Corporation, Madison, WI, United States) fluorometer, and fragment size was estimated using TapeStation. Dual indexed samples were pooled with up to 50 ng of library DNA for enrichment using an Angiosperm-353 v1 target capture kit (Johnson et al., 2019) available from Arbor Biosciences (Ann Arbor, MI, United States), performed for over 24 h at 65°C. Enriched products were PCR-amplified for 12 cycles and sequenced on Illumina MiSeq (Illumina, San Diego, CA, United States) with v3 reagent chemistry (2 × 300-bp paired-end reads) at the Royal Botanic Gardens (Kew, United Kingdom).
Data Processing and Recovery of Target Loci
Raw sequences were quality-filtered, and adapters were removed using Trimmomatic (Bolger et al., 2014) in Illumina clip palindrome mode following the settings available in Murphy et al. (2020). The resulting cleaned data were used to assemble loci via the HybPiper pipeline v1.3.1 (Johnson et al., 2016) using the BLAST option. Orthologous nuclear coding sequences (CDS) and the non-coding “splash zone” encompassing intron and intergenic DNA fragments flanking the target exons (INT) were both targeted for recovery for each of the 353 loci in the multi-species amino acid target file (Johnson et al., 2019). Additionally, off-target plastid reads were recovered using a target file composed of 78 Eugenia uniflora genes (excluding duplicates) downloaded from GenBank (accession number NC_027744.1; Eguiluz et al., 2017). The coverage cut-off option was set to four for both recoveries. HybPiper indicates loci with potential paralogs (Johnson et al., 2019). These were excluded when recurrent in more than three samples, which was the case only for the nuclear loci: g4527 (gene PTAC10), g5578 (PSAG), g5910 (HCF136), g6003 (LPA1), and g6376 (GCP4). For more information on the genes, see https://treeoflife.kew.org/gene-viewer.
Datasets and Alignment
Sampling was based on nuclear and plastid databases encompassing Eugenia and its tribe, Eugeniinae, as well as six outgroups of other Neotropical Myrtaceae genera. CDS and INT were recovered from the nuclear dataset, while only CDS was used from the plastome. Ambiguous alignment and low phylogenetic signal prevented the use of plastid intronic sequences. This resulted in three nuclear datasets [coding (ncCDS), introns (ncINT), a combination called genomic dataset (ncGD)], and one plastid dataset (see Table 1 for acronyms). The plastid dataset (plCDS) only included Myrcianthes as outgroup to avoid ambiguous alignment. Multiple species alignments were performed using the default settings of PASTA v1.8.5 (Mirarab et al., 2015). Spurious alignment sites and gaps were removed using the “-gt 0.2” option of trimAl v1.3 (Capella-Gutiérrez et al., 2009), which removes all sites with gaps in more than 80% of the sequences.
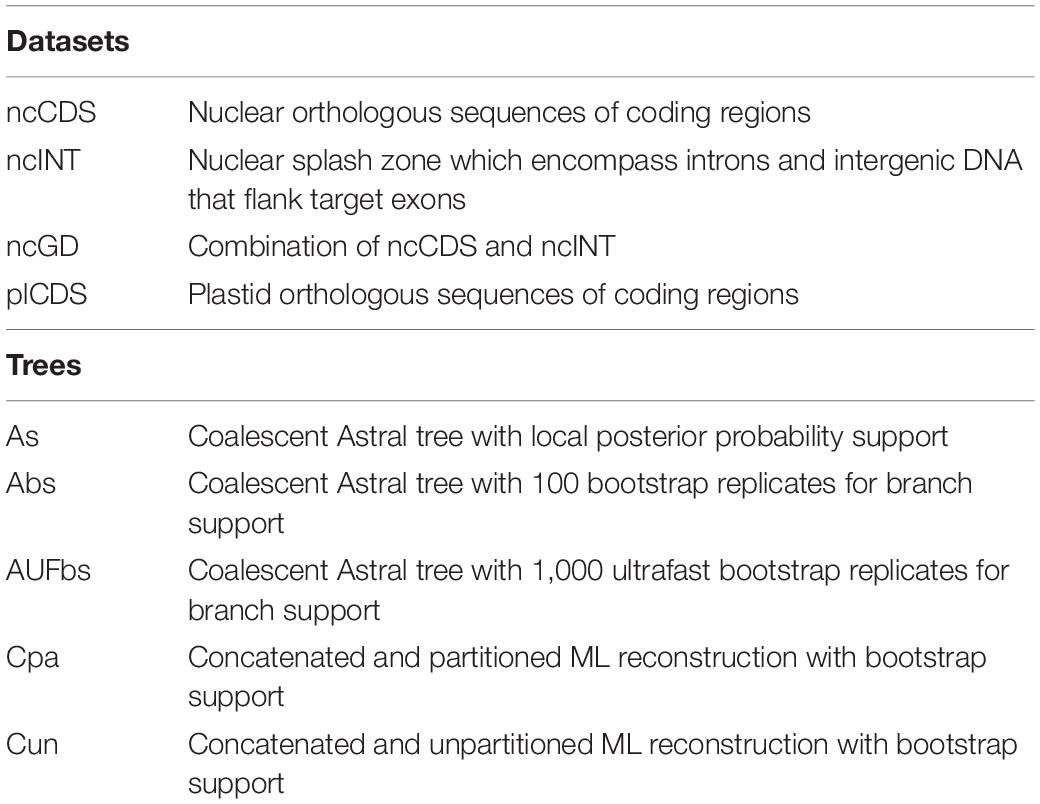
Table 1. Acronyms for datasets and trees.
Model Violation and Loci Selection
Model violation of partition sequence evolution was tested (Naser-Khdour et al., 2019). Loci that did not fit the test of symmetry implemented in IQ-TREE 2.0 (Nguyen et al., 2015; Minh et al., 2020) through the command “–symtest-remove-bad” using default parameters (p-value = 0.05) were excluded before evolutionary model calculation and phylogenetic reconstruction (Supplementary Table 2). ModelFinder (Kalyaanamoorthy et al., 2017) was then used to determine the best substitution models of molecular evolution according to the Bayesian Information Criterion (BIC) implemented in IQ-TREE.
Phylogenetic Reconstruction
Concatenation and multispecies coalescent model (MSC)-based approaches were implemented for the phylogenetic reconstruction (see Table 1 for acronyms). The four datasets (ncCDS, ncINT, ncGD, and plCDS) were independently concatenated into four matrices with AMAS.py (Borowiec, 2016) and used as input to a fully partitioned scheme that estimates best-fit substitution models by loci, and an alternative unpartitioned scheme (also referred to as “supergene,” e.g., Gonçalves et al., 2019) that assumes only one substitution model. This resulted in eight concatenated species trees. Tree recovery was performed using maximum likelihood (ML) reconstruction in IQ-TREE. The option “-spp” was used in the concatenated fully partitioned scheme, allowing all partitions to share the same relative branch length while maintaining their own evolutionary model (Duchêne et al., 2019). Different metrics of branch support were compared. The parametric aBayes exhibits best power in scenarios of low or mild model violations and tends to give results very similar to the MCMC posterior probability (Anisimova et al., 2011). Additionally, more conservative branch support tests were performed using ultrafast bootstrap 2 (UFbs) (Hoang et al., 2018) and non-parametric SH-aLRT that calculates a unique branch support for the node instead of a summary of three confidence values, a robust approach for short branches (Guindon et al., 2010), implementing 1,000 replicates each. Both UFbs and SH-aLRT are believed to underestimate branch support. Additionally, individual locus alignments based on the ncCDS, ncINT, and plCDS datasets were used for gene tree inference in IQ-TREE using the same parameters as the concatenated full partition scheme except that only the UFbs was used for branch support. Resulting gene trees were used as input for the MSC approach using ASTRAL-III (Zhang et al., 2018), which uses a maximum quartet support method to produce species trees statistically consistent under the MSC model as long as gene trees are error-free (Mirarab et al., 2014; Mirarab and Warnow, 2015). We built three independent species trees with local posterior probability (-t 3) branch support values. Additionally, MSC trees using 1,000 UFbs replicates and 100 bootstrap (bs) replicates of each gene tree (for a total of 353 genes, it would be ca. 353,000 and ca. 35,300 input gene trees, respectively) were recovered for each dataset, resulting in six independent species trees. The gene trees from the ncCDS and ncINT datasets were used as input for the MSC approach in the genomic dataset (ncGD); 1,000 UFbs replicates and 100 bootstrap (bs) replicates were implemented per gene tree, resulting in three independent species trees. Thus, a total of 20 species trees were recovered, and their topologies were compared. Statistical branch support was considered high for local posterior probability and bootstrap values when ≥0.9 and ≥90, respectively, and low when <0.75 and <75, respectively.
Assessment of Congruence
Assessment of the tree landscape was performed to investigate congruence among the 20 species trees, contrasting the concatenated method with the MSC model. The statistical distribution of tree topology distance was calculated using the Robinson-Foulds algorithm (Robinson and Foulds, 1981) for unrooted trees and the Kendall-Colijn algorithm (Kendall and Colijn, 2016) for rooted trees. The Robinson-Foulds (RF) metric is based on the distance between clades of the different unrooted trees. The Kendall-Colijn (KC) metric calculates distances between pairs of taxa and their most recent common ancestor, and from that node to the root. The R package treespace v.1.1.3.2 (Jombart et al., 2017) was used to explore the phylogenetic landscape and identify similar topologies through hierarchical clustering of principal components using the function “findGrove.” Outgroups and six more tips (Eugenia nutans O.Berg, E. aubletiana Mattos, E. neograndifolia Mattos, E. fasciculiflora O.Berg, E. flavescens DC., and E. batingabranca Sobral) were removed from the species trees using the function “drop.tip” of the package ape v.5.3 (Paradis et al., 2004) to assemble an input file containing species trees with the same tips, as required for treespace. The function “reroot” of the package phytools v.0.6-99 (Revell, 2012) was used to root the trees on Myrcianthes fragrans. Plots and graphs were generated using ggplot2 v.3.2.1.
Statistical significance of incongruence between topologies was assessed using a partitioned concatenated tree produced using ML (fixed tree) and compared against each species trees. The ML-partitioned concatenated tree was used in this step, because it is closest to the arrangement used in previous molecular phylogenetic reconstructions in Eugenia (e.g., Bünger et al., 2016a; Mazine et al., 2016; Mazine et al., 2018; Giaretta et al., 2019b). The target ncCDS was used to run the fixed tree. Shimodaira-Hasegawa (SH) and approximately unbiased (AU) (Shimodaira and Hasegawa, 1999; Shimodaira, 2002) topology tests were performed to contrast a fixed tree with a set of all species trees. For this analysis, 10,000 resampling estimated log-likelihood (RELL) replicates were used with the same set of species trees (with dropped tips) implemented for treespace. The SH test tends to be more conservative, increasing the probability of recovering a false positive (topologies are statistically similar), while AU accounts for reduction in less conservative probabilities (Shimodaira, 2002). To further investigate conflicting signal among loci and across sites, the gene concordance factor (gCF) and site concordance factor (sCF) (Minh et al., 2020) were calculated for each node using the options “–gcf” and “–scf 100” in IQ-TREE. The gene and site concordance factors (gCF and sCF) are expressed in percentages and intuitively express underlying variance in data supporting a branch at both gene-level and site-level, irrespective of the size of the sample (Minh et al., 2020). Essentially, a concordance factor captures the proportion of single-locus trees consistent with a particular branch using a framework tree as reference. Astral trees of ncCDS, ncINT, and plCDS were used for reference. The gCF and sCF are used in conjunction with measures of statistical support to better depict the underlying process of phylogenetic reconstruction. The minimum score for the sCF is 33%, because it is calculated according to three possible resolutions of a quartet recovered at a node, while gCF varies from 0 to 100% (Minh et al., 2020). Gene concordance factor scores are classified as low (<30%), moderate (30–80%), and high (≥80%). These scores can be interpreted as follows [see a detailed example in Lanfear (2018), http://www.robertlanfear.com/blog/files/concordance_factors.html, accessed on 14/10/2021]. Similar gCF and sCF scores would suggest that the only source of discordance in the single locus tree is the conflicting signal caused, for instance, by genuine incomplete lineage sorting. Alternatively, a much lower gCF than sCF could indicate that other processes are involved, for instance stochastic error caused by limited signal for individual genes. High gCF and low sCF might indicate considerable overall noise that is nonetheless insufficient to distort the strong agreement between genes. Concordance factor scores of 14 recurrent clades in the species trees were viewed as heatmaps using the package pheatmap v.1.0.12 implemented in R.
Results
Data Retrieval
Summary statistics of the nuclear dataset indicate recovery of 1,815,065 reads with an average of 33,000 reads per sample (range: 12,222–143,714). On average, 292 loci were recovered per sample (range: 226–335); 132–268 loci (200 loci on average) had at least 50% coverage (Supplementary Figure 1). Nuclear CDSs were retrieved for 332 loci as well as 328 intron loci. Five potential paralog loci, 21 exons, and 84 introns did not fit the test of symmetry and were excluded, leaving 306 ncCDS loci and 239 ncINT loci for downstream analyses. For plastome off-target CDS (plCDS), 67,199 reads were recovered with an average of 1,083 reads per sample (range: 138–6,086). On average, 11 loci were recovered per sample (range: 1–56), with a maximum of 55 loci with at least 50% coverage (nine loci on average). An amount of 44 loci were retrieved for plCDS that fit the symmetry test.
The trimmed alignment length of individual loci of the ncCDS was between 59 and 2,713 bp (590 on average) with a total length of 179,123 bp, while the ncINT was 243–47,434 bp (1,375 on average) with total length of 328,564 bp (Table 2). The individual loci of the plCDS account for 183–5,613 bp (1,116 bp on average) with a total length of 49,437 bp. Parsimony informative sites (PIS) increased with alignment length (Supplementary Figure 2), except for the plastid dataset that maintained low levels of variation even in long alignments (Table 2). ncCDS had 11.9% PIS, and this increased to 26.9% in ncINT, at the cost of more missing data.
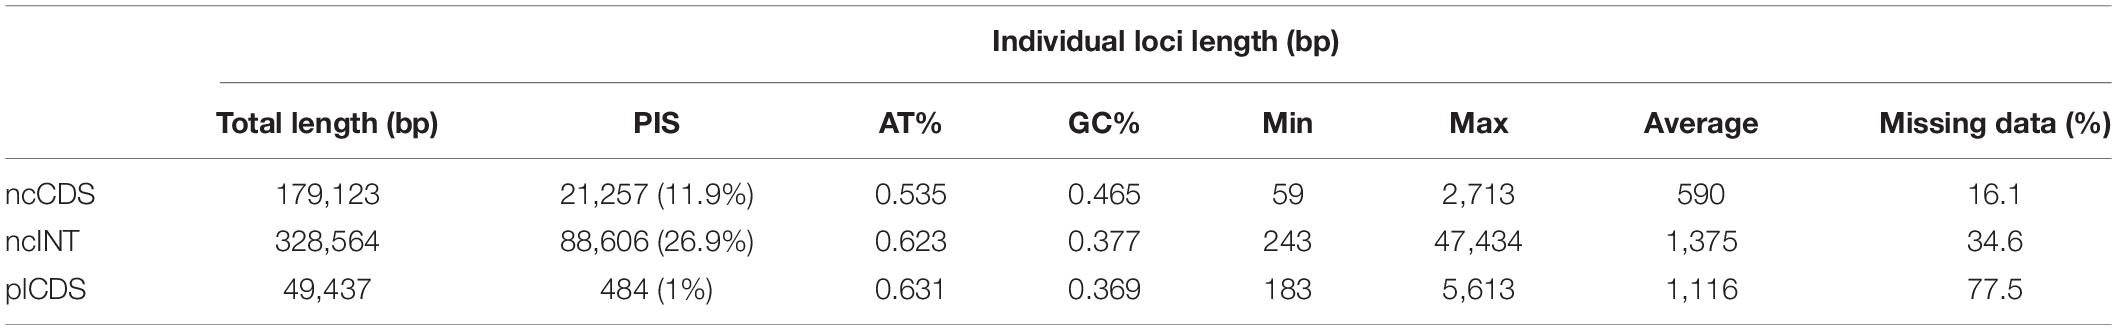
Table 2. Length of trimmed aligned contigs and parsimony informative sites (PIS) for the three datasets used in downstream analyses.
Phylogenetic Relationships
A total of 20 species trees resulted from the different datasets (see Supplementary Figure 3) detailed in the methods. Differences in the resulting topologies are relatively minor with the greatest divergences found between the nuclear and plastid datasets. Of the 10 sampled infrageneric groups of Eugenia, eight were recovered as monophyletic according to the nuclear dataset. Eugenia sects. Eugenia, Phyllocalyx, and Umbellatae were monophyletic in both the plastid and nuclear datasets. Eugenia sects. Excelsae, Schizocalomyrtus, Jossinia, and Racemosae were not recovered as monophyletic in plCDS, and E. sect. Excelsae was not monophyletic in the ncINT concatenated trees. Eugenia sects. Pseudeugenia and Pilothecium were not monophyletic in all the reconstructions. Eugenia sect. Speciosae was represented only by E. bunchosiifolia, so its monophyly could not be tested.
Topologies from the ncCDS and ncINT (Figures 2, 3) datasets are similar, except for minor differences caused by uncertainty in the phylogenetic position of Eugenia sects. Eugenia, Excelsae, Jossinia, Schizocalomyrtus, Phyllocalyx, and Racemosae. Additionally, Eugenia sect. Excelsae was not recovered as monophyletic in concatenated ncINT. Improved support for these sections was returned in topologies from the ncGD dataset (Figure 4). Likewise, the ncGD dataset produced similar topologies, except for the position of Eugenia sect. Eugenia that is sister to sect. Schizocalomyrtus + Excelsae in the concatenated tree, in contrast to its placement as sister to sect. Excelsae in the MSC tree. Another source of uncertainty is the position of deeper clades in Eugenia sect. Umbellatae, where support is lower in all the three datasets.
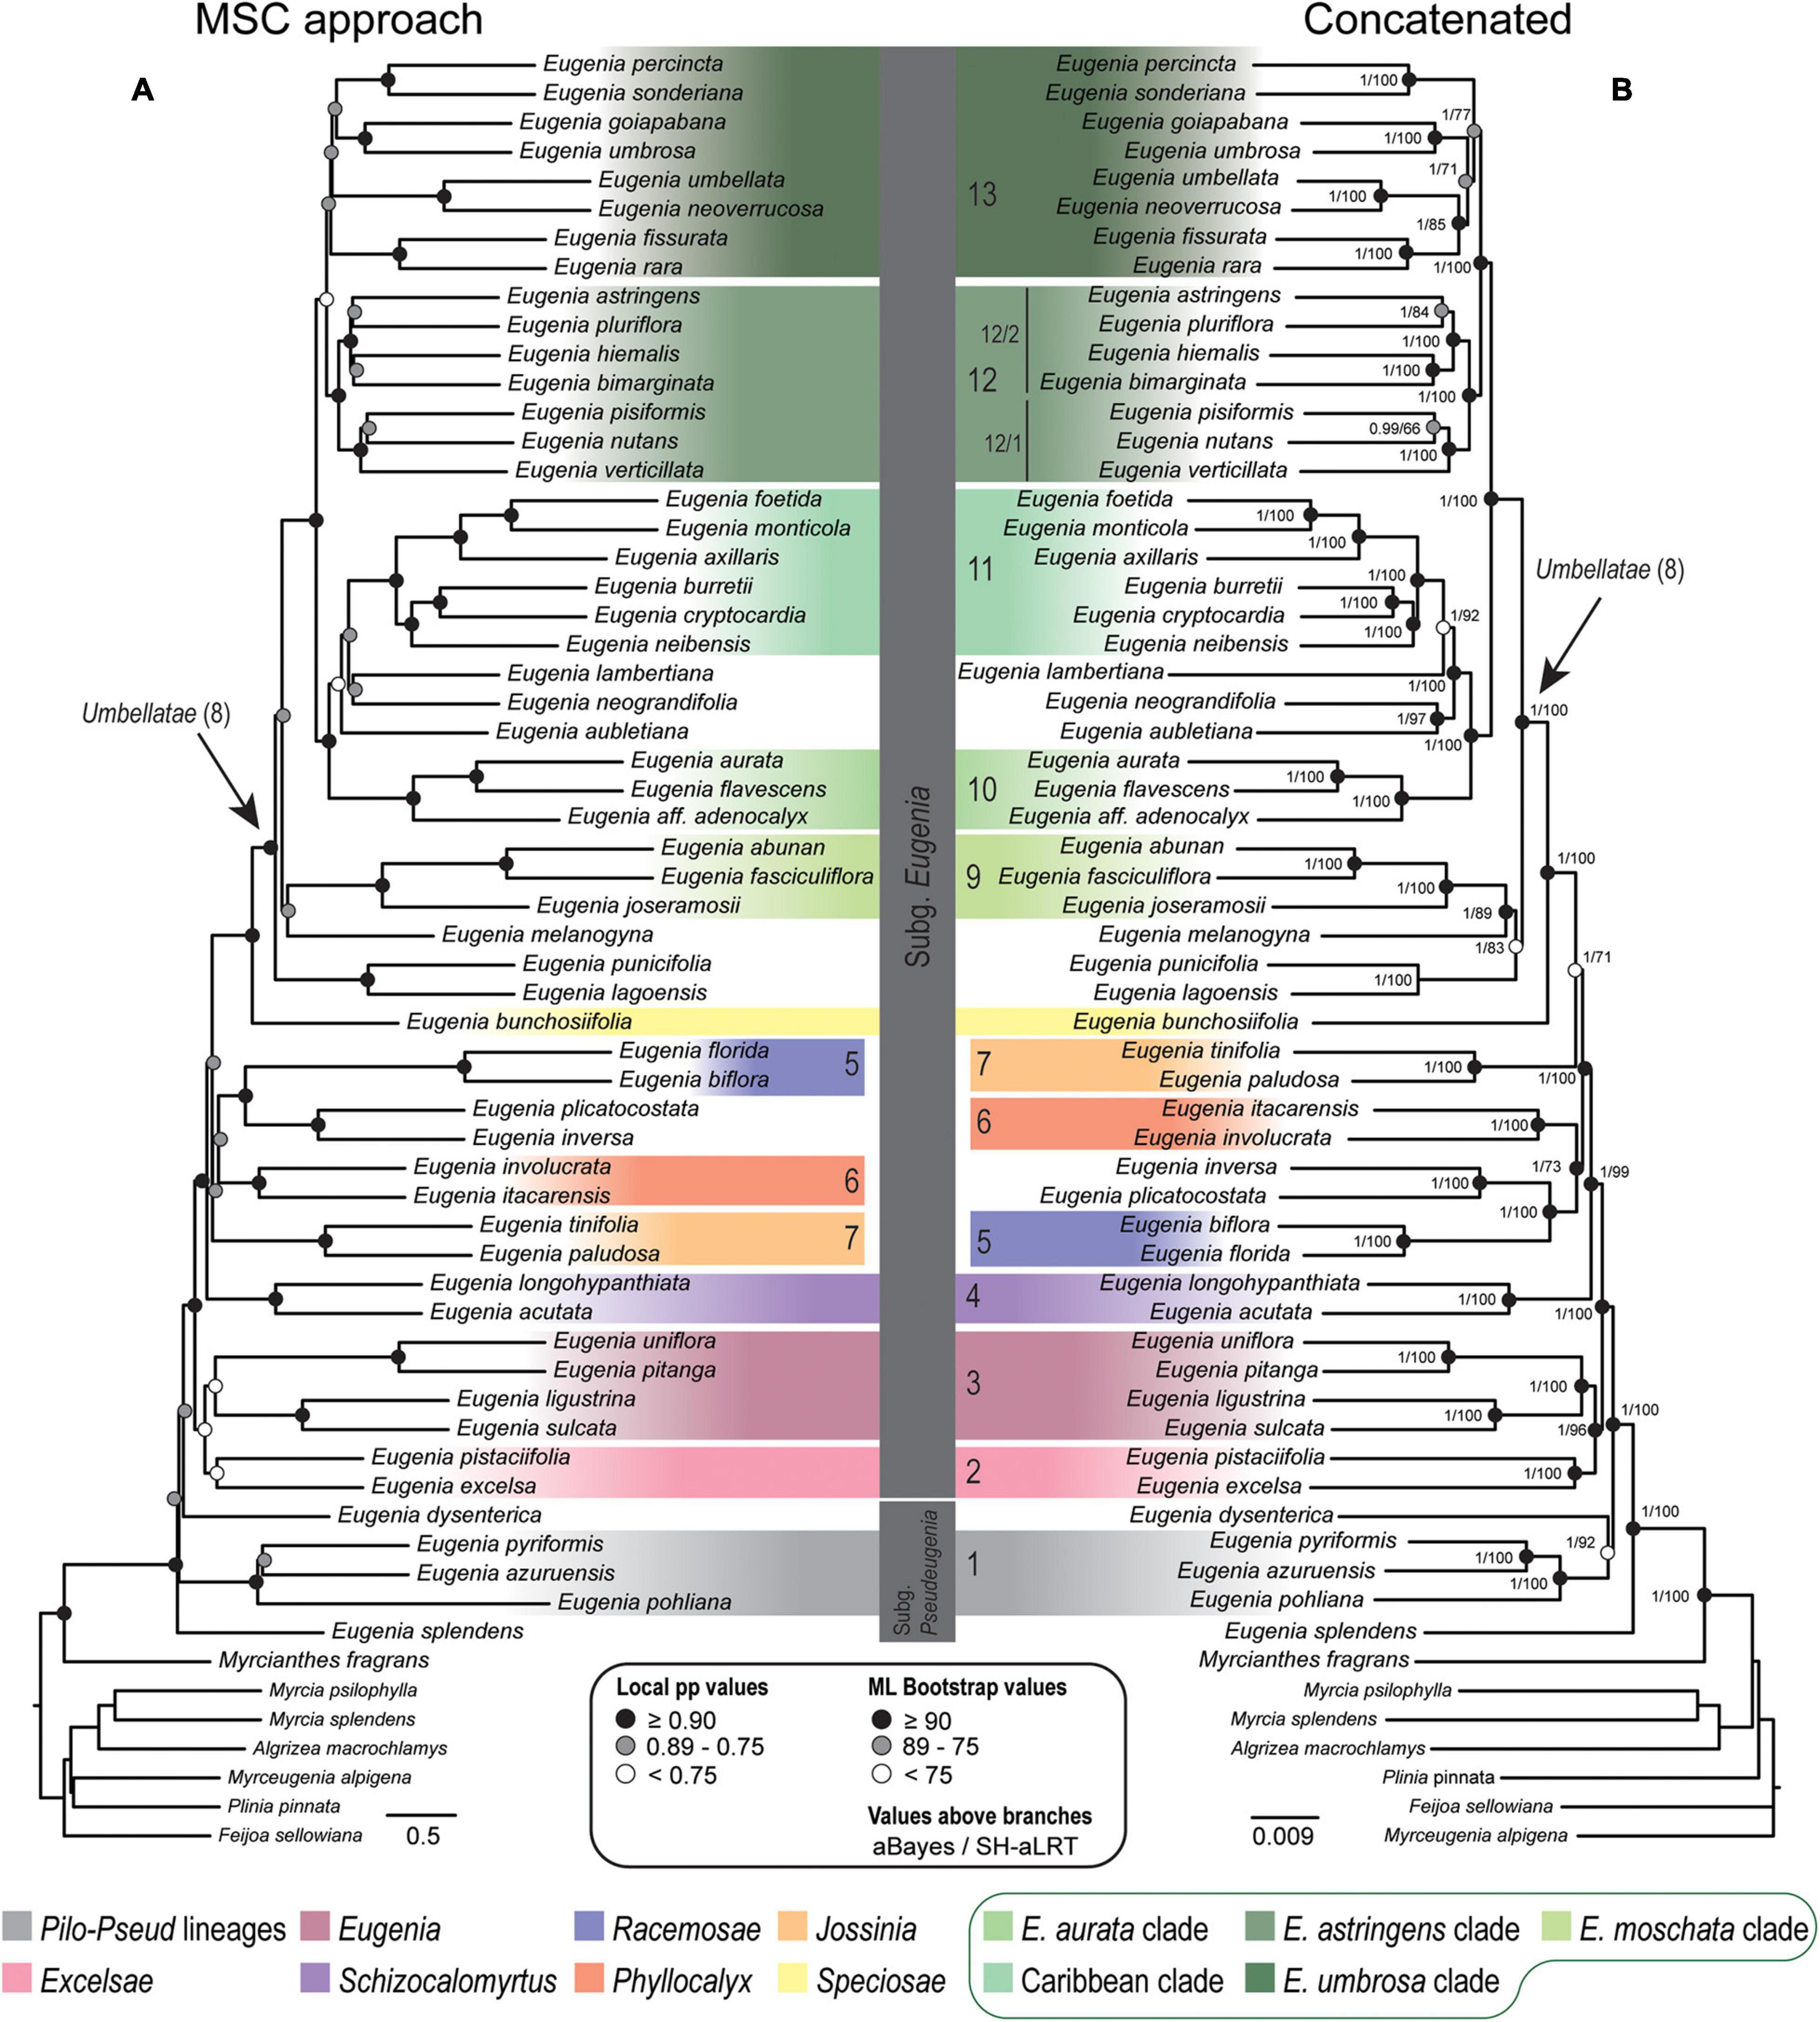
Figure 2. Phylogenetic reconstructions of Eugenia based on the 306 nuclear coding loci (ncCDS) targeted with the Angiosperm-353 probes. (A) Multi-species coalescent (MSC) tree using Astral with support values shown at nodes as local posterior probabilities (pp). (B) Concatenated partitioned tree with ML support shown at nodes as circles (see legend) and additional tests of branch support with values above branches (aBayes/SH-aLRT). Colored legend corresponds to the colored boxes (clades of Eugenia sect. Umbellatae are circled).
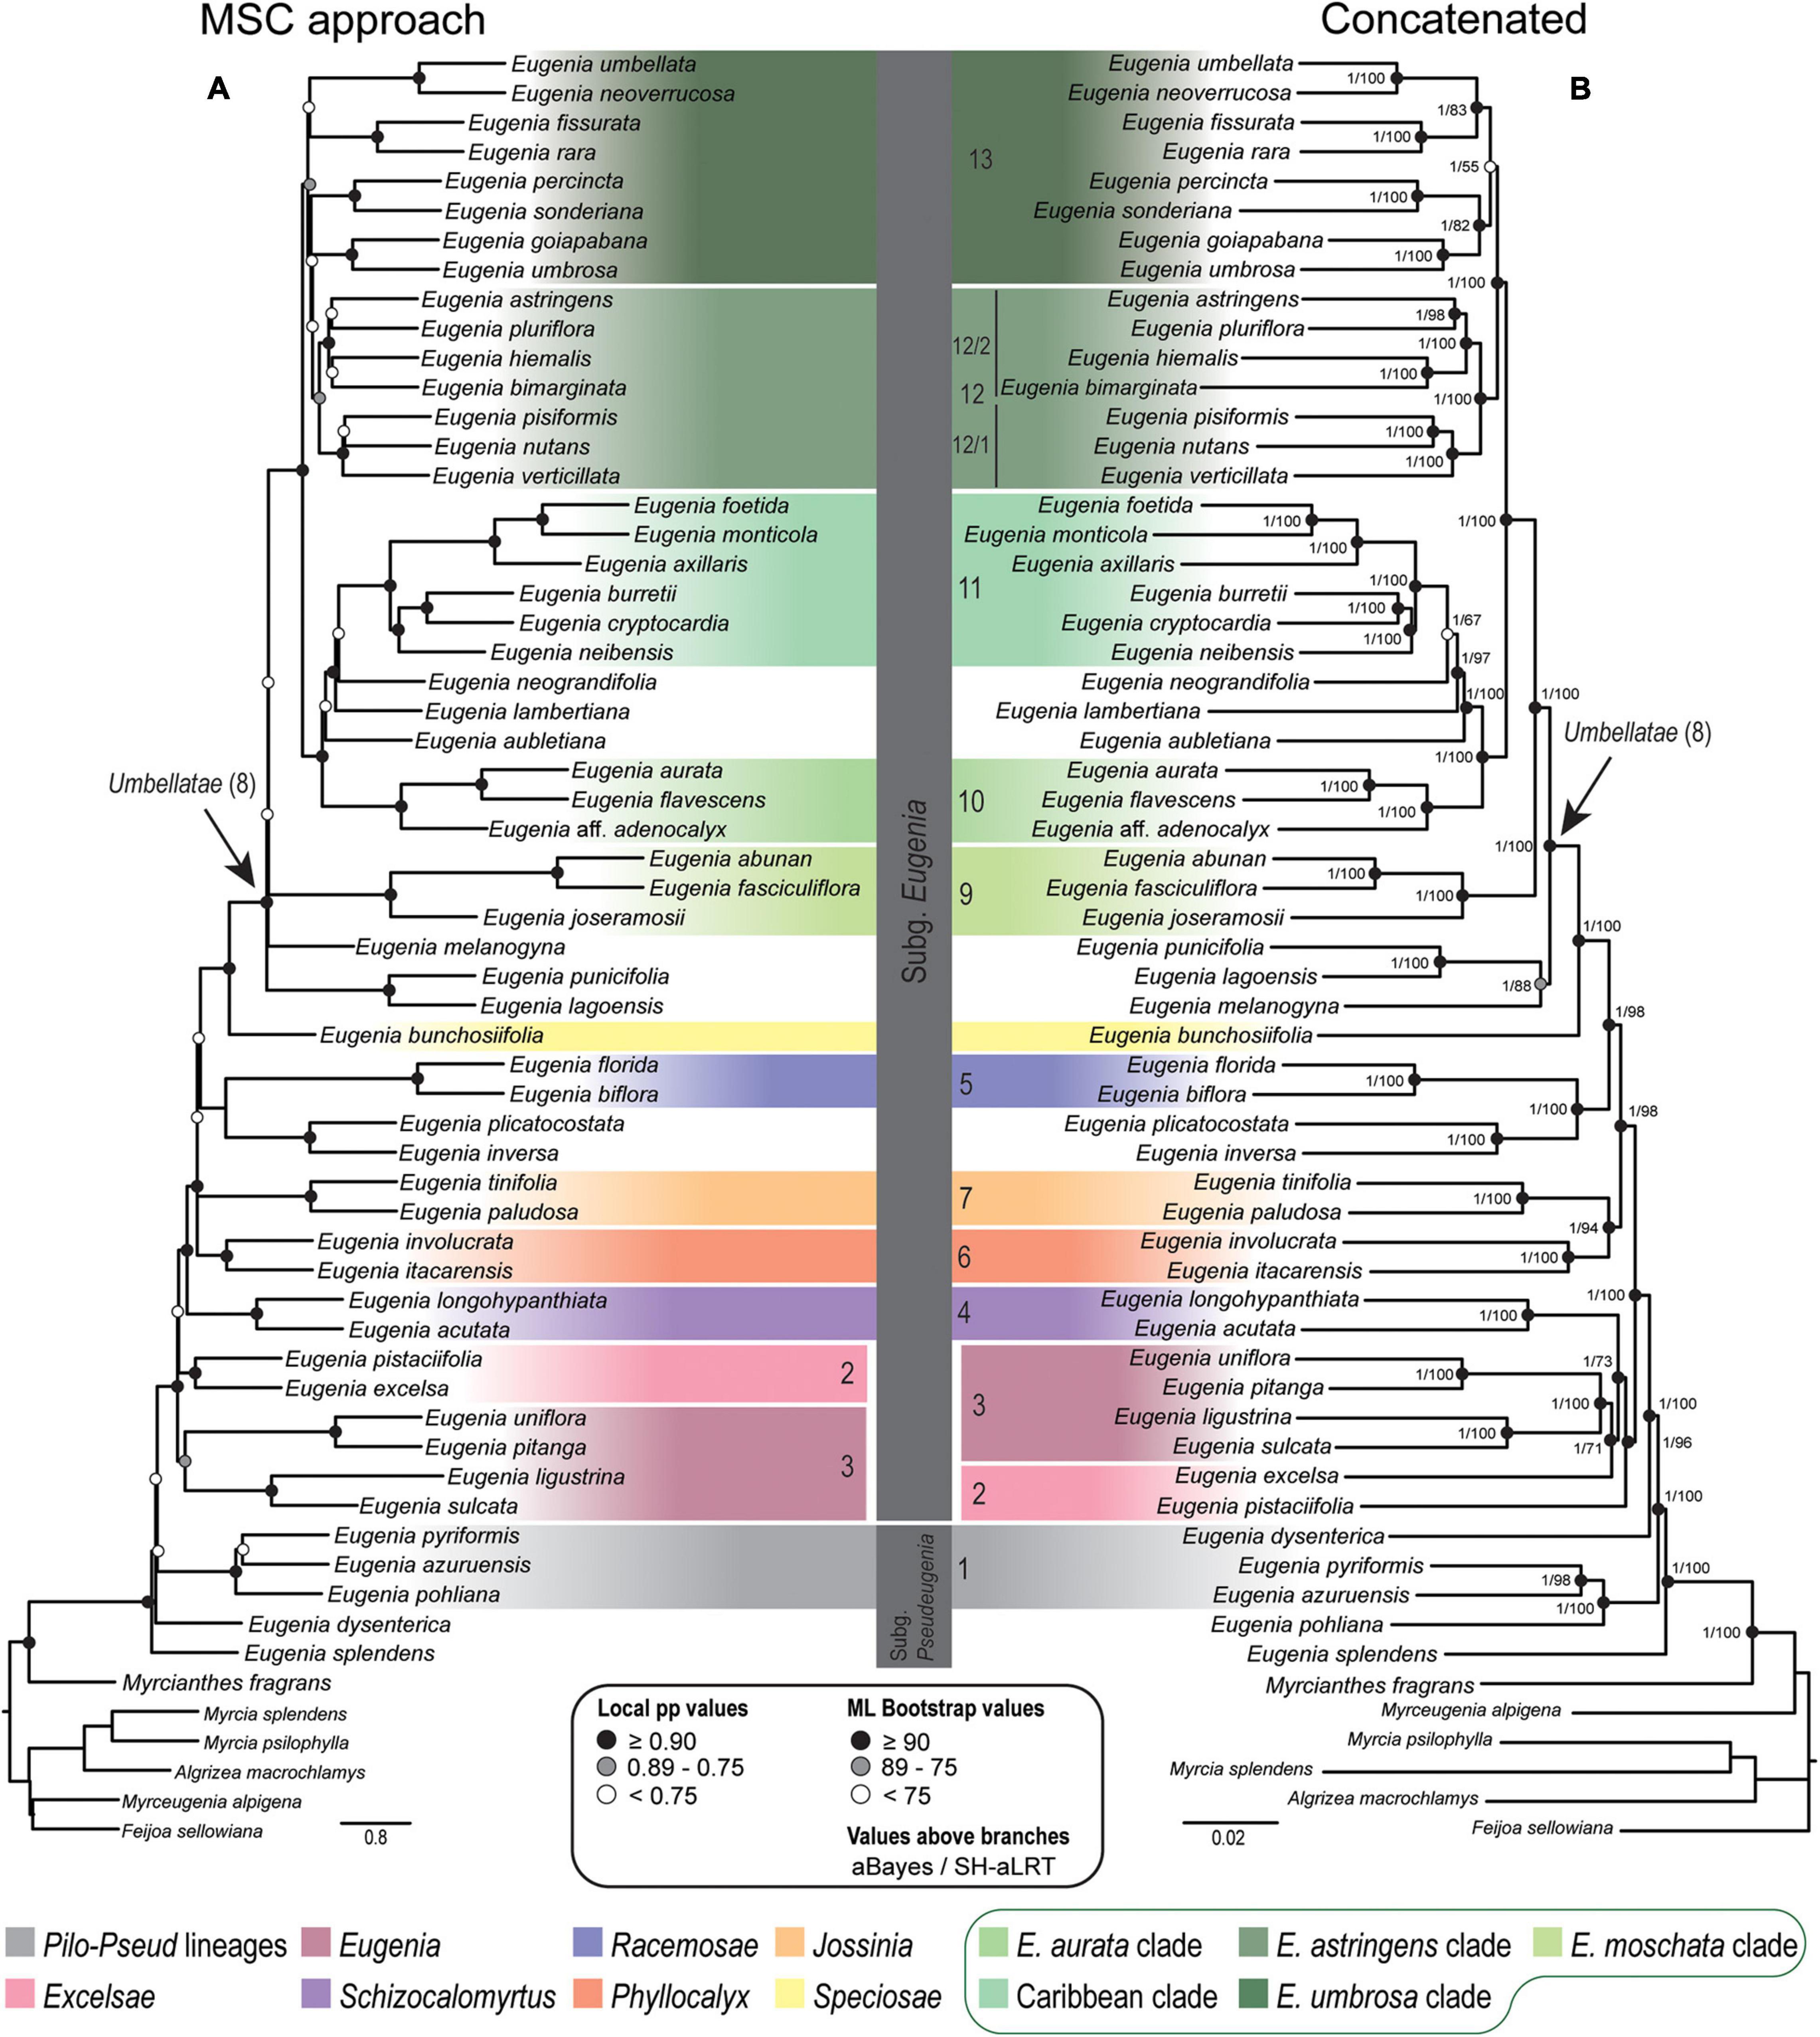
Figure 3. Phylogenetic reconstructions of Eugenia based on the 239 nuclear intron regions targeted with the Angiosperm-353 probes. (A) MSC tree using Astral with support values shown at nodes as local pp. (B) Concatenated partitioned tree with ML support shown at nodes as circles (see legend) and additional tests of branch support values above branches (aBayes/SH-aLRT). Colored legend corresponds to the colored boxes (clades of Eugenia sect. Umbellatae are circled).
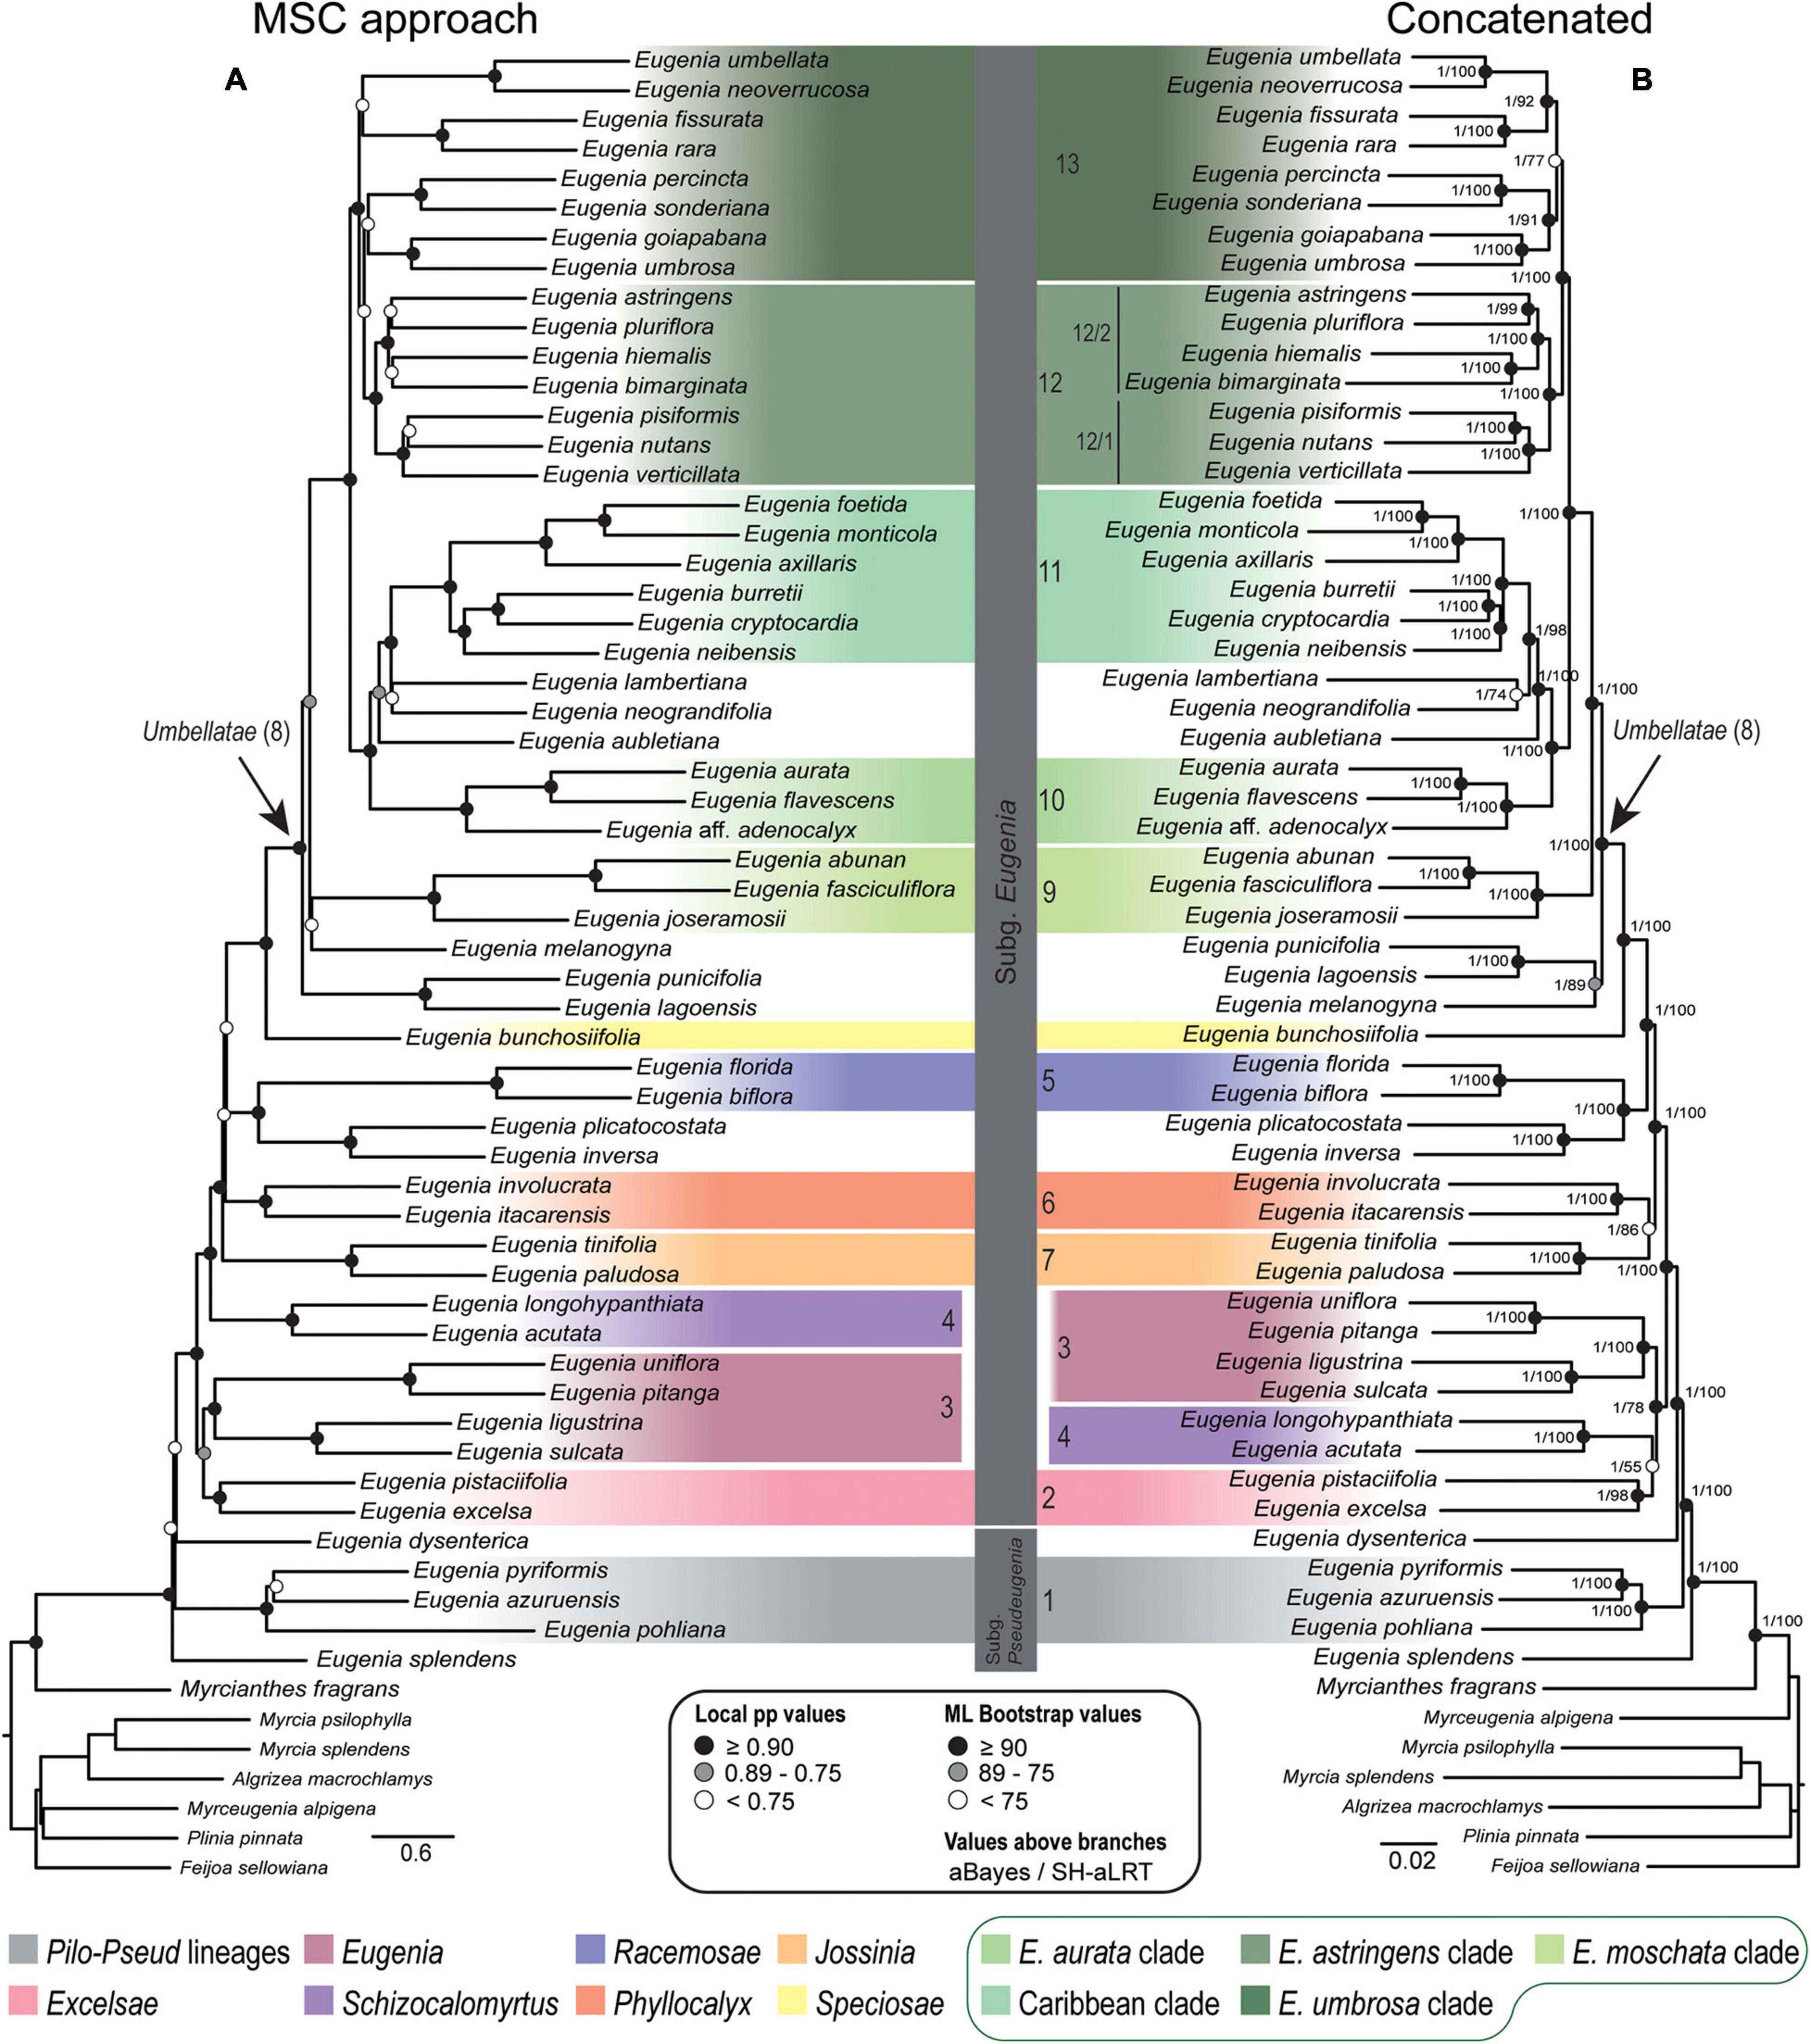
Figure 4. Phylogenetic reconstructions of Eugenia based on the 306 nuclear coding loci with 239 additional intron regions targeted with the Angiosperm-353 probes combined in a genomic dataset (ncGD). (A) MSC tree using Astral with support values shown at the nodes as local pp. (B) Concatenated partitioned tree with ML support shown at the nodes as circles (see legend) and additional tests of branch support with values above branches (aBayes/SH-aLRT). Colored legend corresponds to the colored boxes (clades of Eugenia sect. Umbellatae are circled).
Tree Landscapes
Hierarchical clustering of the species trees in the landscape resulted in distinct distributions mainly driven by the datasets. Robinson-Foulds (RF) recovered two groups that correspond to the dataset, while the hierarchical clustering in three groups observed in the Kendall-Colijn (KC) is consistent with the combination of the dataset and the method of reconstruction (Figure 5). This is clearer when the distribution of the species trees is evaluated considering the three most informative axes. The three axes of the RF algorithm based on unrooted species trees showed that those based on plastid are distantly related, although they were nested in the same group (Figures 5A,B). Conversely, trees based on nuclear sequences are closely distributed. However, a slight segregation between ncCDS and ncINT can be observed, especially when axes 1 and 2 are assessed (Figure 5A). Species trees based on the genomic dataset (ncGD) are arranged close with those based on ncINT except for the Astral tree without replicates (Figure 5A, “see GD_As”) that was more similar to the trees based on the exon dataset. The reconstruction method employed seems not to make a significant difference to the distribution of the trees in the RF analysis, while no pattern was observed for the distribution of trees based on the plastid dataset.
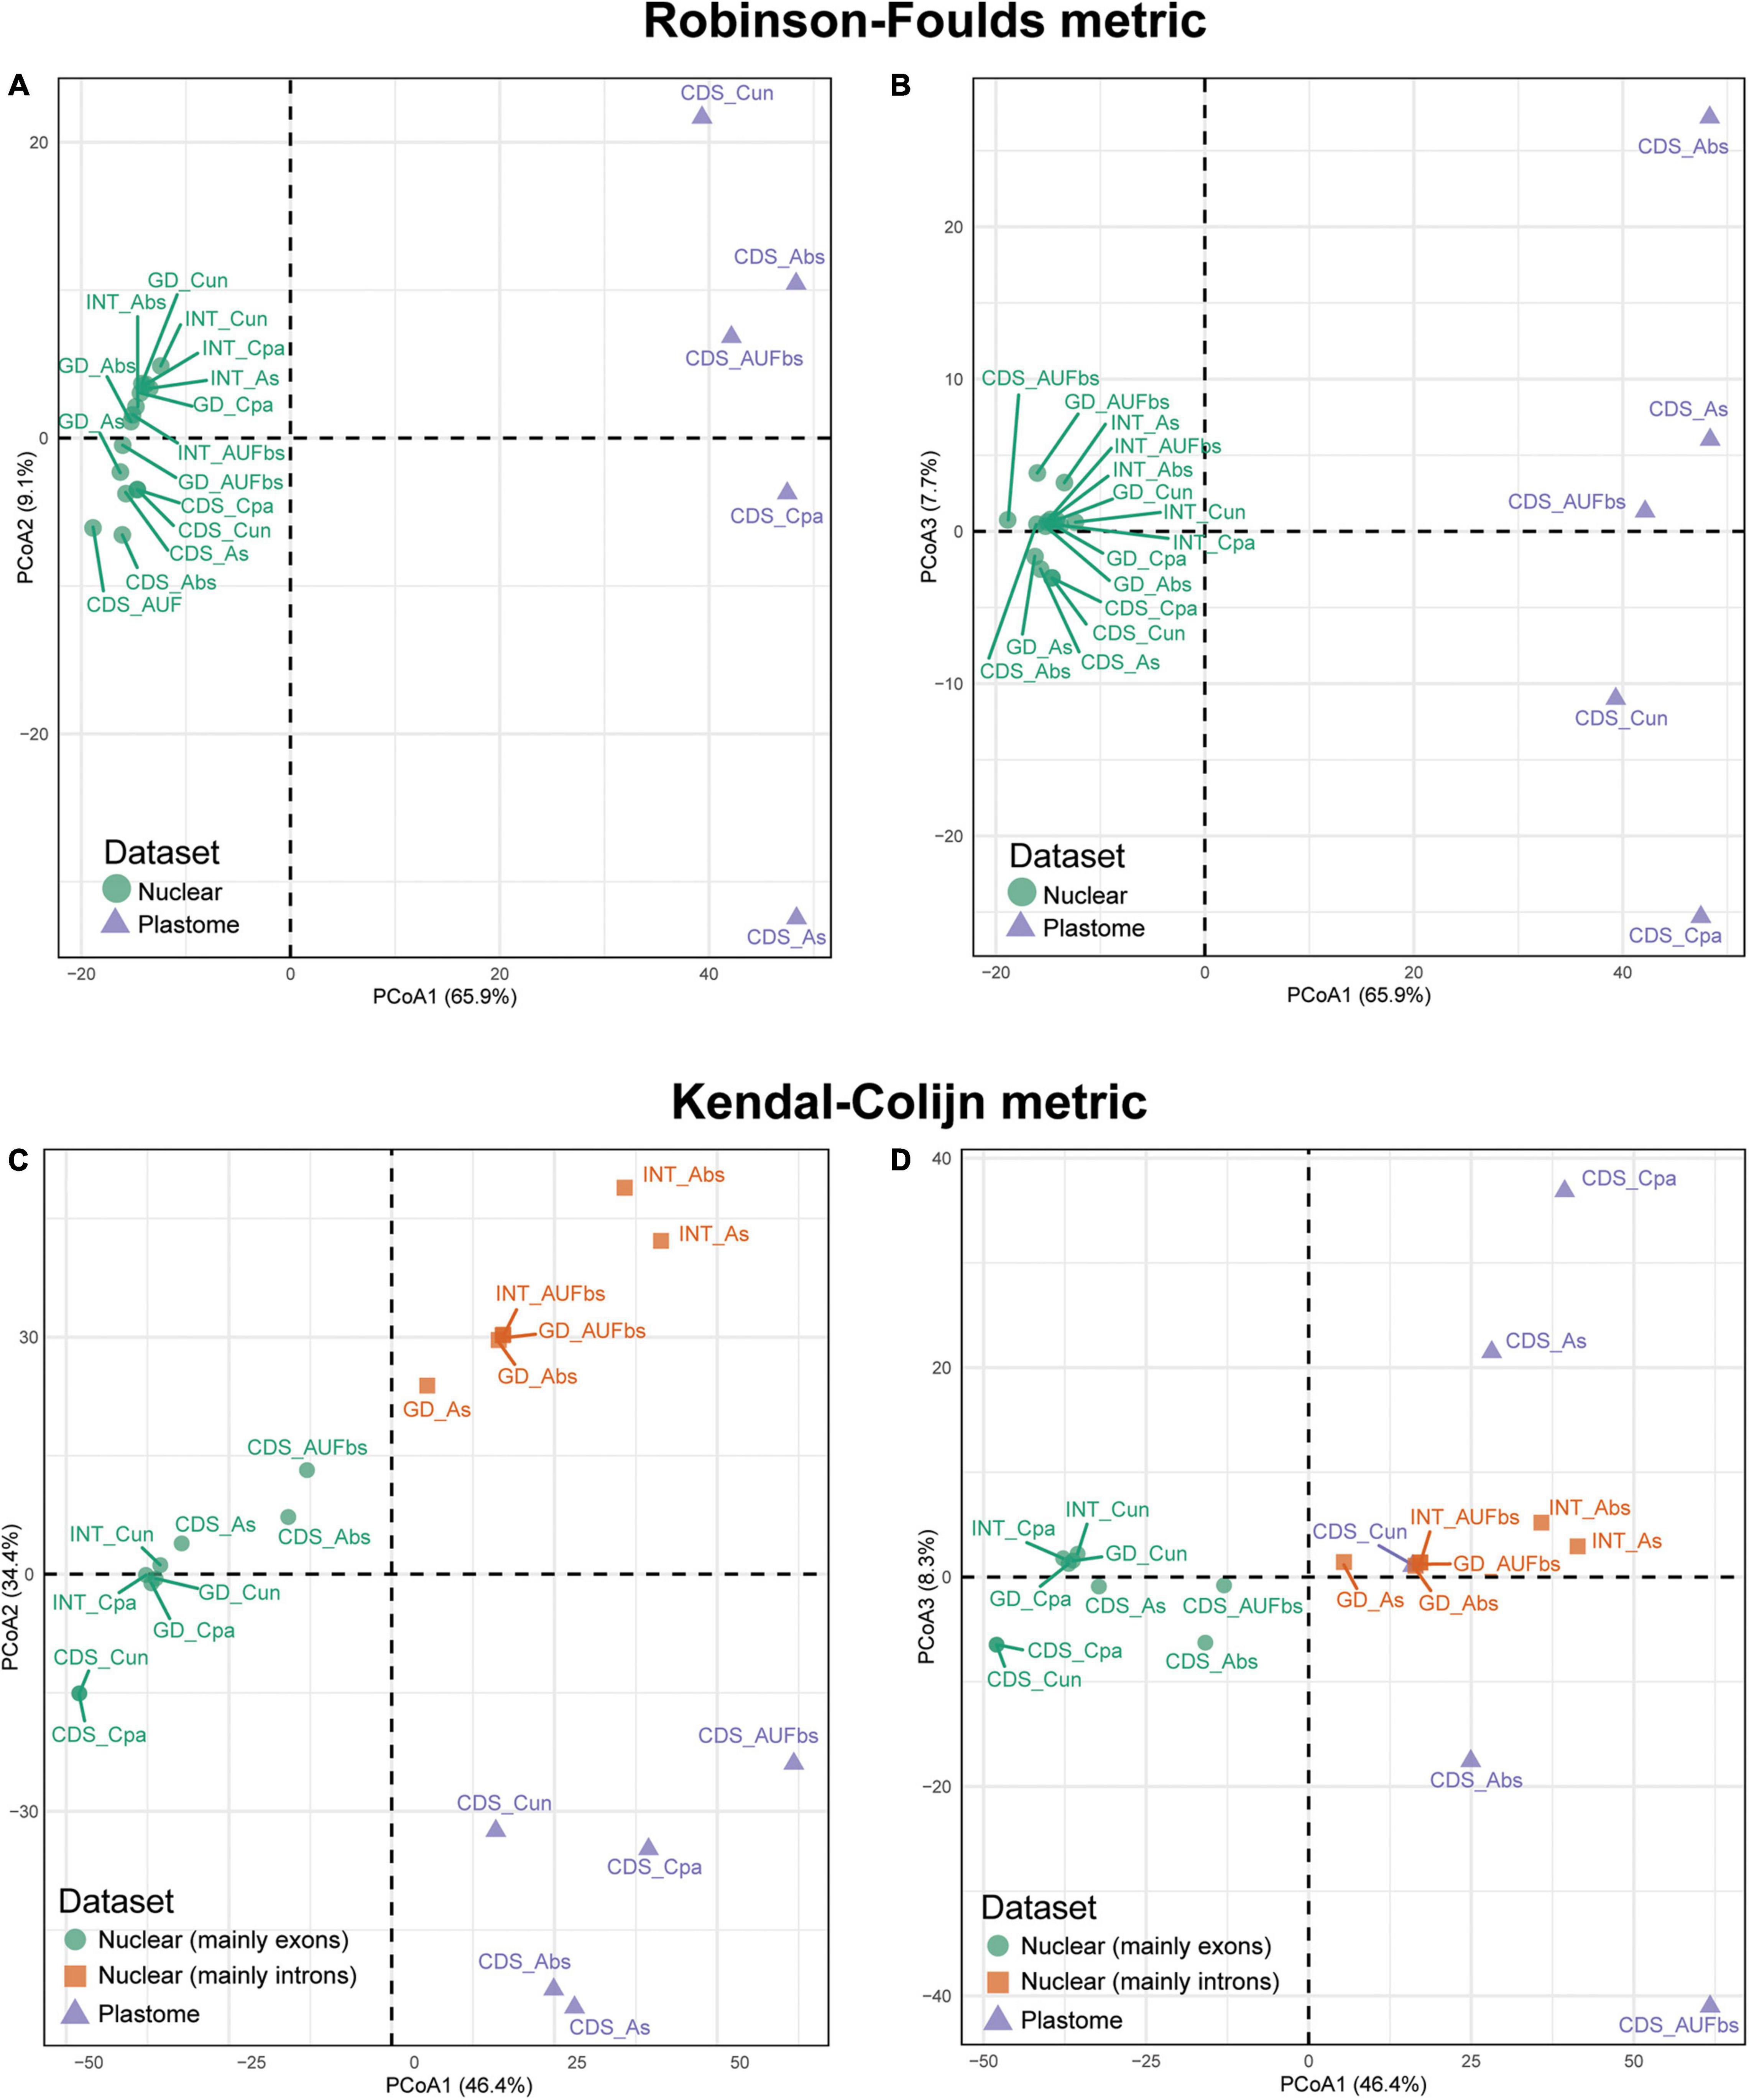
Figure 5. Principal coordinate analysis depicting ordinations of 20 tree topologies of Eugenia using Robinson-Foulds distance metric calculated from rooted trees (A,B) and Kendal-Colijn distance metric inferred from unrooted trees (C,D). CDS, orthologous sequences of coding regions; INT, splash zone encompassing introns and intergenic DNA that flank target exons; GD, combination of nuclear ncCDS and ncINT; Cpa, concatenated and partitioned ML reconstruction; Cun, concatenated and unpartitioned ML reconstruction; As, coalescent Astral tree with local posterior probability support; Abs, coalescent-based Astral tree with 100 bootstrap replicates; AUFbs, coalescent Astral tree with 1,000 ultrafast bootstrap replicates).
The KC algorithm based on rooted species trees showed tendency of trees based on the same dataset to cluster and, to a lesser extent, trees from the same reconstruction method also had this tendency (Figures 5C,D). This is particularly evident on axes 1 and 2 (Figure 5C) that show plastid dataset trees concentrated at the bottom of the plot (triangles), while the nuclear dataset trees are on top (circles and squares). Species trees based on ncINT and ncGD datasets from Astral analysis are grouped (squares) while ncCDS group together (circles), including the ncINT concatenated trees. The distribution assessed with axes 1 and 3 is less informative, even though it supports the arrangement formed by ncCDS dataset trees (Figure 5D). The plastid dataset trees lack a clear arrangement.
Topology Assessment
Table 3 shows the degree to which the dataset arrangement and reconstruction method influenced resulting topologies based on the tree topology tests. The more conservative SH test recovered dissimilarity in tree topologies with the plastid dataset regardless of the reconstruction method. The less conservative AU test showed that all topologies based on the plastid (plCDS) and intron (ncINT) datasets were different in comparison to the fixed tree. Topologies based on ncCDS and reconstructed using Astral were different from the fixed tree, whereas those reconstructed by a concatenation arrangement were statistically similar. Topologies resulting from ncGD were distinct from the fixed tree except for the Astral tree reconstructed without replicates.
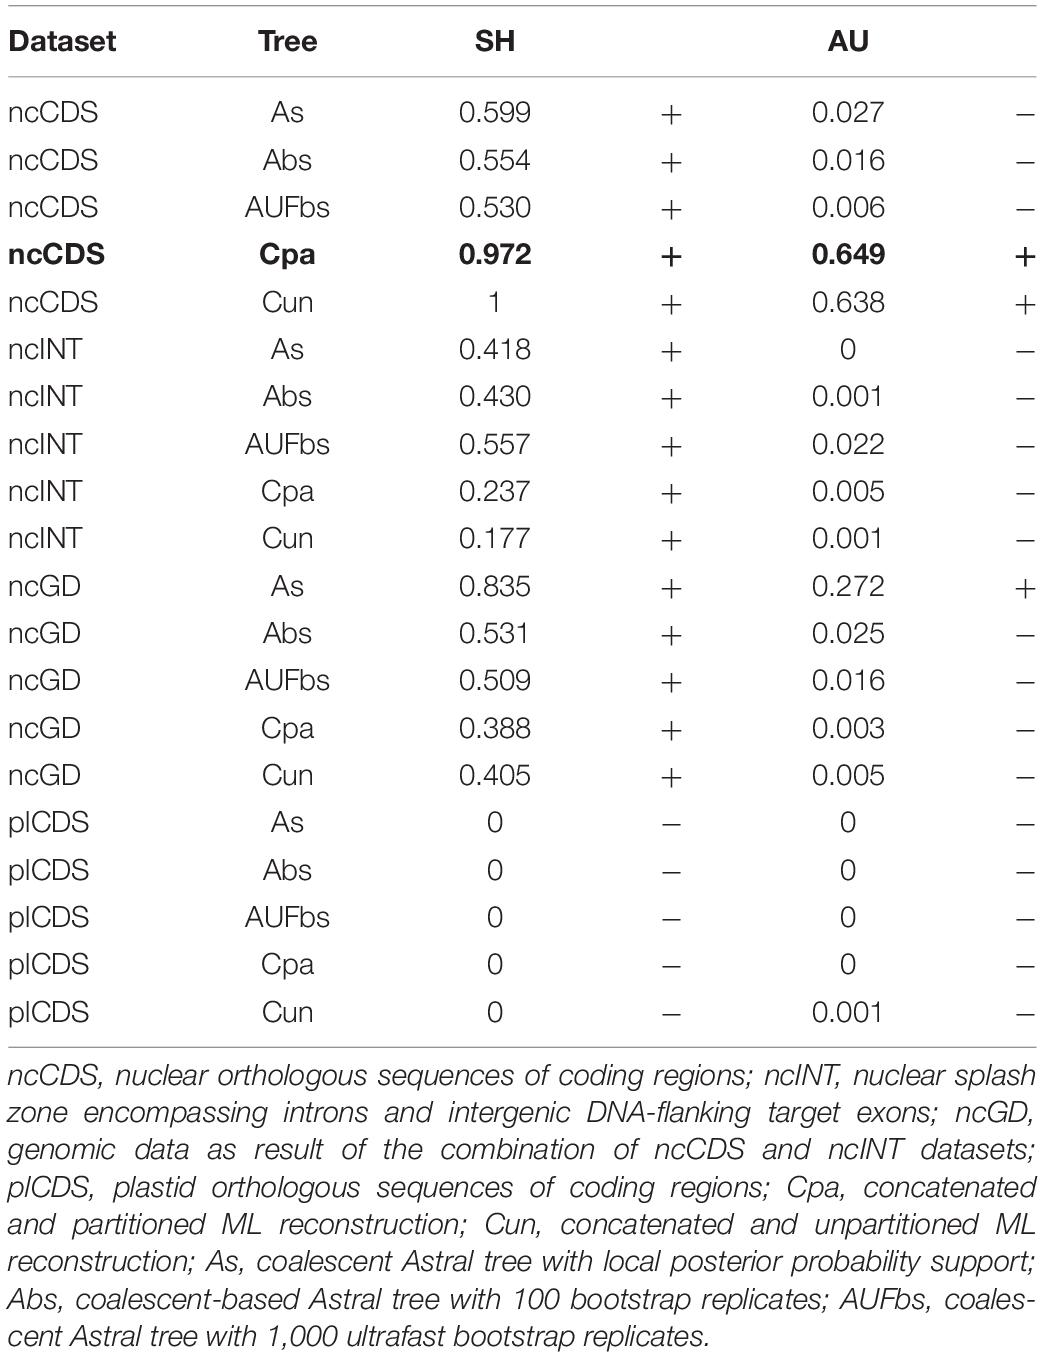
Table 3. Tree topology test contrasting a fixed tree in bold (concatenated partitioned reconstruction based on ncCDS) with all species trees in which p-value < 0.05 is rejected (−) as similar to the fixed tree, while p-value > 0.05 is accepted (+) as having a similar topology with the fixed tree.
Assessment of Congruence
Assessment of recurring nodes observed in the species trees focuses on 14 clades, one of which includes the outgroup Myrcianthes; seven correspond to the previously recognized sections of Eugenia, i.e., Eugenia sects. Excelsae, Eugenia, Schizocalomyrtus, Racemosae, Jossinia, Phyllocalyx, and Umbellatae (Figures 6–9); five clades are discussed within sect. Umbellatae; and one clade comprises two currently recognized sections (sects. Pilothecium and Pseudeugenia). The latter clade is sister to the remainder of Eugenia and is informally named as the Pilo-Pseud lineage (i.e., Pilothecium-Pseudeugenia lineage). Moderate scores of gene concordance factor (gCF) were recurrent in these lineages, in each of the three datasets (ncCDS, ncINT, and plCDS).
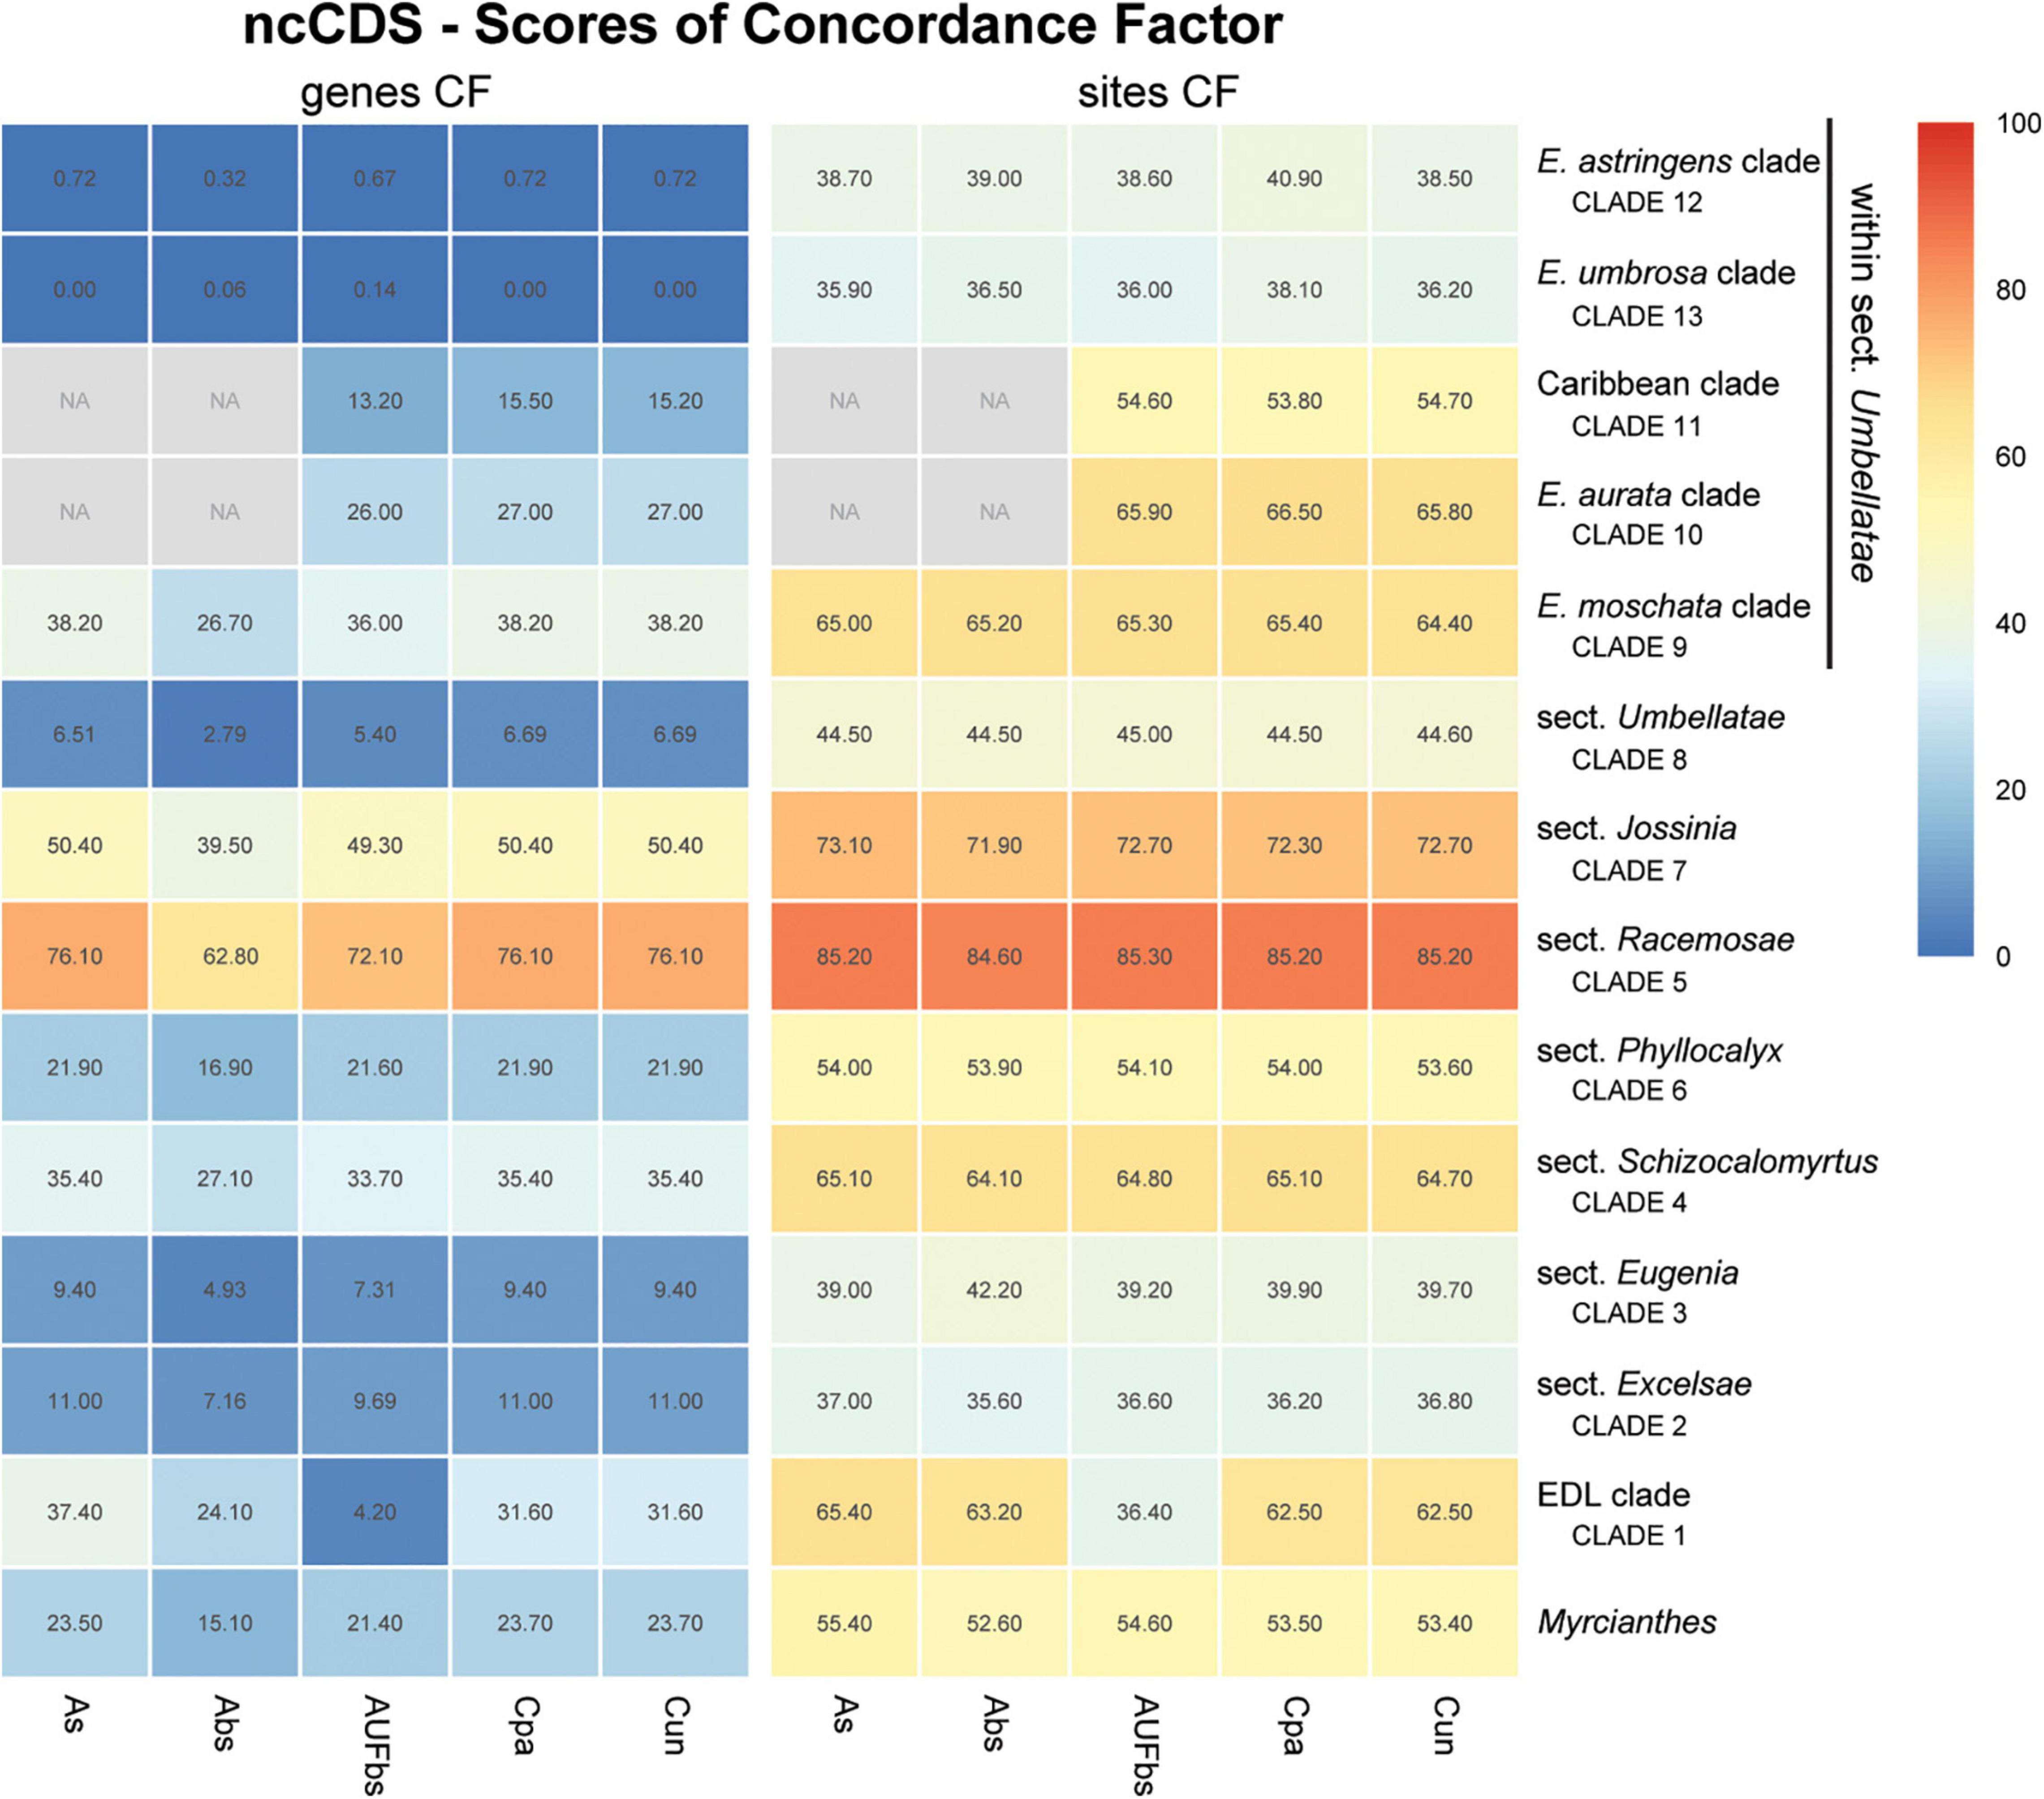
Figure 6. Heatmap of gene and site concordance factors (gCF and sCF) recovered in focus clades of the nuclear coding loci (ncCDS) in Eugenia. Each column is a method of phylogenetic reconstruction, and each row corresponds to a clade in Figures 2–4. Shading indicates percentage of concordance factor values recovered (Cpa, concatenated and partitioned ML reconstruction; Cun, concatenated and unpartitioned ML reconstruction; As, coalescent Astral tree with local posterior probability support; Abs, coalescent based Astral tree with 100 bootstrap replicates; AUFbs, coalescent Astral tree with 1,000 ultrafast bootstrap replicates; NA, node not recovered).
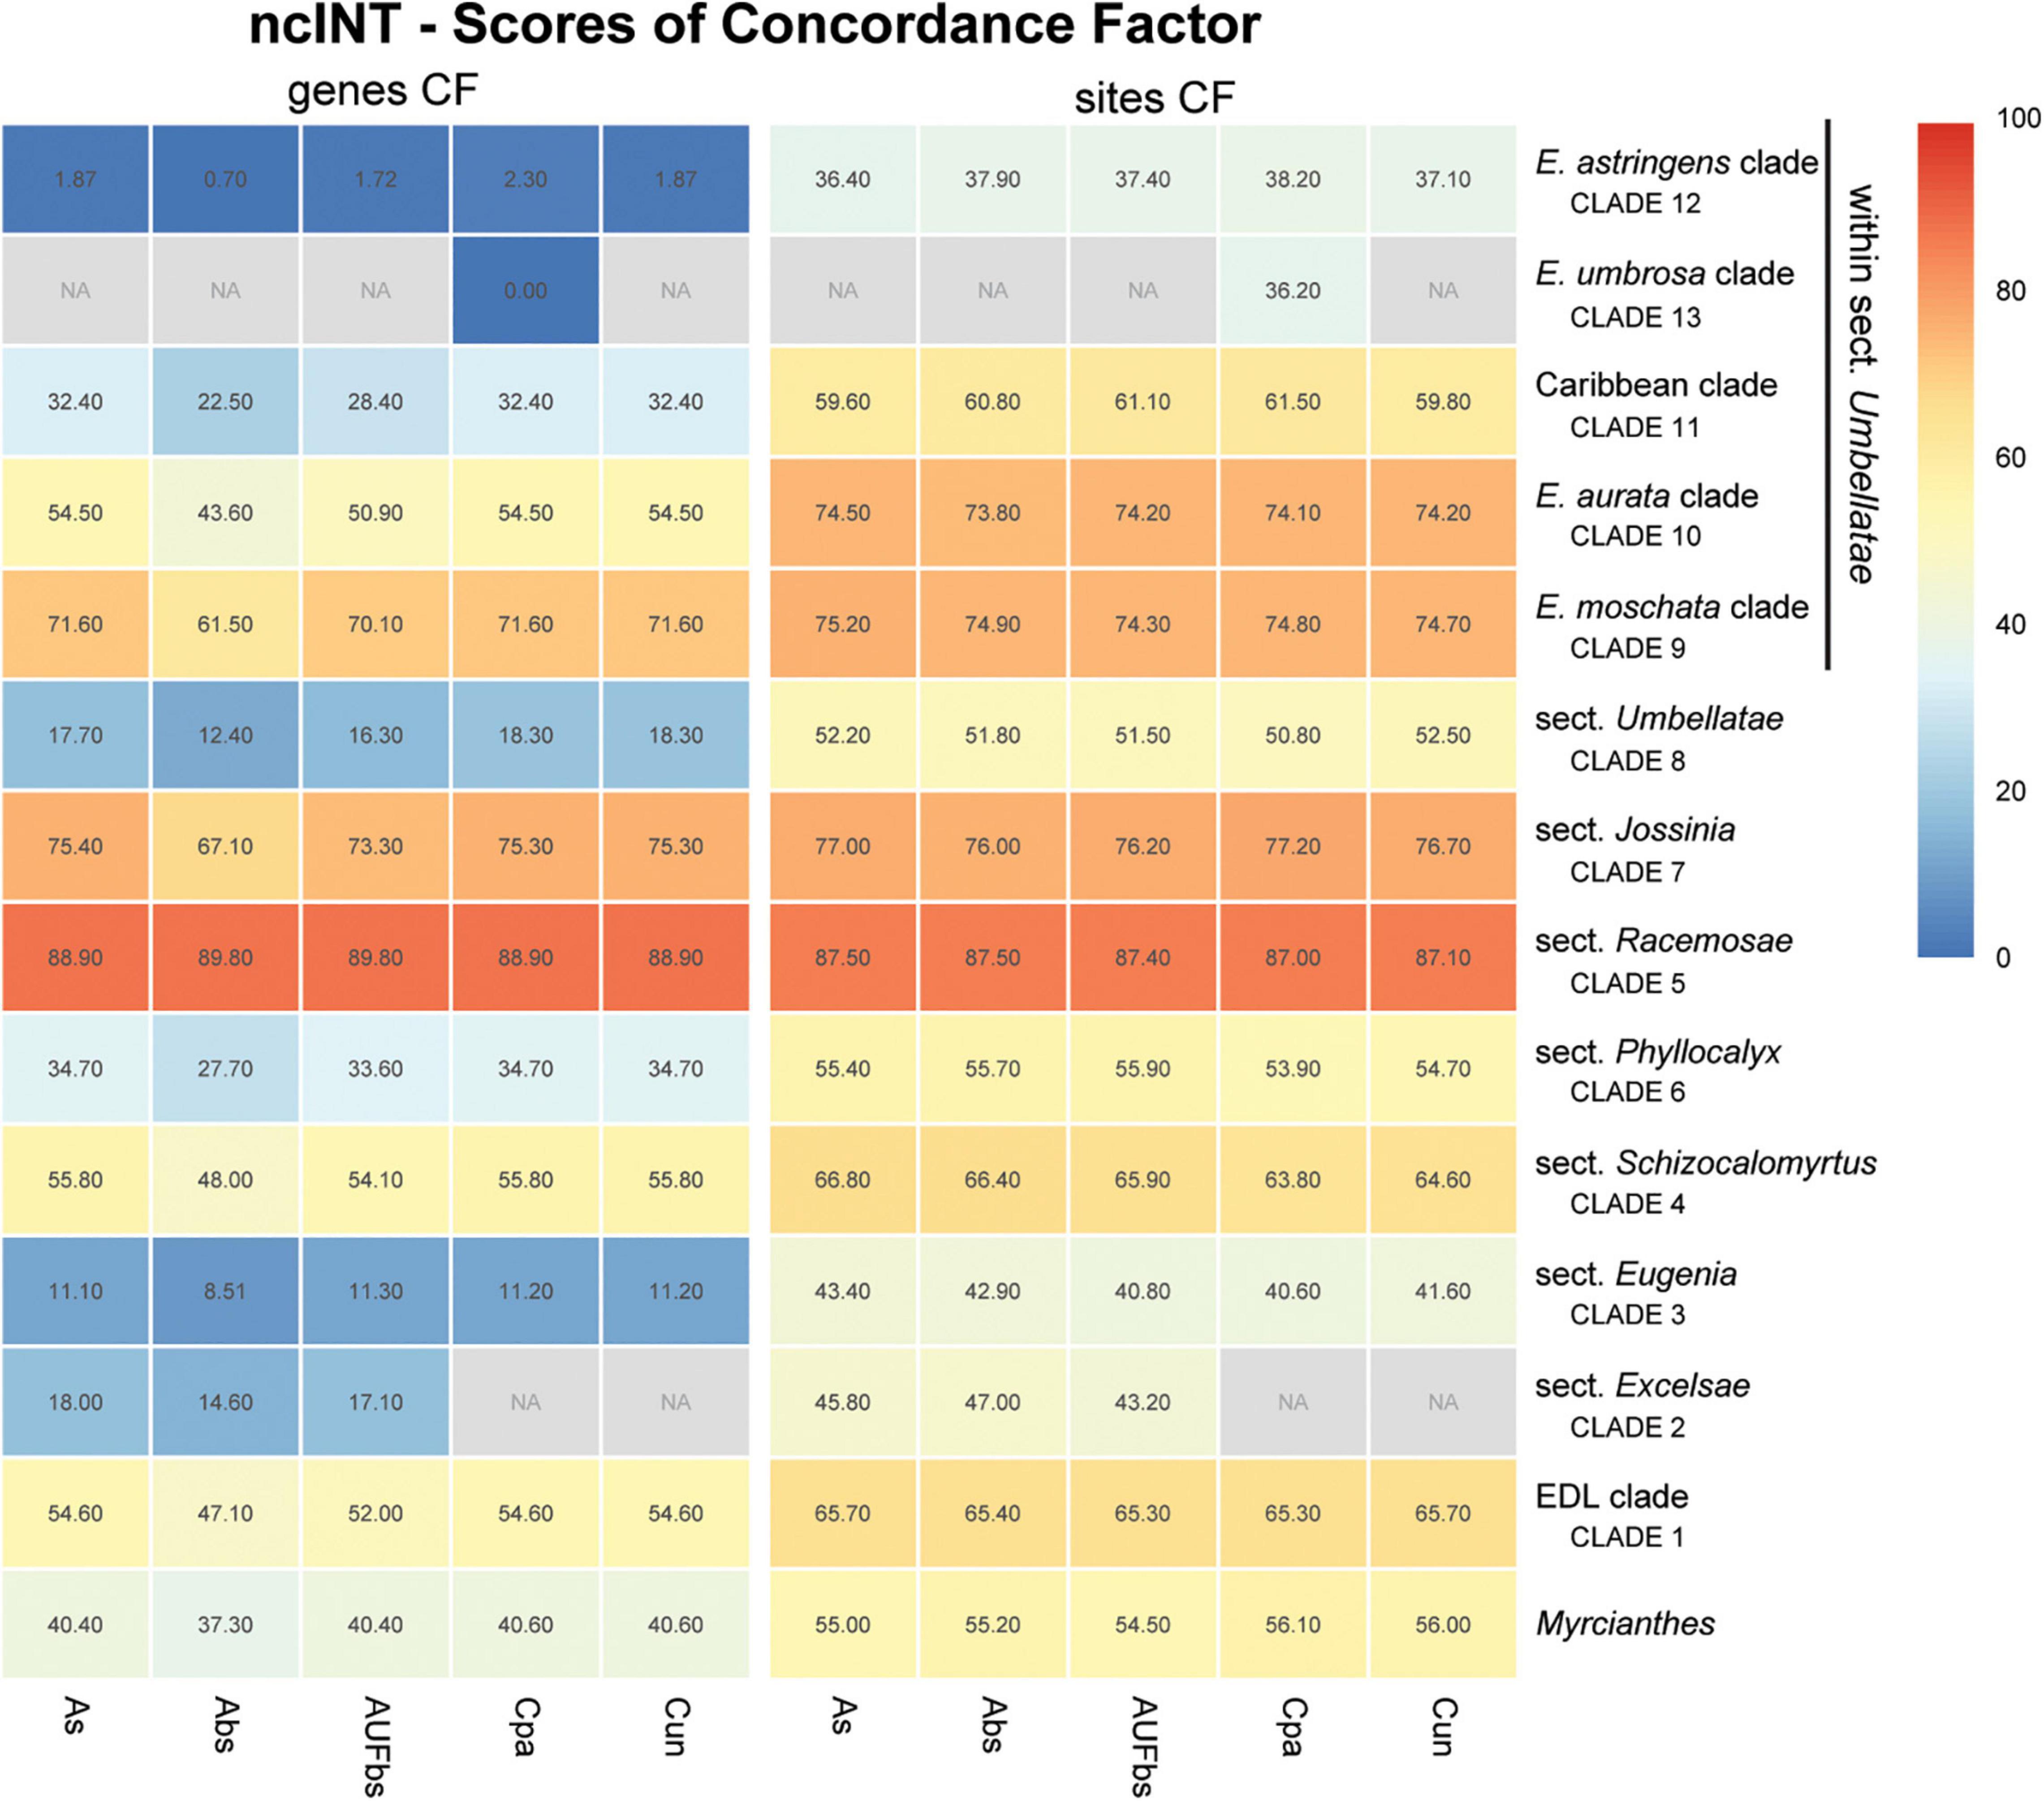
Figure 7. Heatmap of gene and site concordance factors (gCF and sCF) recovered in focus clades of the nuclear intronic non-coding loci (ncINT) in Eugenia. Each column is a method of phylogenetic reconstruction, and each row corresponds to a clade in Figures 2–4. Shading indicates percentage of concordance factor values recovered (Cpa, concatenated and partitioned ML reconstruction; Cun, concatenated and unpartitioned ML reconstruction; As, coalescent Astral tree with local posterior probability support; Abs, coalescent-based Astral tree with 100 bootstrap replicates; AUFbs, coalescent Astral tree with 1,000 ultrafast bootstrap replicates; NA, node not recovered).
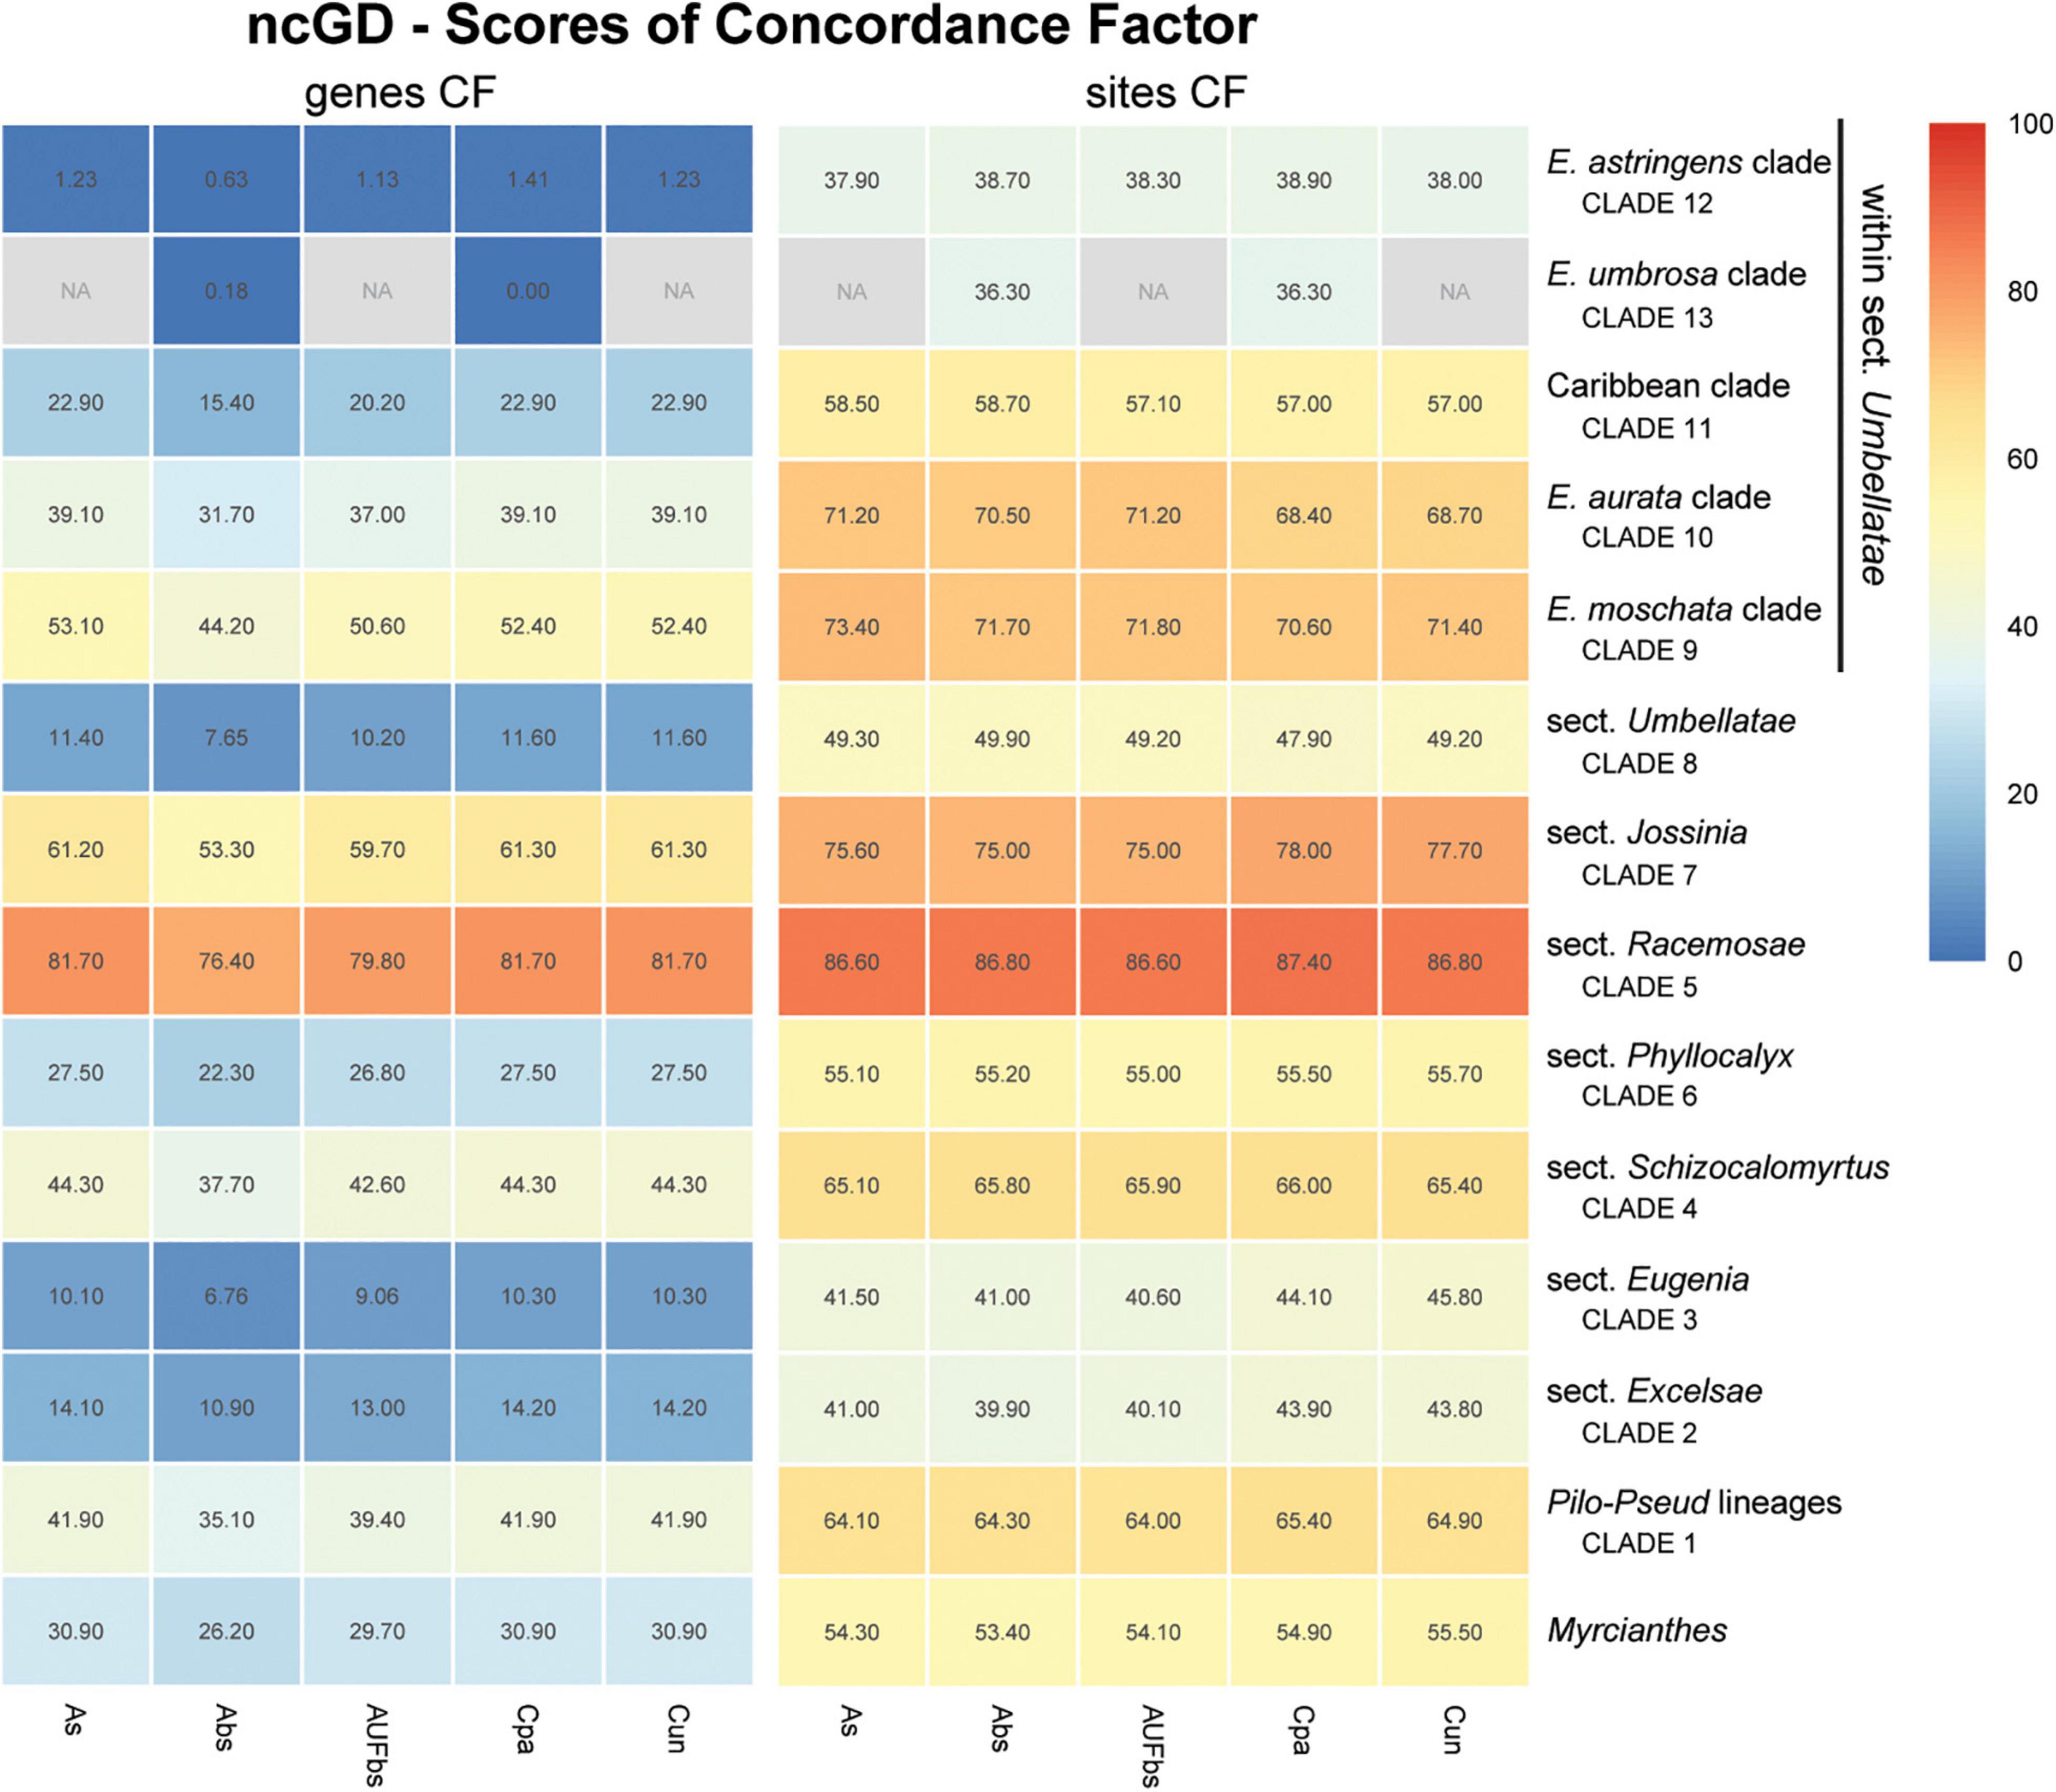
Figure 8. Heatmap of gene and site concordance factors (gCF and sCF) recovered in focus clades resulting from combination of nuclear coding and intronic non-coding loci in a genomic dataset (ncGD) of Eugenia. Each column is a method of phylogenetic reconstruction, and each row corresponds to a clade in Figures 2–4. Shading indicates percentage of concordance factor values recovered (Cpa, concatenated and partitioned ML reconstruction; Cun, concatenated and unpartitioned ML reconstruction; As, coalescent Astral tree with local posterior probability support; Abs, coalescent-based Astral tree with 100 bootstrap replicates; AUFbs, coalescent Astral tree with 1,000 ultrafast bootstrap replicates; NA, node not recovered).
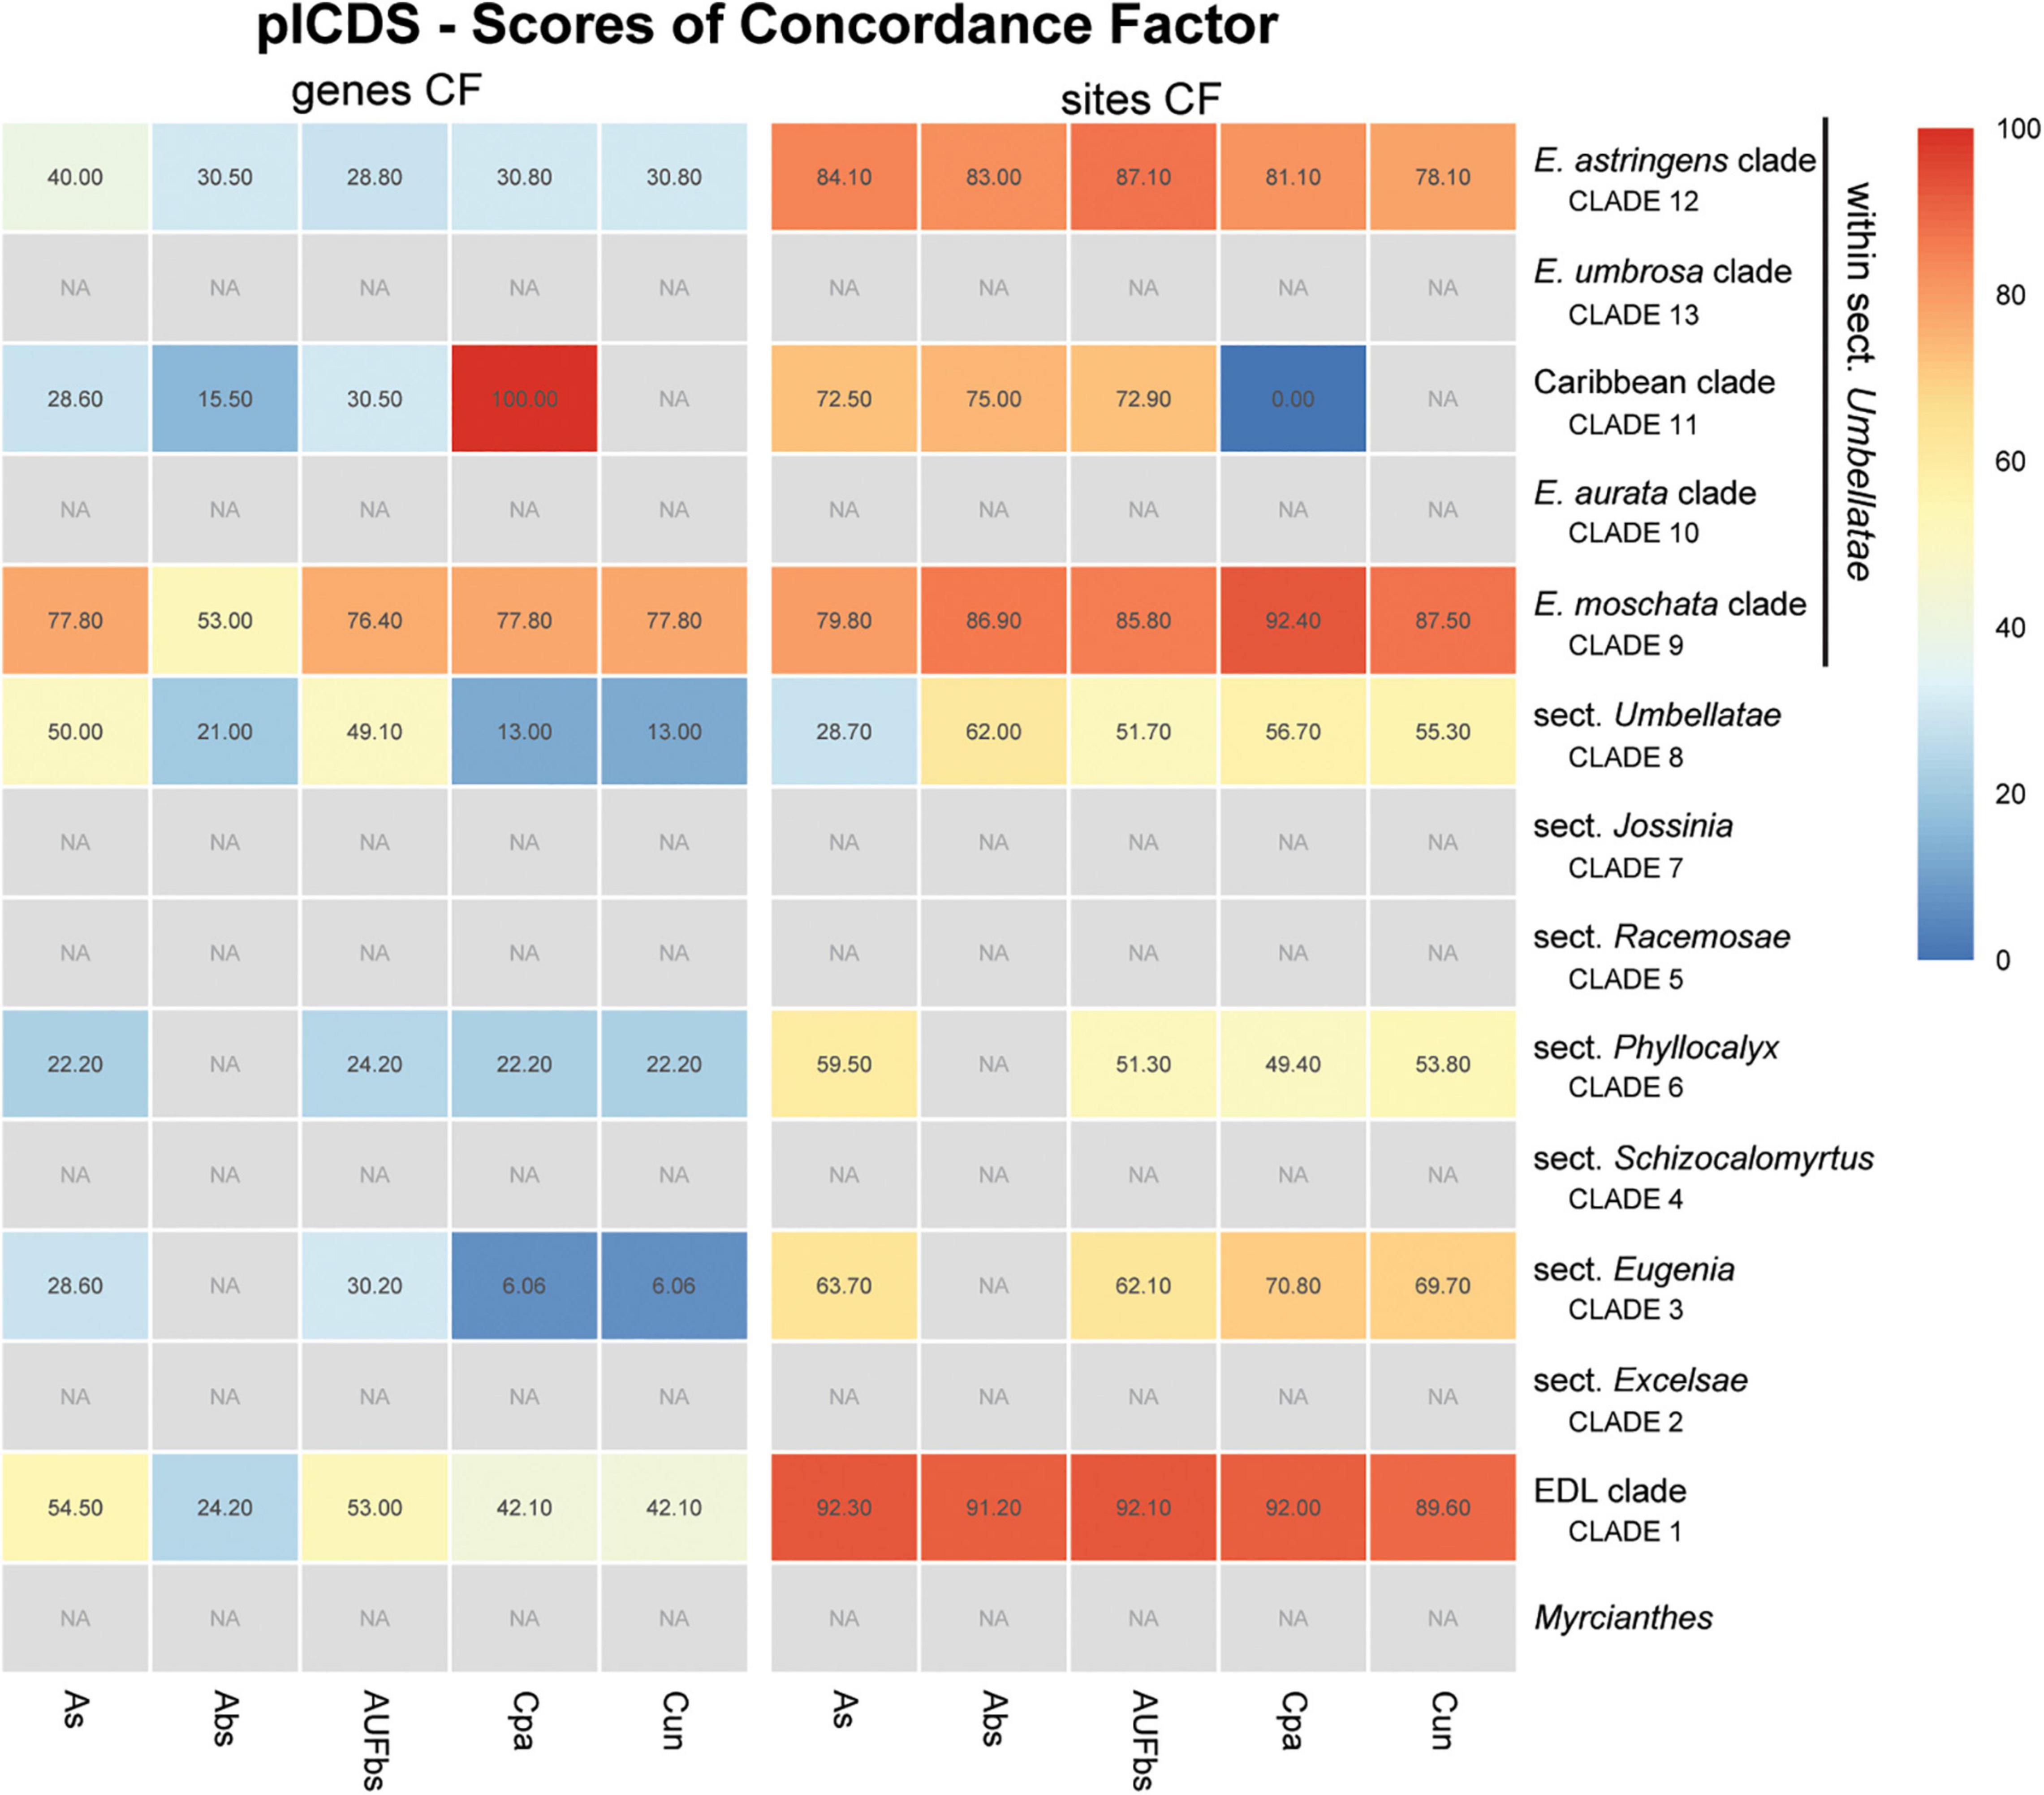
Figure 9. Heatmap of gene and site concordance factors (gCF and sCF) recovered in focus clades of the plastome coding loci (plCDS) in Eugenia. Each column is a method of phylogenetic reconstruction, and each row corresponds to a clade in Figures 2–4. Shading indicates percentage of concordance factor values recovered (Cpa, concatenated and partitioned ML reconstruction; Cun, concatenated and unpartitioned ML reconstruction; As, coalescent Astral tree with local posterior probability support; Abs, coalescent-based Astral tree with 100 bootstrap replicates; AUFbs, coalescent Astral tree with 1,000 ultrafast bootstrap replicates; NA, node not recovered).
The ncCDS dataset returns contrasting gCF scores (Figure 6) and a general pattern of higher sCF. High discordance among genes is expressed by low values (cold colors) of gCF recovered for all the clades considered. Eugenia sects. Racemosae and Jossinia are the most remarkable exceptions, with moderate gCF (39.5–76.1%) and higher sCF (71.9–85.3%). Deeper nodes within Umbellatae, informally referred to here as the “Eugenia aurata clade” (clade 10), Caribbean clade (clade 11), “E. astringens clade” (clade 12), and “E. umbrosa clade” (clade 13), have low gCF and sCF scores (<27% and 35.9–65.9%, respectively). Regarding the method used for species tree reconstruction seen along the bottom of the heatmap, scores are similar. The only exceptions with slightly lower performance scores are the gCF of the Astral tree using bootstrap replicates (Abs), and in the sCF recovered with Astral with UFbs replicates (AUFbs). The ncINT dataset displays similar gCF and sCF scores for the “Pilo-Pseud lineages” (47.1–54.6% and 65.3–65.7%), Eugenia sect. Schizocalomyrtus (48–55.8 and 63.8–66.8%), sect. Racemosae (88.9–89.8 and 87–87.5%), sect. Jossinia (67.1–75.3 and 76–77.2%), “Eugenia moschata clade” (clade 9) (61.5–71.6 and 74.3–75.2%), and “Eugenia aurata clade” (clade 10) (43.6–54.5 and 73.8–74.5%) (Figure 7). Discordance among genes is mainly concentrated in Eugenia sects. Eugenia, Excelsae, and Umbellatae, especially in the deepest clades within the latter. Method of tree reconstruction has a minor influence on CF scores except in the concatenated trees (Cpa and Cun) that do not recover Eugenia sect. Excelsae. The ncGD dataset shows similar patterns of CF scores to those recovered from the ncCDS and ncINT datasets, but with intermediate scores as a result of the combination of both nuclear datasets (Figure 8). The off-target plCDS dataset recovered topologies lacking several clades (see NA in Figure 9) when contrasted with the nuclear datasets, recovering only Eugenia sects. Eugenia, Phyllocalyx, Umbellatae, and the “Pilo-Pseud lineages.” Clades within Eugenia sect. Umbellatae, such as the “E. moschata clade” (clade 9) (gCF 53–77.8% and sCF 79.8–92.4%), “Caribbean clade” (clade 11) (15.5–100 and 0–75%) and “E. astringens clade” (clade 12) (28.8–40 and 78.1–87.1%) mostly displayed moderate gCF scores. The “Caribbean clade” of the concatenated partitioned tree scored a maximum gCF (100%) and none following sCF (0%). Concatenated matrices appear more sensitive to reconstruction methods that performed less well.
Discussion
The high quality of the data is the result of successful capture and sequencing of exon and intron contigs from the nuclear genome, providing phylogenetic reconstruction at the infrageneric level of Eugenia for the first time. This contrasts with previous phylogenetic reconstructions based on relatively few molecular markers, usually heavily reliant on mostly congruent plastid regions (Mazine et al., 2014, 2018; Bünger et al., 2016a; Giaretta et al., 2019b). However, some sections of Eugenia remain poorly resolved or received low support in these previous topologies, a consequence of insufficient polymorphism to overcome incongruent signal likely caused by incomplete lineage sorting (ILS) (Degnan and Rosenberg, 2009). The correlation of increased number of PIS with alignment length, particularly evident in the ncINT dataset, indicates that flanked introns concentrate valuable variability, now incorporated in the phylogenetic reconstructions. In addition, the plCDS data, by-product of the nuclear enrichment (e.g., Crowl et al., 2017; Villaverde et al., 2018) also provided a signal that is informative at several taxonomic levels, allowing recovery of additional and congruent phylogenetic relationships.
Nuclear Versus Plastid Phylogenetic Reconstructions
Despite the data from the plastid genome only accounting for c. 3.5% of the total mapped reads and providing low levels of PIS relative to the nuclear dataset (Supplementary Figure 2), exons retrieved were sufficient to recover seven of the 14 focus clades in agreement with the nuclear dataset in most reconstructions (Figure 9). Intergenic regions of the off-target plastid genome have been shown to be of limited use to increase resolution compared to datasets based on exons (e.g., Villaverde et al., 2018; Murphy et al., 2020). In those studies, intron-flanking regions provided scattered sequences and ambiguous alignments providing low phylogenetic signal, findings that corroborate the decision not to include these data here. Discordance between the phylogenetic reconstruction of the plCDS dataset and published plastid-rich Sanger sequence-based phylogenies highlights the role of nuclear data in the resulting topologies (e.g., Mazine et al., 2014; Bünger et al., 2016a; Mazine et al., 2018; Giaretta et al., 2019b). In this study, conflicting signal between nuclear and plastid datasets is evident from both topology test (Table 3) and tree landscape (Figure 5) assessment. These diverging results can be partially explained by different genome evolutionary rates (Drouin et al., 2008; Smith, 2015), as nuclear genes with higher substitution rates accumulate more variation expressed as greater phylogenetic signal and resolution. This is particularly relevant for lineages such as Eugenia, in particular sect. Umbellatae that diverged relatively recently in the history of angiosperms, c. 27 mya (Vasconcelos et al., 2017).
Inclusion of Intron and Intergenic Spacers
Concatenation of all loci is a common method for phylogenetic inference, but its use has been controversial because of statistical inconsistency (see Edwards, 2008; Roch and Steel, 2015). More recently, multispecies coalescent (MSC) methods (Mirarab et al., 2014; Mirarab and Warnow, 2015; Zhang et al., 2017) have been shown, using simulations, to yield more accurate species trees than concatenation methods under scenarios of ILS (Kubatko and Degnan, 2007; Mendes and Hahn, 2017). The “supergene” assumption of concatenation assumes a single species tree and ignores loci with different evolutionary histories resulting from gene duplication, horizontal gene transfer, lineage sorting, or even systematic error of overwhelming non-phylogenetic signal, leading to strong support for a potentially incorrect species tree (Jeffroy et al., 2006; Degnan and Rosenberg, 2009). Conflicts between the MSC approach and concatenation tree topologies are highlighted in the topology test that compares a fixed tree from the concatenated full partition scheme based on ncCDS with all the other 19 topologies. The more sensitive AU test shows that topologies based on ncCDS reconstructed using the MSC model were significantly different from the concatenated trees (Table 3). Concatenated and coalescent-based trees were different regardless of the nuclear dataset used. Although RF topology distribution clustered the trees according to the nuclear and plastid datasets (Figures 5A,B), the KC analysis better identified further segregation in the nuclear dataset that exclusively grouped Astral trees based on the ncINT and ncGD datasets (squares in Figures 5C,D). In particular, coalescence-based trees better accommodate the incongruence found in ncINT likely because of higher levels of PIS, while concatenated trees recover more conservative topologies, as they have a narrow distribution in the landscape. This suggests that the consistent phylogenetic relationships often identified in previous studies based on Sanger sequencing may be biased with the use of concatenated datasets (Mazine et al., 2014; Bünger et al., 2016a; Mazine et al., 2018; Giaretta et al., 2019b).
The Astral tree without replicates, based on both nuclear exons and introns in ncGD, exhibited intermediate dispersal within the distribution of all the Astral trees (Figure 5). This indicates that Astral successfully accommodates the weight of the high level of PIS in ncINT. Conversely, concatenated trees based on ncGD and ncINT clustered together, indicating limitations in this method to balance intron dominance in the topology. Concatenation method simulations (Song et al., 2012; Gatesy and Springer, 2013; Wu et al., 2013) suggest that these methods perform less well than coalescent based methods, or are more likely to produce inaccurate inferences with high support (e.g., Kubatko and Degnan, 2007; Degnan and Rosenberg, 2009; Heled and Drummond, 2010; Leaché and Rannala, 2011). The latter pattern appears to apply here, where phylogenies based on concatenated datasets show high support at nearly all nodes (Figures 2–4). However, congruence between concatenation and MSC tree topologies is remarkable, particularly at backbone nodes. This suggests a strong data signal in the history of Eugenia that promotes congruence. Differences in the topologies of concatenation and MSC approaches mostly result from the diverging phylogenetic position of Eugenia sects. Jossinia, Phyllocalyx, and Racemosae, and toward tips where most variation is expected. Additionally, short branches can be a source of poor performance in concatenated methods (Kubatko and Degnan, 2007; Salichos and Rokas, 2013). In Eugenia, short branches commonly subtend lineages sister to species-rich clades that comprise most of the extant diversity of the genus.
Concatenated Versus Coalescent Analyses
Topologies produced from the ncCDS, ncINT, and ncGD datasets are similar except for minor differences in relationships of the focus clades (Figures 2–4). Moderate to weak support values are common at the backbone of Astral reconstructions, while strong support is more frequent in the concatenated trees. A possible explanation for these patterns may lie in the bootstrap statistic that depends on branch sampling variance, often low in large datasets (Felsenstein, 1985). As a result, high bootstrap values may result from resampling datasets that return the same topologies despite ILS or other processes of genealogical discordance (Minh et al., 2020), rather than from a genuinely strong phylogenetic signal. Alternatively, gene and site concordance factors (gCF and sCF) are expressed in percentages (Minh et al., 2020), and are used in conjunction with measures of statistical support to better recognize variation and sources of incongruence in the phylogenetic reconstructions. Values of statistical support can differ widely from the concordance factor. For instance, the deepest node of Eugenia in the ncCDS Astral tree is strongly supported (local pp:1), with a gCF of 37.4% and an sCF of 65.4%. This means that 114 loci of the 306 single locus trees recovered Eugenia splendens as sister to other Eugenia species (see Supplementary Figure 3.1), and that 65.4% of the informative sites for this branch support this arrangement. The relatively low gCF in comparison to sCF suggests that other stochastic processes besides conflicting signal are involved. This occurs frequently along the backbone of Eugenia where a general pattern of higher sCF versus gCF (Figure 8) indicates other sources of conflicting signal such as rapid radiation and recent divergence.
Concordance factors of ncINT (Figure 7) were shown to be substantially higher than those of the ncCDS (Figure 6), suggesting that combining these datasets in ncGD would improve phylogenetic reconstruction. Analysis of the heatmap based on ncGD shows that the degree of concordance increased in the focus clades in contrast to ncCDS (Figure 8). However, incorporation of ncINT, with high levels of PIS, in fact, had little impact on the resulting topologies, with support values decreasing in the coalescent based trees. The source of this genealogical disparity is likely related to highly variable intron regions where the phylogenetic signal may be better suited to resolve relationships at shallow phylogenetic levels (Weitemier et al., 2014; Johnson et al., 2016). Despite that, most focus clades are recovered in the phylogenies as result of a recurrent phylogenetic signal observed in loci of both the ncCDS and ncINT datasets.
Eugenia subg. Eugenia is shown to be monophyletic and strongly supported in the ncCDS and ncGD datasets (Figures 2, 4) and moderately supported in ncINT (Figure 3). However, Eugenia subg. Pseudeugenia was recovered only in the ML based on ncCDS but with low support (<0.75) (Figure 2). Short divergence times resulting in short branches (Pamilo and Nei, 1988; Salichos and Rokas, 2013) appear to be associated with low support at early diverging nodes, as also found in phylogenies recovered using Sanger sequence data (Mazine et al., 2014; Bünger et al., 2016a; Giaretta et al., 2019b). Eugenia splendens was repeatedly recovered as sister to all other Eugenia, while E. dysenterica was recovered as sister to E. subg. Eugenia in many reconstructions. This suggests that Eugenia subg. Pseudeugenia may not be monophyletic as currently circumscribed, consisting of two or more independent lineages. Additional evidence based on a large sample size will be necessary to confirm these patterns.
Eugenia sect. Excelsae, recently formally recognized by Mazine et al. (2018), was placed as sister to sect. Schizocalomyrtus (Mazine et al., 2014) in Sanger sequencing phylogenies, but with low support (Mazine et al., 2018; Giaretta et al., 2019b; Flickinger et al., 2020). The reconstructions presented here based on exons (ncCDS) recover sect. Excelsae as sister to sect. Eugenia (Figure 2) with moderate to weak support due to low levels of genealogical concordance (gCF = 0.5–1.88%). Two strongly supported clades emerge in Eugenia sect. Eugenia, as found in previous reconstructions (Mazine et al., 2014), refuting previous suggestions that this section might not be monophyletic (Mazine et al., 2018; Giaretta et al., 2019b).
Eugenia sect. Schizocalomyrtus is strongly supported and sister to a large clade that includes sects. Jossinia, Racemosae, Phyllocalyx, Speciosae, and Umbellatae. This placement is supported by ncCDS and coalescent approaches of ncINT and ncGD (Figures 2–4). Concatenated ncINT and ncGD instead recovered Eugenia sect. Schizocalomyrtus that is sister to sect. Excelsae, an arrangement also found in previous phylogenies (Mazine et al., 2014; Giaretta et al., 2019b; Flickinger et al., 2020). Alternatively, Eugenia sect. Schizocalomyrtus had been recovered as sister to sect. Phyllocalyx (Mazine et al., 2018). The lack of consensus among Sanger sequence topologies reflects low branching support around the placement of Eugenia sect. Schizocalomyrtus. The low support recovered in the concatenated ncGD analysis (Figure 4) suggests again that reconstruction method in combination with genealogical incongruence results in placement uncertainty. High-throughput sequence methods, such as those used, here appear to have captured a phylogenetic signal previously obscured by genealogical discordance and found a more reliable placement for Eugenia sect. Schizocalomyrtus.
Eugenia sect. Jossinia, one of the few lineages of Myrteae with an extra-Neotropical distribution, has been previously recovered as sister to sect. Racemosae (Mazine et al., 2018). Although the monophyly of sect. Jossinia is supported by moderate levels of genealogical concordance in ncCDS and ncINT (Figures 6, 7), the uncertainty remains regarding its phylogenetic position. Topologies based on the ncINT dataset and MSC analysis are inconclusive because of high levels of polytomies recovered, while trees from the concatenated data recovered Eugenia sect. Jossinia that is sister to sect. Phyllocalyx. A similar arrangement was returned by the ncCDS coalescent based trees, while in the concatenated trees Eugenia sect. Jossinia was recovered as sister to sect. Speciosae + Umbellatae (van der Merwe et al., 2005; Mazine et al., 2018; Giaretta et al., 2019b; Supplementary Figures 3.4,3.5). The uncertainty surrounding the placement of Eugenia sect. Jossinia appears related to a genuine discordant phylogenetic signal, suggested by similar scores of gene and site CF of ncINT (67.1–75.4 and 76–77.2%), also influenced by other processes as evidenced by the discrepancy of CF scores in ncCDS (39.5–50.5 and 71.9–73.1%).
Eugenia sect. Phyllocalyx was traditionally recognized by the convenient character of expanded and showy sepals at anthesis (Berg, 1857). However, a further non-sister lineage bearing showy sepals was recognized by molecular reconstructions, triggering segregation of the section into the currently accepted sects. Phyllocalyx and Speciosae (Bünger et al., 2016a,b). The phylogenomic data support this arrangement, with Eugenia sect. Speciosae strongly supported as sister to sect. Umbellatae. Uncertainty remains regarding the relationships of Eugenia sect. Phyllocalyx, but most reconstructions support it as sister to a clade containing sect. Racemosae.
Eugenia sect. Racemosae was circumscribed based on inflorescence with long racemes (Berg, 1856) and was supported as monophyletic by the phylogenetic reconstructions of Mazine et al. (2014, 2018) as well as the results discussed here. A clade formed by Eugenia inversa and E. plicatocostata emerges as sister to Eugenia sect. Racemosae (e.g., Mazine et al., 2014; Mazine et al., 2018; Giaretta et al., 2019b), but the lineages were maintained taxonomically distinct because of the non-racemose inflorescence of Eugenia inversa, expressed in fasciculate short axes (Mazine et al., 2018). The segregation of Eugenia sect. Racemosae and the clade formed by Eugenia inversa and E. plicatocostata is supported by low levels of concordance factors in both ncCDS and ncINT (gCF = 8.1–26.7 and sCF = 46.8–50.7%); it is possible that the latter clade may represent an until now unrecognized section.
Systematic Relationships in Eugenia and Eugenia sect. Umbellatae
A lack of distinctive morphological patterns associated with clades and relationships with low statistical support have contributed to the “unmanageable” reputation of Eugenia sect. Umbellatae (Mazine et al., 2018). Those authors recovered seven clades within Eugenia sect. Umbellatae, also resolved here, along with five further clades of potential taxonomic significance (Figures 6–9). Target capture sequencing recovers a clade containing Eugenia punicifolia and E. lagoensis sister to the remaining species of Eugenia sect. Umbellatae in most coalescent-based reconstructions except for the concatenated trees. The results also suggest that Eugenia melanogyna is sister to the other species of Eugenia sect. Umbellatae as recovered in the ML trees (Mazine et al., 2018; Giaretta et al., 2019b). The “E. moschata clade” (clade 9) has been previously recovered (Mazine et al., 2018; Giaretta et al., 2019b) and, here, is statistically supported with mostly moderate gCF (ncCDS = 26.7–65.4% and ncINT = 61.5–75.2% and plCDS = 53–92.4%). Species of this clade are generally found in Amazon lowland forest and are morphologically united by partially fused sepals with membranous tissue beneath the seam joining the sepals (“membranisepalous” in Giaretta et al., 2019b).
Caribbean species were recently the focus of a comprehensive phylogenetic analysis that formally included previously segregated genera Calyptrogenia and Hottea within Eugenia (Flickinger et al., 2020). High-throughput sequencing strongly supports the “Caribbean clade,” recovered as sister to species distributed mostly in the Amazon and Guiana Shield lowland forest. From a biogeographical perspective, this relationship is more realistic than previous reconstructions that suggest an Atlantic forest origin of Caribbean lineages (Mazine et al., 2018; Giaretta et al., 2019b). Deeper in Eugenia sect. Umbellatae, there are two larger clades: the “Eugenia astringens clade” (12) and the “Eugenia umbrosa clade” (13) (Figure 8). Previous clades D and E of Mazine et al. (2018) correspond to the strongly supported clades 12/1 and 12/2, respectively (Figures 2–4). Here, clade 12/1 is sister to clade 12/2, in contrast with the Bayesian inference of Mazine et al. (2018) that recovered no close relationship between clades D and E. Species of clade 12/1 share similar aspects of inflorescence, i.e., fascicles with a variable axis length that often continue to grow after flowering and assume an auxotelic arrangement (Briggs and Johnson, 1979). Species of clade 12/2 share a tendency for inflorescences in short and congested fascicles. Eugenia goiapabana and E. umbrosa have been previously associated with clade D but, here, are placed in clade 13. Mazine et al. (2018) noted that Eugenia goiapabana and E. umbrosa are morphologically distinct from species that are placed here in clade 12/1 by their thick and large leaves and yellowish fruits. The MSC trees recover Eugenia goiapabana and E. umbrosa more closely related to E. percincta, also with large and thick leaves. The four lineages within clade 13 are well-supported, but relationships are uncertain because of phylogenetic discordance among them, hampering resolution in the concatenated and coalescent-based trees.
Conclusion
The universal Angiosperm-353 target kit was successful in resolving relationships and disentangling genealogical incongruence in Eugenia, a fast-evolving and taxonomically complex lineage. Infrageneric groups previously recovered by Sanger sequencing were strongly supported by the species trees and gCF, but some questions remain where branches are shortest, especially in the early diverging lineages and deep within Eugenia sect. Umbellatae, where conflicting gene topologies prevent a strong phylogenetic signal. It is stressed here that high statistical support does not mean an overwhelming concordant signal and should be interpreted carefully especially in concatenated datasets. The general pattern of higher sCF than gCF in the backbone of Eugenia suggests stochastic processes. The analysis presented here does not support Eugenia subg. Pseudeugenia as currently circumscribed, or sect. Pilothecium. Further studies based on a wider taxonomic sample are necessary to determine if taxonomic change is required. Previous Sanger sequencing phylogenies all return short branches at the backbone of Eugenia sect. Umbellatae (Mazine et al., 2014; Giaretta et al., 2019b). In the context of splitting Eugenia sect. Umbellatae into workable clades, future studies should be focused on the source of the short branches responsible for severely misleading concatenated ML reconstructions (Kubatko and Degnan, 2007; Bryant and Hahn, 2020). Distance-based methods that generate phylogenetic networks could show where phylogenetic incongruence from ILS or admixture is present (Low et al. in prep.). Alternatively, statistical tests using internal branch lengths in tripled gene trees following MSC to distinguish between ILS and introgression (Edelman et al., 2019) are promising. Development of a specific bait kit for tribe Myrteae or Eugenia may also be useful to enhance resolution. Furthermore, we recommend additional targeted sequencing approaches with more species and individuals to enhance resolution. Targeted sequencing provides massive quantities of data that improve resolution, but uncertainty remains, likely because severe ILS at the deepest nodes of sect. Umbellatae, and pursuit of workable groups within sect. Umbellatae goes beyond increasing available data. Reconstruction methods must be carefully considered, as they influence topology significantly. The plastid genome is consistently better represented in Sanger sequencing reconstructions in Eugenia, and there is a significant difference among phylogenetic reconstructions based on the nuclear and plastid genomes. The analyses presented here rely heavily on the nuclear dataset that, on the whole, recovered topologies congruent with the “Sanger plastid trees” of the past, indicating that the phylogenetic signal in Eugenia is strongly expressed by both genomes. The off-target plastid dataset recovered here was inferior in terms of PIS in comparison to the targeted sequences. Despite this, some plastid-reconstructed clades were congruent with the exon topologies. This reinforces the importance of embracing as much data as possible and conducting exploratory analyses. Combining tree landscape with concordance factor scores, as that used here, is a robust and comprehensive approach that incorporates several reconstruction hypotheses. We suggest that this approach will inspire and enable more studies to perform targeted sequencing to investigate the evolutionary history of Myrtaceae.
Data Availability Statement
The datasets generated for this study can be found at https://www.ncbi.nlm.nih.gov/bioproject/PRJNA797102.
Author Contributions
AG, EL, and OM conceived the study. AG, BM, and OM performed lab work and phylogenomic analyses. AG and EL wrote the manuscript. All authors have edited and contributed to the writing and reviewed the manuscript.
Funding
AG was supported by the National Council for Scientific and Technological Development (CNPq Postdoc grant to AG - process 155480/2018-9). The phylogenomic laboratory work at Kew was funded by the Bentham-Moxon Trust from the Royal Botanic Gardens Kew and a Graduate Student Research Grant provided by the American Society of Plant Taxonomists (ASPT). FM was thankful to CNPq for the research grant 302309/2018-7.
Conflict of Interest
The authors declare that the research was conducted in the absence of any commercial or financial relationships that could be construed as a potential conflict of interest.
Publisher’s Note
All claims expressed in this article are solely those of the authors and do not necessarily represent those of their affiliated organizations, or those of the publisher, the editors and the reviewers. Any product that may be evaluated in this article, or claim that may be made by its manufacturer, is not guaranteed or endorsed by the publisher.
Acknowledgments
We thank Sidonie Bellot for the assistance with questions related to the analyses presented here, and Deise Gonçalves for the important discussion on congruence analysis. We additionally thank Robyn Cowan, Laszlo Csiba, and Niroshini Epitawalage for the technical assistance. The Laboratório de Sistemática Vegetal do Departamento de Botânica do IB-USP is also acknowledged for providing research support.
Supplementary Material
The Supplementary Material for this article can be found online at: https://www.frontiersin.org/articles/10.3389/fpls.2021.759460/full#supplementary-material
References
Amshoff, G. J. H. (1951). “Myrtaceae,” in Flora of Suriname, ed. A. Pulle (Utrecht: The Royal Institute for the Indies), 56–158.
Anisimova, M., Gil, M., Dufayard, J. F., Dessimoz, C., and Gascuel, O. (2011). Survey of branch support methods demonstrates accuracy, power, and robustness of fast likelihood-based approximation schemes. Syst. Biol. 60, 685–699. doi: 10.1093/sysbio/syr041
Baker, W. J., Bailey, P., Barber, V., Barker, A., Bellot, S., Bishop, D., et al. (2021). A comprehensive phylogenomic platform for exploring the Angiosperm Tree of Life. Syst. Biol. syab 35, 3–64. doi: 10.1093/sysbio/syab035
Berg, O. C. (1856). RevisioMyrtacearumhucusquecognitarum s. Klotzschii “Flora Americaeaequinoctialis” exhibensMyrtaceas. Linnaea 27, 129–384.
Berg, O. C. (1857). “Myrtaceae,” in Flora Brasiliensis, vol. 14, par. 1, ed. K. F. P. Martius (Monachii: Frid. Fleischer), 1–528.
Bolger, A. M., Lohse, M., and Usadel, B. (2014). Genome analysis Trimmomatic: a flexible trimmer for Illumina sequence data. Bioinformatics 30, 2114–2120. doi: 10.1093/bioinformatics/btu170
Borowiec, M. L. (2016). AMAS: A fast tool for alignment manipulation and computing of summary statistics. PeerJ 4:1660, 1–10. doi: 10.7717/peerj.1660
Briggs, B. G., and Johnson, L. A. S. (1979). Evolution in the Myrtaceae - Evidence from inflorescence structure. Proc. Linn. Soc. New South Wales 102, 157–256.
Bryant, D., and Hahn, M. W. (2020). “The concatenation question,” in Phylogenetics in the Genomic Era, eds C. Scornavacca, F. Delsuc, and N. Galtier. Lyon: HAL.
Bünger, M. O., Mazine, F. F., Forest, F., Bueno, M. L., Stehmann, J. R., and Lucas, E. J. (2016a). The evolutionary history of Eugenia sect. Phyllocalyx (Myrtaceae) corroborates historically stable areas in the southern Atlantic forests. Ann. Bot. 118, 1209–1223. doi: 10.1093/aob/mcw209
Bünger, M. O., Mazine, F. F., Lucas, E. J., and Stehmann, J. R. (2016b). Circumscription and synopsis of Eugenia section SpeciosaeBünger&Mazine (Myrtaceae). PhytoKeys 61, 73–80. doi: 10.3897/phytokeys.61.7904
Candolle, A. P. (1828). “Myrtaceae,” in Prodromussystematisnaturalis regni vegetabilis, vol. v.3, ed. A. P. de Candolle (Paris: Treutel and Würtz), 207–296.
Capella-Gutiérrez, S., Silla-martinez, J. M., and Gabaldon, T. (2009). trimAl: a tool for automated alignment trimming in large-scale phylogenetic analyses. Bioinformatics 25, 1972–1973. doi: 10.1093/bioinformatics/btp348
Crowl, A. A., Myers, C., and Cellinese, N. (2017). Embracing discordance: Phylogenomic analyses provide evidence for allopolyploidy leading to cryptic diversity in a Mediterranean Campanula (Campanulaceae) clade. Evolution 71, 913–922. doi: 10.1111/evo.13203
Cruz, F., Turchetto-Zolet, A. C., Veto, N., Mondin, C. A., Sobral, M., Almerao, M., et al. (2013). Phylogenetic analysis of the genus Hexachlamys (Myrtaceae) based on plastid and nuclear DNA sequences and their taxonomic implications. Bot. J. Linn. Soc. 172, 532–543. doi: 10.1111/boj.12036
Degnan, J. H., and Rosenberg, N. A. (2009). Gene tree discordance, phylogenetic inference and the multispecies coalescent. Trends Ecol. Evol. 24, 332–340. doi: 10.1016/j.tree.2009.01.009
Drouin, G., Daoud, H., and Xia, J. (2008). Molecular phylogenetics and evolution relative rates of synonymous substitutions in the mitochondrial, chloroplast and nuclear genomes of seed plants. Mol. Phylogenet. Evol. 49, 137–141. doi: 10.1016/j.ympev.2008.09.009
Duchêne, D. A., Tong, K. J., Foster, C. S. P., Duchêne, S., and Ho, S. Y. W. (2019). Linking branch lengths across sets of loci provides the highest statistical support for phylogenetic inference. Mol. Biol. Evol. 37, 1202–1210.
Edelman, N. B., Frandsen, P. B., Miyagi, M., Clavijo, B., Davey, J., Dikow, R. B., et al. (2019). Genomic architecture and introgression shape a butterfly radiation. Science 366, 594–599. doi: 10.1126/science.aaw2090
Edwards, S. V. (2008). Is a new and general theory of molecular systematics emerging? Evolution.63, 1–19. doi: 10.1111/j.1558-5646.2008.00549.x
Eguiluz, M., Yuyama, P. M., Guzman, F., Rodrigues, N. F., and Margis, R. (2017). Complete sequence and comparative analysis of the chloroplast genome of Plinia trunciflora. Genet. Mol. Biol. 40, 871–876. doi: 10.1590/1678-4685-gmb-2017-0096
Felsenstein, J. (1985). Confidence limits on phylogenies: an approach using the bootstrap. Evolution 39, 783–791.
Flickinger, J. A., Jestrow, B., Prieto, R. O., Santiago-Valentín, E., Sustache-Sustache, J., Jiménez-Rodríguez et al. (2020). A phylogenetic survey of Myrtaceae in the Greater Antilles with nomenclatural changes for some endemic species. Taxon 69, 448–480. doi: 10.1002/tax.12263
Gatesy, J., and Springer, M. S. (2013). Concatenation versus coalescence versus “concatalescence”. PNAS 110:E1179. doi: 10.1073/pnas.1221121110
Giaretta, A., Amorim, B. S., Sano, P. T., Souza, G., and Lucas, E. (2019a). Phylogenetic placement of new species with fused calyx reveals homoplastic character in Eugenia (Myrtaceae). Syst. Bot. 44, 66–73. doi: 10.1600/036364419X697903
Giaretta, A., Vasconcelos, T. N. C., Mazine, F. F., Faria, J. E. Q., Flores, R., Holst, B., et al. (2019b). Calyx (con)fusion in a hyper-diverse genus: Parallel evolution of unusual flower patterns in Eugenia (Myrtaceae). Mol. Phylogenet. Evol. 139:106553. doi: 10.1016/j.ympev.2019.106553
Gonçalves, D. J. P., Simpson, B. B., Ortiz, E. M., Shimizu, G. H., and Jansen, R. K. (2019). Incongruence between gene trees and species trees and phylogenetic signal variation in plastid genes. Mol. Phylogenet. Evol. 138, 219–232. doi: 10.1016/j.ympev.2019.05.022
Guindon, S., Dufayard, J. F., Lefort, V., Anisimova, M., Hordijk, W., and Gascuel, O. (2010). New algorithms and methods to estimate maximum-likelihood phylogenies: Assessing the performance of PhyML 3.0. Syst. Biol 59, 307–321. doi: 10.1093/sysbio/syq010
Heled, J., and Drummond, A. J. (2010). Bayesian inference of species trees from multilocus data. Mol. Biol. Evol. 27, 570–580. doi: 10.1093/molbev/msp274
Hoang, D. T., Chernomor, O., von Haeseler, A., Minh, B. Q., and Vinh, L. S. (2018). UFBoot2: improving the ultrafast bootstrap approximation. Mol. Biol. Evol. 35, 518–522. doi: 10.5281/zenodo.854445
Jeffroy, O., Brinkmann, H., Delsuc, F., and Philippe, H. (2006). Phylogenomics: the beginning of incongruence? Trends Genet. 22, 225–231. doi: 10.1016/j.tig.2006.02.003
Johnson, M. G., Gardner, E. M., Liu, Y., Medina, R., Goffinet, B., Shaw, A. J., et al. (2016). HybPiper: Extracting coding sequence and introns for phylogenetics from high-throughput sequencing reads using target enrichment. Appl. Plant Sci. 4:1600016. doi: 10.3732/apps.1600016
Johnson, M. G., Pokorny, L., Dodsworth, S., Botigue, L. R., Cowan, R. S., Devault, A., et al. (2019). A universal probe set for targeted sequencing of 353 nuclear genes from any flowering plant designed using k-medoids clustering. Syst. Biol. 68, 594–606.
Jombart, T., Kendall, M., Almagro-Garcia, J., and Colijn, C. (2017). treespace: Statistical exploration of landscapes of phylogenetic trees. Mol. Ecol. Resour. 17, 1385–1392. doi: 10.1111/1755-0998.12676
Kalyaanamoorthy, S., Minh, B. Q., Wong, T. K. F., Haeseler, A., and Von Jermiin, L. S. (2017). ModelFinder: fast model selection for accurate phylogenetic estimates. Nat. Methods 14, 587–589. doi: 10.1038/nmeth.4285
Kendall, M., and Colijn, C. (2016). Mapping phylogenetic trees to reveal distinct patterns of evolution. Mol. Biol. Evol. 33, 2735–2743. doi: 10.1093/molbev/msw124
Kubatko, L. S., and Degnan, J. H. (2007). Inconsistency of phylogenetic estimates from concatenated data under coalescence. Syst. Biol. 56, 17–24. doi: 10.1080/10635150601146041
Landrum, L. R., and Kawasaki, M. L. (1997). The genera of Myrtaceae in Brazil: An illustrated synoptic treatment and identification keys. Brittonia 49, 508–536. doi: 10.2307/2807742
Lanfear, R. (2018). Calculating and Interpreting Gene- and Site-Concordance Factors in Phylogenomics. Molecular Evolution and Phylogenetics Blog. Available online at: http://www.robertlanfear.com/blog/files/concordance_factors.html (accessed October 14, 2021)
Leaché, A. D., and Rannala, B. (2011). The accuracy of species tree estimation under simulation: a comparison of methods. Syst. Biol. 60, 126–137. doi: 10.1093/sysbio/syq073
Lucas, E. J., and Bünger, M. O. (2015). Myrtaceae in the Atlantic forest: their role as a ‘model’ group. Biodivers. Conserv. 24, 2165–2180. doi: 10.1007/s10531-015-0992-7
Maurin, O., Anest, A., Bellot, S., Biffin, E., Brewer, G., CharlesDominique, T., et al. (2021). A nuclear phylogenomic study of the angiosperm order Myrtales, exploring the potential and limitations of the universal Angiosperms353 probe set. Am. J. Bot. 108, 1087–1111. doi: 10.1002/ajb2.1699
Mazine, F. F., Bünger, M. O., Faria, J. E. Q., Lucas, E., and Souza, V. C. (2016). Sections in Eugenia (Myrteae, Myrtaceae): nomenclatural notes and a key. Phytotaxa 289, 225–236.
Mazine, F. F., Eustáquio, J., Faria, Q., Giaretta, A., Vasconcelos, T., Forest, F., et al. (2018). Phylogeny and biogeography of the hyper-diverse genus Eugenia (Myrtaceae: Myrteae), with emphasis on E. sect. Umbellatae, the most unmanageable clade. Taxon 67, 752–769. doi: 10.12705/674.5
Mazine, F. F., Souza, V. C., Sobral, M., Forest, F., and Lucas, E. (2014). A preliminary phylogenetic analysis of Eugenia (Myrtaceae: Myrteae), with a focus on Neotropical species. Kew Bull. 69:9497. doi: 10.1007/s12225-014-9497-x
McVaugh, R. (1956). Tropical American Myrtaceae: Notes on generic concepts and descriptions of previously unrecognized species. Fieldiana Bot. 29, 145–228.
Mendes, F. K., and Hahn, M. W. (2017). Why concatenation fails near the anomaly Zone. Syst. Biol. 67, 1–12. doi: 10.1093/sysbio/syx063
Minh, B. Q., Hahn, M. W., and Lanfear, R. (2020). New methods to calculate concordance factors for phylogenomic datasets. Mol. Biol. Evol. 37, 2727–2733. doi: 10.1093/molbev/msaa106
Mirarab, S., Nguyen, N., Guo, S., Wang, L. S., Kim, J., and Warnow, T. (2015). PASTA: Ultra-large multiple sequence alignment for nucleotide and amino-acid sequences. J. Comput. Biol. 22, 377–386. doi: 10.1089/cmb.2014.0156
Mirarab, S., Reaz, R., Bayzid, S., Zimmermann, T., Swenson, M. S., and Warnow, T. (2014). ASTRAL: genome-scale coalescent-based species tree estimation. Bioinformatics 30, i541–i548. doi: 10.1093/bioinformatics/btu462
Mirarab, S., and Warnow, T. (2015). ASTRAL-II: Coalescent-based species tree estimation with many hundreds of taxa and thousands of genes. Bioinformatics 31, i44–i52. doi: 10.1093/bioinformatics/btv234
Murphy, B., Forest, F., Barraclough, T., Rosindell, J., Bellot, S., Cowan, R., et al. (2020). A phylogenetic analysis of Nepenthes (Nepenthaceae). Mol. Phylogenet. Evol. 144:106668. doi: 10.1016/j.ympev.2019.106668
Naser-Khdour, S., Minh, B. Q., Zhang, W., Stone, E. A., and Lanfear, R. (2019). The prevalence and impact of model violations in phylogenetic analysis. Genome Biol. Evol. 11, 3341–3352. doi: 10.1093/gbe/evz193
Nguyen, L. T., Schmidt, H. A., Von Haeseler, A., and Minh, B. Q. (2015). IQ-TREE: A fast and effective stochastic algorithm for estimating maximum-likelihood phylogenies. Mol. Biol. Evol. 32, 268–274. doi: 10.1093/molbev/msu300
Oliveira-Filho, A. T., and Fontes, M. A. L. (2000). Patterns of floristic differentiation among Atlantic forests in Southeastern Brazil and the influence of climate. Biotropica 32, 793–810. doi: 10.1111/j.1744-7429.2000.tb00619.x
Pamilo, P., and Nei, M. (1988). Relationship between gene trees and species trees. Mol. Biol. Evol. 5, 568–583. doi: 10.1093/oxfordjournals.molbev.a040517
Paradis, E., Claude, J., and Strimmer, K. (2004). APE: Analyses of phylogenetics and evolution in R language. Bioinformatics 20, 289–290. doi: 10.1093/bioinformatics/btg412
Revell, L. J. (2012). phytools: an R package for phylogenetic comparative biology (and other things). Methods Ecol. Evol. 3, 217–223. doi: 10.1111/j.2041-210X.2011.00169.x
Robinson, D. F., and Foulds, L. R. (1981). Comparison of phylogenetic trees. Math. Biosci. 53, 131–147.
Roch, S., and Steel, M. (2015). Likelihood-based tree reconstruction on a concatenation of aligned sequence data sets can be statistically inconsistent. Theor. Popul. Biol. 100, 56–62. doi: 10.1016/j.tpb.2014.12.005
Salichos, L., and Rokas, A. (2013). Inferring ancient divergences requires genes with strong phylogenetic signals. Nature 497, 327–331. doi: 10.1038/nature12130
Shimodaira, H. (2002). An approximately unbiased test of phylogenetic tree selection. Syst. Biol. 51, 492–508. doi: 10.1080/10635150290069913
Shimodaira, H., and Hasegawa, M. (1999). Multiple comparisons of log-likelihoods with applications to phylogenetic inference. Mol. Biol. Evol. 16, 1114–1116. doi: 10.1093/oxfordjournals.molbev.a026201
Smith, D. R. (2015). Mutation rates in plastid genomes: They are lower than you might think. Genome Biol. Evol. 7, 1227–1234. doi: 10.1093/gbe/evv069
Song, S., Liu, L., Edwards, S. V., and Wu, S. (2012). Resolving conflict in eutherian mammal phylogeny using phylogenomics and the multispecies coalescent model. PNAS 112:E6079. doi: 10.1073/pnas.1518753112
The Angiosperm Phylogeny Group [APG] (1998). An ordinal classification for the families of flowering plants. Ann. Missouri. Bot. Gard. 85, 531–553. doi: 10.2307/2992015
The Angiosperm Phylogeny Group [APG] (2003). An update of the angiosperm phylogeny group classification for the orders and families of flowering plants: APG II. Bot. J. Linn. Soc. 141, 399–436. doi: 10.1046/j.1095-8339.2003.t01-1-00158.x
The Angiosperm Phylogeny Group [APG] (2009). An update of the Angiosperm Phylogeny Group Classification for the orders and families of flowering plants: APG III. Bot. J. Linn. Soc. 161, 105–121. doi: 10.1111/j.1095-8339.2009.00996.x
The Angiosperm Phylogeny Group [APG] (2016). An update of the Angiosperm Phylogeny Group classification for the orders and families of flowering plants: APG IV. Bot. J. Linn. Soc. 181:20. doi: 10.1111/boj.12385
van der Merwe, M. M., Van Wyk, A. E., and Botha, A. M. (2005). Molecular phylogenetic analysis of Eugenia L. (Myrtaceae), with emphasis on southern African taxa. Plant Syst. Evol. 251, 21–34. doi: 10.1007/s00606-004-0160-0
Vasconcelos, T. N. C., Lucas, E. J., Faria, J. E. Q., and Prenner, G. (2018). Floral heterochrony promotes flexibility of reproductive strategies in the morphologically homogeneous genus Eugenia (Myrtaceae). Ann. Bot. 121, 161–174. doi: 10.1093/aob/mcx142
Vasconcelos, T. N. C., Proença, C. E. B., Ahmad, B., Aguilar, D. S., Aguilar, R., Amorim, B. S., et al. (2017). Myrteae phylogeny, calibration, biogeography and diversification patterns: Increased understanding in the most species rich tribe of Myrtaceae. Mol. Phylogenet. Evol. 109, 113–137. doi: 10.1016/j.ympev.2017.01.002
Villaverde, T., Pokorny, L., Olsson, S., Rinc, M., Johnson, M. G., Gardner, E. M., et al. (2018). Bridging the micro- and macroevolutionary levels in phylogenomics: Hyb-Seq solves relationships from populations to species and above. New Phytol. 220, 636–650. doi: 10.1111/nph.15312
Weitemier, K., Straub, S. C. K., Cronn, R. C., Fishbein, M., Schmickl, R., McDonnell, A., et al. (2014). Hyb-Seq: Combining target enrichment and genome skimming for plant phylogenomics. Appl. Plant Sci. 2:1400042. doi: 10.3732/apps.1400042
Wilson, P. G. (2011). “Myrtaceae,” in The families and genera of vascular plants. Flowering plants, eudicots: Sapindales, Cucurbitales, Myrtaceae, ed. K. Kubitzki (Berlin: Springer), 212–271. doi: 10.1007/978-3-642-14397-7
World Checklist of Selected Plant Families [WCSP] (2021). Myrtaceae. Available online at: https://apps.kew.org/wcsp/myrtaceae [Accessed May 26, 2021].
Wu, S., Song, S., Liu, L., and Edwards, S. V. (2013). Reply to Gatesy and Springer: The multispecies coalescent model can effectively handle recombination and gene tree heterogeneity. PNAS 110:E1180. doi: 10.1073/pnas.1300129110
Zhang, C., Ogilvie, H. A., Drummond, A. J., and Stadler, T. (2017). Bayesian inference of species networks from multilocus sequence data. Mol. Biol. Evol. 35, 504–517. doi: 10.1093/molbev/msx307
Keywords: high-throughput sequencing, Hyb-Seq, target sequence capture, phylogenomics, Myrtaceae, Eugenia
Citation: Giaretta A, Murphy B, Maurin O, Mazine FF, Sano P and Lucas E (2022) Phylogenetic Relationships Within the Hyper-Diverse Genus Eugenia (Myrtaceae: Myrteae) Based on Target Enrichment Sequencing. Front. Plant Sci. 12:759460. doi: 10.3389/fpls.2021.759460
Received: 16 August 2021; Accepted: 29 November 2021;
Published: 04 February 2022.
Edited by:
Stefan Wanke, Technical University Dresden, GermanyReviewed by:
Rebeca Hernández-Gutiérrez, National Autonomous University of Mexico, MexicoDomingos Cardoso, Federal University of Bahia, Brazil
Copyright © 2022 Giaretta, Murphy, Maurin, Mazine, Sano and Lucas. This is an open-access article distributed under the terms of the Creative Commons Attribution License (CC BY). The use, distribution or reproduction in other forums is permitted, provided the original author(s) and the copyright owner(s) are credited and that the original publication in this journal is cited, in accordance with accepted academic practice. No use, distribution or reproduction is permitted which does not comply with these terms.
*Correspondence: Augusto Giaretta, YXVndXN0b2dpYXJldHRhQGdtYWlsLmNvbQ==