 Lingling Xie1,2†
 Jin Wang1,3†Feng Liu1Huoqiang Zhou2Ying Chen2Luzhao Pan1,3Wei Xiao2
 Yin Luo2Baobin Mi2*Xiaowu Sun1*Cheng Xiong1*
- 1College of Horticulture, Hunan Agricultural University, Changsha, China
- 2Vegetable Research Institute, Hunan Academy of Agricultural Sciences, Changsha, China
- 3College of Horticulture, Nanjing Agricultural University, Nanjing, China
Wax gourd (Benincasa hispida), a popular fruit of the Cucurbitaceae (cucurbits) family, contains many nutrients with health benefits and is widely grown in China and other tropical areas. In this study, a wax gourd mutant hfc12 with light-color pericarp was obtained through ethane methylsulfonate (EMS) mutagenesis. Integrative analysis of the metabolome and transcriptome identified 31 differentially accumulated flavonoids (DAFs; flavonoids or flavonoid glycosides) and 828 differentially expressed genes (DEGs) between the hfc12 mutant and wild-type ‘BWT’. Furthermore, BSA-seq and kompetitive allele specific PCR (KASP) analysis suggested that the light-color pericarp and higher flavonoid content was controlled by a single gene BhiPRR6 (Bhi12M000742), a typical two-component system (TCS) pseudo-response regulator (PRR). Genetic analysis detected only one nonsynonymous mutation (C-T) in the second exon region of the BhiPRR6. Weighted correlation network analysis (WGCNA) identified the downstream target genes of BhiPRR6, probably regulated by light and were intermediated in the regulatory enzyme reaction of flavonoid biosynthetic pathway. Thus, these results speculated that the transcription factor BhiPRR6, interacting with multiple genes, regulates the absorption of light signals and thereby changes the pericarp color and synthesis of flavonoids in wax gourd.
Introduction
Wax gourd [Benincasa hispida (Thunb.) Cogn., 2n = 2x = 24] is an important vegetable of the Cucurbitaceae family widely grown in the tropical and subtropical regions of the world (Xie et al., 2019). The plant bears large fruit with a dark-green pericarp and has high nutritional values, such as proteins, carbohydrates, vitamins and minerals (Sreenivas et al., 2011). As an important commodity value feature, peel color is a highly variable trait controlled by a relatively complex genetic mechanism, and mainly depends on the content and composition of flavonoids (Li et al., 2013).
As one of the major components of wax gourd, the flavonoids have attracted breeders and consumers for their ability to improve metabolic disorders and antiangiogenic and anticancer effects (Zoratti et al., 2014). Besides increasing the nutritional value of the fruit, flavonoids act as indicators of fruit quality also in wax gourd (Imran et al., 2019). Flavonoids are polyphenolic secondary metabolites of plants with different functions and include flavonols, flavones, flavanones, flavan-3-ols, isoflavones, and anthocyanins. They are generally found in plant-based foods, such as fruits, vegetables, beans, and tea, in the bound (flavonoid glycosides) or free form (flavonoid aglycones) (Azuma et al., 2012). Several studies have shown flavonoids have high nutritional functions in the reaction of the organism such as the antioxidant, anti-inflammatory, and antitumor properties (Jaakola and Hohtola, 2010). Notably, flavonoids play a central role in fruit quality and economic value; they influence the color, aroma, astringency, and antioxidant properties of fruits. For example, flavonols provide photoprotective effects, flavan-3-ols (precursors of proanthocyanidins) influence fruit flavor (Sudheeran et al., 2021), and the degree of co-pigmentation of anthocyanins and flavanones affected the fruit color (Baranac et al., 1997). Therefore, it is necessary to understand the factors that regulate the biosynthesis of wax gourd flavonoids, which may help develop and produce improved wax gourd varieties.
Flavonoids are synthesized through the phenylpropanoid and flavonoid pathways. In recent years, the biosynthetic pathway of flavonoids and the structural genes encoding the flavonoid biosynthetic enzymes have been extensively studied (Martens et al., 2010). In the early stages of the flavonoids biosynthetic pathway, the phenylalanine ammonia-lyase (PAL), chalcone synthase (CHS), chalcone isomerase (CHI), flavanone 3-hydroxylase (F3H), and coumadin CoA ligase (4CL) were flavonoid biosynthetic enzymes to produced p-coumaroyl-CoA (precursor substance) (Winkel-Shirley, 2002). Naringenin, catalyzed by chalcone synthase (CHS) and chalcone isomerase (CHI), is the core intermediate that leads to different flavonoid subclasses from each branch in the pathway (Jaakola, 2013). The biosynthesis of anthocyanins is a major branch of the flavonoid pathway, regulated by dihydroflavonol 4-reductase (DFR), UDP-glucose: flavonoid 3-glucosyltransferase (UFGT), and anthocyanin synthase (ANS) (Almeida et al., 2007). Anthocyanin reductase (ANR) and leucoanthocyanidin reductase (LAR) play central roles in proanthocyanidin biosynthesis (Shi et al., 2020). Meanwhile, flavonol is synthesized from dihydroflavonols by flavonol synthase (FLS). Flavones use flavanones as substrate and are formed by flavone synthase (FS) (Tomás-Barberán et al., 2001).
In addition to the structural genes encoding the enzymes of the flavonoid pathway, transcriptional factors regulate the expression of genes encoding these enzymes in each synthesis step. Many transcription factors have been found to regulate the flavonoid pathway (Yan et al., 2021). In general, the transcription factor R2R3-MYB interacts with bHLH (MYC-like basic helix-loop-helix) protein to form a complex with WD40 protein (MBW complex), which regulates the coordinated transcription of structural genes of the flavonoid biosynthetic pathway (Hichri et al., 2011). In apple (Malus × domestica Borkh.), MdMYB73 regulates the accumulation and vacuolar acidification of anthocyanins by directly activating the vacuolar transporters (MdVHA-B1, MdVHA-E, MdVHP1, and MdtDT) (Hu et al., 2017). In tomato (Solanum lycopersicum), SlMYB14 was involved in the regulation of flavonoid biosynthesis, and played a role in maintaining plant active oxygen homeostasis (Li et al., 2021). In mango (Mangifera indica L.), MiMYB1 acts as a critical regulator of anthocyanin biosynthesis and regulates the light-dependent red coloration (Kanzaki et al., 2020). PpMYB17, a bHLH or WD40 cofactor in the MBW complex, activates the structural genes PpCHS, PpCHI, PpF3H, and PpFLS involved in flavonoid biosynthetic pathway, and was positively regulates flavonoid biosynthesis in pear (Pyrus spp.) fruits (Premathilake et al., 2020). Studies have also reported other transcription factors that regulate flavonoid synthesis. For example, SQUAMOSA MADS-box gene, a critical regulatory factor in bilberry (Vaccinium myrtillus) fruits, is involved in anthocyanin biosynthesis (Jaakola et al., 2019). In muskmelon (Cucumis melo), a CmKFB gene negatively regulates flavonoid accumulation (Feder et al., 2015). In recent years, metabolome and transcriptome analysis have shown that R2R3-MYB, bHLH51 and WRKY23 were candidate key transcription factors that regulate the biosynthesis of flavonoids in cucumber peel (Chen et al., 2021). In wax gourd, a single gene locus on chromosome five controlled peel color (Jiang et al., 2015). However, the transcription factors that regulate the flavonoids synthesis of wax gourd have not been reported.
Ethyl methanesulfonate (EMS), as a chemical mutagen, has been widely used in plant mutagenesis breeding and functional genome research due to its high mutagenesis efficiency, easy operation and wide mutagenesis range. Therefore, EMS mutagenesis can not only obtain deletion or gain-of-function mutants, but also help to understand the role of specific amino acid residues in protein function (Yuan et al., 2014). BSA (Bulked Segregant Analysis), also known as mixed grouping analysis or cluster segregation analysis, is very suitable for analyzing mutants induced by EMS mutagenesis. Two materials with significant differences are used as parents, and a segregated population is constructed by hybridization. About 30 plants with extreme phenotypes were selected to construct two mixed pools. The difference region obtained by sequencing and analysis of the two mixed pools was the candidate region, and the target gene may exist in this region (Kurlovs et al., 2019). In this study, EMS mutagenesis generated a wax gourd mutant hfc12 with light peel color and high flavonoid content. The transcriptome sequencing (RNA-seq) and the metabolome (liquid chromatography with tandem mass spectrometry, LC–MS/MS) of the hfc12 mutant and WT ‘BWT’ were analyzed to understand the regulation of flavonoid biosynthesis. A single gene BhiPRR6 (pseudo-response regulator, Bhi12G000742) located on the chromosome 12 was fine-mapped by genetic BSA-seq analysis, which regulated the flavonoid biosynthesis in wax gourd. WGCNA was carried out to explore the correlation of the candidate gene with target genes in regulating the flavonoid pathway. To conclude, this study clarified the role of BhiPRR6 gene in wax gourd fruit flavonoid biosynthesis and revealed its regulatory network. The findings will provide a theoretical basis of molecular genetic improvement in wax gourd.
Materials and methods
Plant materials, EMS mutagenesis, and mutant analysis
Wax gourd wild-type (WT) inbred line “BWT” was treated by 0.8% EMS to construct a mutant library, and a wax gourd mutant hfc12 with high flavonoid content was generated. The ‘BWT’ and hfc12 plants as parents to obtain an F1 population and then were further self-crossing to establish the F2 mapping population (486 individuals), including 361 ‘BWT’ and 125 hfc12 individuals, respectively. At the same time, F1 and hfc12 were backcrossed to obtain 238 individuals BC1 population. All wax gourd varieties were planted in the Changsha experimental station (N 28°11′49″, E 112°58′429″) of the Hunan Vegetable Research Institute of Agricultural Science at the Apr. of 2018, Changsha, China. The flavonoid content, carotenoid content, chlorophyll a (Ca), and chlorophyll b (Cb) of the parents and F2 population were determined at the same time. The flavonoid contents of wax gourd pericarp were determined by colorimetry using the Plant Flavonoids test kit (A142-1-1, Nanjing Jiancheng Bioengineering Institute). The carotenoid content, chlorophyll a (Ca), chlorophyll b (Cb) was determined by visible spectrophotometry using a Plant Carotenoid detection kit (BC4330, Beijing Solarbio Science & Technology Co., Ltd.). The segregation ratios in the F2 and BC1 populations were analyzed with the Chi-square (χ2) goodness of fit test using R.
Transcriptome analysis
Total RNA was extracted from the frozen wax gourd pericarp of parents ‘BWT’ and hfc12 collected at 40 days after pollination (DAP, 40DAP mature stage: Pericarp color change stage) were using TransZol Kit (TransGen Biotech, Inc., Beijing, China). The libraries (200–250 bp) of each sample were generated and sequenced on an Illumina HiSeq™ X-Ten platform for paired-end reads (BGI, Shenzhen, China). The quality of reads obtained was checked using the Fastqc program (Brown et al., 2017). Trimmmatic (v0.36) was used to trim the adapter sequences and remove low-quality reads (Bolger et al., 2014). The filtered reads were mapped to the wax gourd reference genome (B. hispida var. B227) (Xie et al., 2019) using the Salmon (v1.2.0) tool (Patro et al., 2017). TPM (Transcripts Per Million) was used to quantify the gene/transcript levels. DESeq2 was used to identify the DEGs with the criteria of |log2Fold Change| ≥ 1 and a false discovery rate (FDR) < 0.05 (Love et al., 2014). Gene Ontology (GO) was annotated using Plant Transcriptional Regulatory Map online software (http://plantregmap.gao-lab.org/), and Kyoto Encyclopedia of Genes and Genomes (KEGG) pathway enrichment was analyzed by Kobas3.0 online software. Both GO and KEGG were conducted using clusterProfiler (R, v3.12) with the corrected P-value ≤ 0.05 (Yu et al., 2012). The expression level of the genes in the whole tissue period were obtained from CuGenDB (http://cucurbitgenomics.org/) (Xie et al., 2019).
Metabolite profiling
Samples were extracted from the frozen wax gourd pericarp of ‘BWT’ and hfc12 collected at 40 DAP with each three biological replicates. The biological samples were placed in a freeze dryer (Scientz-100F) for vacuum freeze drying. Using a grinder (MM 400, Retsch) with a zirconia bead for 1.5 min at 30 Hz. Using ultra-performance liquid chromatography (UPLC; SHIMADZU Nexera X2) and tandem mass spectrometry (MS/MS) (Applied Biosystems 4500 QTRAP) to analyzed. A widely targeted metabolomics method was used based on the self-built database MWDB (Metware Biotechnology Co., Ltd. Wuhan, China) (http://www.metware.cn/). The metabolites were qualitatively analyzed based on the secondary spectrum information. The isotope signal is removed during analysis, including repeated signals of K+, Na+, NH4+, and the repeated signals of fragment ions that are other larger molecular weight substances.
Unsupervised PCA was performed using the statistics function prcomp of the R statistical software (www.r-project.org). The hierarchical cluster analysis (HCA) results of samples and metabolites were presented as heatmaps with dendrograms. Pearson correlation coefficients (PCC; r) between the samples were calculated using the cor function in R and presented as a heatmap. Both HCA and PCC were carried out using the pheatmap (R, v1.0.12). For HCA, normalized signal intensities of metabolites (unit variance scaling) were visualized as a color spectrum. Significantly regulated metabolites between ‘BWT’ and hfc12 were determined by VIP ≥1 and an absolute Fold change ≥ 2 or Fold change ≤ 0.5. VIP values were extracted from the orthogonal projections to latent structures discriminant analysis (OPLS-DA) result, with score plots and permutation plots, generated using MetaboAnalystR (R, v3.0) (Pang et al., 2020). The data were log-transformed (log2) and mean-centered before OPLS-DA. A permutation test (200 permutations) was performed to avoid overfitting. Identified metabolites were annotated using KEGG Compound database (http://www.kegg.jp/kegg/compound/), annotated metabolites were then mapped to KEGG Pathway database (http://www.kegg.jp/kegg/pathway.html). Pathways with significantly regulated metabolites mapped to were then fed into metabolite sets enrichment analysis (MSEA).
Bulked segregant analysis RNA sequencing and linkage analysis
The DNA samples of the parental lines ‘BWT’ and hfc12 were prepared as two pools for sequencing with each three biological replicates. From the F2 population, 25 pericarps of wax gourd at 40 DAP for each plant with extremely high flavonoid content and 25 extremely low flavonoid content individuals were selected to construct two separation pools. In addition, DNA samples were extracted from individual plants in each pool and mixed in equimolar amounts to form wild-type mixed pools (low flavonoid content) and mutant mixed pools (high flavonoid content) for constructing genomic libraries. Four cDNA libraries (dominant mixed pool, recessive mixed pool, and two parent pools) were constructed using Truseq Nano DNA HT sample preparation kit (Illumina, USA). These four libraries were sequenced and evaluated on the Illumina HiSeq 4000 platform (Changsha, China) to generate 2×150 bp paired-end reads with an insert size of about 350 bp. The sequencing depth of the two mixed pools were 25×, and the sequencing depth of the two parent pools were 10×. Fastqc was used to evaluate the quality of the reads, and Trimmomatic to remove the adaptors and low-quality reads (Bolger et al., 2014; Brown et al., 2017). Hisat2 was used to map the clean reads to the wax gourd reference genome. SAMtools (v0.1.18) software was used to perform SNP calling with 90% loci depth coverage (Ramirez-Gonzalez et al., 2012). Further, Burrows-Wheeler Aligner (BWA) was used to align with the reference genome (B. hispida var. B227), and GATK (Genome analysis toolkit, v4.0) was used to detect SNPs and InDels. ANNOVAR was used to annotate the SNPs and InDels based on the GFF3 file of the wax gourd reference genome. In addition, the SNP-index algorithm was used to identify candidate regions of the genome related to flavonoid content, and calculated the difference in allele frequency between large-capacity pools (Takagi et al., 2013). Δ (SNP index) was the difference in SNP-index between the dominant mixed pool and the recessive mixed pool. The points with an SNP/InDel index less than 0.3 were filtered out of both pools. According to the SNP △(SNP-index) >0.5 and Euclidean distance (ED), the candidate regions related to the flavonoid content are selected with 95% confidence. Join Map software (v4.0) was used to construct the genetic linkage map with five SNPs as the window, and two SNPs as the step size.
Fine-mapping analysis
Mapping function was used to calculate the genetic map distance (cM) of the F2 population 486 individuals from the recombination frequency (Voorrips, 2002). Based on the reference genome, Kompetitive Allele Specific PCR (KASP) was used to accurately determine SNPs and InDels biallelic genes at specific sites (Semagn et al., 2014). The CTAB method was used to extract DNA from all peel samples of 486 F2 individuals for KASP analysis. The quality and quantity of the extracted DNA were verified by agarose gel electrophoresis and NanoDrop ND-2000 spectrophotometer, and the primers were designed by Primer5 (Table S4). The 200 bp sequence upstream and downstream of the SNPs were used to design the KASP primers, and the SNPs were typed based on the specific matching of primer end bases. KASP method and mix were to refer to PARMS SNP detection reagent manual (Gentides Biotech Co., Ltd (Wuhan) Synthesis), and were carried out on LightCycle® 96 Real-Time PCR System (Roche, Basel, Switzerland) in a 10μL reaction mixture. The selected genes and their primer sequences were listed in Table S4.
Real time fluorescence quantitative PCR
The qRT-PCR method was used to quantify the transcript abundance in the 40 DAP pericarp of the wax gourd plants. Reverse transcription was carried out using the HiScript®IIQ RT SuperMix for qRT-PCR (+gDNA wiper) (Vazyme Biotech Co. Ltd, Piscataway, NJ, United States). Primers were designed using Primer3 (http://bioinfo.ut.ee/primer3-0.4.0/), with the PCR product size set at a range of 80–150 bp. The qRT-PCR was carried out on LightCycle® 96 Real-Time PCR System (Roche, Basel, Switzerland) in a 20μL reaction mixture by using ChamQ Universal SYBR qPCR Master Mix (Vazyme Biotech Co. Ltd, Piscataway, NJ, United States). Three biological replicates and three technical replicates were maintained. Actin was used as the reference gene. The 2-ΔΔCt method was used to calculate the relative expression level of the genes. The selected genes and their primer sequences were listed in Table S4.
Correlation analysis
The WGCNA package in R language was used to construct a co-expression network and analyze the correlation of gene modules. RNA-seq FPKM data were used to perform WGCNA analysis (Langfelder and Horvath, 2008). The DEGs along DAFs with PCC ≥0.90 or ≤0.90 were selected for subsequent WGCNA with default parameters. Cytoscape was used to generate style and statistical a co-expression plot (Smoot et al., 2011). The DEGs in co-expression network were also subjected to GO and KEGG enrichment analysis, same method as above Transcriptome analysis of Materials and Methods part.
Results
Phenotypic characterization of ‘BWT’ and hfc12
EMS was used to mutate the WT wax gourd variety ‘BWT’ to construct a mutant library. After multiple generations of screening, a mutant hfc12 plant with light-pericarp color was obtained. Phenotypic analysis revealed that the F2 generation fruit peel of hfc12 at 40 DAP was light green compared with the ‘BWT’ (Figure 1A). However, the hfc12 color of the stem, leaves, and flowers was not significantly different from that of the ‘BWT’; no significant difference was observed in the peel thickness also. The concentration of polyphenols and other compounds in the fruits of the hfc12 and ‘BWT’ was analyzed. The flavonoid content (4.71 mg/g) in the hfc12 was significantly higher than that of ‘BWT’ (2.85 mg/g). Besides, the content of chlorophyll a (5.52 mg/L) in the ‘BWT’ was significantly higher than that of hfc12 (3.38 mg/L), and the content of chlorophyll b (3.83 mg/L) in the ‘BWT’ was significantly higher than that of hfc12 (1.65 mg/L). No significant difference was observed between the hfc12 and the ‘BWT’ in carotenoid concentration and content (Figure 1B).
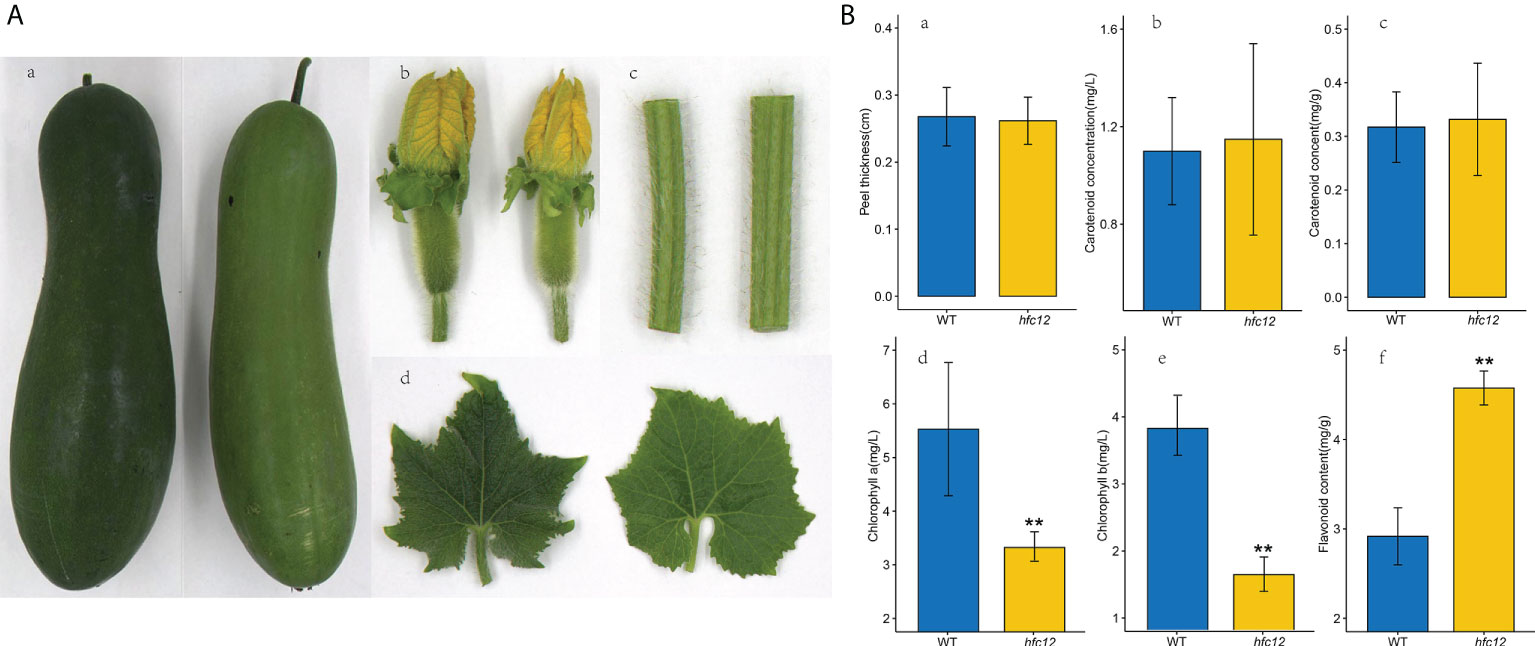
Figure 1 Phenotypic characterization and physiological indicators of WT and hfc12. (A) Phenotypic characterization of fruits at 40 DAP (a), flowers (b), stems (c), and leaves (d) of WT (left) and hfc12 (right). (B) Physiological indicators including peel thickness (a), carotenoid concentration (b), carotenoid content (c), chlorophyll a content (d), chlorophyll b content (e), and flavonoid content (f) of ‘BWT’ (left) and hfc12 (right). Asterisks indicate significance according to the t-test (**P< 0.01).
Identification and functional analysis of DEGs
To further understand the flavonoid response patterns of ‘BWT’ and hfc12 at the transcriptional level, genes related to higher flavonoid levels were identified from wax gourd. Transcriptome sequencing (RNA-seq) was performed using the hfc12 and ‘BWT’ fruit frozen pericarp samples collected at 40 DAP. After deleting the adaptors and low-quality reads from the raw data, 55.05 Gb clean data were generated from the six samples. The number of reads per sample ranged from 20.27 million to 28.85 million, with an average of 22.80 million (Table S1). Approximately 95% of the clean reads were mapped to the wax gourd (B. hispida cv. B227) reference genome. Furthermore, the correlation coefficient and principal component analysis (PCA) suggested a high degree of similarity between the biological repeats (Figure 2A). A total of 828 DEGs were identified between ‘BWT’ and hfc12 at 40 DAP, including 286 upregulated and 542 downregulated genes (Figure 2B).
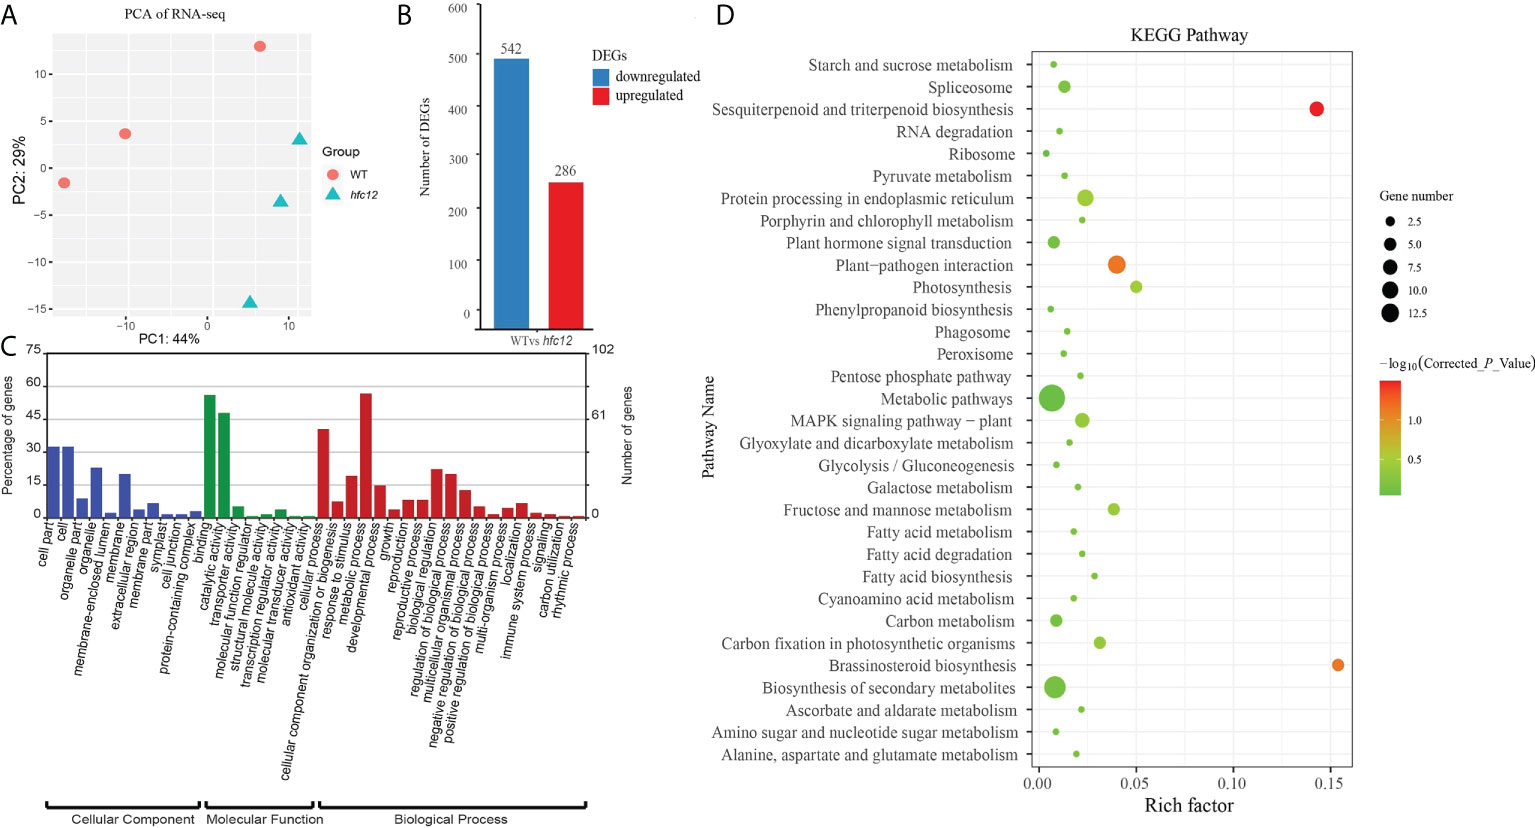
Figure 2 RNA-seq transcriptome analysis of WT and hfc12. (A) PCA plot of DEGs between ‘BWT’ and hfc12. (B) Differentially expressed genes (DEGs) at 40 DAP of WT and hfc12. (C) GO enrichment analysis of DEGs. Blue bars for cellular component, green bars for molecular function, and red bars for biological process. (D) KEGG analysis of DEGs.
GO analysis was performed to identify the primary biological functions of all the DEGs between ‘BWT’ and hfc12 with the corrected P-value < 0.05. All DEGs were assigned GO terms of the three major categories: cellular component, molecular function, and biological process (Figure 2C). DEGs were primarily assigned in cell part, cell, organelle, and membrane in the cellular component category. In the molecular function category, catalytic activity and binding were significantly assigned. In the biological process category, 56% of DEGs were primarily assigned in the metabolic processes (GO: 0008152), specially. Cellular process, response to stimulus, biological regulation, and regulation of biological process were also highly assigned in the biological process category.
Furthermore, KEGG pathway analysis revealed that DEGs were associated with 32 common metabolic and biological pathways (Figure 2D). DEGs were preferably enriched in the metabolic pathways, biosynthesis of secondary metabolites, plant hormone signal transduction, protein processing in endoplasmic reticulum. Besides, DEGs were significantly enriched (− log10(Corrected_P_Value) >0.1) in sesquiterpenoid and triterpenoid biosynthesis, and brassinosteroid biosynthesis Photosynthesis, MAPK signaling pathway - plant, fructose and mannose metabolism, and carbon fixation in photosynthetic organisms were also enriched.
Identification and enrichment analysis of DAFs in the fruits
TRAP-MS/MS was performed to compare the differences in flavonoid composition between the ‘BWT’ and hfc12 wax gourd fruit frozen pericarp samples collected at 40 DAP (Figure S1A). A total of 138 flavonoids were detected in all samples, including 29 flavonoid carbonosides, 26 flavonols, 51 flavonoids, 13 dihydroflavones, two chalcones, and eight isoflavones, eight kinds of tannins and one kind of proanthocyanidins (Table S2). Among them, a total of 31 DAFs were identified between ‘BWT’ and hfc12 (fold change ≥ 2 or fold change ≤ 0.5, and variable importance in projection (VIP) ≥1), of which 28 were upregulated and three were downregulated. These DAFs were either flavonoids or flavonoid carboglycosides. Twelve flavonoids were identified in DAFs (Figure 3A). Besides, one chalcone, two flavanols, three flavonols, three isoflavones, three dihydroflavonol, and seven flavonoid carbonosides were also among the DAFs. Of which, chrysoeriol-7-O-(6’’-acetyl) glucoside and isorhamnetin-3-O-(6’’-acetylglucoside) were the highest upregulated in the hfc12, with a log2FC value of 11.09 and 10.72, respectively. Orientin-7-O-glucoside, chrysoeriol-7-O-(6’’-malonyl) glucoside, and quercetin-3-O-(4’’-O-glucosyl) rhamnoside were the three downregulated metabolites in the hfc12, with a log2FC value of -1.18, -1.07, and -1.06, respectively (Figure 3B).
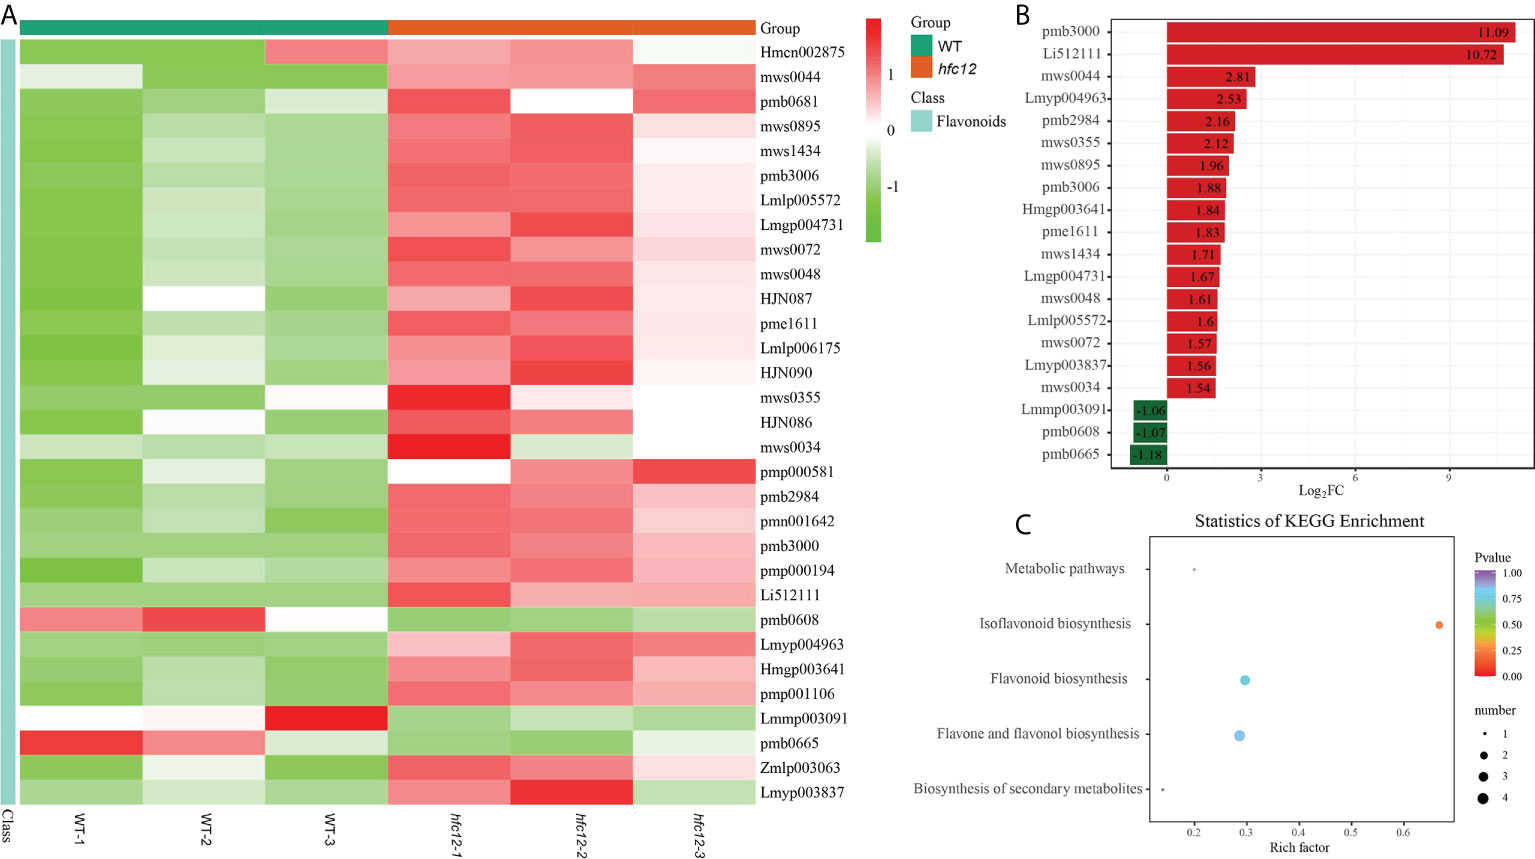
Figure 3 Metabonomic analysis of WT and hfc12. (A) Heatmap of DAFs between WT and hfc12. The columns represented samples, and the rows represented the differential metabolites. The differential metabolite cluster tree was shown on the left side of the plot. The different colors indicated the values obtained after standardization of the relative content (red represents high content, green represents low content). (B) Bar chart of DAFs. (C) KEGG enrichment scatter plot of DAFs.
Furthermore, KEGG enrichment analysis revealed that the DAFs were enriched with flavone and flavonol biosynthesis (ko00944), flavonoid biosynthesis (ko00941), isoflavonoid biosynthesis (ko00943), and secondary metabolite biosynthesis pathways (ko01110). These observations indicated that the hfc12 plant have mutations in the flavonoid metabolism pathway, probably affecting fruit development and peel color changes (Figure 3C).
Mapping of wax gourd hfc12
The F2 (n = 486) population isolated from the cross between the WT ‘BWT’ and hfc12 mutant the was used for genetic analysis and primary mapping. Genetic population analysis and chi-square test revealed that the low flavonoid content (361 individuals, dark-green pericarp) and the high flavonoid content (125 individuals, light-green pericarp) traits of the F2 generation were separated at a ratio of 3:1, and that of the backcross population at a ratio of 1:1 (Table 1), consistent with the Mendelian independent genetic rules. These observations indicated that a single recessive nuclear gene controls the trait related to high flavonoid content.
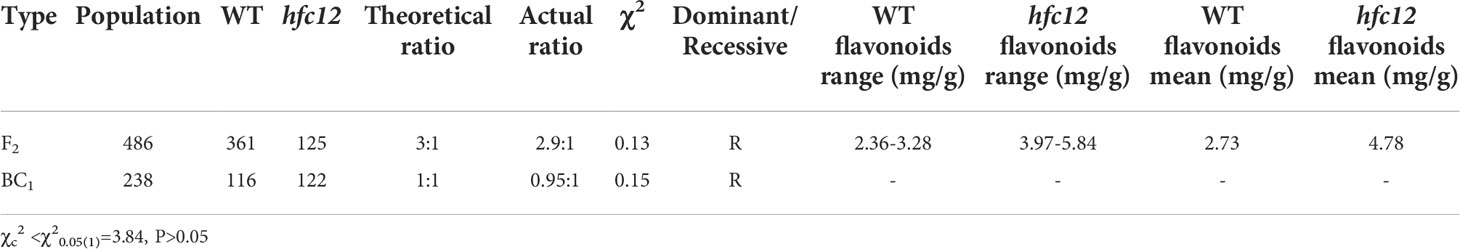
Table 1 Genetic analysis and flavonoids content of wax gourd hfc12.
Four parental DNA pools (dominant pool, recessive pool, dominant progeny pool, and recessive progeny pool) were constructed, and the WT pool and mutant pool were mixed to construct a genomic library for BSA-seq. Genome-wide BSA-seq using these DNA pools resulted in 67 Gb of data. The two parental lines generated 0.76 million paired-end reads of ‘BWT’ and 0.61 million paired-end reads of hfc12. The sequencing depths were 10.47× and 10.05×, and the genome coverage rates were 95.60% and 95.93% in the ‘BWT’ and hfc12, respectively. Similarly, the alignment of the dominant sexual progeny pool and recessive progeny pool were 20.01× and 18.92× of sequencing depth, and genome coverage of 95.67% and 95.93%, respectively (Table S3). Statistical analysis suggested that the sequencing data were reliable for BSA-seq analysis. A total of 21,548 SNPs were identified between the ‘BWT’ and the hfc12 libraries (base quality value ≥ 20, mapping quality value ≥ 20, base depth (two F2 mixed pools) ≥ 2 and ≤ 60, and base depth (parents) ≥ 2 and ≤ 60). There were two regions on the whole genome of the recessive pool with Δ (SNP index) values above 0.5 and close to 1, which were located in the 25-30 Mb range of chromosome 12, and a total of 456 candidate sites for the target region have been obtained.
Fine-mapping and candidate gene analysis
All F2 individuals from ‘BWT’ × hfc12 were used for KASP molecular markers for genotyping. Based on the genotypes and phenotypes, a total of 78 recombinant plants were identified for further population location. Finally, fine-mapping places the hfc12 locus in the genomic region, flanked by markers 24.16 Mb (SNP12G24166107) to 35.90 Mb (SNP12G35908349), a 11.7Mb on chromosome 12 (Figure 4A). According to the wax gourd reference genome ‘Benincasa hispida var. B227’ database, 11 predicted genes were annotated in the candidate region, including nine intron mutations, two 5’ UTR mutations, one 3’ UTR mutation, and one coding sequence (CDS) mutation (Table S5). Nine polymorphic SNP markers were further developed from 24.16 Mb to 35.90 Mb region, and the mutation site was finally restricted to the 452.366 kb region (SNP12G25509139 to SNP12G25961505) on chromosome 12 by multiple KASP molecular markers. Within this interval, there were a total of 219 SNPs, and involving 5 genes (Figure 4E). However, only one SNP (SNP12G25876073) is located in the gene CDS region and co-segregated with the phenotypes among the F2 population, resulting in non-synonymous mutations between WT and hfc12 (Figure 4B). PCR amplification and sequencing identified the SNP-25876073 was located in the second exon of Bhi12G000742 (BhiPRR6). A C-T mutation was detected at 1060 bp of mutant hfc12 CDS region; CTT was mutated to TTT (+), and Glu (E) to Lys (K) (-) (Figure 4B).
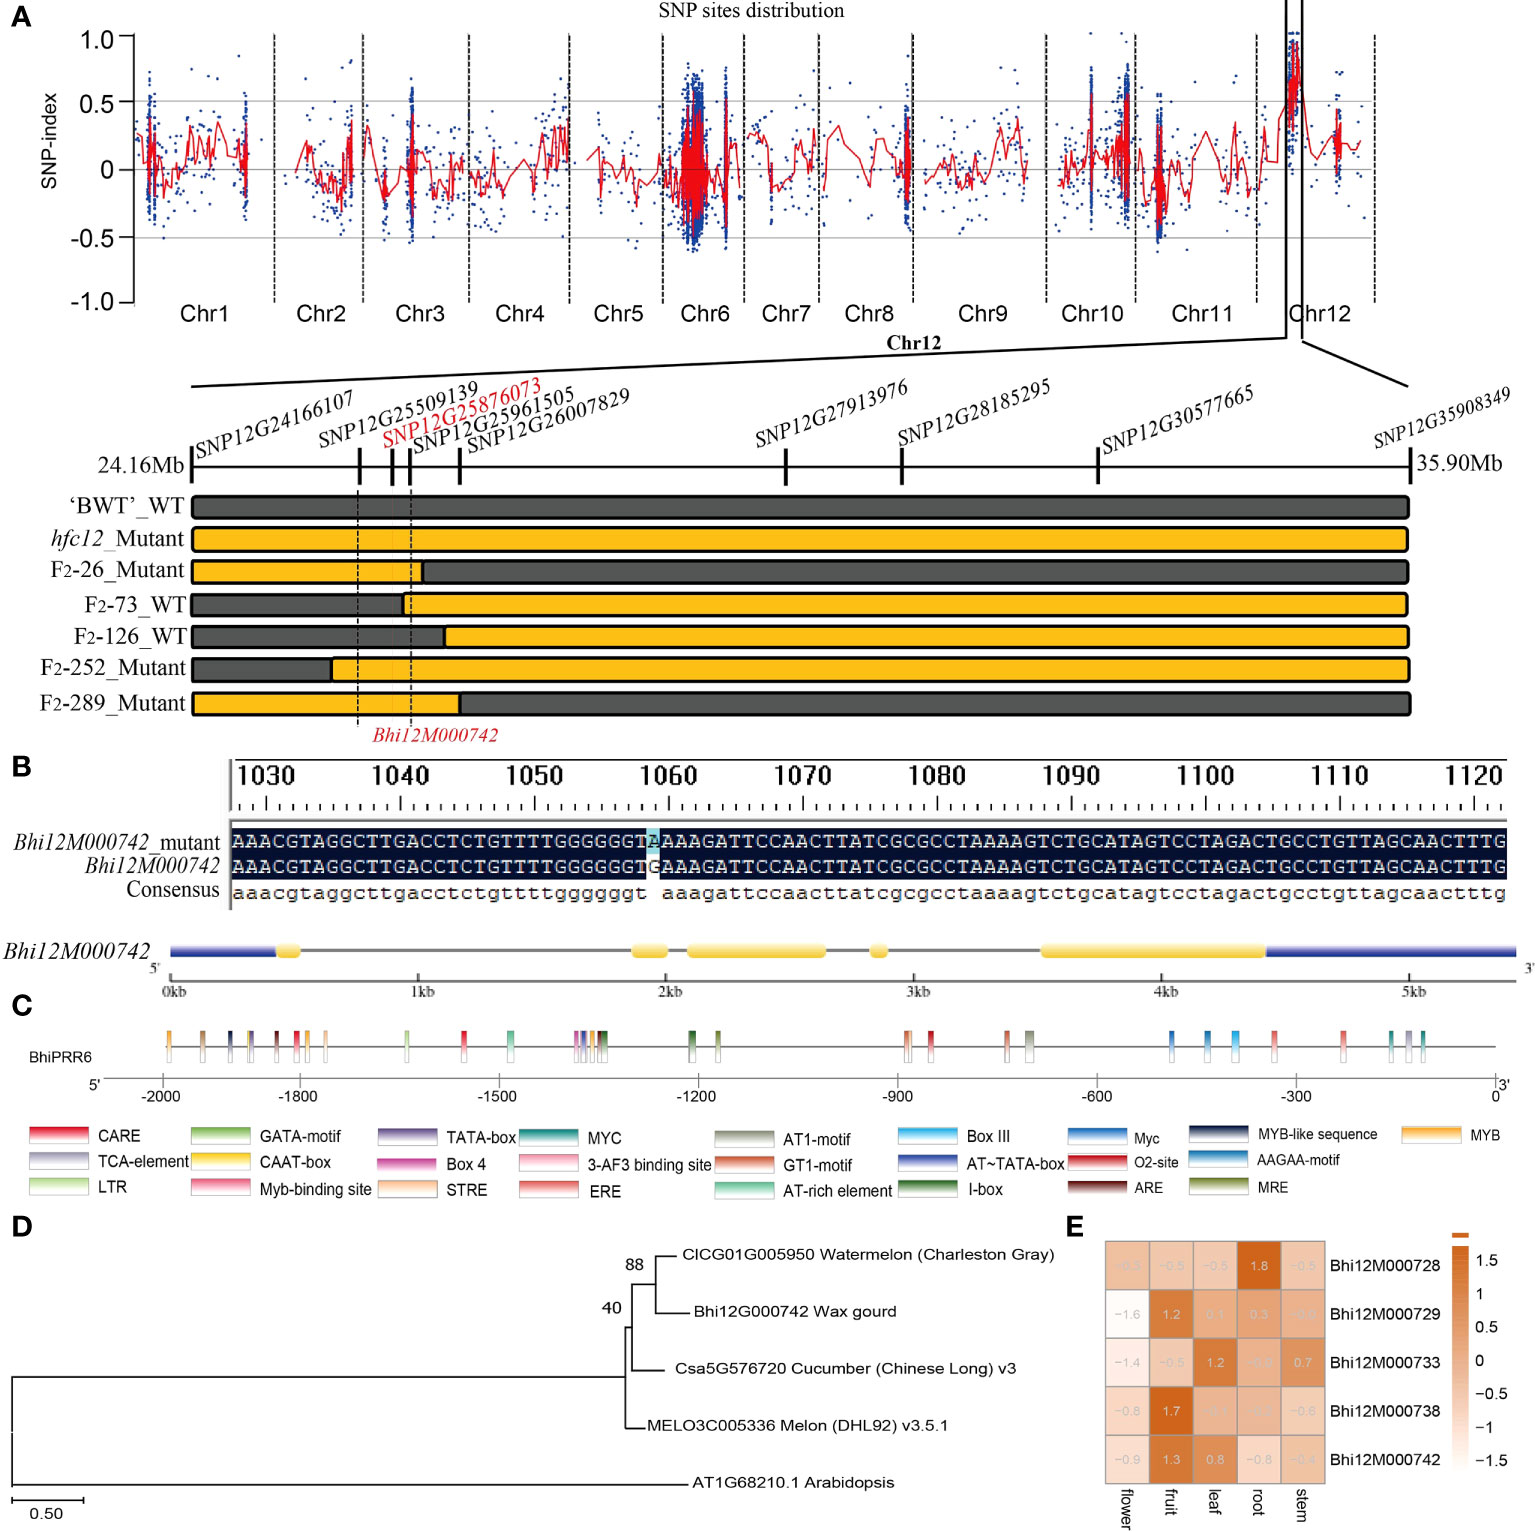
Figure 4 Cosegregation analysis and genetic variation in BhiPRR4 of wax gourd hfc12. (A) Gene location and mutation site in wax gourd. BSA-seq generated the SNP distribution Δ(SNP index)] plot; the vertical axis represents the chromosome, and the red vertical line represents the location of the hfc12 SNP. The highest point shown is the locus 25 Mb to 30 Mb on chromosome 12. Based on F2 plants with extreme phenotypes, the genetic map was drawn on the 452.366 kb region (SNP12G25509139 to SNP12G25961505). (B) Bhi12G000742 (BhiPRR6) mutation of C to T in the SNP on the positive strand (G to A on the negative strand) of the second exon (red line). The yellow rectangle and the black line represent the exons and introns, respectively. (C) Schematic representation of BhiPRR6 promoter 2000 bp upstream of the CDS region. Cis-elements are shown in rectangles with different colors. (D) Multiple sequence alignment of BhiPRR6 proteins with watermelon, melon, cucumber, and Arabidopsis. (E) Different tissue expression levels of genes in the candidate interval.
Annotation and protein homology comparison found that the candidate gene was a typical two-component response regulator PRR family gene. The analysis identified the gene as BhiPRR6, 1802 bp long with five exons and four introns. It had theoretical pI (isoelectric point) and Mw (molecular weight) of 6.88 and 67180.10, respectively, and was located on chromosome 12 (25876073–25877875). The promoter region (2000 bp upstream) of BhiPRR6 had 26 cis-elements, including typical ARE, AT-rich element, ethylene-responsive element (ERE), and salicylic acid-responsive element (TCA-element). It also included various typical MYB cis-acting elements such as MRE, MYB, MYB-like sequence, MYC, and MYB-binding site (Figure 4C). Besides, BhiPRR6 was highly homologous to the watermelon (Citrullus lanatus subsp. vulgaris cv. 97103) CLCG01G005950, the muskmelon (Cucumis melo L. cv. DHL92) MELON3C005336 (CmPRR5, LOC103504590), the cucumber (Cucumis sativus L. var. sativus cv. 9930) Csa5G576720, and the Arabidopsis AT1G68210 (APRR6). The closest homology was found between BhiPRR6 and the watermelon CLCG01G005950 gene, with a bootstrap value of 89 (Figure 4D). Analysis of the expression levels of five candidate genes in the KASP regions showed that BhiPRR6 was highly expressed in fruits and leaves (Figure 4E).
Correlation analysis of BhiPRR6 in flavonoids biosynthetic pathways
WGCNA was performed using RNA-seq data to study the correlation pattern among the genes in wax gourd. All 971 co-expressed genes with BhiPRR6 as the hub gene were clustered into eight main modules (marked in different colors) (Table S6). Genes in the same module were highly related and co-expressed. The turquoise module had the maximum number of DEGs (258), followed by the blue (148), brown (145), and yellow (144) modules (Figure S1D). Co-expression analysis suggested a high correlation between 78 genes and BhiPRR6, with a strict edge weight (topological overlap matrix, TOM ≥ 0.30). Among them, F-box family protein (Bhi11G001950), glycerol-3-phosphate acyltransferase 1 (GPAT1, Bhi05G001763), acyl carrier protein 4 (ACP4, Bhi02G000477), and CBL-interacting protein kinase 1 (CIPK1, Bhi12G001773) showed a high degree of connectivity, indicating certain biological functions. Bhi10G001402, Bhi06G000135, Bhi09G001849, and Bhi05G000810 showed the highest co-expression with the hub gene BhiPRR6 (Figure 5A). In particular, co-expressed genes were related to flavonoid biosynthesis, including a structural gene 4CL (4-coumarate-CoA ligase, Bhi11G001762), with a TOM value of 0.35. UDP-glucose: flavonoid-3-O-glycosyltransferase (UFGT; Bhi09G002071, Bhi03G000738, Bhi05G000029, and Bhi05G000624) and photosystem I chlorophyll a/b-binding protein 6 (LHCA6, Bhi02G001494) were also highly co-expressed with BhiPRR6. An MYB1R1 (Bhi11G000031) also showed a high correlation with BhiPRR6 involved flavonoid synthesis. A WD40 protein (Bhi12G000575) and a 4CL structure protein (Bhi11G001234) were also present in this network.
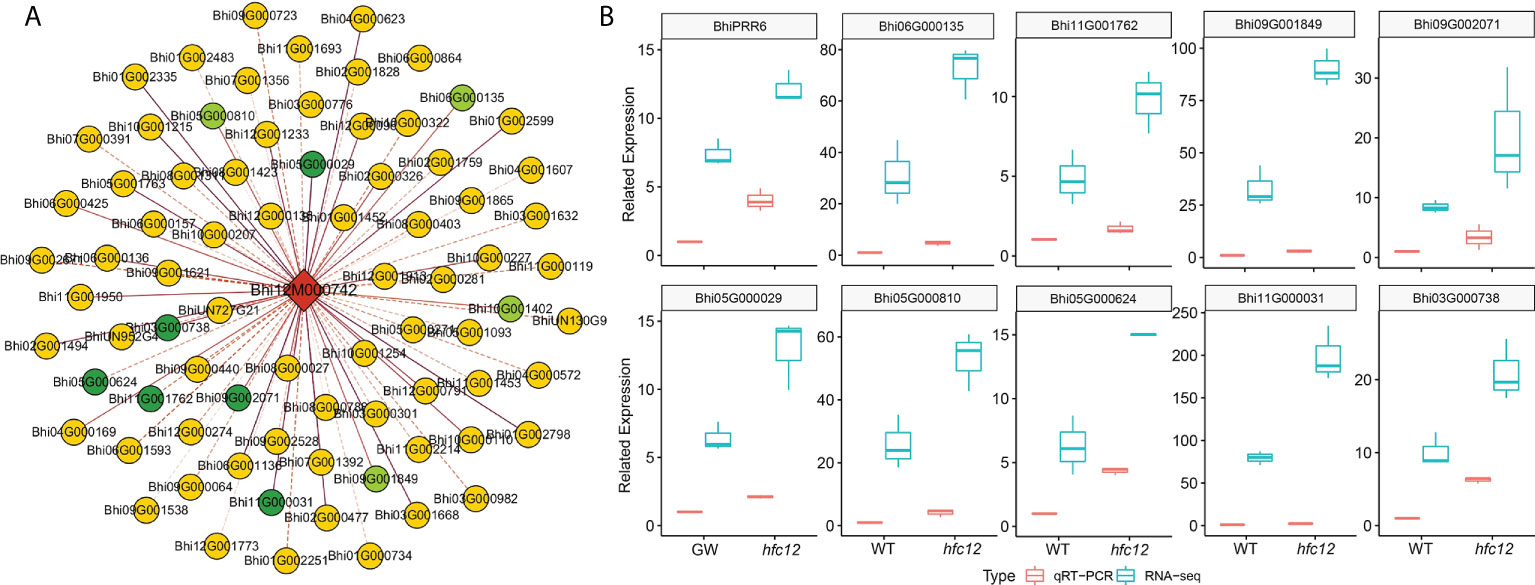
Figure 5 Co-expression regulatory network and expression of BhiPRR6 and other interacting genes in wax gourd. (A) Co-expression network analysis with BhiPRR6 as hub gene. The light-green circles represent the genes with the highest correlation (Topological overlap matrix, TOM > 0.52). The dark-green circles represent the candidate genes that may regulate the synthesis of flavonoids with BhiPRR6 (Table S5). (B) The expression pattern of BhiPRR6 and ten co-expressed genes by both Quantitative real-time PCR (qRT-PCR) and RNA-seq analysis.
Furthermore, the expression levels of the co-expressed genes were analyzed using RNA-seq data. The analysis divided 79 genes (hub gene and 78 co-expressed genes) into two categories based on the expression pattern. Among them, most co-expressed genes (74 genes) were similar to BhiPRR6, with expression levels significantly high at 40 DAP of hfc12. In the network, ten candidate co-expressed gene annotations may be related to the flavonoid pathway, with the similar expression pattern of BhiPRR6 (Figure 5A). RNA-seq and qRT-PCR were performed to analyze the transcript level of BhiPRR6 and the co-expressed genes in the mutant hfc12 and the WT ‘BWT’ parent individuals. As shown in Figure 5B, the expression level of BhiPRR6 was highest in hfc12, two times more than that in WT. At the same time, ten co-expressed genes closely related to BhiPPR6 were basically the same as their expression forms, and they were all highly expressed in the mutant hfc12. Of which, the highest expression was the Bhi09G001849 gene, and its expression in the hfc12 was about four times that of the ‘BWT’. The qRT-PCR results were consistent with the RNA-seq results, with an R2 above 0.80.
Discussion
Wax gourd is a globally preferred vegetable due to its high nutritional value and health benefits. Among the different bioactive components, flavonoids, such as anthocyanins, flavonols, and flavan-3-ols, in the fruit have antiangiogenetic and anticancer properties (Jiang et al., 2015). Much effort has been made to elucidate the flavonoid biosynthetic pathway and identify the regulatory factors. A previous study showed that grape (Vitis vinifera L.) adapted to intense light by increasing the expression of flavonoid biosynthetic genes in the skin, leading to increased anthocyanin, proanthocyanidin, and flavonol content (Dobre et al., 2014). In litchi (Litchi chinensis), fruit bagging inhibited anthocyanin accumulation and biosynthetic genes encoding CHS, CHI, F3H, dihydroflavonol 4-reductase (DFR), anthocyanin synthase (ANS), and UFGT (Koyama et al., 2012). In this study, the flavonoid content was high in the EMS-induced mutant hfc12, indicating the existence of regulatory factors for flavonoid content in wax gourd. Metabolites, including flavonoid carbonosides, flavonols, isoflavones, flavanols, dihydroflavonol, and chalcones, were found to be differentially accumulated in the hfc12. Detailed analysis revealed that the DAFs and DEGs between the ‘BWT’ and hfc12 were significantly enriched in the flavonoid pathway (Figure 2, Figure 3). These observations collectively suggested that various DAFs and DEGs have related roles, and transcription factors may potentially coordinate the synthesis of flavonoids in wax gourd.
Fine-mapping identified a typical two-component system (TCS) PRR transcription factor BhiPRR6 on chromosome 12 of wax gourd, with a C-T nonsynonymous mutation in the positive chain CDS region (+), in the hfc12 with higher levels of flavonoids. The candidate gene BhiPRR6 was highly homologous to APRR6 of Arabidopsis. The TCS signaling is an important mechanism regulating various pathways in prokaryotes and eukaryotes (Wei et al., 2011). This pathway usually consists of three signal elements: histidine kinases (HKs), response regulators (RRs), and histidine phosphate transfers (HPs) (Stock et al., 2000). The HK protein could be got phosphorylated, and this phosphate group gets continuously transferred to the conserved Asp residues in the RR receptor domain (Hwang et al., 2002). Phosphorylated RR protein directly or indirectly regulates the activity of downstream genes. The HP protein acts as a bridge in the phosphate transfer between HK and RR (Grefen and Harter, 2004). These response modifiers are divided into three subfamilies: type-A RRs with only receptor domains, type-B RRs with receptor domains fused to DNA binding domains, and PRR with atypical receptor domains (Huo et al., 2020). Type-B RRs bind to multiple cis-elements in the promoters of the target genes, such as mitogen-activated protein kinase (MAPK), or other regulatory genes, thereby participating in diverse regulatory responses (Wurgler-Murphy and Saito, 1997). The members of the PRR family have significant sequence similarity with the RRs in the putative receptor domain. They do not have a conserved D-D-K motif in the receptor domain and lack conserved Asp residues but can be used as the final product of two-component phosphorylation in plants. In this study, as Figure 1 and Figure S1B shown, BhiPRR6 was the highest expressed in fruit, and the flavonoid content of the hfc12 was significantly higher than that of the WT, indicating the importance of BhiPRR6 in regulating flavonoid biosynthesis in wax gourd.
Several factors, such as light, regulate flavonoid synthesis. Higher plants use sensory photoreceptors to accurately perceive light from UV-B to far-red wavelengths and chlorophyll and carotenoids of the photocomplex in photosynthesis (Casal, 2013). One of the most important is the superfamily of plant pigments, including photoreceptors (PHYA, PHYB, PHYC, PHYD, PHYE) that absorb red/far-red light and leuco pigments (CRY1, CRY2, CRY3) and photosensitive proteins (PHOT1, PHOTO2) (Wagner et al., 2005). In this study, the flavonoid content of the hfc12 significantly increased, accompanied by a substantially lower chlorophyll a and chlorophyll b, indicating a close association between flavonoid synthesis and light pigments (Figure 1). Various transcription factors through differential expression regulate the biosynthesis of different flavonoids in response to specific light wavelengths (Zoratti et al., 2014). Moreover, in higher plants, the light pigments may be a His protein kinase (HKs). The light signals use the light-regulated phosphorous transfer mechanism, probably using a separate receptor protein RR as an intermediate (Huq et al., 2010). Therefore, HPs and RRs play essential roles in light signaling (Yeh et al., 1997). In Arabidopsis, ARR4 transcription factor acts as a signaling module in the light signal transduction pathway (Haberer and Kieber, 2002). A study using GBS-based BSA-seq analysis in pepper identified a candidate gene CaPRR2 related to plastid development and pigment biosynthesis, affecting the levels of chlorophyll a and chlorophyll b and controlling the color of fruit (Lee et al., 2020).
Furthermore, a typical MYB DNA-binding domain was identified in the candidate gene BhiPRR6 sequence, and the mutation occurred in this region, indicating it has a function was similar with the MYB transcription factor. Studies have shown that MYB transcription factors coordinate and regulate flavonoid structural genes by activating or inhibiting their expression. MYB transcription factors related to flavonoid biosynthesis have been identified in various plants, with few responsive to light. In mango (Mangifera indica L.), MiMYB1 at the transcript level regulates the light-dependent red coloration of fruit skin (Kanzaki et al., 2020). Moreover, the MYB transcription factor directly interacts with the MYB recognition element (MRE) in the promoter region of the structural genes (Yao et al., 2017). Studies have also reported that MRE is essential for light-induced expression of structural flavonoid genes, such as CHS (Takos et al., 2006). Typical MRE cis-elements were found in the promoter region of the candidate gene BhiPRR6. Other MYB typical cis-elements also were found in the promoter region of BhiPRR6, such as MRE, MYB, MYB-like sequence, MYC, MYB-binding site, and Myc. Subsequent structural analysis revealed the typical TCS and MYB-like functions of BhiPRR6 in regulating the light-regulated pathway, leading to changes in flavonoid content of wax gourd.
Subsequently, a co-expression network was constructed using BhiPRR6 as hub gene to find why it can regulate the synthesis of flavonoids in wax gourd and leads to the change of peel color (Figure 5). Interestingly, many flavonoid-related structural genes were identified as the co-expressed genes, such as Bhi4CL and BhiUFGT; 4CL forms the backbone unit for flavonoids, and UFGT acts in the last step of flavonoid biosynthesis for glycosylation modification (Jaakola, 2013). The co-expression plot also indicated the co-expression of 6LHCA6, MYB1R1, and WD40 with the hub gene BhiPRR6. Among them, MYB-bHLH-WD40 ternary complex (MBW complex) is a typical representative to positively regulate the biosynthesis of anthocyanins and flavonoids (Xu et al., 2021). The expression pattern of the co-expressed genes showed consistency with that of BhiPRR6 and its associated target genes, indicating that they are similarly regulated in this hfc12 (Figure S2). These observations in the hfc12 suggest that BhiPRR6 binds to the co-expressed genes through various cis-elements on the promoter. The MYB DNA-binding domain of BhiPRR6 may regulate the conduction of light signals and the function of downstream genes and thereby inhibit flavonoid biosynthesis in wax gourd. In summary, it is collectively indicated that BhiPRR6 and the co-expressed genes are highly expressed during the later stages of fruit development, inhibiting the transmission of light signals and leading to the reduction in flavonoids, which in turn leads to changes in peel color. This study provided new insights into the synthesis and regulation of flavonoids in wax gourd fruits and laid the foundation for breeding wax gourd varieties with higher levels of flavonoids.
Data availability statement
The original contributions presented in the study are publicly available. This data can be found here: NCBI BioProject: PRJNA781301.
Author contributions
LX, JW and FL: conceptualization, investigation, writing – review and editing, and preparation. JW: formal analysis, writing – original draft, and writing – original draft. BM, YC, LP, WX, and YL: investigation, formal analysis, and methodology. XS and CX: conceptualization, resources, supervision, funding acquisition, project administration, and writing – review and editing. All authors contributed to the article and approved the submitted version.
Funding
This work was financed by National Natural Science Foundation of China (Grant No.32102398). The authors are grateful to Professor Xuexiao Zou from Hunan Agricultural University for providing the experimental environment and critical comments of this manuscript.
Conflict of interest
The authors declare that the research was conducted in the absence of any commercial or financial relationships that could be construed as a potential conflict of interest.
Publisher’s note
All claims expressed in this article are solely those of the authors and do not necessarily represent those of their affiliated organizations, or those of the publisher, the editors and the reviewers. Any product that may be evaluated in this article, or claim that may be made by its manufacturer, is not guaranteed or endorsed by the publisher.
Supplementary material
The Supplementary Material for this article can be found online at: https://www.frontiersin.org/articles/10.3389/fpls.2022.1019787/full#supplementary-material
Supplementary Figure 1 | (A). PCA plot of Metabonomic analysis. (B). Transcript levels of BhiPRR6 in flower, fruit, leaf, root, and stem of wax gourd. (A). RNA-seq analysis. (C). Soft threshold filter plot. The vertical axis on the left represented the square of the correlation coefficient between log(k) and log(p(k)) in the corresponding network. The higher the square of the correlation coefficient, the closer the network was to the distribution without network scale. The vertical axis of the right figure represented the mean value of all gene adjacency functions in the corresponding gene module. This study was used 7 as the soft threshold. (D). Co-express network-level cluster analysis. The branches and different colors of the clustering tree are used to indicate different gene modules. (E). GO enrichment analysis of co-expressed genes. Blue bars for cellular component, green bars for molecular function, and red bars for biological process. (F). KEGG analysis of co-expressed genes.
Supplementary Figure 2 | The expression heatmap of BhiPRR6 (red color) and all highly co-expressed genes by RNA-seq analysis. All samples were collected at 40 DAP peels of wax gourd.
References
Almeida, J., D’Amico., E., Preuss, A., F. Carbone. Vos, C., Deiml, B., Mourgues, F., et al. (2007). Characterization of major enzymes and genes involved in flavonoid and proanthocyanidin biosynthesis during fruit development in strawberry (Fragaria xananassa). Arch. Biochem. Biophys. 465, 61–71. doi: 10.1016/j.abb.2007.04.040
Azuma, A., Hiroshi, Y., Yoshiko, K., Shozo, K. (2012). Flavonoid biosynthesis-related genes in grape skin are differentially regulated by temperature and light conditions. Planta 236, 1067–1080. doi: 10.1007/s00425-012-1650-x
Baranac, J. M., Petranovi, N. A., Dimitri-Markovi, J. M. (1997). Spectrophotometric study of anthocyan copigmentation reactions. 2. Malvin nonglycosidized flavone quercetin. J. Agr. Food Chem. 45, 1698–1700. doi: 10.1021/jf9606114
Bolger, A. M., Lohse, M., Usadel, B. (2014). Usadel, trimmomatic: a flexible trimmer for illumina sequence data. Bioinformatics 30, 2114–2120. doi: 10.1093/bioinformatics/btu170
Brown, J., Meg, P., Lee, A. M. C. (2017). McCue, FQC dashboard: integrates FastQC results into a web-based, interactive, and extensible FASTQ quality control tool. Bioinformatics 33, 3137–3139. doi: 10.1093/bioinformatics/btx373
Casal, J. J. (2013). Photoreceptor signaling networks in plant responses to shade. Ann. Rev. Plant Biol. 64, 403. doi: 10.1146/annurev-arplant-050312-120221
Chen, C., Zhou, G., Chen, J., Liu, X., Lu, X., Chen, H., et al. (2021). Integrated metabolome and transcriptome analysis unveils novel pathway involved in the formation of yellow peel in cucumber. Int. J. Mol. Sci. 22, 1494. doi: 10.3390/ijms22031494
Dobre, C., Toma, E., Lucian, I., Lavinia, M. B. (2014). Benincasa hispida (wax gourd) technological characteristics and biological proprieties. Rom. Biotech. Lett. 19, 9504–9509.
Feder, A., Burger, J., Gao, S., Lewinsohn, E., Katzir, N., Schaffer, A. A., et al. (2015). A kelch domain-containing f-box coding gene negatively regulates flavonoid accumulation in muskmelon. Plant Physiol. 169, 1714–1726. doi: 10.1104/pp.15.01008
Grefen, C., Harter, K. (2004). Plant two-component systems: Principles, functions, complexity and cross talk. Planta 219, 733–742. doi: 10.2307/23388587
Haberer, G., Kieber, J. J. (2002). New insights into a classic phytohormone. Plant Physiol. 128, 354–362. doi: 10.1104/pp.010773
Hichri, I., Barrieu, F., Bogs, J., Kappel, C., Delrot, S., Lauvergeat, V. (2011). Recent advances in the transcriptional regulation of the flavonoid biosynthetic pathway. J. Exp. Bot. 62, 2465. doi: 10.1093/jxb/erq442
Hu, D. G., Li, Y. Y., Zhang, Q. Y., Li, M., Sun, C. H., Yu, J. Q., et al. (2017). The R2R3-MYB transcription factor MdMYB73 is involved in malate accumulation and vacuolar acidification in apple. Plant J. 91, 443–454. doi: 10.1111/tpj.13579
Huo, R., Liu, Z. N., Yu, X. L., Li, Z. Y. (2020). The interaction network and signaling specificity of two-component system in Arabidopsis. Int. J. Mol. Sci. 21 (14), 4898. doi: 10.3390/ijms21144898
Huq, E., Al-Sady, B., Quail, P. H. (2010). Nuclear translocation of the photoreceptor phytochrome b is necessary for its biological function in seedling photomorphogenesis. Plant J. 35, 660–664. doi: 10.1046/j.1365-313X.2003.01836.x
Hwang, I., Chen, H. C., Sheen, J. (2002). Two-component signal transduction pathways in Arabidopsis. Plant Physiol. 129, 500–515. doi: 10.1104/pp.005504
Imran, M., Abdur, R., Abu-Izneid, T. (2019). Luteolin, a flavonoid, as an anticancer agent: A review. BioMed. Pharmacother. 112, 108612. doi: 10.1016/j.biopha.2019.108612
Jaakola, L. (2013). New insights into the regulation of anthocyanin biosynthesis in fruits. Trends Plant Sci. 18 (9), 477–483. doi: 10.1016/j.tplants.2013.06.003
Jaakola, L., Hohtola, A. (2010). Effect of latitude on flavonoid biosynthesis in plants. Plant Cell Environ. 33, 1239–1247. doi: 10.1111/j.1365-3040.2010.02154.x
Jaakola, L., Poole, M., Jones, M. O. (2019). A SQUAMOSA MADS box gene involved in the regulation of anthocyanin accumulation in bilberry fruits. Plant Physiol. 153, 1619–1629. doi: 10.1104/pp.110.158279
Jiang, B., Liu, W. R., Xie, D. S., Peng, Q. W., He, X. M., Lin, Y. E., et al. (2015). High-density genetic map construction and gene mapping of pericarp color in wax gourd using specific-locus amplified fragment (SLAF) sequencing. BMC Genomics 16, 1035. doi: 10.1186/s12864-015-2220-y
Kanzaki, S., Ichihi, A., Tanaka, Y., Fujishige, S., Shimizu, K. (2020). The R2R3-MYB transcription factor MiMYB1 regulates light dependent red coloration of 'Irwin' mango fruit skin. Scientia Hortic. 272, 109567. doi: 10.1016/j.scienta.2020.109567
Koyama, K., Ikeda, H., Poudel, P. R., Goto-Yamamoto, N. (2012). Light quality affects flavonoid biosynthesis in young berries of Cabernet sauvignon grape. Phytochemistry 78, 54–64. doi: 10.1016/j.phytochem.2012.02.026
Kurlovs, A. H., Snoeck, S., Kosterlitz, O., Leeuwen, T., Clark, R. M. (2019). Trait mapping in diverse arthropods by bulked segregant analysis. Curr. Opin. Insect Sci. 36, 57–65. doi: 10.1016/j.cois.2019.08.004
Langfelder, P., Horvath, S. (2008). WGCNA: An r package for weighted correlation network analysis. BMC Bioinf. 9, 559. doi: 10.1186/1471-2105-9-559
Lee, S. B., Kim, J. E., Kim, H. T., Lee, J. M., Kim, B. S., Lee, J. M. (2020). Genetic mapping of the c1 locus by GBS-based BSA-seq revealed pseudo-response regulator 2 as a candidate gene controlling pepper fruit color. Theor. Appl. Genet. 133, 1897–1910. doi: 10.1007/s00122-020-03565-5
Li, Z., Peng, R., Yao, Q. (2021). SlMYB14 promotes flavonoids accumulation and confers higher tolerance to 2,4,6-trichlorophenol in tomato. Plant Sci. 303, 110796. doi: 10.1016/j.plantsci.2020.110796
Li, Y., Wen, C., Weng, Y. (2013). Fine mapping of the pleiotropic locus b for black spine and orange mature fruit color in cucumber identifies a 50 kb region containing a R2R3-MYB transcription factor. Theor. Appl. Gene1. 26 (8), 2187–2196. doi: 10.1007/s00122-013-2128-3
Love, M. I., Huber, W., Anders, S. (2014). Moderated estimation of fold change and dispersion for RNA-seq data with DESeq2. Genome Biol. 15, 550. doi: 10.1186/s13059-014-0550-8
Martens, S., Preuss, A., Matern, U. (2010). Multifunctional flavonoid dioxygenases: flavonol and anthocyanin biosynthesis in Arabidopsis thaliana l. Phytochemistry 71, 1040–1049. doi: 10.1016/j.phytochem.2010.04.016
Pang, Z. Q., Chong, J., Li, S. Z., Xia, J. G. (2020). MetaboAnalystR 3.0: Toward an optimized workflow for global metabolomics. Metabolites 10 (5), 186. doi: 10.3390/metabo10050186
Patro, R., Duggal, G., Love, M. I., Irizarry, R. A., Kingsford, C. (2017). Salmon provides fast and bias-aware quantification of transcript expression. Nat. Methods 14, 417–419. doi: 10.1038/nmeth.4197
Premathilake, A. T., Ni, J. B., Bai, S. L., Tao, R. Y., Ahmad, M., Teng, Y. W. (2020). R2R3-MYB transcription factor PpMYB17 positively regulates flavonoid biosynthesis in pear fruit. Planta 252 (4), 59. doi: 10.1007/s00425-020-03473-4
Ramirez-Gonzalez, R. H., Bonnal, R., Caccamo, M., Maclean, D. (2012). Bio-samtools: Ruby bindings for SAMtools, a library for accessing BAM files containing high-throughput sequence alignments. Source Code Biol. Med. 7. doi: 10.1186/1751-0473-7-6
Semagn, K., Babu, R., Hearne, S., Olsen, M. (2014). Single nucleotide polymorphism genotyping using kompetitive allele specific PCR (KASP): Overview of the technology and its application in crop improvement. Mol. Breed. 33, 1–14. doi: 10.1007/s11032-013-9917-x
Shi, Q., Du, J., Zhu, D., Li, X., Li, X. (2020). Metabolomic and transcriptomic analyses of anthocyanin biosynthesis mechanisms in the color mutant Ziziphus jujuba cv. Tailihong. J. Agr. Food Chem. 68, 15186–15198. doi: 10.1021/acs.jafc.0c05334
Smoot, M. E., Ono, K., Ruscheinski, J., Wang, P. L., Ideker, T. (2011). Cytoscape 2.8: new features for data integration and network visualization. Bioinformatics 27, 431–432. doi: 10.1093/bioinformatics/btq675
Sreenivas, K. M., Chaudhari, K., Lele, S. S. (2011). Ash gourd peel wax: Extraction, characterization, and application as an edible coat for fruits. Food Sci. Biotechnol. 20, 383–387. doi: 10.1007/s10068-011-0054-1
Stock, A. M., Robinson, V. L., Goudreau, P. N. (2000). Two-component signal transduction. Annu. Rev. Biochem. 69, 183–215. doi: 10.1146/annurev.biochem.69.1.183
Sudheeran, P. K., Sela, N., Carmeli-Weissberg, M., Ovadia, R., Alkan, N. (2021). Induced defense response in red mango fruit against colletotrichum gloeosporioides. Hortic. Res. 8, 17. doi: 10.1038/s41438-020-00452-4
Takagi, H., Abe, A., Yoshida, K., Kosugi, S., Natsume, S., Mitsuoka, C. (2013). QTL-seq: Rapid mapping of quantitative trait loci in rice by whole genome resequencing of DNA from two bulked populations. Plant J. 74, 174–183. doi: 10.1111/tpj.12105
Takos, A. M., Jaffé, F. W., Jacob, S. R., Bogs, J., Robinson, S. P., Walker, A. R. (2006). Light-induced expression of a MYB gene regulates anthocyanin biosynthesis in red apples. Plant Physiol. 142, 1216–1232. doi: 10.1104/pp.106.088104
Tomás-Barberán, F. A., Gil, M. I., Cremin, P., Waterhouse, A. L., Hess-Pierce, B., Kader, A. A. (2001). HPLC–DAD–ESIMS analysis of phenolic compounds in nectarines, peaches, and plums. J. Agr. Food Chem. 49, 4748–4760. doi: 10.1021/jf0104681
Voorrips, R. E. (2002). MapChart: Software for the graphical presentation of linkage maps and QTLs. J. Hered. 93, 77–78. doi: 10.1093/jhered/93.1.77
Wagner, J. R., Brunzelle, J. S., Forest, K. T., Vierstra, R. D. (2005). A light-sensing knot revealed by the structure of the chromophore-binding domain of phytochrome. Nature 438, 325–331. doi: 10.1038/nature04118
Wei, Y. Z., Hu, F. C., Hu, G. B., Li, X. J., Huang, X. M., Wang, H. C., et al. (2011). Differential expression of anthocyanin biosynthetic genes in relation to anthocyanin accumulation in the pericarp of litchi chinensis sonn. PloS One 6, e19455. doi: 10.1371/journal.pone.0019455
Winkel-Shirley, B. (2002). Biosynthesis of flavonoids and effects of stress. Curr. Opin. Plant Bio 5, 218–223. doi: 10.1016/S1369-5266(02)00256-X
Wurgler-Murphy, S. M., Saito, H. (1997). Two-component signal transducers and MAPK cascades. Trends Biochem. Sci. 22, 172–176. doi: 10.1016/S0968-0004(97)01036-0
Xie, D., Xu, Y., Wang, J., Liu, W., Zhang, Z. (2019). The wax gourd genomes offer insights into the genetic diversity and ancestral cucurbit karyotype. Nat. Commun. 10, 5158. doi: 10.1038/s41467-019-13185-3
Xu, P., Wu, L., Cao, M., Ma, C., Xiao, K., Li, Y., et al. (2021). Identification of MBW complex components implicated in the biosynthesis of flavonoids in woodland strawberry. Front. Plant Sci. 12. doi: 10.3389/fpls.2021.774943
Yan, H., Pei, X., Zhang, H., Li, X., Zhang, X., Zhao, M., et al. (2021). MYB-mediated regulation of anthocyanin biosynthesis. Int. J. Mol. Sci. 22, 3103. doi: 10.3390/ijms22063103
Yao, G., Ming, M., Allan, A. C., Chao, G., Li, L., Xiao, W., et al. (2017). Map-based cloning of the pear gene MYB114 identifies an interaction with other transcription factors to coordinately regulate fruit anthocyanin biosynthesis. Plant J. 92, 437–451. doi: 10.1111/tpj.13666
Yeh, K. C., Wu, S. H., Murphy, J. T., Lagarias, J. C. (1997). A cyanobacterial phytochrome two-component light sensory system. Science 277, 1505–1508. doi: 10.1126/science.277.5331.1505
Yuan, F., Yang, H., Xue, Y., Kong, D, Ye, R, Li, C, et al. (2014). OSCA1 mediates osmotic-stress-evoked Ca2+ increases vital for osmosensing in arabidopsis. Nature 514 (7522), 367. doi: 10.1038/nature13593
Yu, G., Wang, L. G., Han, Y., He, Q. Y. (2012). ClusterProfiler: an r package for comparing biological themes among gene clusters. Omics 16, 284–287. doi: 10.1089/omi.2011.0118
Keywords: wax gourd, flavonoid biosynthesis, fine-mapping, BhiPRR6, pericarp color
Citation: Xie L, Wang J, Liu F, Zhou H, Chen Y, Pan L, Xiao W, Luo Y, Mi B, Sun X and Xiong C (2022) Integrated analysis of multi-omics and fine-mapping reveals a candidate gene regulating pericarp color and flavonoids accumulation in wax gourd (Benincasa hispida). Front. Plant Sci. 13:1019787. doi: 10.3389/fpls.2022.1019787
Received: 15 August 2022; Accepted: 02 September 2022;
Published: 26 September 2022.
Edited by:
Qiusheng Kong, Huazhong Agricultural University, ChinaReviewed by:
Guangwei Zhao, Zhengzhou Fruit Research Institute, (CAAS), ChinaShuping Qu, Northeast Agricultural University, China
Shaohua Zeng, South China Botanical Garden, (CAS), China
Copyright © 2022 Xie, Wang, Liu, Zhou, Chen, Pan, Xiao, Luo, Mi, Sun and Xiong. This is an open-access article distributed under the terms of the Creative Commons Attribution License (CC BY). The use, distribution or reproduction in other forums is permitted, provided the original author(s) and the copyright owner(s) are credited and that the original publication in this journal is cited, in accordance with accepted academic practice. No use, distribution or reproduction is permitted which does not comply with these terms.
*Correspondence: Cheng Xiong, eGlvbmdjaGVuZ2h6YXVAMTYzLmNvbQ==; Xiaowu Sun, c3VueGlhb3d1MjAwN0AxMjYuY29t; Baobin Mi, bWliYW9iaW5AaHVuYWFzLmNu
†These authors share first authorship