 Md Dulal Ali Mollah1,2,3†
 Xian Zhang1,3†Li Zhao1Xiaohan Jiang1,3
 Collins O. Ogutu1,2
 Qian Peng1,3
 Mohammad A. A. Belal1,3Qiurui Yang1,3
 Yaming Cai1,3
 Elsayed Nishawy4
 Sylvia Cherono1,3
 Lu Wang1,2,5*
 Yuepeng Han1,2,5*
- 1Key Laboratory of Plant Germplasm Enhancement and Specialty Agriculture, Wuhan Botanical Garden, The Innovative Academy of Seed Design, Chinese Academy of Sciences (CAS), Wuhan, China
- 2Hubei Hongshan Laboratory, Wuhan, China
- 3University of Chinese Academy of Sciences, Beijing, ;China
- 4Genetic Resource Department, Egyptian Deserts Gene Bank, Desert Research Center, Cairo, Egypt
- 5Sino-African Joint Research Center, Chinese Academy of Sciences, Wuhan, China
Soluble sugars are an important determinant of fruit taste, but their accumulation mechanisms remain elusive. In this study, we report two vacuolar invertase inhibitor genes involved in sugar accumulation in peach, PpINHa and PpINH3. Transient overexpression of PpINH3 in peach fruits resulted in an increase in sugar content, while the opposite trend was detected for PpINHa. Unexpectedly, PpINH3 and PpINHa both had no physical interaction with vacuolar invertase (VIN). Moreover, the PpVIN genes had no or extremely low expression in fruits at the ripening stage. These results suggested that the regulatory role of PpINHa and PpINH3 in sugar accumulation is unlikely due to their interaction with PpVINs. Additionally, overexpression of PpINHa and PpINH3 had an impact on transcription of genes related to fruit sugar metabolism and transport, which is likely responsible for their regulatory role in fruit sugar accumulation. Altogether, these results indicated an important role of PpINHs in fruit accumulation in peach. Our study provides new insights into molecular mechanisms underlying sugar accumulation, which could be useful for genetic improvement of fruit taste in breeding programs of peach and other fruit crops.
1 Introduction
Peach (Prunus persica L. Batsch), a diploid deciduous perennial woody species of the family Rosaceae, is a major economic crop worldwide, especially in the temperate zones. It is cultivated as ornamental purpose and/or fruit production. In addition, peach also serves as a model plant for comparative and functional genomic studies in the Rosaceae family due to its short juvenile period, self-compatibility and a small genome size of ~ 230 Mb per haploid (Verde et al., 2013). Peach consumption has showed a downward trend in recent years due to poor or inconsistent flavor quality (Cirilli et al., 2016). Thus, improvement of fruit quality is becoming one of the most important goals of peach breeding programmes.
Sweetness has a great influence on the degree of consumer satisfaction for peach fruits. Sweetness is attributed to the composition and content of soluble sugars, such as sucrose, glucose, fructose and sorbitol. Hence, soluble sugars represent a fundamental component of fruit edible quality (Colaric et al., 2005). Fruit sugar metabolism is a complex metabolic pathway that begins with the transport of photoassimilates through phloem sieve elements into the sink tissue. In the family Rosaceae including peach, sorbitol acts as the principal photosynthate and translocated sugar, in addition to sucrose, the most common translocated carbon (Zanon et al., 2015). Sorbitol enters into fruit cells upon phloem unloading, while sucrose either directly enters into fruit cells, or is hydrolyzed into glucose and fructose by cell wall invertase (CIN) that are subsequently taken up into fruit cells. The hydrolysis of sucrose can also occur in the vacuole by vacuolar invertase (VIN). In cytoplasm, sorbitol is converted into fructose and glucose by sorbitol oxidase (SOX) and sorbitol dehydrogenase (SDH), respectively. Sugar metabolic pathway in cytoplasm involves various enzymes, such as neutral invertase (NIV), fructokinase (FK), hexokinase (HK), sucrose synthase (SuSy), and sucrose phosphate synthase (SPS), producing different primary metabolites such as fructose-6-phosphate (F6P) and soluble sugars (Lombardo et al., 2011; Wang et al., 2016). Transport of soluble sugars into the vacuole is mediated by sugar transporters, such as tonoplast sugar transporters (TSTs), vacuolar glucose transporters (VGTs), and sucrose transporters (SUCs/SUTs) (Eom et al., 2015).
In peach, fruit sugar content not only varies throughout development, but it also shows a great variation among cultivars (Vimolmangkang et al., 2016). Overall, total sugar content shows an increasing trend during fruit development and reaches a peak at ripening stages, with sucrose being the predominant sugar and sorbitol being the minor one in cultivated peaches. SuSy and VINs are likely responsible for the predominant accumulation of sucrose in peach fruits (Vimolmangkang et al., 2016), while SDH that converts sorbitol into fructose plays an important role in determining fructose content (Kanayama et al., 2005). To investigate the genetic basis of fruit sugar accumulation in peach, quantitative trait locus (QTL) mapping has been extensively conducted and QTLs for fruit sugar content have been identified on nearly all chromosomes (Chrs) (Dirlewanger et al., 1999; Etienne et al., 2002; Dirlewanger et al., 2004; Quilot et al., 2005; Illa et al., 2011; Salazar et al., 2014; Zeballos et al., 2016; Mora et al., 2017; Font I Forcada et al., 2018). However, few candidate genes for fruit sugar content have been identified. A recent functional study shows that a TST gene located in the QTL interval on Chr 5 is involved in the regulation of fruit sugar accumulation in peach (Peng et al., 2020), which was confirmed in a later study (Yu et al., 2021). The important roles of TSTs in fruit sugar accumulation have been also demonstrated using forward and reverse genetic approaches in many other crops, such as sugar beet (Jung et al., 2015), watermelon (Ren et al., 2018), Cucumis melo (Cheng et al., 2018), apple and tomato (Ma et al., 2017; Zhu et al., 2021). Nevertheless, the complete mechanism underlying fruit sugar accumulation is yet to be elucidated in peach.
For the complex trait of fruit organoleptic quality, transcriptome sequencing has been used to identify candidate genes responsible for sugar content, which provides a basis for understanding molecular mechanism regulating sugar metabolism and accumulation (Aslam et al., 2019). The availability of the high-quality draft genome of the doubled haploid peach cv. ‘Lovell’ has facilitated identification of candidate genes controlling various metabolic pathways in peach (Verde et al., 2013). In this study, the profiles of fruit sugar accumulation in four cultivars and one wild relative Prunus davidiana were investigated and candidate genes for fruit sugar accumulation were also identified using comparative transcriptome analysis. Our results are helpful for understanding the mechanism of fruit sugar accumulation in peach and other fruit crops.
2 Materials and methods
2.1 Plant materials
All peach accessions used in this study, including two yellow-fleshed and freestone nectarine cultivars, Ligelante (LG) and Meiguowanyou (MY), two white-fleshed and clingstone peach cultivars Xiacui (XC) and Xiahui (XH), and one wild relative Shantao (P. davidiana), are maintained in the orchard of the Northwest A & F University, Shaanxi Province, China. All the four cultivars tested were grafted on Shantao rootstock and have similar ripening periods. Peach trees were planted at a spacing of 4 m × 1 m and grown under standard conventional field practices, including irrigation, fertilization and pest control. Fruit samples were collected at 34, 75 and 117 days after full bloom (DAF), which corresponded to the first exponential growth stage, the second exponential growth stage and the ripening stage, respectively. Three biological replicates were conducted for each treatment and each replicate contained 6-8 fruits. Fruit sample were peeled, cut into small pieces, frozen in liquid nitrogen, and then stored at -80°C for use.
2.2 Measurement of fruit sugar content and composition
Fruit sugar extraction was conducted according to our previous study (Vimolmangkang et al., 2016). Measurement of sugar type and content was performed using high-performance liquid chromatography (HPLC) following the previously reported protocol (Ma et al., 2015). Briefly, the sugar contents of fruit samples were measured using an Agilent 1260 Infinity HPLC system (Milford, MA, USA) equipped with a refractive index detector (Shodex RI-101; Shodex Munich, Germany). A Transgenomic COREGET-87C column (7.8 mm × 300 mm, 10 μm) with a guard column (Transgenomic CARB Sep Coregel 87C) was used to perform separation and column temperature was maintained at 85°C by a Dionex TCC-100 thermostated column compartment. Flow rate at the mobile phases were maintained at the rate of 0.6 mL/min with degassed, distilled, and deionized water. Sugar concentrations were expressed on a fresh weight (FW) basis. Total sugar content was specified by the amount of four sugar components, sucrose, fructose, glucose, and sorbitol.
2.3 RNA extraction, RNA-Seq library construction and sequencing
Fruit samples were ground into powder and then subjected to total RNA extraction using EASYspin Plus Plant RNA Mini Kit (Aidlab, Beijing, China) according to the manufacturer’s instructions. RNA concentration and purity were checked with the ND-1000 UV–Vis spectrophotometer (Nanodrop®, http://www.nanodrop.com/), while RNA integrity was evaluated with the RNA Nano 600 Assay Kit of the Bioanalyzer 2100 system (Agilent Technologies, CA, USA).
NEBNext® Ultra ™ RNA Library Prep Kit for Illumina® (NEB, USA) were used to construct the RNA sequencing libraries according to the manufacturer’s instruction. The quality of these libraries was also checked through Agilent Bioanalyzer 2100 system. The index-coded samples were clustered using the HiSeq PE Cluster Kit v4-cBot-HS (Illumina) according to manufacturer’s instruction. After cluster generation, the libraries were sequenced on an Illumina sequencing platform with a paired-end 150-bp sequencing strategy.
2.4 Data process and differential gene expression analysis
Adaptor sequences, empty reads and low-quality reads were trimmed from raw data, with quality scores less than Q30. The high-quality clean reads were aligned to the reference genome of peach (Verde et al., 2013) using HISAT2 (Kim et al., 2015), and the index of the reference genome was built using Bowtie2.0.6 (Langmead et al., 2009). The number of clean reads mapped to each gene was counted using the HTSeq v0.6.0 software. The expression level of each gene was calculated according to the value of expected number of fragments per kilobase of transcript sequence per millions base pairs sequenced (FPKM). The read counts between samples were standardized through scaling the number of reads in a given library to a common value across all sequenced libraries using the edgeR software (version 2.6.10) (Robinson et al., 2010). In the comparing data pairs, the genes were firstly filtered manually with one FPKM value > 0.1 in at least one sample. Differentially expressed genes (DEGs) were identified using the program DESeq2 (Love et al., 2014). P-value was adjusted by the Benjamini and Hochberg approach. Genes with a threshold false discovery rate (FDR) ≤ 0.05 and a log2-fold change ≥ 1 were defined as DEGs. The intersections of DEGs were calculated using the online Draw Venn Diagram program (http://bioinformatics.psb.ugent.be/webtools/Venn/). Pearson correlation coefficient was used to estimate whether there was a significant relationship between gene expression levels and sugar contents.
2.5 Gene ontology visualization and enrichment analysis
Gene Ontology (GO) annotation results of DEGs were visualized and compared with the online program WEGO (Web Gene Ontology Annotation Plot, http://wego.genomics.cn/). GO enrichment of DEGs was implemented using Cytoscape software version 3.8.0 (Shannon et al., 2003) as well as its plugin BiNGO version 3.0.4 (Maere et al., 2005) with default the parameters. Gene networks were visualized using BiNGO.
2.6 Gene expression analysis using quantitative real-time RT-PCR
Total RNA was extracted using the Universal Plant Total RNA Extraction Kit (BioTeke, Beijing, China) according to the manufacturer’s instructions. The RNA samples were treated with DNase I (Takara, Dalian, China), and then subjected to cDNA synthesis with cDNA Synthesis Kit (VAZYME Biotech co. Ltd., Nanjing, China) according to the manufacturer’s instructions. qRT-PCR was conducted in a total volume of 20 µL reaction, which contained 10 µL of 2X Hieff® qPCR SYBR Green Master Mix (High Rox) reagent (YEASEN biotech coo. Ltd., Shanghai, China), 2.0 µL cDNA sample and 0.4 µL of each primer (0.2 µM). qRT-PCR was performed using the Applied Biosystems stepone plus Real-Time PCR System (Applied Biosystems, USA) and the program was as follows: 5 min at 95°C followed by 40 cycles of heating at 95°C for 10 s, with annealing temperature of 60°C for 30 S. The peach gene eIF-4E was used as the internal control. All analyses consisted of three biological replications. Gene expression level was quantified using the 2-ΔΔCT method (Livak and Schmittgen, 2001). Primer sequences used for qRT-PCR analysis are listed in Table S1.
2.7 Gene functional analysis by transient overexpression in peach fruits
Total RNA extraction and cDNA synthesis was conducted following the same protocol as described above. The full-length coding sequence was introduced into pSAK277 and then transformed into the A. tumefaciens strain GV3101. The transformed Agrobacterium was cultured at 28°C until OD600nm reached to the range of 1.5 ~ 2.0. Agrobacterium was harvested by centrifuge at 1,000g for 5min. The precipitate was resuspended using the infiltration buffer that contained 10 mM 2-(N-morpholino) ethanesulphonic acid (MES), 10 mM MgCl2 and 150 μM acetosyringone, and was adjusted to pH5.6 with 1M NaOH. The concentration of Agrobacterium was diluted to an OD600nm value of approximately 0.4 and used to infiltrate peach fruits of ‘Xia Huanjin’ at the ripening stage using our previously reported protocol (Peng et al., 2020). Agrobacterium cultures carrying candidate gene was injected into one side of the fruit, while the opposite side infiltrated with Agrobacterium cultures carrying the empty vector was used as control. At least three biological replications were carried out for each treatment, and sample collection was performed 5 days after infiltration.
2.8 RNA-seq data from the fruits of peach cultivars
Fruit transcriptome data for all tested cultivars were retrieved from our previous study, including two stages of 75 and 117 DAFB with three biological replicates for each stage (Zheng et al., 2021).
3 Results
3.1 Difference in fruit sugar accumulation between cultivated and wild peaches
The contents of sugar components in fruits of four cultivars, LG, MY, XC and XH, and one wild relative Shantao (ST), at 34, 75 and 117 DAF, which were designated S1, S2 and S3, respectively (Figure 1A), were measured. Total sugar content showed an increasing trend in cultivated fruits throughout development, while a V-shape trend was observed for ST, with the highest level at S3 (Figure 1B). Total sugar contents at S1 - S3 in cultivars were all significantly higher than those in ST. For three cultivars, LG, XC and XH, sucrose content had a dramatic increase during late stages of fruit development, while both glucose and fructose contents showed a relatively small variation throughout fruit development. For cultivar MY, sucrose content showed a slight increase throughout fruit development, while both glucose and fructose contents had a dramatic increase during late stages of fruit development. Accordingly, sucrose represented the predominant soluble sugar in ripen fruits of LG, XC and XH, accounting for 43%, 67% and 74% of total sugars, respectively. However, monosaccharides instead of sucrose represented the main soluble sugars in ripen fruits of MY as glucose, fructose and sucrose accounted for 34%, 37% and 15% of total sugars, respectively.
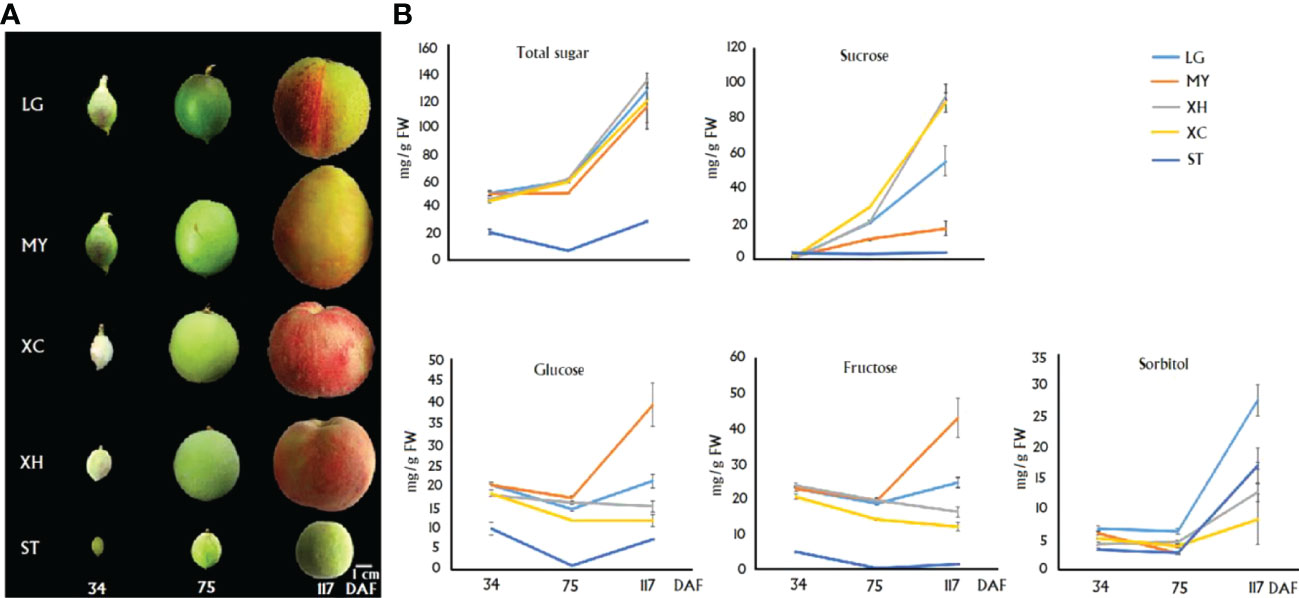
Figure 1 Graphical presentation of fruits at three differenet development stages. (A) and the correspoding sugar contents (B) in four cultivars and a wild relative ST. Total sugar represents the sum of glucose, fructose, sucrose and sorbitol. Error bars indicate the standard error (SE) of three biological replicates.
In wild relative ST, sucrose content was almost constant throughout fruit development, while a decreasing trend and a V-shape trend were observed for fructose and glucose contents, respectively. Sorbitol content showed an increase during late stages of fruit development. Accordingly, sorbitol represented the predominant sugar compound in fruits of ST at the S3 stage, accounting for 58% of total sugars, followed by glucose (25%), sucrose (13%) and fructose (4%). Sorbitol also showed a dramatic accumulation during late stages of fruit development in LG and MY, accounting for 22% and 14% of total sugars in fruits at S3, respectively. By contrast, sorbitol content displayed a slight increase throughout fruit development in two cultivars, XH and XC.
3.2 Identification of DEGs associated with sugar content in fruits of peach
Since total sugar contents in cultivated fruits throughout development were much higher than those in wild fruits of ST, genes differentially expressed between cultivated and wild fruits were identified using comparative transcriptome analysis. For wild relative ST, six RNA-Seq libraries were constructed from fruit samples at S2 and S3 with three biological replicates per stage and subsequently sequenced (Table 1). Biological replicates had high correlation coefficients of 0.99~1.0 (Figure S1), suggesting that the generated RNA-Seq data were suitable for differentially expressed gene (DEG) analysis. On average, each library consisted of 44.5 million clean reads, with 6.7 Gb in size. Approximately 39.4 million (88.5%) clean reads were anchored to the peach reference genome, with 38.2 million clean reads (86.5%) uniquely mapped. The RNA-seq data of the wild fruits were compared to our previously reported transcriptome data of cultivated fruits at the S2 and S3 stages (Zheng et al., 2021).
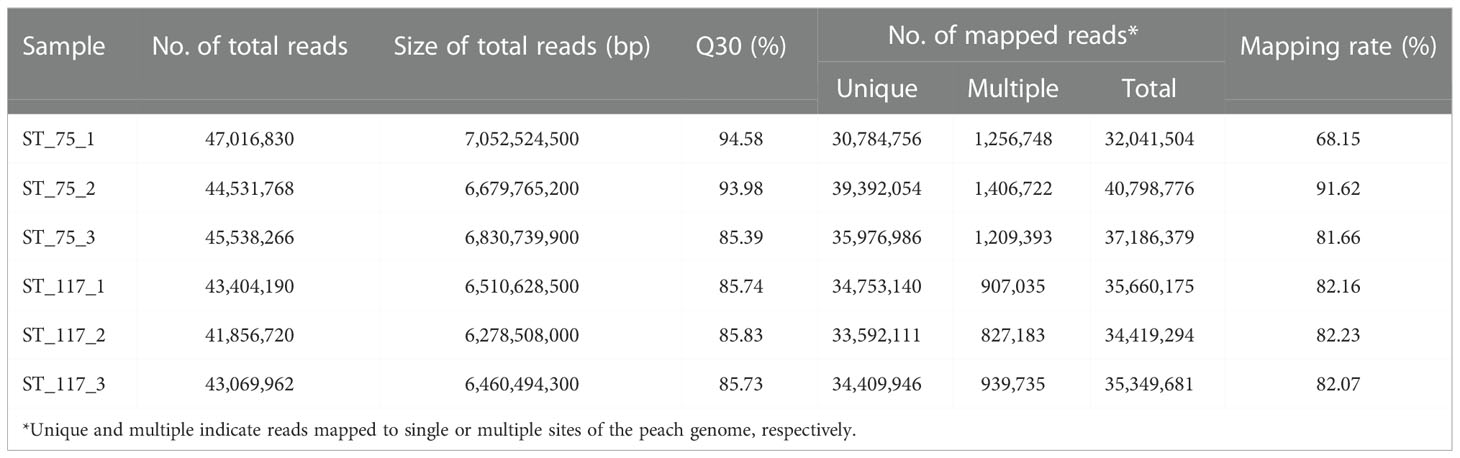
Table 1 Summary of the clean RNA-Seq reads for each treatment*.
Comparative transcriptome analysis revealed 2,980, 2,801, 3,712, and 3,711 DEGs that were up-regulated in fruits of LG, MY, XC and XH at S3, respectively, relative to fruits at S3 of ST, with 1,312 common DEGs (Figure 2A). By contrast, 5,453, 4,845, 5,733, and 6,126 DEGs were down-regulated in fruits of LG, MY, XC and XH at S3, respectively, with 2,668 common DEGs (Figure 2B). Since total sugar content showed a significant increase in cultivated fruits during late stages of fruit development, genes differentially expressed between the S2 and S3 stages were investigated. As a result, 5,625, 5,290, 5,246, and 6,173 genes were identified to be up-regulated in fruits of LG, MY, XC and XH at S3, respectively, with 2,290 common DEGs, while 4,364, 4,224, 3,849, and 4,877 genes were down-regulated in fruits of LG, MY, XC and XH at S3, respectively, with 1,790 common DEGs. The intersection of the above 1,312 and 2,290 commonly up-regulated DEGs consisted of 424 genes (Table S2), whose transcript levels were positively correlated with total sugar content. By contrast, the intersection of the above 2,668 and 1,790 commonly down-regulated DEGs contained 505 genes (Table S2), whose transcript levels were negatively correlated with total sugar content. To validate the RNA-Seq data, the expression levels of seven genes (Table S1) randomly selected from the DEGs associated with sugar accumulation were validated using qRT-PCR (Figure S2). The qRT-PCR results of all tested genes were well consistent with those of RNA-seq data, suggesting that the results of comparative transcriptome analysis are reliable in this study.
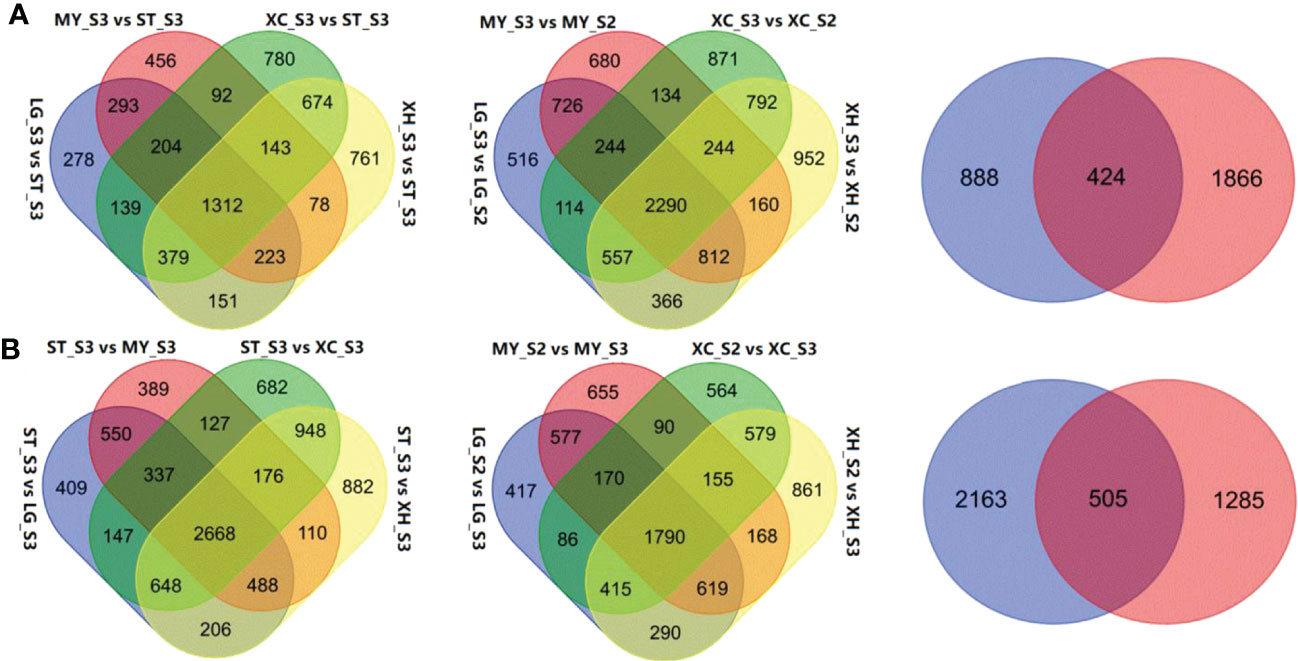
Figure 2 Identification of DEGs associated with total sugar content in peach fruits between different genotypes or developmental stages. (A), Venn diagrams showing the numbers of DEGs up-regulated in cultivated fruits at the S3 stage relative to wild fruits (left), up-regulated in cultivated fruits at the S3 stage relative to the S2 stages (middle), the intersection of the commonly up-regulated genes across cultivars and the commonly up-regulated genes across the developmental stages (right). (B), Venn diagrams showing the numbers of DEGs down-regulated in cultivated fruits at the S3 stage relative to wild fruits (left), down-regulated in cultivated fruits at the S3 stage relative to the S2 stages (middle), the intersection of the commonly down-regulated genes across cultivars and the commonly down-regulated gene across the developmental stages (right).
Of the 424 up-regulated intersection genes, one (Prupe_5G006300) is a previously reported sugar transporter PpTST1 that has been proven to regulate fruit sugar accumulation (Peng et al., 2020). Besides PpTST1, two encoded early responsive to dehydration 6-like (ERD6-Like) monosaccharide transporters, Prupe_4G042700 and Prupe_3G066300, designated PpERD6-Like1 and PpERD6-Like2, respectively. PpERD6-Like1 and PpERD6-Like2 both had similar expression patterns to PpTST1 (Figure S3), and their expression levels were significantly positively correlated with total sugar content and sucrose content (Table 2). These results suggested that these two PpERD6-Like genes have putative roles in fruit sugar accumulation. Three belonged to sugar metabolic pathway genes, including two SPS genes, Prupe_1G159700 and Prupe_1G483200, designated PpSPS1 and PpSPS2, respectively, and one SuSy gene, Prupe_7G192300 designated PpSuSy1. The expression of both PpSPS1 and PpSPS2 had a significant positive correlation with total sugar content and sucrose content (Table 2), consistent with previous reports that PpSPS2 is good candidate for fruit sugar accumulation (Li et al., 2021). The expression of PpSuSy1 was positively and significantly correlated with sucrose content, and positively but not significantly with total sugar content (Table 2). One (Prupe_1G114500) encoding plant invertase inhibitor, which was termed PpINH3 but with lack of any function evidence in a recent study (Wang et al., 2020). The expression of PpINH3 was significantly positively correlated with total sugar content and sucrose content (Table 2), suggesting its putative role in fruit sugar accumulation.
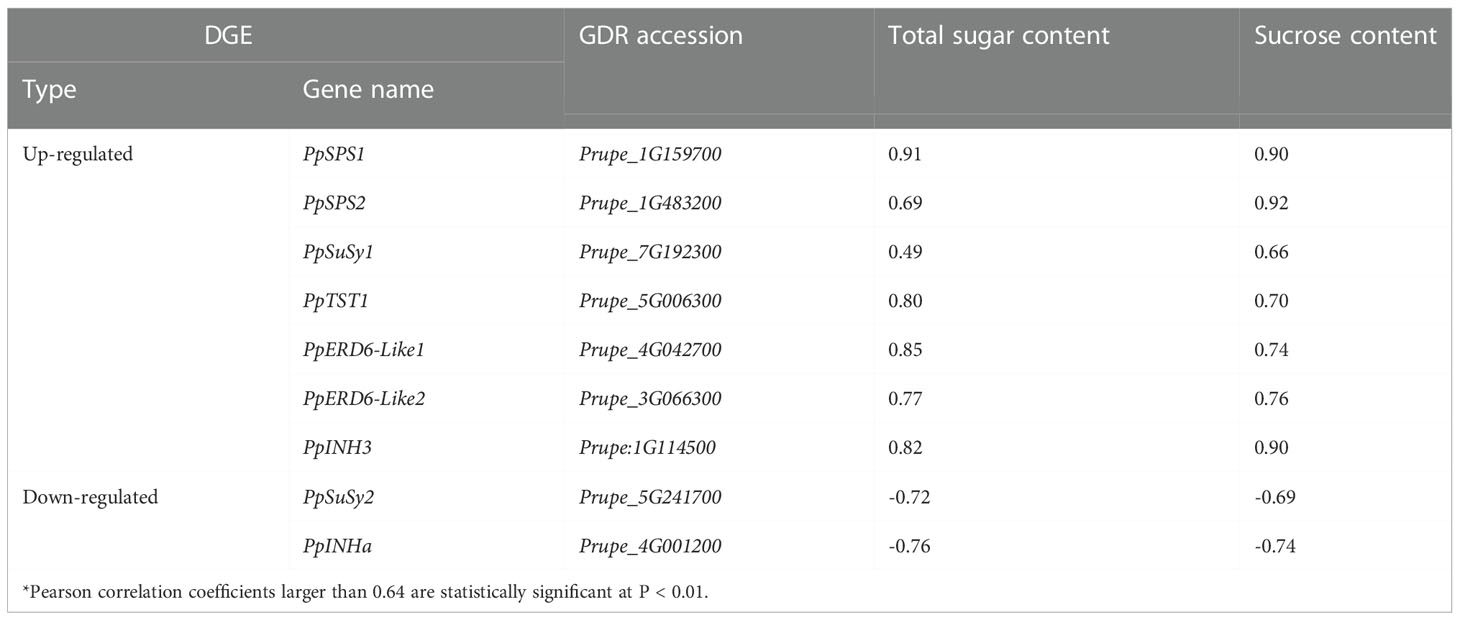
Table 2 Pearson correlation coefficients between gene expression and sugar content*.
Of the 505 down-regulated intersection DEGs, one (Prupe_5G241700) belonged the SuSy gene family, designated PpSuSy2, and one (Prupe_4G001200) encoded an invertase inhibitor, designated PpINHa. The expression levels of PpSuSy2 and PpINHa were significantly negatively correlated with total sugar content and sucrose content (Table 2), suggesting their potential role in fruit sugar accumulation. Notably, PpSuSy2 and PpINHa both showed weak expression in cultivated fruits at the ripening stage, but with high expression in wild fruits of ST (Figure S3). By contrast, their homologous genes PpSuSy1 and PpINH3 displayed high expression in cultivated fruits at the ripening stage, but weakly expressed in wild fruits of ST (Figure S3).
Taken together, the above results indicated 9 candidate DEGs associated with fruit sugar accumulation, including 4 sugar metabolic pathway genes, PpSPS1/2 and PpSuSy1/2, 3 sugar transporter genes, PpTST1 and PpERD6-Like1/2, and 2 regulators of sugar accumulation, PpINH3 and PpINHa. The homologous gene pairs PpSuSy1/2 and PpINH3/a may have undergone functional divergence. Since few reports are available on the functional role of the INH genes in sugar accumulation, PpINH3 and PpINHa were selected for further functional analysis.
3.3 Transient overexpression of PpINHa and PpINH3 had opposite effect on sugar accumulation in peach fruits
As mentioned above, PpINH3 and PpINHa were found to act as putative positive and negative regulators of sugar accumulation, respectively. To validate this finding, we conducted functional analysis through their transient overexpression in peach fruits. Five days after transformation, gene expression level and sugar content were measured in the fleshy tissue surrounding the infiltration sites. As a result, the expression level of PpINH3 in the flesh tissues infiltrated with PpINH3 was significantly higher than that in the flesh tissues infiltrated with the empty vector (EV) (Figure 3A). The sucrose and total sugar contents in the PpINH3-infiltrated flesh tissues were significantly higher than those in the EV-infiltrated flesh tissues (Figure 3A), which is consistent the above-mentioned finding of a positive correlation between the PpINH3 expression and the content of either total sugar or sucrose. Likewise, the expression level of PpINHa in the flesh tissues infiltrated with PpINHa was significantly higher compared to the flesh tissues infiltrated with empty vector (Figure 3B). However, transient overexpression of PpINHa resulted in a significant decrease in both sucrose and total sugar contents (Figure 3B), consistent with the above-mentioned finding of a negative correlation between the PpINHa expression and the content of either total sugar or sucrose. Altogether, these results indicated that PpINH3 and PpINHa are both involved in the regulation of fruit sugar accumulation, but they have undergone functional divergence.
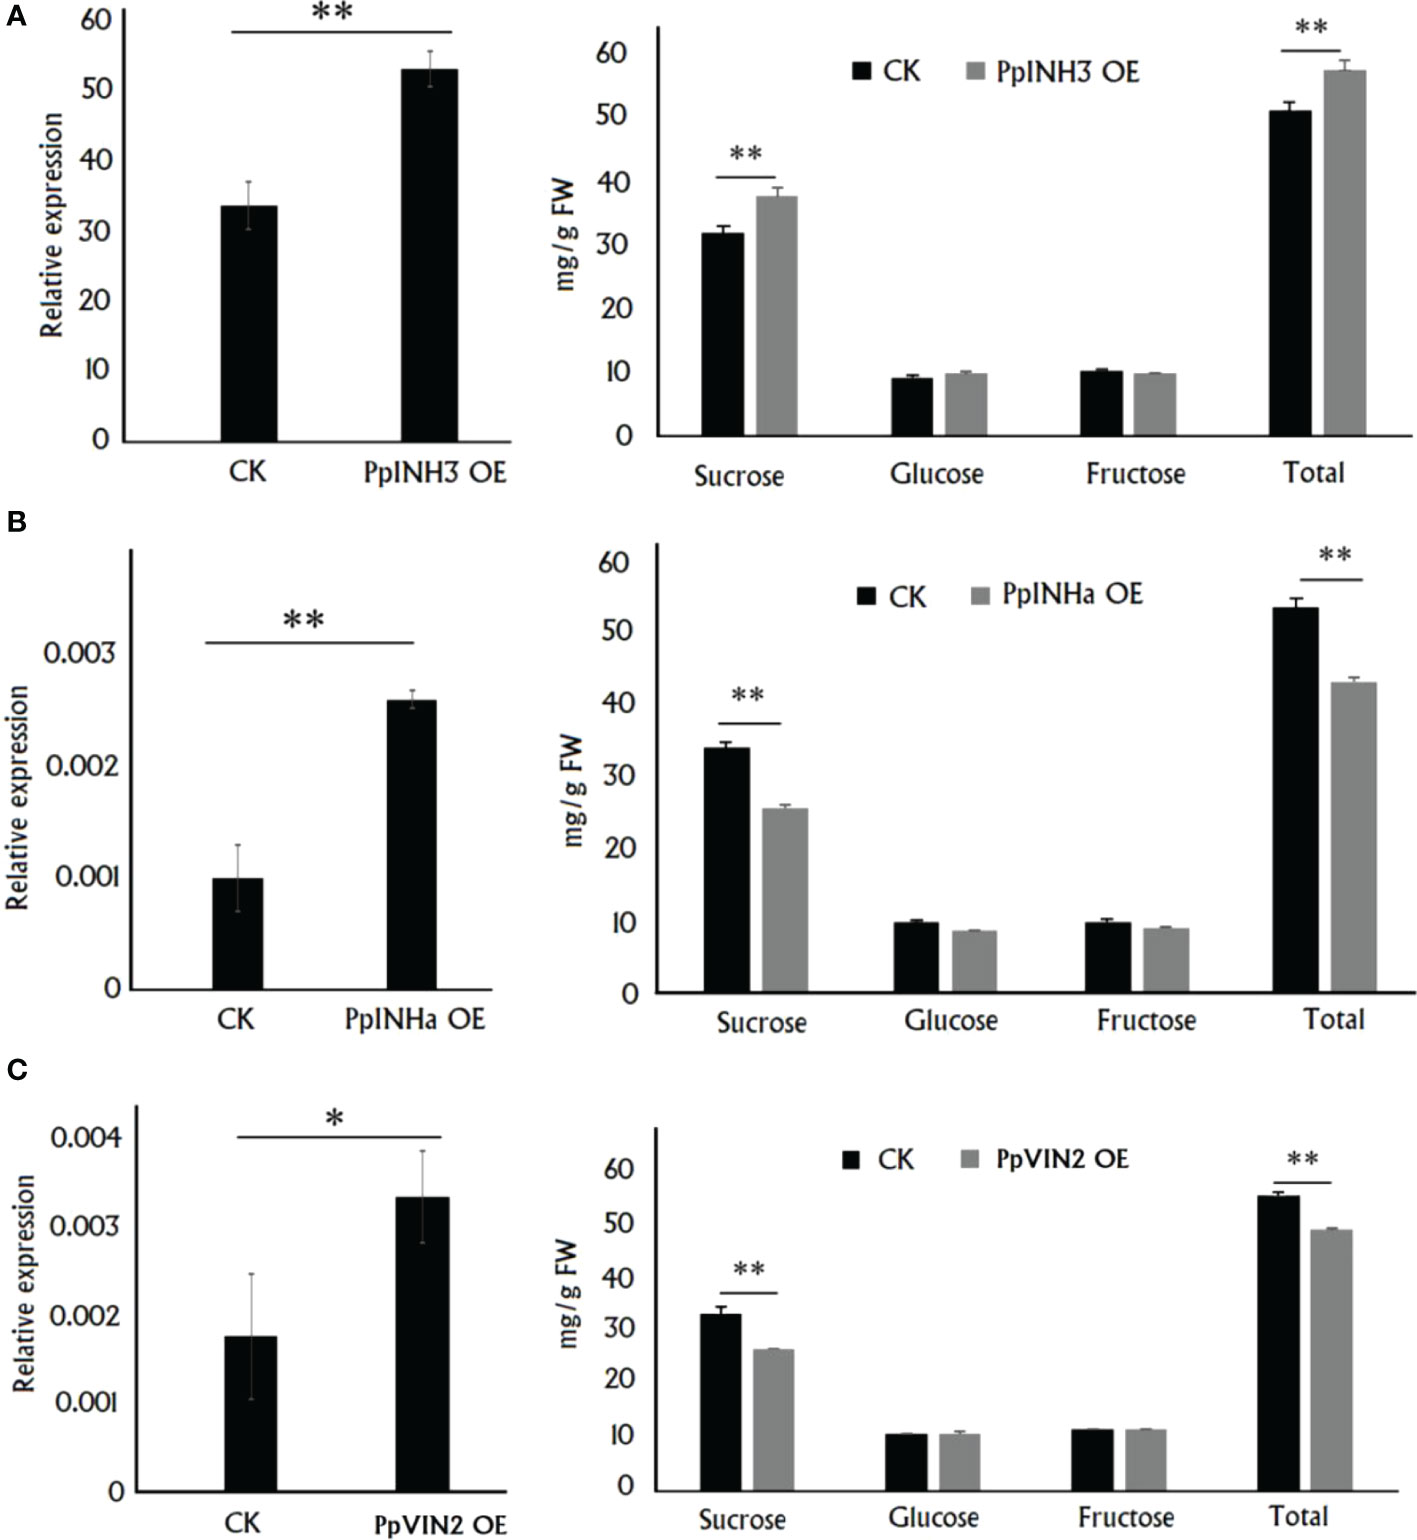
Figure 3 Functional analysis of PpINHs and PpVIN2 via their transient overexpression in peach fruits at the ripening stage. (A), The PpINH3 expression and sugar accumulation in the fleshy tissue surrounding the sites infiltrated with either PpINH3 or the empty vector (CK). (B), The PpINHa expression and sugar accumulation in the fleshy tissue surrounding the sites infiltrated with either PpINH3 or the empty vector. (C), The PpVIN2 expression and sugar accumulation in the fleshy tissue surrounding the sites infiltrated with either PpINH3 or the empty vector. ** and * indicate statistical significance at P < 0.01 and P < 0.05, respectively, based on Student’s t-test.
3.4 The regulatory role of PpINHa and PpINH3 in sugar accumulation is unlikely due to their interaction with PpVINs
Since the INH genes are known to function as invertase inhibitor, we investigated the interaction of PpINHa and PpINH3 with the invertase gene. Firstly, subcellular localization assay showed that the GFP fluorescence of PpINHa-GFP or PpINH3-GFP was exactly merged with mCherry fluorescence of the tonoplast marker RFP (Figure 4), suggesting that PpINHa and PpINH3 were both located in the tonoplast. Therefore, we focused on whether PpINHa and PpINH3 functioned as vacuolar invertase inhibitor. Our previous study showed that there are two vacuolar invertase genes PpVIN1 and PpVIN2 in the peach genome, and they were expressed in in immature fruits, but with extremely low or no expression in ripening fruits (Vimolmangkang et al., 2016). Similar results were also detected in this study (Table S3). PpVIN2 had higher levels of expression throughout fruit development than did PpVIN1 (Table S3). Therefore, PpVIN2 was selected to investigate the interaction between PpVINs and PpINH3/a.
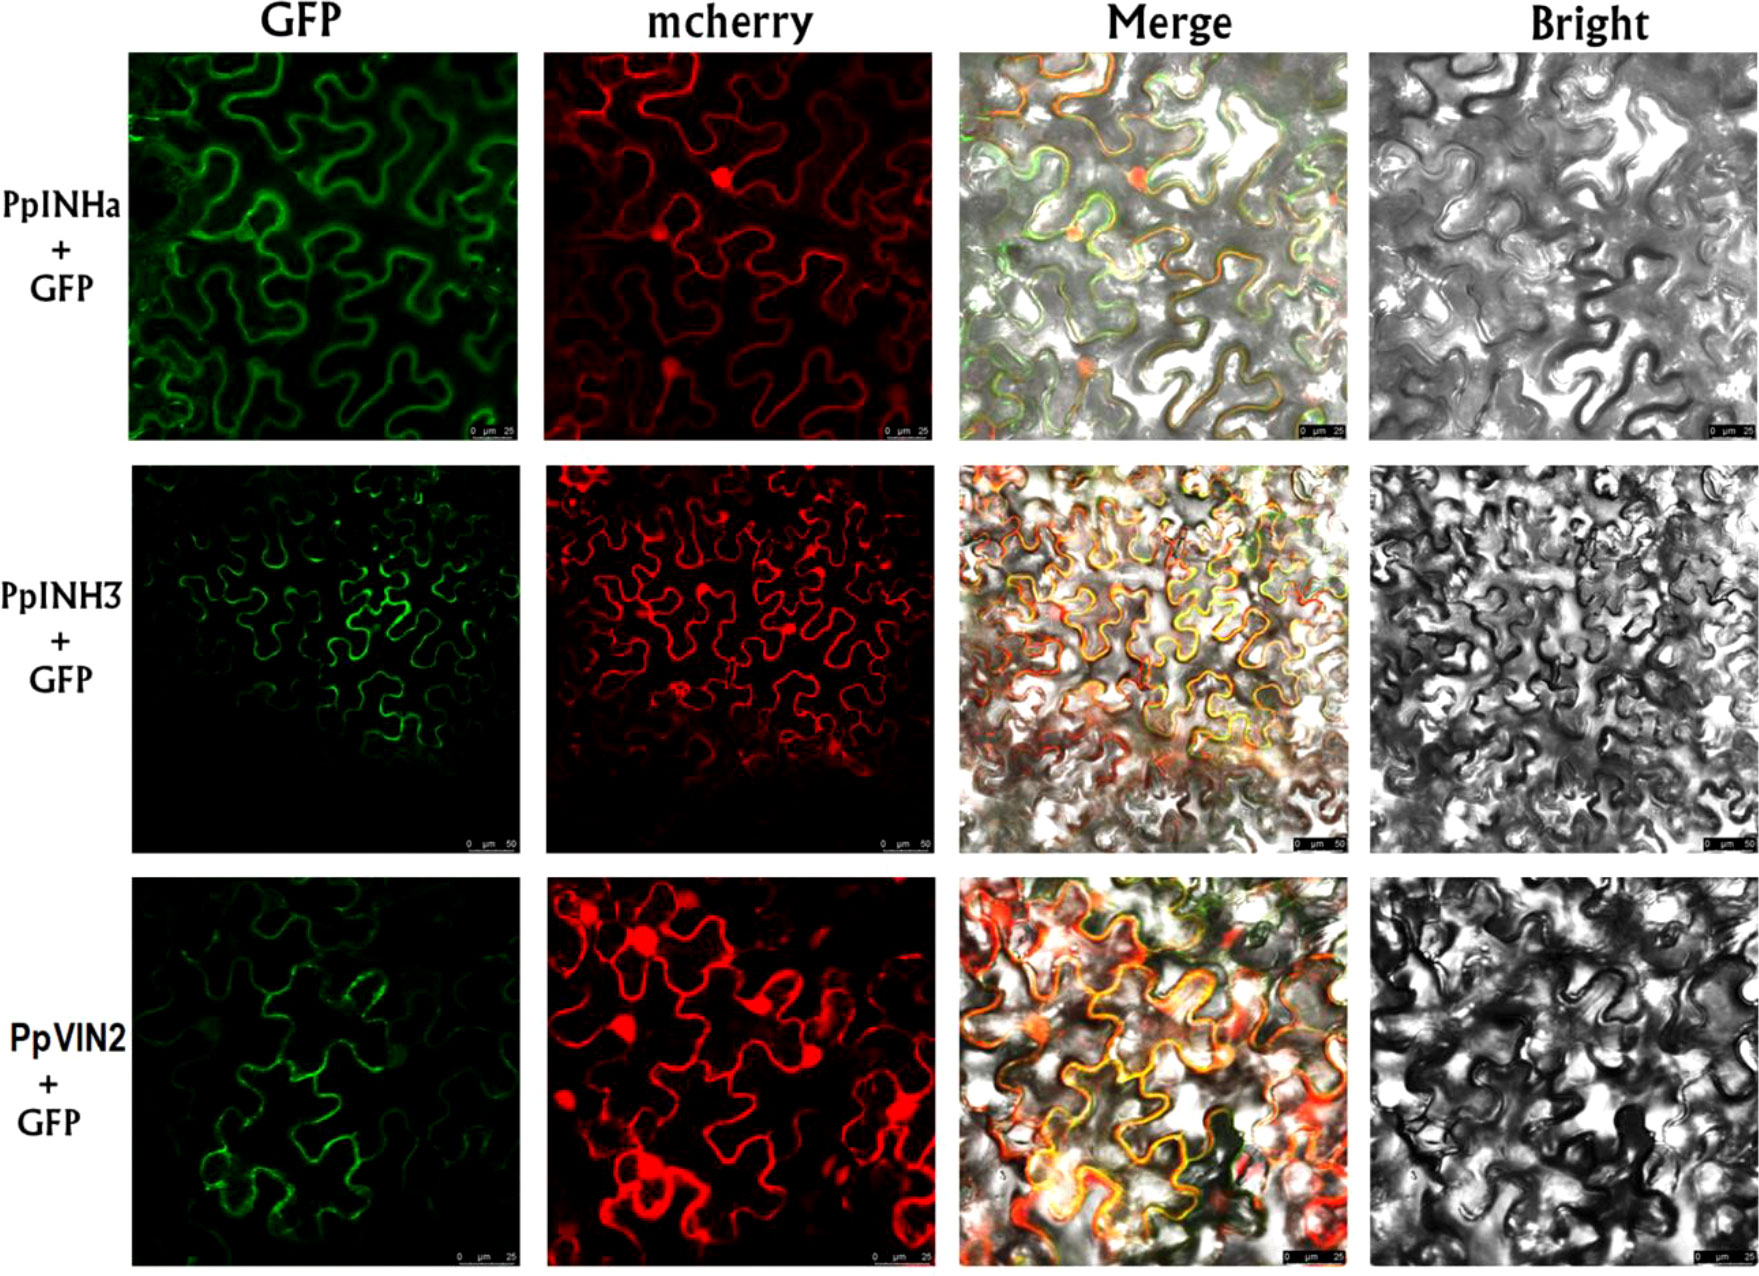
Figure 4 Subcellular localization of PpINHa, PpINH3 and PpVIN2 in tobacco leaves. Co-expression of psuper1300GFP-PpINHa, psuper1300GFP-PpINH3 or psuper1300GFP-PpVIN2 with tonoplast marker RFP in bright field, GFP channel, mCherry channel, and merged channel, respectively. The scale bars represent 25 or 50 µm.
Secondly, we validated the function of PpVIN2 using transient overexpression assay in peach fruits. Transient overexpression of PpVIN2 in fruits of ‘Xia Huanjin’ caused a significant decrease in sucrose and total sugar contents (Figure 3C), suggesting its negative role in fruit sugar accumulation. Next, we conducted subcellular localization assay and the result indicated that PpVIN2, like PpINHa and PpINH3, was located in the tonoplast (Figure 4), suggesting the possibility of interaction between PpVIN2 and PpINH3/a. To validate the interaction of PpINHa and PpINH3 with PpVIN2, we then performed yeast two-hybrid (Y2H) assay. The coding sequence of PpVIN2 was introduced into the bait pGBKT7 vector, while the coding regions of PpINHa and PpINH3 were individually inserted into the prey pGADT7 vector. Yeast cells containing either PpINHa or PpINH3 were mated with those containing PpVIN2. However, yeast cells containing PpINHs and PpVIN2 were unable to grow on the selective QDO/X/A medium (Figure 5), indicating that PpINHa and PpINH3 have no interaction with PpVIN2. As mentioned above, PpVIN1 and PpVIN2 had no or extremely low expression in ripening fruits. These results suggested that the role of PpINHa and PpINH3 in sugar accumulation could not be attributed to their interaction with PpVINs.
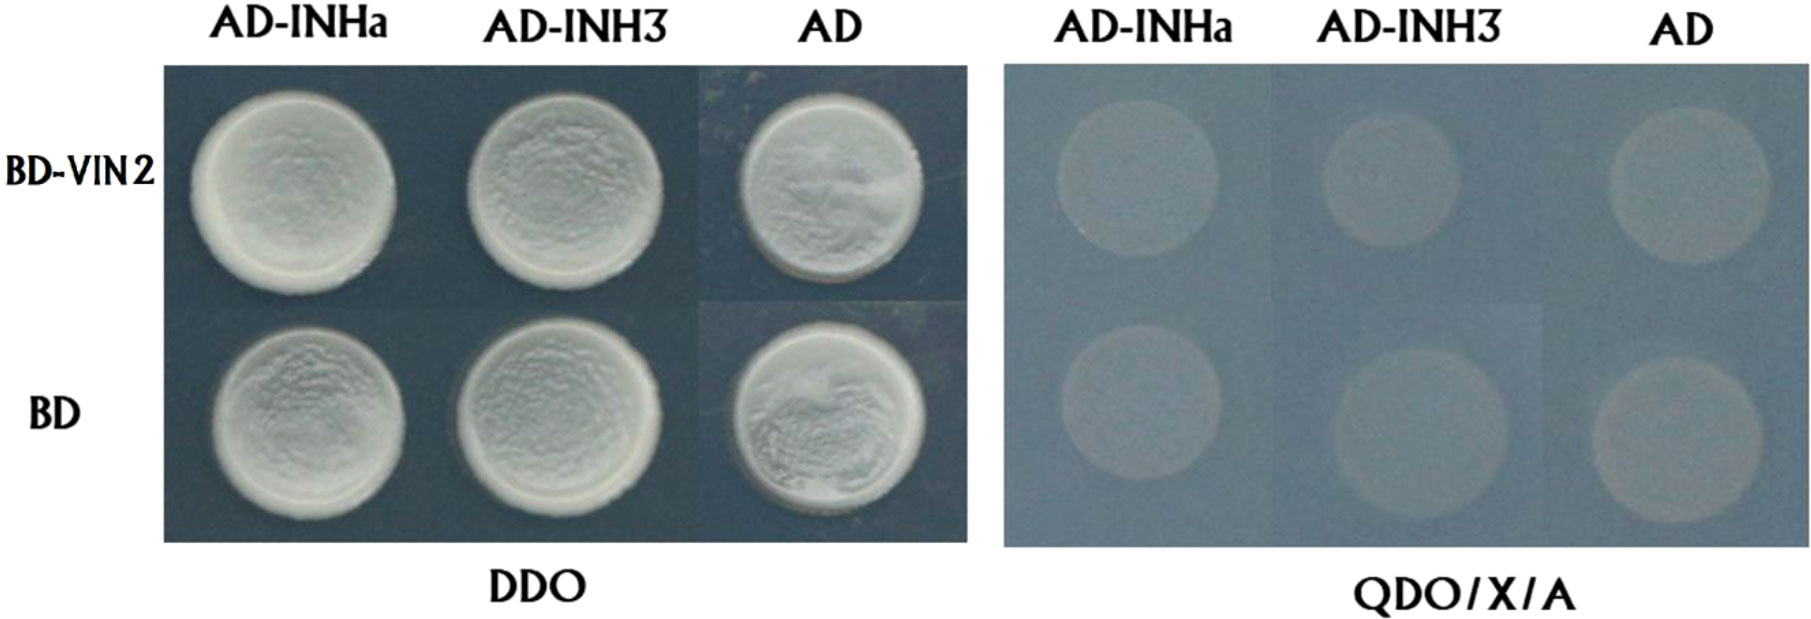
Figure 5 Investigation of interaction between PpVIN2 and either PpINHa or PpINH3 and using Y2H. PpVIN2 was used as bait, while PpINHa and PpINH3 were used as prey. Empty-BD and empty-AD were co-transformed as negative controls. DDO and QDO/X/A represent SD/-Leu/-Trp, SD/-Leu/-Trp/-His/-Ade/X-α-gal/AbA, respectively.
3.5 PpINHa and PpINH3 had an impact on transcription of genes related to fruit sugar metabolism and transport
To uncover the mechanism by which PpINHs regulate fruit sugar accumulation, we investigated their impact on the expression of the above mentioned DEGs associated with sugar metabolism and transport, including PpSPS1/2, PpSuSy1/2, PpTST1 and PpERD6-Like1/2, in peach fruits transiently overexpressing PpINHs as indicated Figure 3. Interestingly, transient overexpression of both PpINHa and PpINH3 caused a significant change in the expression of PpSPS2 and PpERD6-Like2 (Figure 6). The expression levels of PpERD6-Like2, PpSPS1, PpSPS2 and PpSuSy1 were significantly higher in fleshy tissues infiltrated with PpINH3 than those in fleshy tissues infiltrated with the empty vector (CK). By contrast, the expression levels of PpERD6-Like2 and PpSPS2 were significantly lower in fleshy tissues infiltrated with PpINHa than those in fleshy tissues infiltrated with the empty vector. Notably, PpSuSy2 showed no expression in all tested fruits. Altogether, these results suggested that PpINHs regulated sugar accumulation through affecting the expression of sugar metabolism and transporter genes.
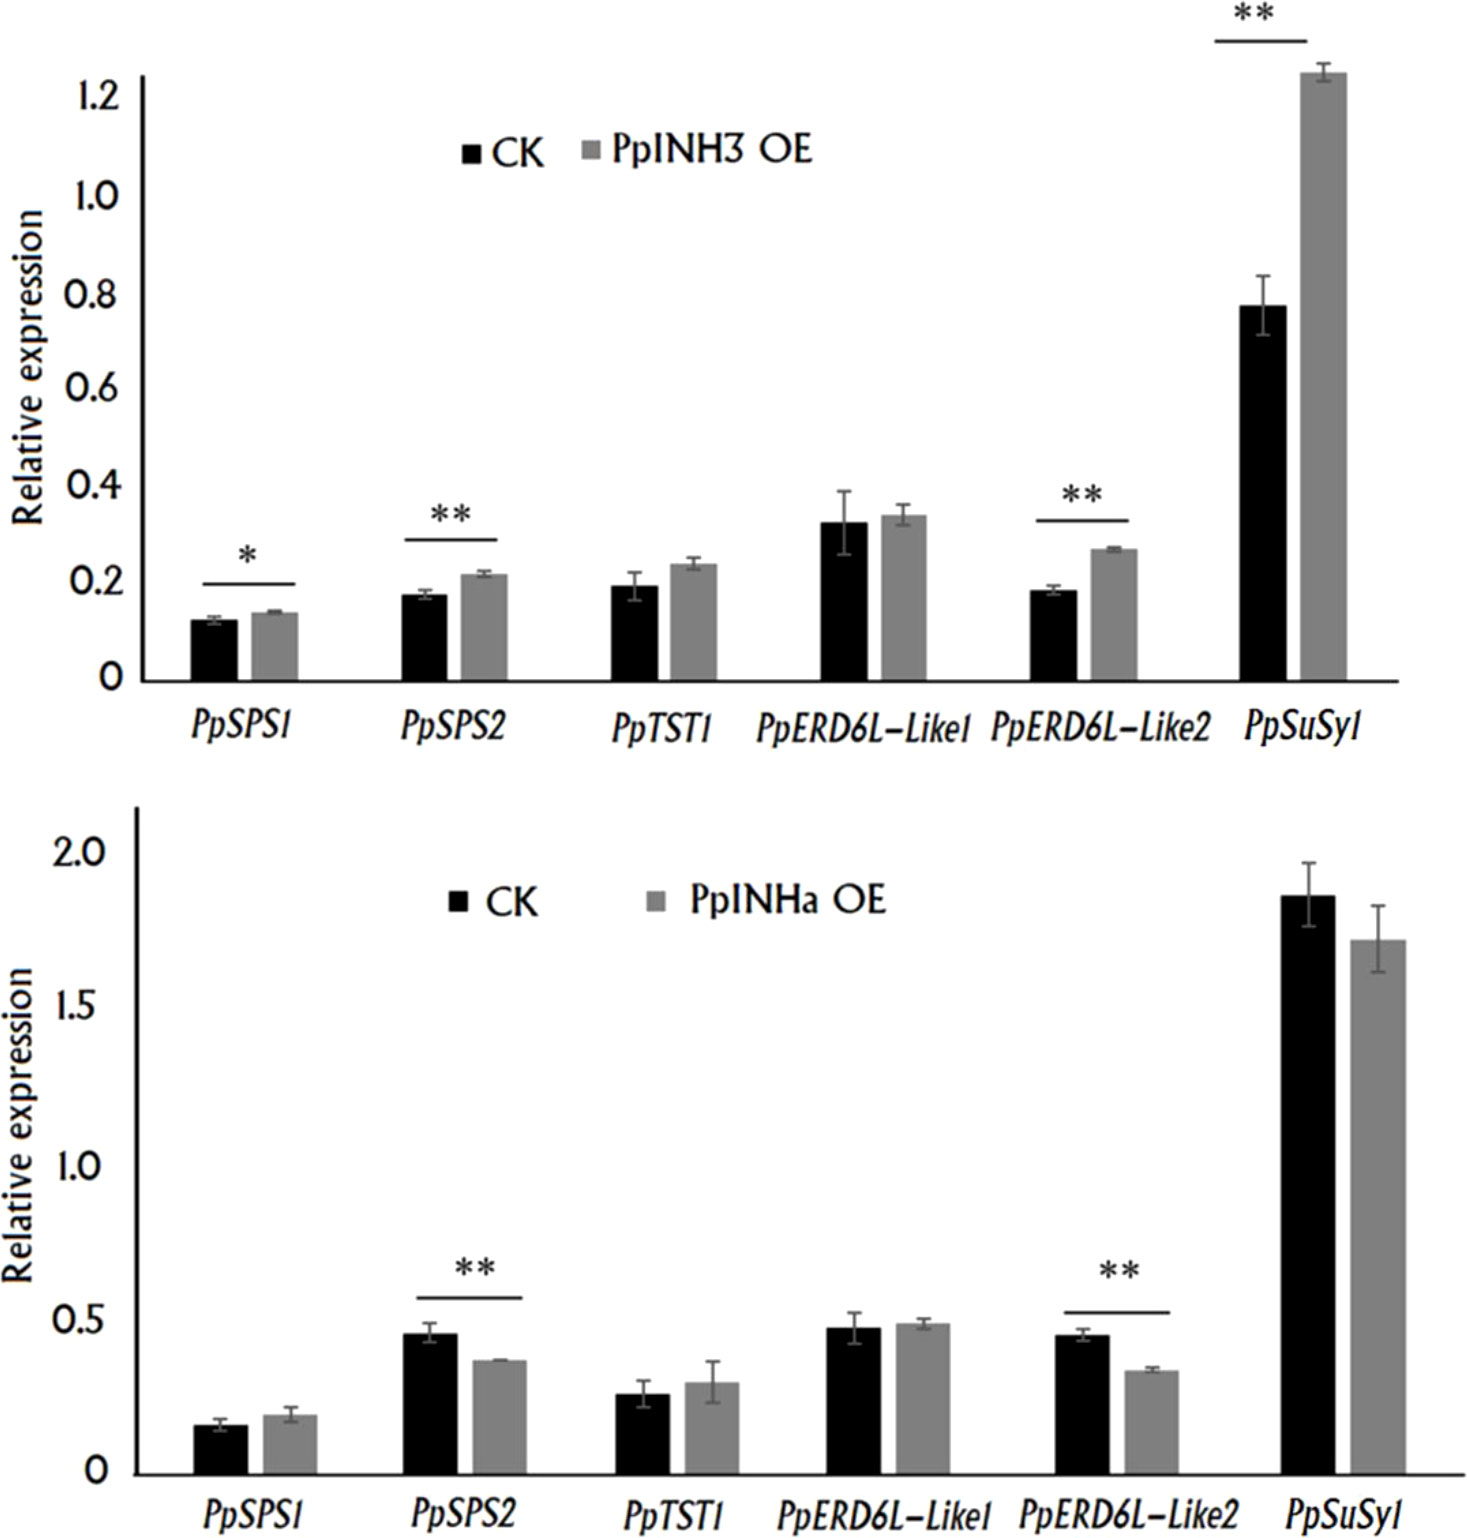
Figure 6 Expression of sugar accumulation-related genes in the fleshy tissue surrounding the sites infiltrated with PpINH3, PpINHa or the empty vector pSAK277. ** and * indicate statistical significance at P < 0.01 and P < 0.05, respectively, based on Student’s t-test.
3.6 Functional validation of sugar metabolism and transporter genes via transient transformation assay in peach fruits
As mentioned above, sucrose is the predominant sugar in peach fruits and the PpSPS genes showed a significant correlation between their expression and either total sugar content or sucrose content. Therefore, PpSPS1 was selected to validate its role in sugar accumulation through transient overexpression in the ripening fruits of peach. Five days after transformation, the expression level of PpSPS1 in the fleshy tissues infiltrated with PpSPS1 was approximately 104.2 higher than that in the flesh tissues infiltrated with empty vector (Figure 7A). The sucrose and total sugar contents in the flesh tissues infiltrated with PpSPS1 showed 1.32- and 1.25-fold increase, respectively, compared to the empty vector. However, no significant difference in the glucose and fructose content was detected between the flesh tissues infiltrated with PpSPS1 and empty vector.

Figure 7 Functional analysis of sugar metabolism and transporter genes via transient overexpression in peach fruits at the ripening stage. (A), Expression of PpSPS1 in the fleshy tissues infiltrated with either PpSPS1 or empty vector (CK) (left), and sugar contents in the fleshy tissues infiltrated with PpSPS1 or empty vector (right). (B), Effect of overexpression of PpERD6-Like1 on sugar accumulation. Left, expression of PpERD6-Like1 and PpTST1 in the fleshy tissues infiltrated with either PpERD6-Like1 or the empty vector. Right, sugar contents in the fleshy tissues infiltrated with PpERD6-Like1 or empty vector. (C), Effect of overexpression of the PpSusy genes on sugar accumulation. Left, Expression of the PpSusy genes in the fleshy tissues infiltrated with either PpSusy or empty vector. Right, sugar contents in the fleshy tissues infiltrated with PpSusy or empty vector. ** and * indicate statistical significance at P < 0.01 and P < 0.05, respectively, based on Student’s t-test.
Since the PpERD6-Like genes are homologs of a previously reported MdERDL6-1 (Zhu et al., 2021), PpERD6-Like1 was selected to validate its impact on transcription of PpTST1 and sugar accumulation through transient overexpression in the ripening fruits of peach. Five days after transformation, the expression levels of both PpERD6-Like1 and PpTST1 in the fleshy tissues infiltrated with PpERD6-Like1 were significantly higher than in the flesh tissues infiltrated with empty vector (Figure 7B). Sugar content in the flesh tissues infiltrated with PpERD6-Like1 showed a significant increase than that in the flesh tissues infiltrated with empty vector.
As mentioned above, the putative roles of PpSuSy1 and PpSuSy2 were different. Thus, the two PpSuSy genes were both subjected to functional validation using transient overexpression assay in the ripening fruits of peach. Overexpression of PpSuSy1 resulted in a significant increase in sucrose accumulation and a slight but not significant increase in total sugar content (Figure 7C). By contrast, overexpression of PpSuSy2 resulted in a significant decrease in sucrose accumulation and a slight but not significant decrease in total sugar content.
4 Discussion
4.1 Dynamic changes of soluble sugars during fruit development in peach
Soluble sugars are the important determining factor of fruit organoleptic quality in peach (Wu et al., 2014). In this study, our results indicated that soluble sugar content was consistently low in cultivated fruits during the early stages of development, but showed a dramatic increase at the ripening stage, in agreement with previous studies (Byrne et al., 1991; Desnoues et al., 2014). Unripe fruit usually accumulates high levels of starch that can serve as a temporary carbohydrate reservoir and is broken into soluble sugars during ripening, contributing to the final sugar levels (Lo Bianco and Rieger, 2002). However, peach fruit contains very low or no starch grains at the early stage of development, and starch accumulation occurs at the late stages of development (Sandhu et al., 1983; Walker et al., 2020). It is unclear whether the low content of soluble sugars during early stages of peach fruit development could be attributed to fruit growth as cell division is a complex process with high energy demands. At the ripening stage, sucrose was rapidly accumulated to become the main sugar component in fruits of three cultivars tested, which is consistent with previous findings that sucrose is the predominant component of soluble sugars in cultivated fruits (Borsani et al., 2009; Zanon et al., 2015; Monti et al., 2016; Vimolmangkang et al., 2016; Aslam et al., 2019). However, sucrose accumulation in fruits of ‘MY’ at the ripening stage showed a slight increase and sucrose only accounted for 29% of total sugars. By contrast, glucose and fructose were both dramatically accumulated to become the major sugar components, accounting for 34% and 37% of total sugars, respectively. Fructose, glucose, and sucrose are known to differ significantly in sweetness, with fructose being the sweetest carbohydrate, followed by sucrose and glucose (Ma et al., 2015). Thus, ‘MY’ could represent a valuable resource for genetic improvement of diversity of fruit organoleptic quality in peach breeding programs.
Unlike cultivated peaches, P. davidiana contained very low sucrose content in fruits throughout development, which is similar to the pattern of sucrose accumulation in a previously reported peach cultivar ‘Algold’ (Brooks et al., 1993). Fructose accumulated during early stages of fruit development, but decreased to trace amount during late stages of fruit development. However, glucose and sorbitol were moderately accumulated during late stages of fruit development, and sorbitol became the predominant sugar component at the ripening stage, accounting for ~ 60% of total sugars. In nectarine cultivars LG and MY, sorbitol was also dramatically accumulated during late stages of fruit development, accounting for 22% and 15% of total sugars, respectively. Sorbitol is reduced-calorie sweetener and has health benefits (Berüter et al., 1997; Fang et al., 2020). Moreover, a recent study shows that sorbitol is associated with fruit taste and shelf life (Liao et al., 2021). Hence, cultivars LG and MY as well as P. davidiana could be valuable resources for genetic improvement of fruit organoleptic quality and shelf life in peach.
4.2 Fruit sugar accumulation is controlled at the levels of biosynthesis and vacuolar storage in peach
As mentioned above, sucrose is the predominant sugar in peach fruits. SPS along with the assistance of sucrose-phosphate phosphatase (SPP) irreversibly catalyzes the formation of sucrose from glucose and fructose, while SuSy reversibly catalyzes the conversion of sucrose into glucose and fructose (Dai et al., 2013). In this study, PpSuSy1 showed a positive correlation between its expression and either sucrose content or total sugar content, respectively, while the expression of PpSuSy2 had a negative correlation with sucrose content and total sugar content. Transient transformation assay showed that PpSuSy1 and PpSuSy2 had a positive or negative role in sucrose accumulation, respectively. These results suggest that PpSuSy1 is responsible for sucrose synthesis, while PpSuSy2 catalyzes sucrose cleavage. Additionally, previous studies have reported a QTL on Chr7 controlling fruit sucrose content, termed qSUC.SP-G7.2 (Quilot et al., 2004) or qSUC.SZ-LG7.1_S (Desnoues et al., 2016), which is closely linked to a SSR marker pchcms2 with chromosomal position of from 18,688,514 bp to 18,688,697 bp (Vilanova et al., 2003). The physical position of PpSuSy1 spans from 18,350,215 bp to 18,356,360 bp. Thus, PpSuSy1 is physically close to the pchcms2 marker, suggesting that it is a good candidate for qSUC.SP-G7.2. It is worth of noting that PpSuSy2 was weakly expressed in cultivated fruits at the ripening stage, but showed high expression in the wild fruits of P. davidiana. This may partially contribute to the difference in sugar accumulation between cultivated and wild fruits in peach. Further studies are needed to address whether PpSuSy2 is involved in fruit sweetness selection during the domestication of peach.
Besides the SuSy genes, two SPS genes, PpSPS1 and PpSPS2, both showed a significantly positive correlation between their expression and sugar content. A molecular marker ‘SPS’ on Chr1 has been identified to be associated with fruit flavor in peach (Ogundiwin et al., 2009). The ‘SPS’ maker is located in the genomic region of PpSPS2 that spans from 40,288,490 bp to 40,295,210 bp. This QTL has been confirmed by recent studies (Li et al., 2021; da Silva Linge et al., 2021). Likewise, PpSPS1 is located on Chr1 and its genomic region spans from 12,702,147 bp to 12,709,383 bp. The physical location of PpSPS1 is overlapped with a previously reported QTL for fruit sugar content (Quarta et al., 2000; Quilot et al., 2004; Desnoues et al., 2016). Moreover, transient overexpression of PpSPS1 in the ripening fruits of peach could enhance total sugar content. These results suggest that PpSPS1 and PpSPS2 are both strong candidate genes controlling fruit sugar accumulation in peach. Altogether, these results indicate that sucrose biosynthesis is a rate-limiting step for sugar accumulation in peach fruits.
In this study, PpTST1 was differentially expressed between cultivated and wild fruits and its expression showed an increase during late stages of fruit development. Expression profile of PpTST1 was in accordance with the pattern of sucrose and total sugar accumulation. These results suggest the role of PpTST1 in regulating fruit sugar accumulation, which is consistent with previous reports that PpTST1 is a strong candidate for QTL at the D locus controlling fruit sugar content (Peng et al., 2020; Yu et al., 2021). Moreover, transcription of PpTST1 could be activated by PpERD6-Like1 and transient overexpression of PpERD6-Like1 could induce sugar accumulation in peach fruit. Thus, the role of PpERD6-Like1 in sugar accumulation is different from that of previously reported PpERDL16 that is involved in the regulation of fructose content (Yu et al., 2021). A major QTL for soluble solids content (SSC) designated qSSC.JF-ch4.1 has been identified on Chr4 in peach (Dirlewanger et al., 1999; Etienne et al., 2002; Quilot et al., 2004; Zeballos et al., 2016). The qSSC.JF-ch4.1 is located at the top of Chr4 and its closely linked SSR marker ssrPaCITA6 corresponds to the DNA fragment ranging from 2,412,721 bp to 2,412,941 bp (Dirlewanger et al., 1999). The qSSC.JF-ch4.1 is overlapped with a QTL for total sugar content that is closely linked to a RFLP marker CC129 (Quilot et al., 2004). The CC129 maker is flanked by two SNP markers SNP_IGA_382420 and SNP_IGA_382502, which have physical positions of 2,701,425 and 2,711,365 bp, respectively. The physical position of PpERD6-Like1 spans from 2,015,166 bp to 2,019,155 bp. Given that PpERD6-Like1 is physically close to qSSC.JF-ch4.1, it is reasonable to speculate that PpERD6-Like1 is a good candidate for fruit sugar accumulation in peach. Altogether, these results suggest that fruit sugar accumulation is controlled at the levels of biosynthesis and vacuolar storage in peach.
4.3 PpINHs may play an important role in regulating fruit sucrose accumulation in peach
Vacuolar invertase responsible for sucrose cleavage in the vacuole plays an important role in the regulation of sucrose movement, storage and utilization. Here, our results showed that overexpression of PpVIN2 caused a significant decrease in sucrose and total sugar contents, suggesting that PpVIN2 plays a negative role in the regulation of fruit sugar accumulation. This finding is consistent with a recent report that sucrose accumulation in ripe fruit of strawberry is concomitant with the significant decrease in the expression of vacuolar invertase gene FvVIN2 (Del Olmo et al., 2020). The activity of invertase is well known to be controlled posttranslationally through interaction with inhibitor proteins to form an inactive complex (Hothorn et al., 2004). As expected, the expression of PpINH3 was significantly positively correlated with sugar contents. However, PpINHa showed a significantly negative correlation between its expression and sugar content. The opposite roles of PpINH3 and PpINHa were confirmed by their transient overexpression in peach fruits. Surprisingly, the Y2H assay indicated that neither PpINH3 nor PpINHa physically interacted with PpVIN2. Thus, it is unlikely that PpINHa and PpINH3 regulate sugar accumulation via modifying PpVINs at the posttranslational level, in accordance with the fact that the sucrose-cleaving reaction is inactive in the vacuole of sink cells of ripe peach fruit due to the extremely low expression of PpVINs (Vimolmangkang et al., 2016). Notably, a vacuolar invertase inhibitor gene PpINH1 has been reported to maintain sucrose levels through inhibiting the PpVIN2 activity in peach fruit after harvest (Wang et al., 2020). Therefore, it seems that the peach VIN gene family is not functionally conserved.
Transient overexpression of PpINHa and PpINH3 both affected the expression of PpERD6-Like2 and PpSPS2 in peach fruits. The activation of PpERD6-Like2 could drive the efflux of glucose from the vacuolar into the cytosol (Zhu et al., 2021), and the increased hexose accumulation may trigger the expression of PpSPS2, resulting in the synthesis of sucrose and its subsequent transport to the vacuolar. Interestingly, the expression levels of PpINH3 in ripe fruits were higher in high-sucrose cultivars XC and XH than in low-sucrose cultivars LG and MY as well as the wild relative ST, but the opposite trend was observed for PpINHa (Table S3). These results suggest an important role of PpINHa and PpINH3 in the regulation of sugar content and composition. The predominant accumulation of sucrose in ripen fruits of cultivated peaches may be partially due to high PpINH3 expression along with low PpINHa expression, whereas, the decreased PpINH3 expression and the increased PpINHa expression are the most likely reason for the relatively low levels of sucrose in ripe fruits of ‘MY’ and ‘LG’. Based on the above results, we propose a model of fruit sugar accumulation in peach (Figure 8). However, further research is needed to address how PpINHs regulate the transcription of sugar metabolism and transporter genes, and thus affecting sugar accumulation.
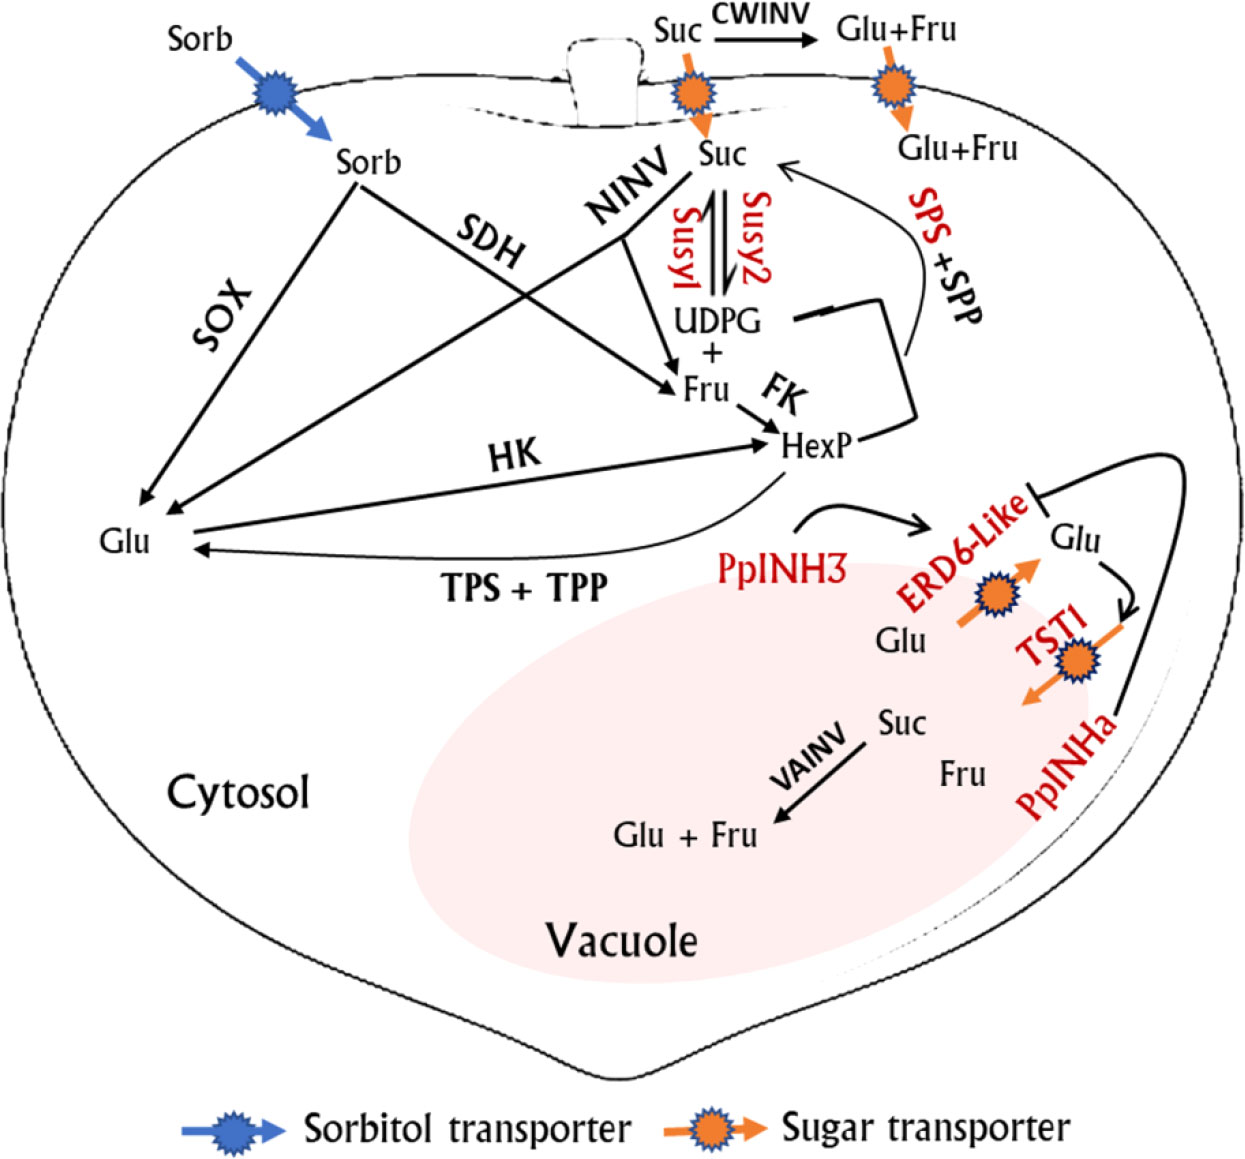
Figure 8 A proposed model for sugar metabolism in peach fruit. Genes whose expression levels were significantly correlated with fruit sugar content are highlighted in red color. Red streamline indicates activation. Suc, sucrose; Sorb, Sorbitol; Glu, Glucose; Fru, Fructose; UDPG, uridine diphosphate glucose; TPP, Trehalose phosphate phosphatase; TPS, trehalose phosphate synthase; and HexP, hexose phosphate.
Data availability statement
The original contributions presented in the study are publicly available. This data can be found here: NCBI, PRJNA626460 and PRJNA787711.
Author contributions
LW and YH planned and designed the experiments. LZ collected experimental materials. MM, XZ, XJ, QY, YC SC and LW performed data analysis. MM, XZ, EN and QP performed the experiments. MM, LW and YH wrote the manuscript. YH revised the manuscript. All authors contributed to the article and approved the submitted version.
Funding
This work was supported by grants from the National Natural Science Foundation of China (Grant Nos. 31872087 and 32272687), the National Key Research and Development Program (2019YFD1000200), the China Agriculture Research System (grant no. CARS-30), and Hubei Hongshan Laboratory (2021hszd017).
Conflict of interest
The authors declare that the research was conducted in the absence of any commercial or financial relationships that could be construed as a potential conflict of interest.
Publisher’s note
All claims expressed in this article are solely those of the authors and do not necessarily represent those of their affiliated organizations, or those of the publisher, the editors and the reviewers. Any product that may be evaluated in this article, or claim that may be made by its manufacturer, is not guaranteed or endorsed by the publisher.
Supplementary material
The Supplementary Material for this article can be found online at: https://www.frontiersin.org/articles/10.3389/fpls.2022.1033805/full#supplementary-material
References
Aslam, M. M., Deng, L., Wang, X., Wang, Y., Pan, L., Liu, H., et al. (2019). Expression patterns of genes involved in sugar metabolism and accumulation during peach fruit development and ripening. Sci. Hortic. 257, 108633. doi: 10.1016/j.scienta.2019.108633
Berüter, J., Feusi, M. E. S., Ruedi, P. (1997). Sorbitol and sucrose partitioning in the growing apple fruit. J. Plant Physiol. 151, 269–276. doi: 10.1016/S0176-1617(97)80252-0
Borsani, J., Budde, C. O., Porrini, L., Lauxmann, M. A., Lombardo, V. A., Murray, R., et al. (2009). Carbon metabolism of peach fruit after harvest: changes in enzymes involved in organic acid and sugar level modifications. J. Exp. Bot. 60, 1823–1837. doi: 10.1093/jxb/erp055
Brooks, S. J., Moore, J. N., Murphy, J. B. (1993). Quantitative and qualitative changes in sugar content of peach genotypes [Prunus persica (L.) batsch.]. J. Am. Soc. Hortic. Sci. 118, 97–100. doi: 10.21273/JASHS.118.1.97
Byrne, D. H., Nikolic, A. N., Burns, E. E. (1991). Variability in sugars, acids, firmness, and color characteristics of 12 peach genotypes. J. Am. Soc. Hortic. Sci. 116, 1004–1006. doi: 10.21273/JASHS.116.6.1004
Cheng, J. T., Wen, S. Y., Xiao, S., Lu, B. Y., Ma, M. R., Bie, Z. L. (2018). Overexpression of the tonoplast sugar transporter CmTST2 in melon fruit increases sugar accumulation. J. Exp. Bot. 69, 511–523. doi: 10.1093/jxb/erx440
Cirilli, M., Bassi, D., Ciacciulli, A. (2016). Sugars in peach fruit: a breeding perspective. Hortic. Res. 3, 15067. doi: 10.1038/hortres.2015.67
Colaric, M., Veberic, R., Stampar, F., Hudina, M. (2005). Evaluation of peach and nectarine fruit quality and correlations between sensory and chemical attributes. J. Sci. Food Agric. 85, 2611–2616. doi: 10.1002/jsfa.2316
Dai, Z. W., Léon, C., Feil, R., Lunn, J. E., Delrot, S., Gomès, E. (2013). Metabolic profiling reveals coordinated switches in primary carbohydrate metabolism in grape berry (Vitis vinifera l.), a non-climacteric fleshy fruit. J. Exp. Bot. 64, 1345–1355. doi: 10.1093/jxb/ers396
da Silva Linge, C., Cai, L., Fu, W., Clark, J., Worthington, M., Rawandoozi, Z., et al. (2021). Multi-locus genome-wide association studies reveal fruit quality hotspots in peach genome. Front. Plant Sci. 12, 644799. doi: 10.3389/fpls.2021.644799
Del Olmo, I., Blanch, M., Romero, I., Vazquez-Hernandez, M., Sanchez-Ballesta, M. T., Escribano, M. I., et al. (2020). Involvement of oligosaccharides and sucrose-related genes on sucrose retention in strawberries from ripening to shelf-life. Postharvest Biol. Technol. 169, 111301. doi: 10.1016/j.postharvbio.2020.111301
Desnoues, E., Baldazzi, V., Génard, M., Mauroux, J. B., Lambert, P., Confolent, C., et al. (2016). Dynamic QTLs for sugars and enzyme activities provide an overview of genetic control of sugar metabolism during peach fruit development. J. Exp. Bot. 67, 3419–3431. doi: 10.1093/jxb/erw169
Desnoues, E., Gibon, Y., Baldazzi, V., Signoret, V., Génard, M., Quilot-Turion, B. (2014). Profiling sugar metabolism during fruit development in a peach progeny with different fructose-to-glucose ratios. BMC Plant Biol. 14, 336. doi: 10.1186/s12870-014-0336-x
Dirlewanger, E., Graziano, E., Joobeur, T., Garriga-Calderé, F., Cosson, P., Howad, W., et al. (2004). Comparative mapping and marker-assisted selection in Rosaceae fruit crops. Proc. Natl. Acad. Sci. U.S.A. 101, 9891–9896. doi: 10.1073/pnas.0307937101
Dirlewanger, E., Moing, A., Rothan, C., Svanella, L., Pronier, V., Guye, A., et al. (1999). Mapping QTLs controlling fruit quality in peach (Prunus persica (L.) batsch). Theor. Appl. Genet. 98, 18–31. doi: 10.1007/s001220051035
Eom, J. S., Chen, L. Q., Sosso, D., Julius, B. T., Lin, I. W., Qu, X. Q., et al. (2015). SWEETs, transporters for intracellular and intercellular sugar translocation. Curr. Opin. Plant Biol. 25, 53–62. doi: 10.1016/j.pbi.2015.04.005
Etienne, C., Rothan, C., Moing, A., Plomion, C., Bodénès, C., Svanella-Dumas, L., et al. (2002). Candidate genes and QTLs for sugar and organic acid content in peach [Prunus persica (L.) batsch]. Theor. Appl. Genet. 105, 145–159. doi: 10.1007/s00122-001-0841-9
Fang, T., Cai, Y., Yang, Q., Ogutu, C. O., Liao, L., Han, Y. (2020). Analysis of sorbitol content variation in wild and cultivated apples. J. Sci. Food Agric. 100, 139–144. doi: 10.1002/jsfa.10005
Font I Forcada, C., Guajardo, V., Chin-Wo, S. R., Moreno, MÁ (2018). Association mapping analysis for fruit quality traits in Prunus persica using SNP markers. Front. Plant Sci. 9, 2005. doi: 10.3389/fpls.2018.02005
Hothorn, M., Wolf, S., Aloy, P., Greiner, S., Scheffzek, K. (2004). Structural insights into the target specificity of plant invertase and pectin methylesterase inhibitory proteins. Plant Cell 16, 3437–3447. doi: 10.1105/tpc.104.025684
Illa, E., Eduardo, I., Audergon, J. M., Barale, F., Dirlewanger, E., Li, X. W., et al. (2011). Saturating the Prunus (stone fruits) genome with candidate genes for fruit quality. Mol. Breed. 28, 667–682. doi: 10.1007/s11032-010-9518-x
Jung, B., Ludewig, F., Schulz, A., Meißner, G., Wöstefeld, N., Flügge, U., et al. (2015). Identification of the transporter responsible for sucrose accumulation in sugar beet taproots. Nat. Plants 1, 14001. doi: 10.1038/nplants.2014.1
Kanayama, Y., Kogawa, M., Yamaguchi, M., Kanahama, K. (2005). Fructose content and the activity of fructose-related enzymes in the fruit of eating-quality peach cultivars and native-type peach cultivars. J. Jpn Soc. Hortic. Sci. 74, 431–436. doi: 10.2503/jjshs.74.431
Kim, D., Langmead, B., Salzberg, S. L. (2015). HISAT: A fast spliced aligner with low memory requirements. Nat. Methods 12, 357–360. doi: 10.1038/nmeth.3317
Langmead, B., Trapnell, C., Pop, M., Salzberg, S. L. (2009). Ultrafast and memory-efficient alignment of short DNA sequences to the human genome. Genome Biol. 10, R25. doi: 10.1186/gb-2009-10-3-r25
Liao, L., Zhang, W., Zhang, B., Fang, T., Wang, X. F., Cai, Y., et al. (2021). Unraveling a genetic roadmap for improved taste in the domesticated apple. Mol. Plant 9, 1454–1471. doi: 10.1016/j.molp.2021.05.018
Li, Y., Cao, K., Li, N., Zhu, G., Fang, W., Chen, C., et al. (2021). Genomic analyses provide insights into peach local adaptation and responses to climate change. Genome Res. 31 (4), 592–606. doi: 10.1101/gr.261032.120
Livak, K. J., Schmittgen, T. D. (2001). Analysis of relative gene expression data using real-time quantitative PCR and the 2-ΔΔCT method. Methods 25, 402–408. doi: 10.1006/meth.2001.1262
Lo Bianco, R., Rieger, M. (2002). Partitioning of sorbitol and sucrose catabolism within peach fruit. J. Am. Soc. Hortic. Sci. 127, 115–121. doi: 10.21273/JASHS.127.1.115
Lombardo, V. A., Osorio, S., Borsani, J., Lauxmann, M. A., Bustamante, C. A., Budde, C. O., et al. (2011). Metabolic profiling during peach fruit development and ripening reveals the metabolic networks that underpin each developmental stage. Plant Physiol. 157, 1696–1710. doi: 10.1104/pp.111.186064
Love, M. I., Huber, W., Anders, S. (2014). Moderated estimation of fold change and dispersion for RNA-seq data with DESeq2. Genome Biol. 15, 1–21. doi: 10.1186/s13059-014-0550-8
Ma, B., Chen, J., Zheng, H., Fang, T., Ogutu, C., Li, S., et al. (2015). Comparative assessment of sugar and malic acid composition in cultivated and wild apples. Food Chem. 172, 86–91. doi: 10.1016/j.foodchem.2014.09.032
Maere, S., Heymans, K., Kuiper, M. (2005). BiNGO: a cytoscape plugin to assess overrepresentation of gene ontology categories in biological networks. Bioinformatics 21, 3448–3449. doi: 10.1093/bioinformatics/bti551
Ma, Q. J., Sun, M. H., Lu, J., Liu, Y. J., Hu, D. G., Hao, Y. J. (2017). Transcription factor AREB2 is involved in soluble sugar accumulation by activating sugar transporter and amylase genes. Plant Physiol. 174, 2348–2362. doi: 10.1104/pp.17.00502
Monti, L. L., Bustamante, C. A., Osorio, S., Gabilondo, J., Borsani, J., Lauxmann, M. A., et al. (2016). Metabolic profiling of a range of peach fruit varieties reveals high metabolic diversity and commonalities and differences during ripening. Food Chem. 190, 879–888. doi: 10.1016/j.foodchem.2015.06.043
Mora, J. R. H., Micheletti, D., Bink, M., Weg, E. V. D., Cantín, C., Nazzicari, N., et al. (2017). Integrated QTL detection for key breeding traits in multiple peach progenies. BMC Genomics 18, 404. doi: 10.1186/s12864-017-3783-6
Ogundiwin, E. A., Peace, C. P., Gradziel, T. M., Parfitt, D. E., Bliss, F. A., Crisosto, C. H. (2009). A fruit quality gene map of Prunus. BMC Genomics 10, 587. doi: 10.1186/1471-2164-10-587
Peng, Q., Wang, L., Ogutu, C., Liu, J., Liu, L., Mollah, M. D. A., et al. (2020). Functional analysis reveals the regulatory role of PpTST1 encoding tonoplast sugar transporter in sugar accumulation of peach fruit. Int. J. Mol. Sci. 21, E1112. doi: 10.3390/ijms21031112
Quarta, R., Dettori, M. T., Sartori, A., Verde, I. (2000). Genetic linkage map and QTL analysis in peach. Acta Hortic. 521, 233–242. doi: 10.17660/ActaHortic.2000.521.26
Quilot, B., Kervella, J., Génard, M., Lescourret, F. (2005). Analysing the genetic control of peach fruit quality through an ecophysiological model combined with a QTL approach. J. Exp. Bot. 56, 3083–3092. doi: 10.1093/jxb/eri305
Quilot, B., Wu, B. H., Kervella, J., Génard, M., Foulongne, M., Moreau, K. (2004). QTL analysis of quality traits in an advanced backcross between Prunus persica cultivars and the wild relative species P. davidiana. Theor. Appl. Genet. 109, 884–897. doi: 10.1007/s00122-004-1703-z
Ren, Y., Guo, S. G., Zhang, J., He, H. J., Sun, H. H., Tian, S. W., et al. (2018). A tonoplast sugar transporter underlies a sugar accumulation QTL in watermelon. Plant Physiol. 176, 836–850. doi: 10.1104/pp.17.01290
Robinson, M. D., McCarthy, D. J., Smyth, G. K. (2010). edgeR: a bioconductor package for differential expression analysis of digital gene expression data. Bioinformatics 26, 139–140. doi: 10.1093/bioinformatics/btp616
Salazar, J. A., Ruiz, D., Campoy, J. A., Sánchez-Pérez, R., Crisosto, C. H., Martínez-García, P. J., et al. (2014). Quantitative trait loci (QTL) and mendelian trait loci (MTL) analysis in Prunus: a breeding perspective and beyond. Plant Mol. Biol. Rep. 32, 1–18. doi: 10.1007/s11105-013-0643-7
Sandhu, S. S., Dhillon, B. S., Singh, S. (1983). Starch and total water-soluble carbohydrates in the developing fruits of early- and late-maturing peach cultivars. J. Hortic. Sci. 58, 203–207. doi: 10.1080/00221589.1983.11515111
Shannon, P., Markiel, A., Ozier, O., Baliga, N. S., Wang, J. T., Ramage, D., et al. (2003). Cytoscape: a software environment for integrated models of biomolecular interaction networks. Genome Res. 13, 2498–2504. doi: 10.1101/gr.1239303
Verde, I., Abbott, A. G., Scalabrin, S., Jung, S., Shu, S., Marroni, F., et al. (2013). The high-quality draft genome of peach (Prunus persica) identifies unique patterns of genetic diversity, domestication and genome evolution. Nat. Genet. 45, 487–494. doi: 10.1038/ng.2586
Vilanova, S., Romero, C., Abbott, A. G., Llácer, G., Badenes, M. L. (2003). An apricot (Prunus armeniaca l.) F2 progeny linkage map based on SSR and AFLP markers, mapping plum pox virus resistance and self-incompatibility traits. Theor. Appl. Genet. 107, 239–247. doi: 10.1007/s00122-003-1243-y
Vimolmangkang, S., Zheng, H., Peng, Q., Jiang, Q., Wang, H., Fang, T., et al. (2016). Assessment of sugar components and genes involved in the regulation of sucrose accumulation in peach fruit. J. Agric. Food Chem. 64, 6723–6729. doi: 10.1021/acs.jafc.6b02159
Walker, R. P., Battistelli, A., Bonghi, C., Drincovich, M. F., Falchi, R., Lara, M. V., et al. (2020). Non-structural carbohydrate metabolism in the flesh of stone fruits of the genus Prunus (Rosaceae) - a review. Front. Plant Sci. 11, 549921. doi: 10.3389/fpls.2020.549921
Wang, X., Chen, Y., Jiang, S., Xu, F., Wang, H., Wei, Y., et al. (2020). PpINH1, an invertase inhibitor, interacts with vacuolar invertase PpVIN2 in regulating the chilling tolerance of peach fruit. Hortic. Res. 7, 168. doi: 10.1038/s41438-020-00389-8
Wang, W., Zhou, H., Ma, B., Owiti, A., Korban, S. S., Han, Y. (2016). Divergent evolutionary pattern of sugar transporter genes is associated with the difference in sugar accumulation between grasses and eudicots. Sci. Rep. 6, 29153. doi: 10.1038/srep29153
Wu, J., Xu, Z., Zhang, Y., Chai, L., Yi, H., Deng, X. (2014). An integrative analysis of the transcriptome and proteome of the pulp of a spontaneous late-ripening sweet orange mutant and its wild type improves our understanding of fruit ripening in citrus. J. Exp. Bot. 65, 1651–1671. doi: 10.1093/jxb/eru044
Yu, Y., Guan, J., Xu, Y., Ren, F., Zhang, Z., Yan, J., et al. (2021). Population-scale peach genome analyses unravel selection patterns and biochemical basis underlying fruit flavor. Nat. Commun. 12, 3604. doi: 10.1038/s41467-021-23879-2
Zanon, L., Falchi, R., Santi, S., Vizzotto, G. (2015). Sucrose transport and phloem unloading in peach fruit: potential role of two transporters localized in different cell types. Physiol. Plant 154, 179–193. doi: 10.1111/ppl.12304
Zeballos, J. L., Abidi, W., Giménez, R., Monforte, A. J., Moreno, M. Á., Gogorcena, Y. (2016). Mapping QTLs associated with fruit quality traits in peach [Prunus persica (L.) batsch] using SNP maps. Tree Genet. Genomes 12, 37. doi: 10.1007/s11295-016-0996-9
Zheng, B., Zhao, L., Jiang, X., Cherono, S., Liu, J., Ogutu, C., et al. (2021). Assessment of organic acid accumulation and its related genes in peach. Food Chem. 334, 127567. doi: 10.1016/j.foodchem.2020.127567
Keywords: Prunus persica, soluble sugars, sugar transporter, invertase inhibitor, sucrose phosphate synthase
Citation: Mollah MDA, Zhang X, Zhao L, Jiang X, Ogutu CO, Peng Q, Belal MAA, Yang Q, Cai Y, Nishawy E, Cherono S, Wang L and Han Y (2022) Two vacuolar invertase inhibitors PpINHa and PpINH3 display opposite effects on fruit sugar accumulation in peach. Front. Plant Sci. 13:1033805. doi: 10.3389/fpls.2022.1033805
Received: 31 August 2022; Accepted: 01 December 2022;
Published: 14 December 2022.
Edited by:
Ahmad M. Alqudah, Qatar University, QatarReviewed by:
Carlos Gaete-Eastman, University of Talca, ChileSchuyler Korban, University of Illinois at Urbana–Champaign, United States
Copyright © 2022 Mollah, Zhang, Zhao, Jiang, Ogutu, Peng, Belal, Yang, Cai, Nishawy, Cherono, Wang and Han. This is an open-access article distributed under the terms of the Creative Commons Attribution License (CC BY). The use, distribution or reproduction in other forums is permitted, provided the original author(s) and the copyright owner(s) are credited and that the original publication in this journal is cited, in accordance with accepted academic practice. No use, distribution or reproduction is permitted which does not comply with these terms.
*Correspondence: Yuepeng Han, eXBoYW5Ad2JnY2FzLmNu; Lu Wang, d2FuZ2x1QHdiZ2Nhcy5jbg==
†These authors have contributed equally to this work